Simple Summary
The definition of the tumor hypoxia is important in oncology because this characteristic is linked to a poor prognosis. In this context, we compared two hypoxia tracers, FMISO and FAZA, before surgery for lung cancer. Hypoxia tracers correlate well with each other and FMISO is superior to FAZA in defining the hypoxia volume of lung cancers. However, there is no correlation with immunohistochemical findings (GLUT-1, CAIX, LDH-5, and HIF1-Alpha).
Abstract
Hypoxic areas are typically resistant to treatment. However, the fluorine-18-fluoroazomycin-arabinoside (FAZA) and fluorine 18 misonidazole (FMISO) tracers have never been compared in non small cell lung cancer (NSCLC). This study compares the capability of 18F-FAZA PET/CT with that of 18F-FMISO PET/CT for detecting hypoxic tumour regions in early and locally advanced NSCLC patients. We prospectively evaluated patients who underwent preoperative PET scans before surgery for localised NSCLC (i.e., fluorodeoxyglucose (FDG)-PET, FMISO-PET, and FAZA-PET). The PET data of the three tracers were compared with each other and then compared to immunohistochemical analysis (GLUT-1, CAIX, LDH-5, and HIF1-Alpha) after tumour resection. Overall, 19 patients with a mean age of 68.2 ± 8 years were included. There were 18 lesions with significant uptake (i.e., SUVmax >1.4) for the F-MISO and 17 for FAZA. The mean SUVmax was 3 (±1.4) with a mean volume of 25.8 cc (±25.8) for FMISO and 2.2 (±0.7) with a mean volume of 13.06 cc (±13.76) for FAZA. The SUVmax of F-MISO was greater than that of FAZA (p = 0.0003). The SUVmax of F-MISO shows a good correlation with that of FAZA at 0.86 (0.66–0.94). Immunohistochemical results are not correlated to hypoxia PET regardless of the staining. The two tracers show a good correlation with hypoxia, with FMISO being superior to FAZA. FMISO, therefore, remains the reference tracer for defining hypoxic volumes.
1. Introduction
Tumour hypoxia is an important influencing factor of tumour fate. It is associated with a poorer prognosis in those who undergo radiation therapy because hypoxia is a major factor of radioresistance [1,2,3,4]. Reference methods (Eppendorf) are invasive and not suitable for deep tumours, such as lung cancers [5]. Positron emission tomography/computed tomography (PET/CT) has been the most studied non-invasive technique for identifying intratumoural hypoxia. In addition, specific tracers have been developed to define the target hypoxic areas in various cancers, including head and neck cancer and lung cancer. PET using the tracers fluorine-18-misonidazole (FMISO) or fluorine-18-fluoroazomycin-arabinoside (FAZA) can be an alternative to identify intratumoural hypoxia [6]. Another indirect marker of hypoxia is fluorine-18-fluorodeoxyglucose (18F-FDG) uptake in PET [3].
Of the hypoxia tracers described, only FMISO and FAZA have been used fto define hypoxic areas. Both tracers are radiolabeled with flourine-18 with a half-life-time of 110 min and belong to the group of 2-nitroimidazoles. Passing the cell membrane is facilitated by their lipophilicity, after which under hypoxic conditions, these compounds are reversibly reduced to highly reactive oxygen radicals [7]. These oxygen radicals bind to intracellular macromolecules at low pO2 values below 5–10 mmHg, and thus, are trapped inside the hypoxic cells. The basis for the application of FDG PET imaging in oncology is the upregulation of glucose transporters (GLUTs) and glycolytic enzymes. It is important to note that tumour hyperglycolysis is driven by the activation of hypoxia-inducible factor-1 (HIF-1). Accordingly, the degree of FDG uptake by tumours might indirectly reflect the level of hypoxia because HIF1-Alpha expression may be observed in non-hypoxic tissues. A recent article recalls the characteristics of hypoxia tracers [8].
FAZA and FMISO have been shown to identify lung cancer patients with poor prognosis, especially before radiotherapy [9,10]. FAZA is a tracer that can clinically detect hypoxia in both primary tumours and lymph node metastasis [10,11,12]. In addition, both FAZA and FMISO can be used for determining the target volume of radiotherapy [11,12]. However, the capability of these tracers to identify target areas compared to that of FDG remains unclear [13]. Moreover, aside from the high cost, the use of these tracers is limited owing to their low contrasts between the tumour and the healthy tissues and consequently the difficulty to define the best method of thresholding [14]. To our best knowledge, no study has compared FAZA and FMISO in NSCLC [15,16]. Thus, this study aimed to compare the capability of 18F-FAZA PET/CT with that of 18F-FMISO PET/CT for detecting hypoxic tumour regions in early and locally advanced NSCLC patients. We also aimed to evaluate the correlation between PET imaging data and histopathological cell markers.
2. Materials and Methods
2.1. Study Design and Patients
A total of 20 patients with histologically diagnosed NSCLC, eligible for curative surgery (tumour stage ≥T2a without metastasis) were prospectively included (RTEP6; NCT02490696). Each patient underwent both FAZA and FMISO PET before the surgery in no particular order.
2.2. FDG/PET Imaging
PET-CT whole-body images were acquired on a GE710 PET-CT device (General Electric, Milwaukee, USA), 60 min (±5 min) after the injection of approximately 3.5 MBq/kg of FDG. PET and CT acquisition parameters were adapted to the patient’s habitus. For patients with a body mass index (BMI) < 30 kg/m2, the CT voltage was 100 kV, and the PET acquisition time was 2 min per bed position. Otherwise, the CT voltage was 120 kV, and the PET acquisition time was 2.5 min per bed position. The CT mAs was regulated using the manufacturer’s dose reduction software, yielding a mean effective mAs of 89.1 ± 6.7.
2.3. Hypoxia PET Imaging
We injected FAZA or F-MISO at a dose of 4 MBq/kg, and the post-injection delay was 180 ± 10 min. Three bed positions (4 min/bed) were centred on the thorax. CT scan parameters were set to 100 kV and 80 mAs using the manufacturer’s dose reduction software, yielding a mean DLP value of 160.9 ± 44 mGycm.
2.4. Qualitative and Quantitative Analysis
PET/CT images using FDG, FAZA, and FMISO were transferred on a Dosisoft workstation (v1.4, Oncoplanet, DosiSoft, Cachan, France). Then the three volumes were first co-registered with a block-matching rigid registration method focusing on the tumour. The physicians were allowed to manually correct obvious misregistration. For each PET, the maximum standardised uptake value (SUVmax), SUVmean, and volume were evaluated at a threshold of 1.4 and 1.5 * SUVmean mediastinum. This assessed whether the FAZA and FMISO areas were similar in volume and in position, using the overlap fraction (OV = V1∩V2/min(V1, V2)), the Dice index (DI) = (2 × (V1∩V2)/(V1 + V2) and the Jaccard index (JI) = (V1∩V2)/(V1UV2).
2.5. Parametric Imaging Method
For each patient, a cubic volume of interest (VOI) was selected in the area of the primary tumour on the F-MISO (F-MISO/PET) and FAZA images (FAZA/PET) by an experienced physician. FMISO/PET and FAZA/PET datasets were subtracted, yielding a 3D image of the VOI, with the signal in each voxel i is proportional to the difference in SUV: DIFF(i) = (SUV FAZA–SUV FMISO). Then, the voxels of DIFF were classified into four classes according to the voxel values in both the F-MISO/PET and DIFF datasets. Voxels were classified using a stochastic expectation maximisation algorithm, assuming a Gaussian mixture model for the distribution of voxel values. A parametric dataset was created from DIFF by setting the signal in voxels belonging to Cl3 and Cl4 to zero. The voxels belonging to Cl1 (FMISO superior to FAZA) were coded on a green colour scale, and inversely on a red colour scale for Cl2 (FMISO inferior to FAZA). At the end of the process, the parametric image consisted of one or several clusters of voxels, either red (r) or green (g). The cluster volume (Vr or Vg in cm3) was calculated for each cluster.
2.6. Immunohistochemistry Analysis
Resected specimens were entirely formalin-fixed, and samples were mapped. For each tumour, one representative section was immunostained, and for each section, one tumour paraffin-embedded block was chosen for immunohistochemical analysis. Mapping, section and block selection were defined jointly by the same pathologist and nuclear physician for all patients based on PET data. Particular attention was paid to obtain the best correlation between immunohistochemistry and PET from the orientation of the surgical specimen to the section. Slides were immunostained using the following primary antibodies as hypoxia markers: Anti-HIF1-Alpha (1:500; ab8366; Abcam®, Cambridge, UK), anti-GLUT-1 (1:250), anti-CAIX (1:50), and anti-LDH-5 (1:1000). Deparaffinisation, antigen retrieval, and immunostaining were performed using a Benchmark ULTRA® device (Ventana-Roche®; Oro Valley, Arizona, USA). Slides were heated to 72 °C, incubated for 30 min with the antibody, and then rinsed in buffer solution. Primary antibody detection was performed using Ultraview DAB solution (Roche-Ventana®; Oro Valley, Arizona, USA). After rinsing, a drop of haematoxylin solution was applied within 4 min for counter-staining, before rinsing again. Finally, the slides were mounted with a glass coverslip.
2.7. Staining Assessment
Immunostained slides were observed using a dual-headed microscope (Leica DM 2000, Wetzlar, Deutscland) by pathologists who were blinded to the results of the PET analysis. Only malignant cells were scored. HIF1-Alpha, GLUT-1, CAIX, and LDH5 expression was evaluated according to a method described by Allred et al. [17]. This analysis was independently performed by three different pathologists, and the mean score was then used for the subsequent analysis.
3. Statistical Analysis
SUV and immunohistochemical scores were described using mean and SD. SUVmax FMISO and FAZA were compared with a paired t-test and their correlation using the Pearson correlation coefficient. p-values < 0.05 were considered statistically significant (bilateral test). Finally, volume concordance was estimated by computing overlap fraction, DI, and JI. The association between PET endpoints and immunohistochemical scores was explored by computing non-parametric Spearman correlation coefficients. All analyses were performed using MedCalc Statistical Software (MedCalc Software bvba, Ostend, Belgium). An alpha risk level of 5% was retained for each statistical test.
4. Results
4.1. Patient Characteristics
Initially, 23 patients were screened, but two patients could not undergo the two hypoxia PET imaging before the surgery and two had histologies other than NSCLC. The study was closed after the pre-inclusion of the 23 patients. Thus, 19 patients (4 women, 15 men) with a mean age of 68.2 ± 8.2 years were included in the study. The histological subtypes were adenocarcinoma in nine patients and squamous cell carcinoma in 10 patients. One patient had stage IA3 disease; four patients, stage IB; one patient, stage IIA; three patients, stage IIB; seven patients, stage IIIA; and one patient, stage IIIB (TNM 8th edition). The patients’ characteristics are shown in Table 1. The mean interval between the two PET modalities was 2.1 days (±1.6), and between the last PET and the surgery was 3.1 days (±2.8) (Table 1).

Table 1.
Patient characteristics.
4.2. PET Results
For FDG PET, the SUVmax was 12.4 (±5.5), and the volume at a threshold of 40% for SUVmax was 23.2 cc (±19.2). In FMISO PET, 18 of the 19 lesions were considered hypoxic with a SUVmax greater than 1.4. Figure 1 shows the MIP (Maximum intensity projection), axial PET/CT slice and axial PET slice for FMISO, FDG and FAZA, respectively; the MIP is used to represent the tumour-to-background ratio. The mean SUVmax was 3 (±1.4) with a mean volume of 25.8 cc (±25.8) for a threshold at 1.4. The SUVmean mediastinum was 1.31 (±0.13). At a threshold of 1.5* SUVmean mediastinum, 15 lesions were hypoxic with a mean volume of 9.04 cc (±13.54). In FAZA PET, 17 lesions were considered hypoxic at a threshold of 1.4 (same lesions in FMISO PET). The mean SUVmax was 2.2 (±0.7) with a mean volume of 13.06 cc (±13.76). The SUVmean mediastinum was 1.15 (±0.15), and 15 lesions were considered hypoxic at a threshold of 1.5* SUVmean mediastinum for a mean volume of 4.97 cc (±5.53). However, five lesions had a volume <1 cc) (Table 1).
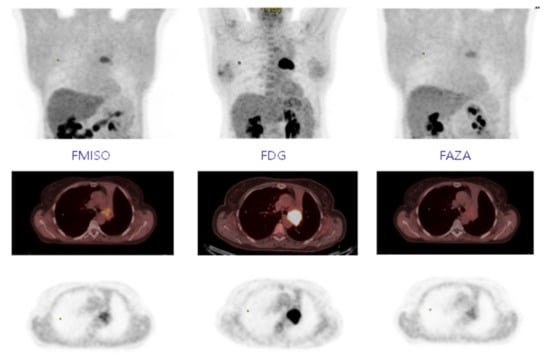
Figure 1.
Fixing FMISO, FDG, and FAZA on MIP, axial PET-CT, and axial PET.
The SUVmax FMISO was greater than SUVmax FAZA (p = 0.0003) (Figure 2a). The ratio between the SUVmax FMISO and FAZA of the lesion was 1.39 (±0.33), and the ratio for the SUVmean mediastinum (FMISO/FAZA) was 1.14 (±0.12). At a threshold of 1.4; the FMISO volume was greater than the FAZA volume (p = 0.004) (Figure 2b), and the ratio of the volume was 6.41 (±13.61). For a threshold at 1.5* SUVmean mediastinum, the ratio was 4.84 (±6.43).
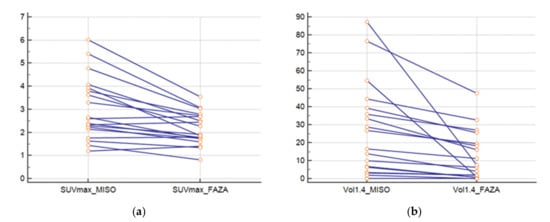
Figure 2.
(a) SUVmax of lesions for FAZA and FMISO and (b) volumes of lesions with FAZA and FMISO (threshold at 1.4).
There was a strong correlation between the SUVmax FMISO and SUVmax FAZA at 0.86 (0.66–0.94) (SUVmax FMISO = −0.5483 + 1.6571 SUVmax FAZA) (Figure 3a) and between the volume at a threshold of 1.4 at 0.63 (0.24–0.84) (FMISO volume = 11.9042 + 1.1869 FAZA volume) (Figure 3b). However, there was no correlation between SUVmax FDG and SUVmax FMISO: 0.32 (−0.16–0.68) and between SUVmax FDG and SUVmax FAZA: 0.44 (−0.02–0.74).
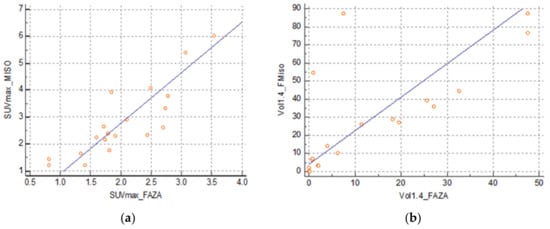
Figure 3.
(a) Correlation between SUVmax FMISO and FAZA and (b) correlation between volumes FMISO and FAZA with a threshold of 1.4.
4.3. Overlap Fraction, Parametric Results, and Immunohistochemistry Results
With respect to overlap fraction, we confirmed a strong correlation of the two tracers with a mean OV at 0.89 (±0.18). The DI and the Jaccard Index were low with, respectively, 0.53 (±0.26) and 0.4 (±0.24).
For the parametric results, the differential volume between FMISO and FAZA was determined for all tumours regardless of tumour uptake (inferior and superior to SUVmax at 1.4). There was a significant difference between the two tracers in 17 lesions. Of these, FMISO was superior to FAZA in 15 lesions with respect to fixation, while FAZA was superior in the other two lesions. The difference, however, was not significant. In five lesions, there was more than one differential volume (2–4; 3 cases in favour of FMISO and two cases in favour of FAZA). The mean differential volume was 8.09 cc (±7.19). Figure 4 shows a patient with a significative difference of fixation between FMISO and FAZA in favour FMISO.
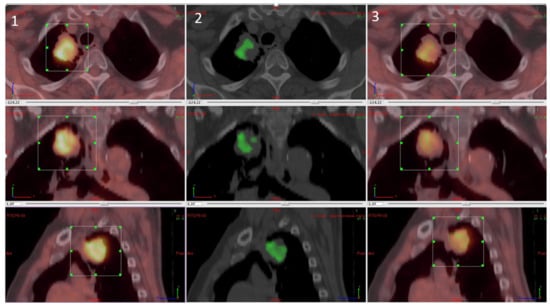
Figure 4.
Differential analysis between FMISO and FAZA with (1) FMISO PET, (2) differential fixation, and (3) FAZA PET.
With respect to CAIX immunohistochemistry, the mean score was 56.2 (±64.0); for HIF1, the mean score was 79.6 (±53.3). For LDH5, the mean score was 263.6 (±60.4), and for GLUT1, 216.9 (±767) (Table 2). We found no correlation between the different immunohistochemical analyses and with hypoxia PET. Each hypoxia tracer (FMISO and FAZA) for volumes and intensity was compared with immunohistochemical scores (HIF1-Alpha, GLUT-1, CAIX, and LDH5) (Table 3 and Figure 5).
Table 2.
Immunohistochemical analysis.
Table 3.
Correlation between immunohistochemical and hypoxia PET.
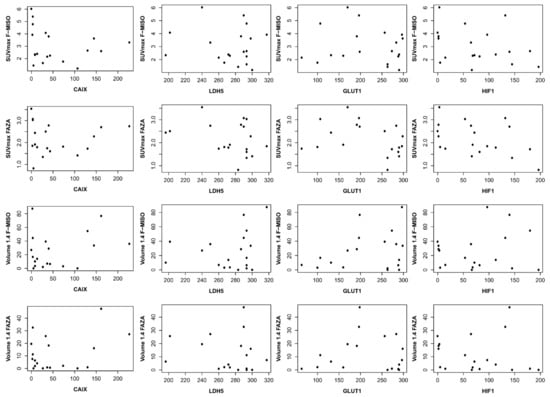
Figure 5.
Correlation between immunohistochemical and hypoxia PET. On the ordinate, it is the SUV max for the first two lines and the volume in cc for the last two lines. On the abscissa, the immunohistochemistry score (score described by Allred et al. [17]).
5. Discussion
The capability of F-MISO and FAZA as tracers for hypoxic areas in NSCLC has never been compared. In the present study, we analysed the hypoxic tumour subvolumes in NSCLC using FMISO, FAZA, FDG PET/CT, and immunohistochemistry. To our best knowledge, this is the first study to measure hypoxic volumes in lung cancer using FMISO and FAZA as tracers of hypoxia with a nitroimidazole core. The three PET modalities were administered within short intervals (2 days between FMISO and FAZA) and before surgery (3 days). We found no correlation of FDG with FMISO and FAZA, but a strong correlation between FMISO and FAZA.
The usefulness of hypoxia PET has been mainly evaluated in inoperable patients or patients with cancers in other sites (e.g., the head and neck, prostate, and brain) [11,18,19,20,21,22,23]. With hypoxia being a primary factor of radioresistance, FMISO has been reported to identify patients with poor prognosis before radiotherapy [9,12,24]. A recent meta-analysis confirms the prognostic character of hypoxia PET in head and neck cancers before radiotherapy with either FMISO or FAZA with similar relative thresholds [25]. Several previous studies in NSCLC proposed to increase the dose on the hypoxic volume [RTOG1106, 12]. However, while both FMISO and FAZA as hypoxia tracers were compared to FDG, there is no direct comparison between FMISO and FAZA [13]. In this study, we highlight the strong correlation between the two hypoxic tracers, both for the SUVmax and for the volume. Despite exams that were conducted at 2-day intervals, similar data were found for the two tracers, confirming their reliability. Meanwhile, the weak correlation between FDG and these two tracers confirms that they have different capabilities. FMISO was superior to FAZA as evidenced by the better uptake in absolute value (SUVmax) or in relative value (SUVmax / SUVmean of the mediastinum) in 16 of the 19 patients. This shows that FMISO should be the preferred tracer of hypoxic tissues for NSCLC. The superiority of one tracer over the other has not been demonstrated and varies according to the studies, but the number of patients is always limited, making it difficult to conclude. So, the effectiveness of hypoxia-specific PET tracers might be tumour-dependent.
The method of segmentation to define the hypoxic volume remains to be defined because the threshold defined by our team in previous work [14] lacked specificity (with FMISO, 18 lesions had a fixation higher than 1.4). The stability of fixation of the FMISO in the mediastinum confirms the interest of the relative threshold used by the RTOG. Other healthy tissues can be used because we obtained the same results for the muscles.
The lack of correlation between FDG PET and hypoxia PET confirms that these tracers provide different information and are independent, but complementary. Overall, they might be used for prognostication. Many studies found a regional tumour heterogeneity defined by PET and poor spatial overlap between FMISO uptake and FDG uptake. Tumours with high FDG uptake are more likely to have high cellularity and more rapid proliferation leading to a higher potential for hypoxia [1,26].
To our best knowledge, this first study comparing two hypoxia tracers and immunohistochemical analyses for lung cancer before surgery. Other studies were carried out using a single tracer and often on more limited populations with other tumour locations, such as the head and neck, prostate, or brain [23,27,28,29]. Results on the correlation between immunohistochemistry and hypoxia PET are conflicting [30]. Beckaet et al., in a study on glioblastoma, found a strong correlation with FMISO fixation and the immunohistochemistry markers HIF1alpha and CAIX [23]. Only one study compared FAZA with immunohistochemistry in NSCLC and found no correlation, which could probably be due to the small sample size. One hypothesis is that hypoxia PET can show an acute phenomenon of hypoxia; however, our data showed a strong correlation between both tracers of hypoxia despite that hypoxic PET data were acquired over two days. This result confirmed the usefulness of these PET tracers to define areas of tumour hypoxia. In glioblastoma, a good correlation has been found between FMISO and immunohistochemistry, although surgical methods do not allow a good anatomical correlation between the two methods. Kawai et al. reported that preoperative FMISO uptake in tumours was significantly correlated with the expression of vascular endothelial growth factors for newly diagnosed tumours. However, HIF1-Alpha was not correlated to FMISO [31]. The other hypothesis would be that PET shows a global phenomenon of hypoxia when immunohistochemistry highlights specific processes of this mechanism. Indeed, Hypoxia induces the synthesis of multiple proteins, which can be considered biomarkers regarding this biological condition, and the expression of these proteins can be quantified by immunohistochemistry. Hypoxia-inducible factor (HIF) plays a major role in oxygen detection and adaptation to hypoxia. For example, HIF promotes the expression of glucose transporter, for example, glucose transporter 1 (GLUT-1), enhancing aerobic glycolysis and increasing the transport of glucose [32,33]. In parallel, especially in cancer cells, the activation of the HIF pathway dramatically upregulates the transcription of Carbonic Anhydrase IX (CAIX) [34]. Another biomarker for hypoxia is Lactate Dehydrogenase 5 (LDH5), a crucial enzyme involved in the transformation of pyruvate to lactate for ATP production under anaerobic conditions [35]. LDH5 is composed of subunits encoded by the Lactate Dehydrogenase A (LDHA) gene, whose expression is triggered by HIF [36]. In addition, FDG uptake can be correlated with tumour characteristics, such as programmed death-ligand 1 expression [37,38], and is also an independent prognostic factor. Further studies are needed for the correlation between images and immunohistochemistry, but the accuracy of the methodology will be difficult in humans.
6. Conclusions
In conclusion, the results of this study confirm a strong correlation between fluorine-18-misonidazole (FMISO) and fluorine-18-fluoroazomycin-arabinoside (FAZA), indicating that they can both be used to detect hypoxic tumour areas via positron emission tomography/computed tomography (PET/CT) and define hypoxic volumes for radiotherapy. In particular, FMISO showed the superior capability to FAZA. Meanwhile, the lack of correlation with immunohistochemistry findings highlights the need for a definition of new methods to compare imaging and pathology. Larger studies are needed for more conclusive results regarding the most optimal PET tracer for the detection of hypoxic subvolumes in NSCLC.
Author Contributions
For research articles with several authors, the following statements should be used Conceptualization, P.V. and S.T.; methodology, J.L.; software, R.M.; validation, P.V. and S.T.; formal analysis, N.P., P.G., S.T. and R.M.; investigation, A.D., J.-M.B., J.M., P.R., C.P.; resources, P.V. and S.T.; data curation, O.R.; writing—original draft preparation, N.P. and S.T.; writing—review and editing, S.T., P.B., P.V. and S.H.; visualization, P.V., J.-C.S. and S.T.; supervision, P.V. and S.T.; project administration, O.R.; funding acquisition, P.V. All authors have read and agreed to the published version of the manuscript.
Funding
Ligue Contre le Cancer Seine Maritime, Centre Henri Becquerel and Cancéropole Nord OuestGrant Number: 2016.
Institutional Review Board Statement
This study has been approved by the national ethic approval (registration number: CPP 02/007/2014; approval 7th July 2014). The study was conducted according to the guidelines of the Declaration of Helsinki, and approved by the Ethics Committee of Nord Ouest France.
Informed Consent Statement
Informed consent was obtained from all subjects involved in the study.
Data Availability Statement
All data from the study are available at the Henri Becquerel Center (URC).
Conflicts of Interest
The authors declare no conflict of interest.
Abbreviations
| BMI | body mass index |
| DI | Dice index |
| FAZA | fluorine-18-fluoroazomycin-arabinoside |
| FMISO | fluorine-18-misonidazole |
| FDG | fluorodeoxyglucose |
| JI | Jaccard index |
| SUVmax | maximum standardised uptake value |
| NSCLC | non-small cell lung cancer |
| PET/CT | positron emission tomography/computed tomography |
| VOI | volume of interest |
References
- Cherk, M.H.; Foo, S.S.; Poon, A.M.; Knight, S.R.; Murone, C.; Papenfuss, A.T.; Sachinidis, J.I.; Saunder, T.H.; O’Keefe, G.J.; Scott, A.M. Lack of correlation of hypoxic cell fraction and angiogenesis with glucose metabolic rate in non-small cell lung cancer assessed by 18F-fluoromisonidazole and 18F-FDG PET. J. Nucl. Med. 2006, 47, 1921–1926. [Google Scholar]
- Lewis, J.S.; Welch, M.J. PET imaging of hypoxia. Q. J. Nucl. Med. 2001, 45, 183–188. [Google Scholar]
- Rischin, D.; Fisher, R.; Peters, L.; Corry, J.; Hicks, R. Hypoxia in Head and Neck Cancer: Studies with Hypoxic Positron Emission Tomography Imaging and Hypoxic Cytotoxins. Int. J. Radiat. Oncol. 2007, 69, S61–S63. [Google Scholar] [CrossRef] [PubMed]
- Overgaard, J. Hypoxic Radiosensitization: Adored and Ignored. J. Clin. Oncol. 2007, 25, 4066–4074. [Google Scholar] [CrossRef]
- Mortensen, L.S.; Buus, S.; Nordsmark, M.; Bentzen, L.; Munk, O.L.; Keiding, S.; Overgaard, J. Identifying hypoxia in human tumors: A correlation study between18F-FMISO PET and the Eppendorf oxygen-sensitive electrode. Acta Oncol. 2010, 49, 934–940. [Google Scholar] [CrossRef]
- Gagel, B.; Reinartz, P.; Dimartino, E.; Zimny, M.; Pinkawa, M.; Maneschi, P.; Stanzel, S.; Hamacher, K.; Coenen, H.H.; Westhofen, M.; et al. pO(2) Polarography versus positron emission tomography ([(18)F] fluoromisonidazole, [(18)F]-2-fluoro-2’-deoxyglucose). An appraisal of radiotherapeutically relevant hypoxia. Strahlenther Onkol. 2004, 180, 616–622. [Google Scholar] [CrossRef]
- Sanduleanu, S.; Van Der Wiel, A.M.A.; Lieverse, R.I.Y.; Marcus, D.; Ibrahim, A.; Primakov, S.; Wu, G.; Theys, J.; Yaromina, A.; Dubois, L.J.; et al. Hypoxia PET Imaging with [18F]-HX4—A Promising Next-Generation Tracer. Cancers 2020, 12, 1322. [Google Scholar] [CrossRef]
- Challapalli, A.; Carroll, L.; Aboagye, E.O. Molecular mechanisms of hypoxia in cancer. Clin. Transl. Imaging 2017, 5, 225–253. [Google Scholar] [CrossRef] [PubMed]
- Eschmann, S.M.; Paulsen, F.; Reimold, M.; Dittmann, H.; Welz, S.; Reischl, G.; Machulla, H.J.; Bares, R. Prognostic impact of hypoxia imaging with 18F-misonidazole PET in non-small cell lung cancer and head and neck cancer before radiotherapy. J. Nucl. Med. 2005, 46, 253–260. [Google Scholar] [CrossRef] [PubMed]
- Kinoshita, T.; Fujii, H.; Hayashi, Y.; Kamiyama, I.; Ohtsuka, T.; Asamura, H. Prognostic significance of hypoxic PET using 18 F-FAZA and 62 Cu-ATSM in non-small-cell lung cancer. Lung Cancer 2015, 91, 56–66. [Google Scholar] [CrossRef]
- Bollineni, V.R.; Koole, M.; Pruim, J.; Brouwer, C.L.; Wiegman, E.M.; Groen, H.J.; Vlasman, R.; Halmos, G.B.; Oosting, S.F.; Langendijk, J.A.; et al. Dynamics of tumor hypoxia assessed by 18F-FAZA PET/CT in head and neck and lung cancer patients during chemoradiation: Possible implications for radiotherapy treatment planning strategies. Radiother. Oncol. 2014, 113, 198–203. [Google Scholar] [CrossRef]
- Vera, P.; Thureau, S.; Chaumet-Riffaud, P.; Modzelewski, R.; Bohn, P.; Vermandel, M.; Hapdey, S.; Pallardy, A.; Mahé, M.-A.; Lacombe, M.; et al. Phase II Study of a Radiotherapy Total Dose Increase in Hypoxic Lesions Identified by 18F-Misonidazole PET/CT in Patients with Non–Small Cell Lung Carcinoma (RTEP5 Study). J. Nucl. Med. 2017, 58, 1045–1053. [Google Scholar] [CrossRef]
- Di Perri, D.; Lee, J.A.; Bol, A.; Hanin, F.-X.; Janssens, G.; LaBar, D.; Robert, A.; Sterpin, E.; Geets, X. Evolution of [18F]fluorodeoxyglucose and [18F]fluoroazomycin arabinoside PET uptake distributions in lung tumours during radiation therapy. Acta Oncol. 2017, 56, 516–524. [Google Scholar] [CrossRef] [PubMed]
- Thureau, S.; Chaumet-Riffaud, P.; Modzelewski, R.; Fernandez, P.; Tessonnier, L.; Vervueren, L.; Cachin, F.; Berriolo-Riedinger, A.; Olivier, P.; Kolesnikov-Gauthier, H.; et al. Interobserver Agreement of Qualitative Analysis and Tumor Delineation of 18F-Fluoromisonidazole and 3’-Deoxy-3’-18F-Fluorothymidine PET Images in Lung Cancer. J. Nucl. Med. 2013, 54, 1543–1550. [Google Scholar] [CrossRef] [PubMed]
- Lopci, E.; Grassi, I.; Chiti, A.; Nanni, C.; Cicoria, G.; Toschi, L.; Fonti, C.; Lodi, F.; Mattioli, S.; Fanti, S. PET radiopharmaceuticals for imaging of tumor hypoxia: A review of the evidence. Am. J. Nucl. Med. Mol. Imaging 2014, 4, 365–384. [Google Scholar] [PubMed]
- Wei, Y.; Zhao, W.; Huang, Y.; Yu, Q.; Zhu, S.; Wang, S.; Zhao, S.; Hu, X.; Yu, J.; Yuan, S. A Comparative Study of Noninvasive Hypoxia Imaging with 18F-Fluoroerythronitroimidazole and 18F-Fluoromisonidazole PET/CT in Patients with Lung Cancer. PLoS ONE 2016, 11, e0157606. [Google Scholar] [CrossRef]
- Allred, D.C.; Harvey, J.M.; Berardo, M.; Clark, G.M. Prognostic and predictive factors in breast cancer by immunohistochemical analy-sis. Mod. Pathol 1998, 11, 155–168. [Google Scholar] [PubMed]
- Bollineni, V.R.; Kerner, G.; Pruim, J.; Steenbakkers, R.J.; Wiegman, E.M.; Koole, M.J.; de Groot, E.H.; Willemsen, A.T.; Luurtsema, G.; Widder, J.; et al. PET Imaging of Tumor Hypoxia Using 18F-Fluoroazomycin Arabinoside in Stage III–IV Non–Small Cell Lung Cancer Patients. J. Nucl. Med. 2013, 54, 1175–1180. [Google Scholar] [CrossRef] [PubMed]
- Kerner, G.S.M.A.; Bollineni, V.R.; Hiltermann, T.J.N.; Sijtsema, N.M.; Fischer, A.; Bongaerts, A.H.H.; Pruim, J.; Groen, H.J.M. An exploratory study of volumetric analysis for assessing tumor response with 18F-FAZA PET/CT in patients with advanced non-small-cell lung cancer (NSCLC). EJNMMI Res. 2016, 6, 33. [Google Scholar] [CrossRef]
- Saga, T.; Inubushi, M.; Koizumi, M.; Yoshikawa, K.; Zhang, M.; Tanimoto, K.; Horiike, A.; Yanagitani, N.; Ohyanagi, F.; Nishio, M. Prognostic value of 18 F-fluoroazomycin arabinoside PET / CT in patients with advanced non-small-cell lung cancer. Cancer Sci. 2015, 106, 1554–1560. [Google Scholar] [CrossRef] [PubMed]
- Supiot, S.; Rousseau, C.; Dore, M.; Le-Rest, C.C.-; Kandel-Aznar, C.; Potiron, V.; Guerif, S.; Paris, F.; Ferrer, L.; Campion, L.; et al. Evaluation of tumor hypoxia prior to radiotherapy in intermediate-risk prostate cancer using 18F-fluoromisonidazole PET/CT: A pilot study. Oncotarget 2018, 9, 10005–10015. [Google Scholar] [CrossRef] [PubMed]
- Sato, J.; Kitagawa, Y.; Watanabe, S.; Asaka, T.; Ohga, N.; Hirata, K.; Okamoto, S.; Shiga, T.; Shindoh, M.; Kuge, Y.; et al. 18 F-Fluoromisonidazole positron emission tomography (FMISO-PET) may reflect hypoxia and cell proliferation activity in oral squamous cell carcinoma. Oral Surg. Oral Med. Oral Pathol. Oral Radiol. 2017, 124, 261–270. [Google Scholar] [CrossRef]
- Bekaert, L.; Valable, S.; Lechapt-Zalcman, E.; Ponte, K.; Collet, S.; Constans, J.-M.; Levallet, G.; Bordji, K.; Petit, E.; Branger, P.; et al. [18F]-FMISO PET study of hypoxia in gliomas before surgery: Correlation with molecular markers of hypoxia and angiogenesis. Eur. J. Nucl. Med. Mol. Imaging 2017, 44, 1383–1392. [Google Scholar] [CrossRef] [PubMed]
- Zschaeck, S.; Löck, S.; Hofheinz, F.; Zips, D.; Mortensen, L.S.; Zöphel, K.; Troost, E.G.; Boeke, S.; Saksø, M.; Mönnich, D.; et al. Individual patient data meta-analysis of FMISO and FAZA hypoxia PET scans from head and neck cancer patients undergoing definitive radio-chemotherapy. Radiother. Oncol. 2020, 149, 189–196. [Google Scholar] [CrossRef] [PubMed]
- Rischin, D.; Hicks, R.; Fisher, R.; Binns, D.; Corry, J.; Porceddu, S.; Peters, L.J. Prognostic Significance of [18F]-Misonidazole Positron Emission Tomography–Detected Tumor Hypoxia in Patients With Advanced Head and Neck Cancer Randomly Assigned to Chemoradiation With or Without Tirapazamine: A Substudy of Trans-Tasman Radiation Oncology Group Study 98.02. J. Clin. Oncol. 2006, 24, 2098–2104. [Google Scholar] [CrossRef] [PubMed]
- Thorwarth, D.; Eschmann, S.-M.; Holzner, F.; Paulsen, F.; Alber, M. Combined uptake of [18F]FDG and [18F]FMISO correlates with radiation therapy outcome in head-and-neck cancer patients. Radiother. Oncol. 2006, 80, 151–156. [Google Scholar] [CrossRef] [PubMed]
- De Bruin, L.B.; Bollineni, V.R.; Wachters, J.E.; Schuuring, E.; Van Hemel, B.M.; Van Der Wal, J.E.; Slagter-Menkema, L.; De Bock, G.H.; Steenbakkers, R.J.; Langendijk, J.A.; et al. Assessment of hypoxic subvolumes in laryngeal cancer with 18F-fluoroazomycinarabinoside (18F-FAZA)-PET/CT scanning and immunohistochemistry. Radiother. Oncol. 2015, 117, 106–112. [Google Scholar] [CrossRef]
- Garcia-Parra, R.; Wood, D.; Shah, R.B.; Siddiqui, J.; Hussain, H.; Park, H.; Desmond, T.; Meyer, C.; Piert, M. Investigation on tumor hypoxia in resectable primary prostate cancer as demonstrated by 18F-FAZA PET/CT utilizing multimodality fusion techniques. Eur. J. Nucl. Med. Mol. Imaging 2011, 38, 1816–1823. [Google Scholar] [CrossRef][Green Version]
- Norikane, T.; Yamamoto, Y.; Maeda, Y.; Kudomi, N.; Matsunaga, T.; Haba, R.; Iwasaki, A.; Hoshikawa, H.; Nishiyama, Y. Correlation of 18F-fluoromisonidazole PET findings with HIF-1α and p53 expressions in head and neck cancer. Nucl. Med. Commun. 2014, 35, 30–35. [Google Scholar] [CrossRef]
- Mapelli, P.; Bettinardi, V.; Fallanca, F.; Incerti, E.; Compierchio, A.; Rossetti, F.; Coliva, A.; Savi, A.; Doglioni, C.; Negri, G.; et al. 18F-FAZA PET/CT in the Preoperative Evaluation of NSCLC: Comparison with 18F-FDG and Immunohistochemistry. Curr. Radiopharm. 2018, 11, 50–57. [Google Scholar] [CrossRef]
- Kawai, N.; Lin, W.; Cao, W.-D.; Ogawa, D.; Miyake, K.; Haba, R.; Maeda, Y.; Yamamoto, Y.; Nishiyama, Y.; Tamiya, T. Correlation between 18F-fluoromisonidazole PET and expression of HIF-1α and VEGF in newly diagnosed and recurrent malignant gliomas. Eur. J. Nucl. Med. Mol. Imaging 2014, 41, 1870–1878. [Google Scholar] [CrossRef] [PubMed]
- Choudhry, H.; Harris, A.L. Advances in Hypoxia-Inducible Factor Biology. Cell Metab. 2018, 27, 281–298. [Google Scholar] [CrossRef] [PubMed]
- Linehan, W.M.; Rouault, T.A. Molecular pathways: Fumarate hydratase-deficient kidney cancer—Argeting the Warburg effect in cancer. Clin. Cancer Res. 2013, 19, 3345–3352. [Google Scholar] [CrossRef] [PubMed]
- Kaluz, S.; Kaluzová, M.; Liao, S.-Y.; Lerman, M.; Stanbridge, E.J. Transcriptional control of the tumor- and hypoxia-marker carbonic anhydrase 9: A one transcription factor (HIF-1) show? Biochim. Biophys. Acta BBA Bioenergy 2009, 1795, 162–172. [Google Scholar] [CrossRef] [PubMed]
- Holbrook, J.J.; Liljas, A.; Steindel, S.J.; Rossman, M.G. Lactate dehydrogenase. In The Enzymes, 3rd ed.; Boyer, P.D., Ed.; Academic Press: New York, NY, USA, 1975; Volume XI, pp. 191–292. [Google Scholar]
- Semenza, G.L.; Jiang, B.H.; Leung, S.W.; Passantino, R.; Concordet, J.P.; Maire, P.; Giallongo, A. Hypoxia response elements in the aldolase A, enolase 1, and lactate dehydrogenase A gene promoters contain essential binding sites for hypox-ia-inducible factor 1. J. Biol Chem. 1996, 271, 32529–32537. [Google Scholar] [CrossRef] [PubMed]
- Lopci, E.; Toschi, L.; Grizzi, F.; Rahal, D.; Olivari, L.; Castino, G.F.; Marchetti, S.; Cortese, N.; Qehajaj, D.; Alloisio, M.; et al. Correlation of metabolic information on FDG-PET with tissue expression of immune markers in patients with non-small cell lung cancer (NSCLC) who are candidates for upfront surgery. Eur. J. Nucl. Med. Mol. Imaging 2016, 43, 1954–1961. [Google Scholar] [CrossRef] [PubMed]
- Kasahara, N.; Kaira, K.; Bao, P.; Higuchi, T.; Arisaka, Y.; Erkhem-Ochir, B.; Sunaga, N.; Ohtaki, Y.; Yajima, T.; Kosaka, T.; et al. Correlation of tumor-related immunity with 18F-FDG-PET in pulmonary squamous-cell carcinoma. Lung Cancer 2018, 119, 71–77. [Google Scholar] [CrossRef]


Publisher’s Note: MDPI stays neutral with regard to jurisdictional claims in published maps and institutional affiliations. |
© 2021 by the authors. Licensee MDPI, Basel, Switzerland. This article is an open access article distributed under the terms and conditions of the Creative Commons Attribution (CC BY) license (https://creativecommons.org/licenses/by/4.0/).