1. Introduction
Histones constitute the core proteins of chromatin and their post-translational modifications (PTMs) contribute to the molecular basis of epigenetic gene regulation and cellular memory [
1]. In humans, several variant forms of histones have been described [
2] and this is particularly relevant for the H2A histone. The H2A variants represent the largest and most diverse family of histones; there is overwhelming evidence that their unstructured N- and C-termini, which protrude out of the core structure of the nucleosome, harbor several sites for PTMs in response to varying stimuli [
3]. The H2AX variant shares high amino acid similarity with H2A and is characterized by an extended C-terminus, which is phosphorylated when the cells become injured by agents that provoke DNA replication stress (RS) and genome instability [
4]. The phosphorylation of serine at position 139 (S139) of H2AX has been particularly well studied and represents a key event in the detection and response to DNA damage [
5,
6].
Phosphorylation of histone H2AX at S139, which gives rise to what is generally referred to as γ-H2AX, is in fact a very early step in the DNA damage response (DDR) and an essential signal for the recruitment and retention of DDR complexes at the site of damage [
7]. Three different phosphatidylinositol 3 kinase (PI3K)-related kinases mediate S139 phosphorylation on H2AX: ATM (ataxia-telangiectasia mutated), ATR (ATM and Rad3-related), and DNA-PK (DNA-dependent protein kinase) [
8]. ATM and DNA-PK share functional redundancy upon ionizing radiation, while ATR may preferentially phosphorylate H2AX during RS [
9]. This PTM of H2AX is highly dynamic and a number of phosphatases, including those of the PPP family and Wip1, are able to dephosphorylate γ-H2AX to fine-tune the duration and intensity of the DDR signaling [
10]. It has also been found that H2AX can be phosphorylated at the threonine residue at position 136 (T136) and at the C-terminal tyrosine residue at position 142 (Y142) to facilitate DNA repair, whereas the persistency of the latter PTM may also trigger apoptosis [
11]. Nevertheless, S139 phosphorylation is regarded as the main PTM of H2AX since it is specifically recognized by the adaptor protein MDC1, which further recruits several E3 ubiquitin ligases to favor DNA repair and/or restart of the halted forks during RS [
12].
Because γ-H2AX is involved in the DDR, it is generally considered a biomarker of DNA double-strand breaks (DSBs) [
13] and its relevance as read-out of sustained RS is well accepted [
14]. In addition, H2AX is also phosphorylated in the absence of DNA breakage, likely during replication fork arrest and subsequent single-stranded DNA accumulation, and this early event upon insult induces the formation of discrete nuclear foci of γ-H2AX, which can be visualized with specific antibodies under the microscope. The formation of γ-H2AX, which can spread progressively over the whole nucleus (pan-nuclear γ-H2AX) following chromatin modification by loop extrusion [
15], gives in fact an estimate of the severity of the RS [
16]. γ-H2AX is considered, nowadays, a universal bio-indicator of the severity of genotoxic compounds that interfere with DNA replication in vitro and in vivo [
17]. Indeed, almost all studies aiming at selecting small molecules triggering irreversible genome instability refer to γ-H2AX formation and retention to assess their potency. In particular, tracking γ-H2AX is of high interest for validating chemotherapeutics [
18] and for controlling the carcinogenic properties of chemicals present in biological samples [
19]. Immunofluorescence with validated antibodies remains so far the method of choice for accurately determining γ-H2AX levels [
20]; however, currently, there is no simple tool available for monitoring γ-H2AX turn-over and for measuring its direct impact on cell viability.
In a previous study, we have shown that delivery in cells of antigen-binding fragments (Fabs) derived from an anti-γ-H2AX monoclonal antibody (mAb) allows the fate of cancer cells after treatment with varying RS-inducing drug combinations to be followed [
21]. Although it was possible to show with this method that extensive γ-H2AX generation is indicative of commitment to irreversible cell death, we could not clearly identify the dynamic changes of γ-H2AX formation during the treatment. Indeed, conventional antibodies cannot be easily delivered in the nucleus of living cells, and, therefore, require fixation of the samples.
Recently, it has been shown that single-domain antibody fragments of camelids, generally termed nanobodies, represent exquisite tools for tracking intracellular molecules [
22,
23]. Nanobodies correspond to the variable domain (VHH) of the heavy chain-only antibodies (HcAb) expressed in these animals [
24]. They can be cloned as VHH repertoires with minimal modification from total RNA of peripheral blood mononuclear cells (PBMCs) obtained after immunization, thus, presenting an authentic picture of the in vivo-maturated heavy chain repertoire diversity. Moreover, their small size (~15 kDa) compared to conventional antibodies (~150 kDa) and, especially, their capacity to fold stably in a reducing environment make them excellent binding molecules in cells [
22,
23,
24,
25]. While alpaca-derived nanobodies against γ-H2AX have already been generated [
26], these tools did not allow for the specific unambiguous detection of γ-H2AX in irradiated cancer cells.
Here, we developed a novel nanobody with high specificity against γ-H2AX. We demonstrate that bivalency is essential to achieve high specificity against the antigen. We solved the crystal structure of the nanobody in complex with the phosphopeptide representing the C-terminus of H2AX, which enabled us to design mutations that impair the binding. We show the ability of this novel nanobody to quantitatively visualize γ-H2AX in fixed as well as in live cells with the same precision as a validated mAb. To analyze γ-H2AX in real time, we developed a transduction strategy based on the delivery of nanobody-dTomato fusion proteins by electroporation, allowing its efficient transport in the crowded nucleus and precise binding to γ-H2AX foci in this compartment upon drug treatment. The novel nanobody presented here will make it possible to study the dynamics of H2AX phosphorylation at S139 in living cells in unprecedented ways. The transduction approach is versatile and can easily be implemented with other nanobodies, allowing a new way to visualize proteins and their PTMs inside cells with high specificity.
3. Discussion
The detection of γ-H2AX with antibodies in fixed cells is an established method for assessing RS and/or DNA damage. Due to the lack of methods for following this PTM in living cells, it is not clear whether H2AX phosphorylation corresponds to a transient state of the chromatin following damage which allows the coordination of responses and recovery upon injury or if it is a consequence of the spontaneous strong activation of defined kinases, which is finally reverted by the re-start of DNA replication in cycling cells. Notably, the typical structures observed with antibodies after cell fixation can persist over a long time and it has been shown that this pattern might be of relevance for therapeutic purposes [
35]. Since upon insult γ-H2AX levels vary from one cell to another, our goal was to obtain a reagent that would allow monitoring in individual cells both γ-H2AX levels and their fate after treatment with varying doses of genotoxic agents. Because classical antibodies are relatively expensive reagents and cannot diffuse freely into the nucleus upon delivery, we have generated nanobodies that can be advantageously produced in bacteria and have the intrinsic property to fold stably in a reducing environment [
36]. Their capacity to diffuse into the nucleus makes them usable as intrabodies in cells following either transduction or transfection.
It is well known that generating nanobodies against small peptides or chemicals is very challenging and might be more difficult than against globular proteins [
37,
38]. The immunogen used here consisted of a small peptide harboring a phospho-serine linked chemically to a carrier protein. This conjugate was found to be adequate for eliciting a strong anti-γ-H2AX response of B cell in mice as described in a previous work [
16]. Despite the fact that the titers of the alpaca’s sera were relatively high upon collecting the PBMCs, we had to perform numerous selection attempts to isolate one clone that could specifically interact with the peptide used for immunization, confirming that single-domain antibodies cannot easily bind to small linear epitopes. This might also be the reason why another group was unsuccessful in selecting an anti-γ-H2AX nanobody following immunization of a lama with the same peptide [
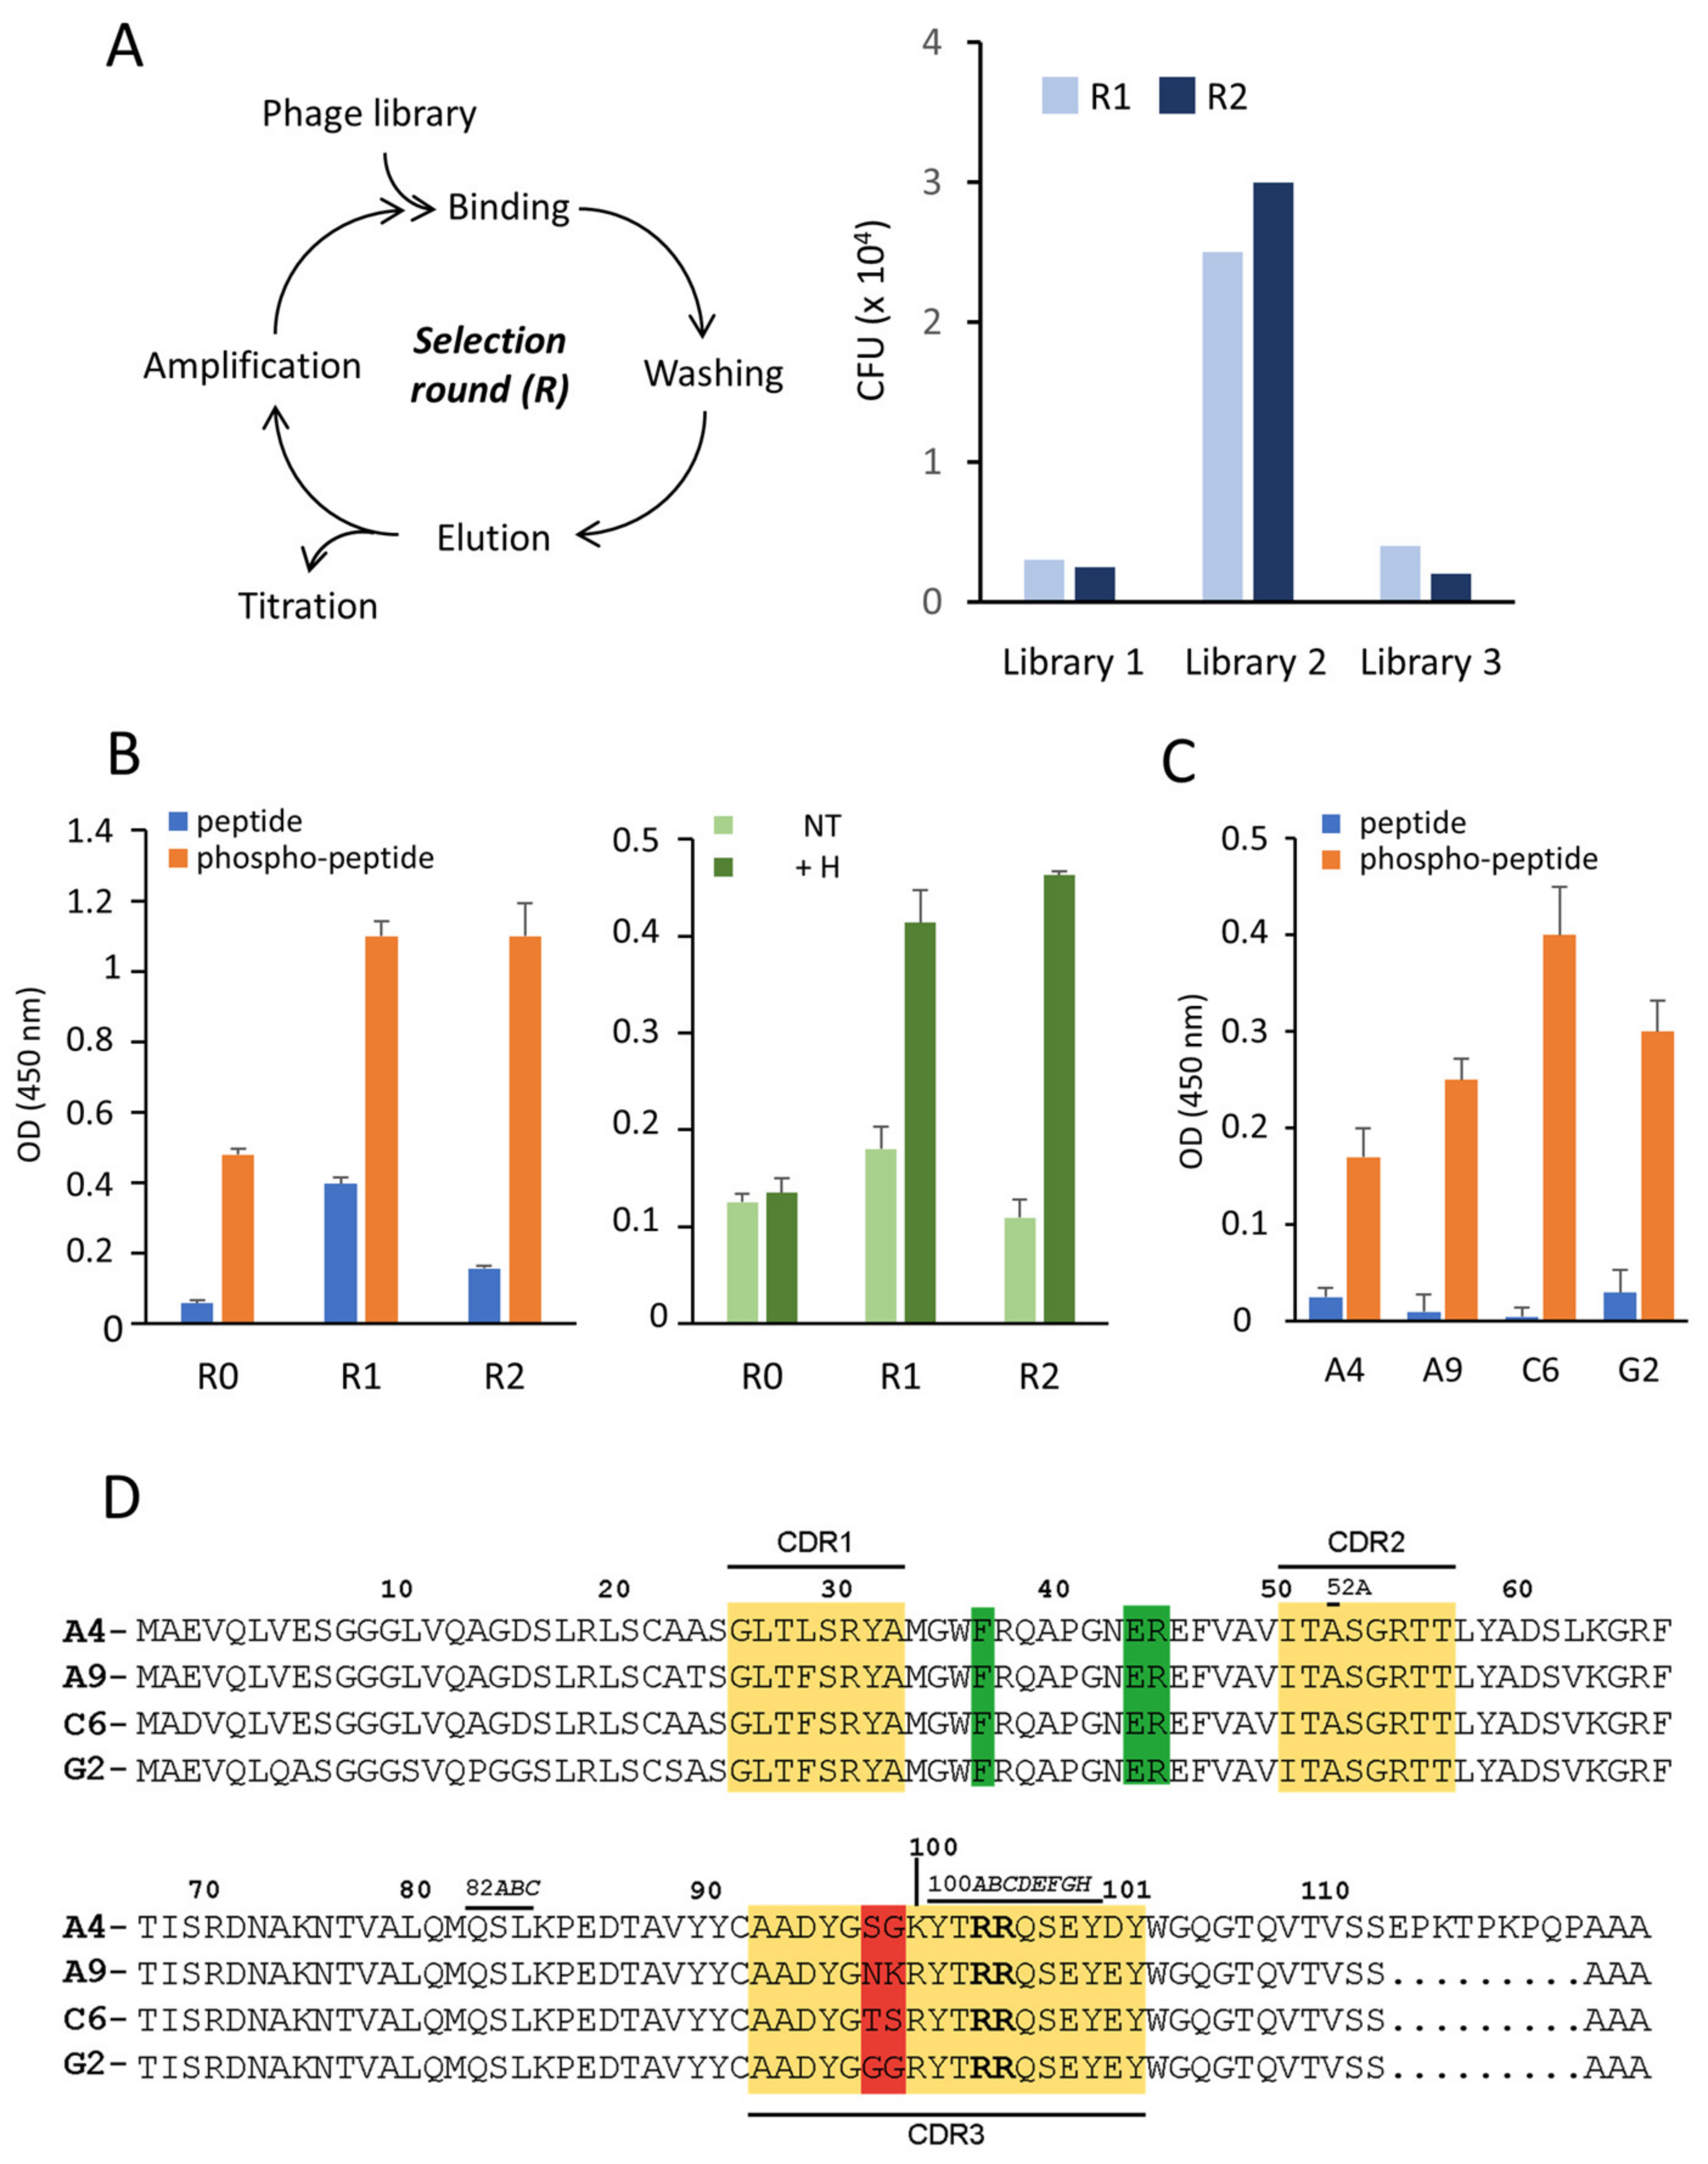
26]. These results suggest that the main subclass of IgG produced in these animals after immunization with a small peptide are IgG1 molecules bearing a light chain and not the IgG2 and IgG3 HcAbs that are the source of nanobodies. This might be an important consideration for future nanobody generation.
The amino acid composition of the isolated VHH variants differed minimally. Indeed, only two residues in the CDR3 (positions 98 and 99) were altered, whereas the residues in the two other CDRs were conserved. Interestingly, the 3D structure of the VHH-peptide complex showed that these two altered residues are not essential for the interaction with the phosphorylated peptide. It is possible that these alterations reflect the recombination variability that occur during the rearrangement of the V (variable), D (diversity), J (joining) gene segments, which further suggests that the isolated variants originate from a single B cell. Strikingly, the nature of these two residues in CDR3 was found to be critical for the stable folding of the nanobodies upon expression in the bacterial cytoplasm, since clone G2 was almost insoluble compared to C6, for instance (
Figure S1A). Whether these small changes within the VHH domain also affect the folding in mammalian cells remains to be tested. Moreover, the 3D structure analysis revealed that both the phosphate group carried by S139 and the C-terminal Y play a preponderant role in recognition, which could explain the observed specific binding of the variants to the phosphopeptide. It has been reported that the C-terminal Y of γ-H2AX can also be phosphorylated and this may trigger cell death signaling [
11]. Our nanobodies do not bind to a peptide that contains both modifications (i.e., phospho-S139 and phospho-Y142), indicating that γ-H2AX detected in our experiments following drug treatment is not phosphorylated at the C-terminus. Moreover, it is noteworthy to mention that the two contiguous R in CDR3 at positions 100C and 100D that participate actively in the recognition of the γ-H2AX C-terminal end and whose mutation abrogates binding, are also present in the CDR3 of the established anti-γ-H2AX mAb 3F4. This suggests that this conserved arginine motif is of outmost importance for affording specificity.
It is not surprising that it was necessary to render the nanobody bivalent to detect γ-H2AX without ambiguity. Indeed, several groups have reported that having multiple copies of the VHH coding region enhances binding through avidity [
36,
39]. This strategy enabled the identification of the discrete γ-H2AX foci that are formed early after treatment of the cells. It has been reported that these γ-H2AX foci are arranged into nano-domains, called nano-foci, only visible by super-resolution microscopy [
40]. Thus, if the γ-H2AX molecules are in close proximity in the foci, bivalent binding is possible, thereby precluding the fast dissociation, which is instead likely for the monovalent molecules. Previously reported alpaca-derived nanobodies recognizing γ-H2AX functioned well in vitro [
26], but none of them was able to specifically interact with γ-H2AX in cells. We speculate that this is due to the fact that these nanobodies were expressed as monovalent molecules, thus, lacking the bivalency important for stable target binding in the cellular context [
26]. We proved the binding capacity of the bivalent nanobody to γ-H2AX with different methods, among which treatment of the cells with CSK buffer prior to fixation. This experiment, which was particularly instrumental for the rapid validation in cells of the binding-defective mutant nanobody that served as reliable negative control, demonstrates that our bivalent nanobody is stably bound to γ-H2AX in cells. Nevertheless, we were somewhat surprised to observe that specific binding to γ-H2AX after pulse-treatment with H has almost no impact on the ability of the cells to recover from drug-induced RS. In particular, it seems that the nanobody does not interfere with the cellular response to RS or, more precisely, that the masking of phosphorylated S139 with the nanobody does not hinder the action of phosphatases that allow the injured cells to return to their initial state after drug withdrawal. Whether our nanobody is not of sufficient affinity to counteract these activities remains to be clarified.
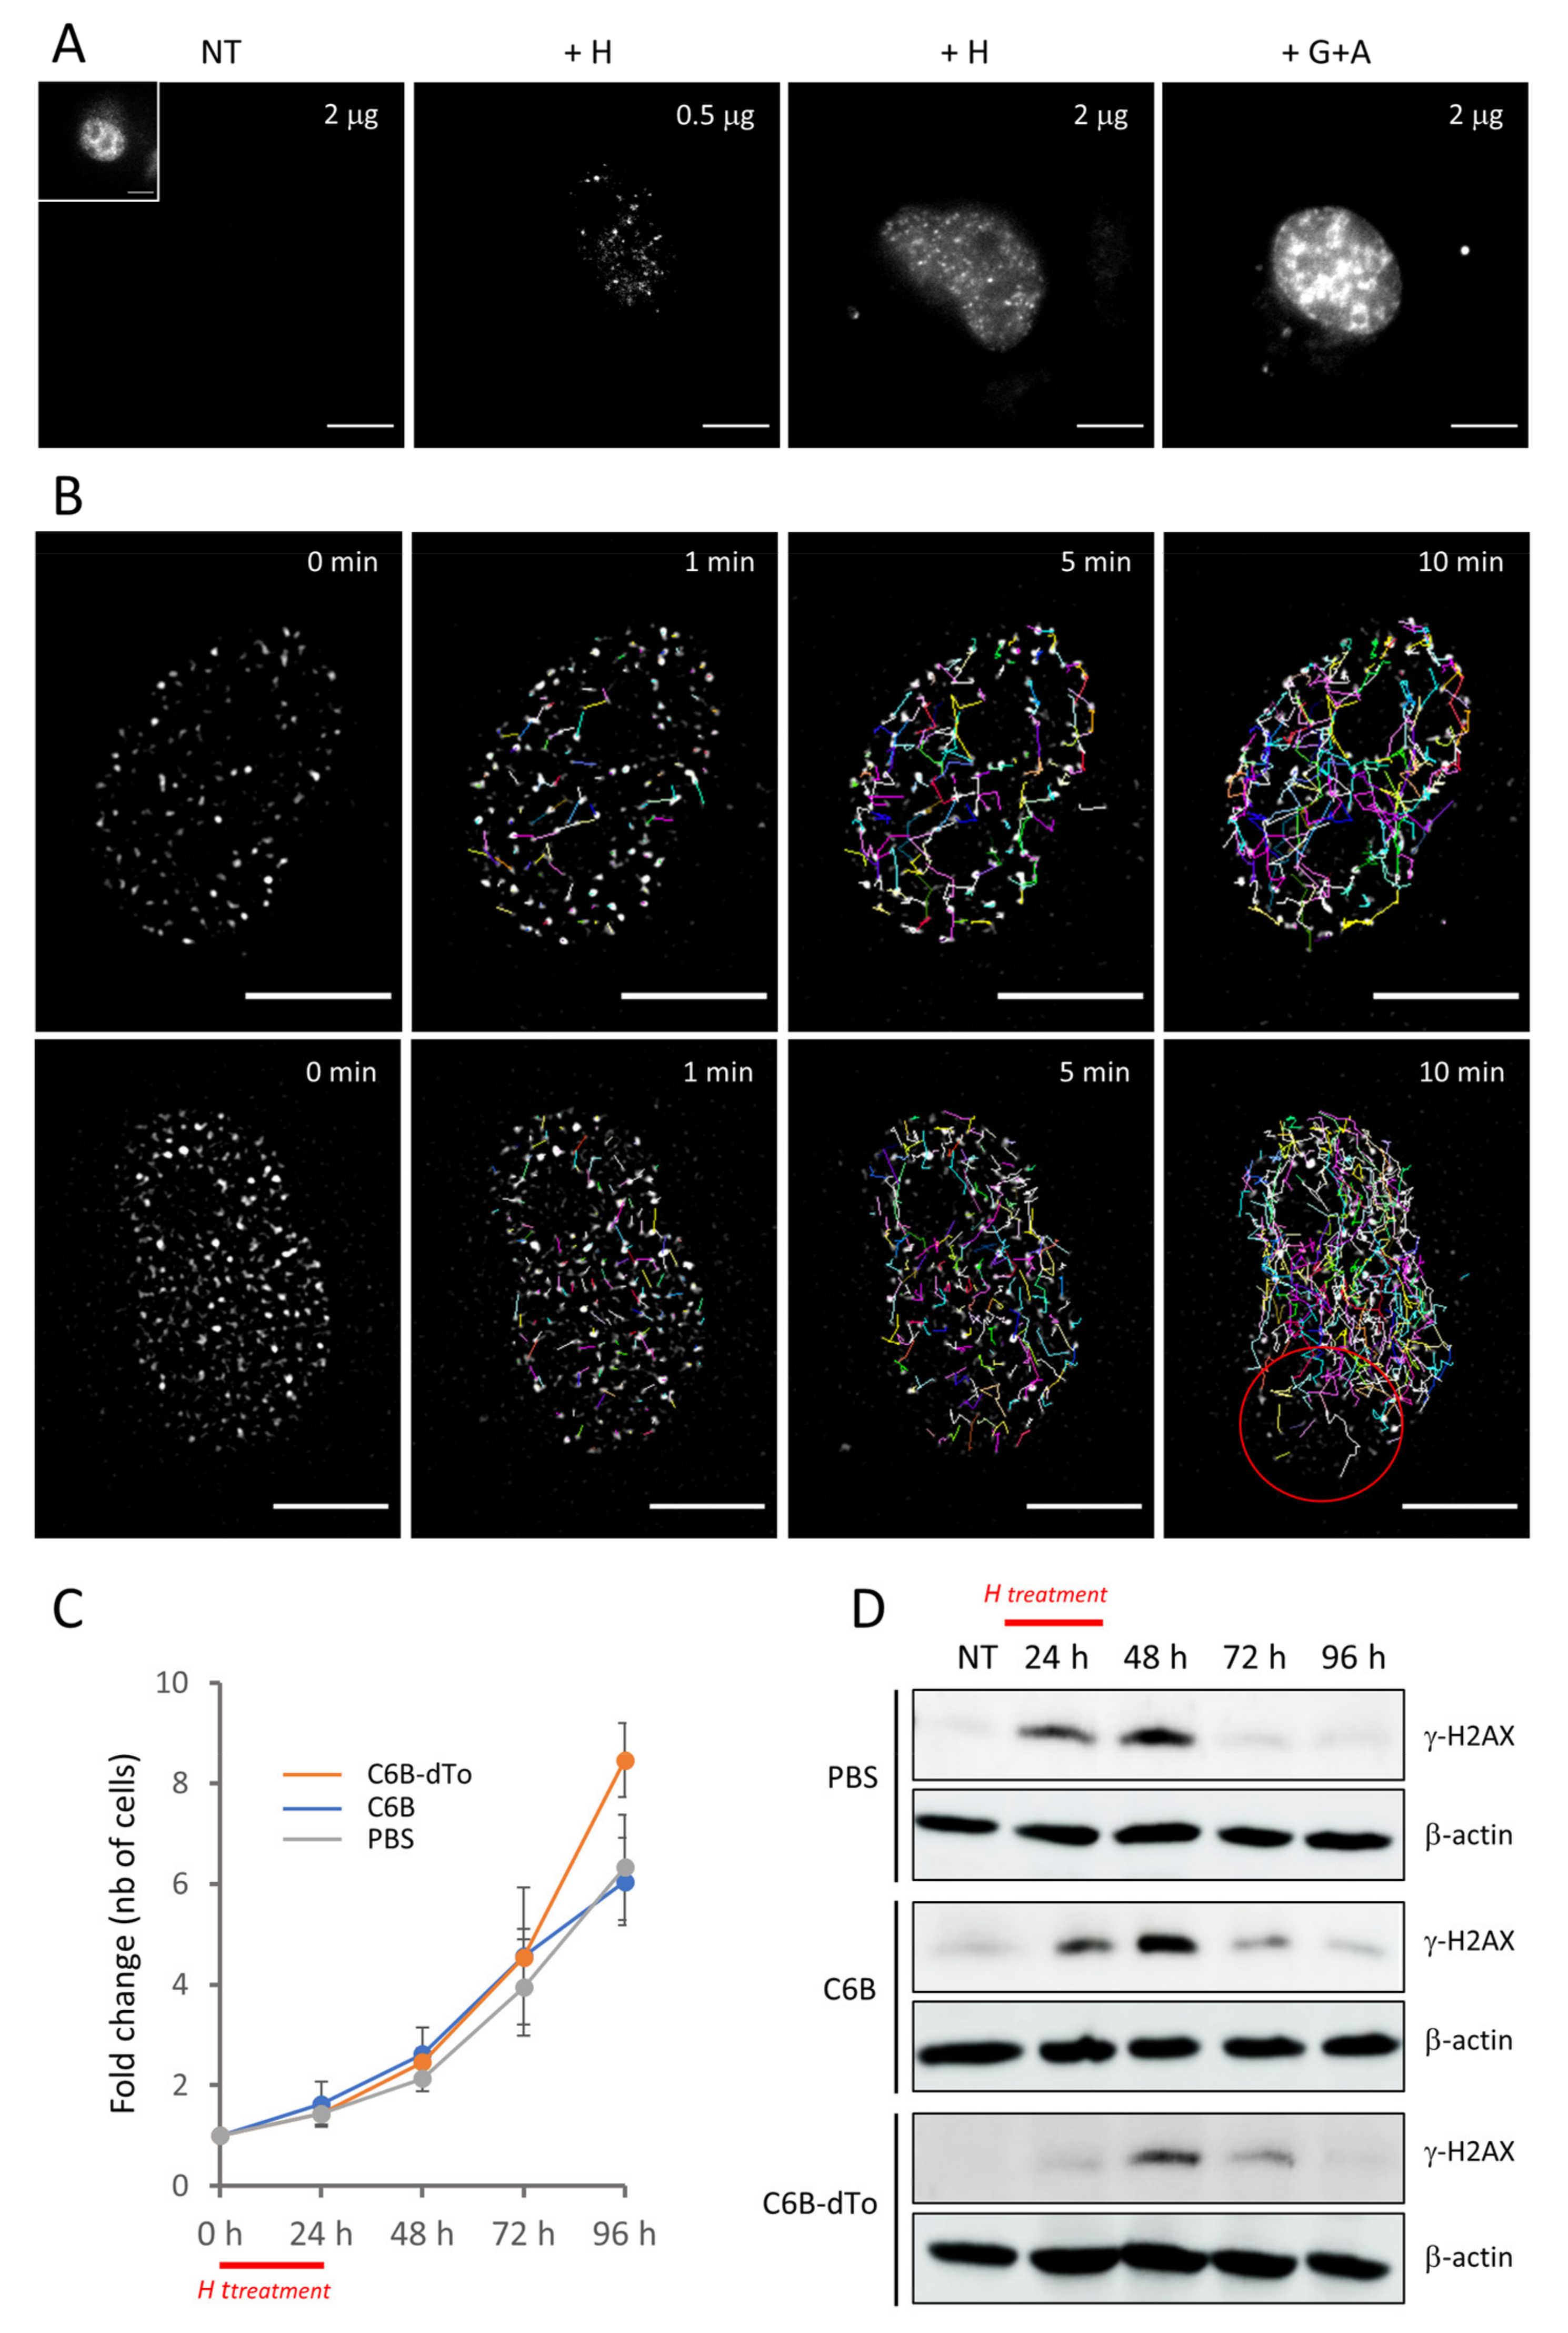
To our knowledge, this study shows for the first time that γ-H2AX foci can be specifically detected and tracked in living cells. Our experiments indicate that γ-H2AX is readily accessible in the nucleus, is not buried into the chromatin and is rather free from interactions with MDC-1, contrary to what was proposed by Rajan and colleagues [
26]. The images taken after transduction of the purified C6B nanobody into the cells were very similar to those obtained after cell fixation and subsequent antibody incubation, indicating that the localization of γ-H2AX can be scrutinized in the crowded context of live cells in an unbiased way. Interestingly, γ-H2AX was also easily detectable with the chemically-labelled fluorescent C6B nanobody, making it a potential reagent for the quantitative determination in one step of γ-H2AX levels in high-throughput screening assays [
10,
41]. Although well applicable in vitro, the Alexa Fluor-nanobody conjugates formed aggregates in the transduced cells upon prolonged incubation at 37 °C, which prompted us to test the performance of chromobody proteins delivered into the cells. Even though chromobodies directly expressed in cells after transfection have been successfully applied to monitor several intracellular antigens in live cells [
42], their amount in the cells can hardly be controlled and their overexpression generates in general high background staining, especially when the amount of intracellular target is low. Lower expression levels of the chromobodies, achieved either by reducing their half-lives or by adopting weak promoters to drive their expression, can help overcome this issue allowing for the visualization of endogenous antigens with more confidence [
43,
44]. We were surprised to observe that our nanobody fused to either eGFP or mCherry and expressed in the cells by transfection re-localizes mostly to the nucleus, even in the absence of any drug treatment. Its preferred localization in this compartment upon transfection is likely due to overexpression and unspecific binding.
To overcome this problem, we have implemented a transduction strategy based on the concept of low loading and potential cross-reactivity in the cell. It is widely admitted that antibody-based molecules can bind to different epitopes, albeit with varying affinity, a property termed polyspecific [
45]. Our bivalent nanobodies, when fused to dTomato protein, cannot diffuse into the nucleus due to their size (molecular weight of approximately 120 kDa). This is what we observed with the C6BM-dTo molecules, which remain spatially sequestered in “aggresome-like” juxta-nuclear regions [
46]. However, when their binding capacity is not abolished, as it is for C6B-dTo, they can recognize sites with somewhat low affinity and when one of these sites is present on a newly synthesized nuclear protein in the cytoplasm, they become piggybacked in the nucleus. In this compartment, due to the on-off rate of the recognition and weak binding at equilibrium, the C6B-dTo molecules are stabilized by the strongest binding reaction [
43], even more when the antigen recognized with a higher fit is present in excess. The low nuclear fluorescence signal observed in the untreated cells can be partly explained by the fact that these cells are not under RS and continue to divide, which dilutes the low signal present in the nucleus. By contrast, the stressed cells stop dividing and γ-H2AX levels raise considerably with time. In addition, delivery of sub-saturating amounts of bivalent nanobodies labelled with a fluorescent protein with a high quantum yield was paramount for observing distinctly the foci. Moreover, as schematically depicted in
Figure S7B, the imaging method described calls on alternated binding events within the cell. It can probably be applied to other nuclear antigens displaying epitopes where the antibody can bind with various degrees of fit. In our case, we suspect that binding to the non-phosphorylated C-terminus of H2AX (that was undetectable in vitro after washing) is involved in the transport of the nanobody into the nucleus. Whether it will be possible to monitor with this system the appearance of the foci and their progressive formation over longer periods of incubation after addition of drug(s) to the cancer cells remains to be investigated. It is likely that such analyses in single living cancer cells will contribute to the knowledge of the chromatin landscape modifications in response to drug treatment [
47].
4. Materials and Methods
4.1. VHH Libraries and Phage Selection
Alpacas (
Llama pacos) were immunized at days 0, 21, and 35 with the synthetic phosphorylated peptide CKATQA(p)SQEY corresponding to the C-terminus of H2AX after covalent cross-linking to ovalbumin (150 µg). The immunogen was mixed with Freund complete adjuvant for the first immunization and with Freund incomplete adjuvant for the following immunizations. The immune response was monitored by titration of serum samples by ELISA with immunizing peptide on plate. Bound antibodies were detected with anti-alpaca rabbit IgG [
48]. For the construction of the libraries, blood samples (200 mL) of the immunized animals were collected under strict veterinary control and the PBMCs were isolated by Ficoll gradient centrifugation (GE Healthcare, Vélizy-Villacoublay, France). For the preparation of total RNA, approximately 10
7 cells were lysed with the TRIzol reagent (ThermoFisher Scientific, Grand Island, NY, USA). Complementary DNA (cDNA) was amplified using either SuperScript IV reverse transcriptase (ThermoFischer Scientific) or the BD Smart RACE kit (BD Biosciences, San José, CA, USA). The VHH repertoires were amplified from the cDNA by two successive PCR reactions using three different primer pairs (PCR1, PCR2;
Table S2) and the VHH fragments were cloned into the SfiI/NotI restriction sites of the pHEN1 phagemid vector. After transformation into either
E. coli TG1 or XL1-blue cells by electroporation, the bacterial colonies (approximately 4 × 10
7 independent transformants per library) were infected with M13KO7 helper phage to produce the phage libraries. The recombinant phages of each library were purified by PEG 8000/NaCl precipitation and aliquots were stored at −80 °C after addition of 15% glycerol. Biopanning was performed with the phosphopeptide (0.5–5 µg/mL) coated on microtiter wells (ThermoFisher Scientific). Briefly, approximately 10
11 phages in PBS containing 5% nonfat-dried milk were added to uncoated wells for 1 h and subsequently transferred to the peptide-coated wells. After incubation at 20 °C for 1 h, the wells were extensively washed with PBS containing 0.05% Tween 20. Bound phages were eluted with trypsin and amplified in growing TG1 cells for the next round of selection. The amount of phosphopeptide coated on plate was lowered to 0.5 µg/mL in the second round of selection. Phage titers and enrichment after each panning round were determined by infecting TG1 cells with 10-fold serial dilutions of the collected phages and plating on LB agar plates containing 100 µg/mL ampicillin and 1% glucose. Where indicated, binding of the phages to antigen on plate was revealed with an anti-M13 monoclonal antibody conjugated to horse radish peroxidase (HRP; Abcam, Cambridge, UK). The VHH nucleotide sequences were determined using the M13-RP primer (GATC-Eurofins, Ebersberg, Germany).
4.2. VHH Engineering and Bacterial Production
The coding region of the selected VHHs in the pHEN1 vector were amplified by PCR with primers VHH-BspHI-Deg and VHH-NotI-short and subcloned into the pET-E6T-6H expression plasmid, a derivative of pETOM [
49], which contains in frame at the NotI site the E6 epitope tag recognized by the 4C6 mAb and a His6 tag. To generate the bivalent VHH constructs, the coding region of the VHH was amplified by SOE-PCR with the primer pairs pETOM-For/G4S-Rev and G4S-For/E6T-Rev. The G4S-Rev and G4S-For are the annealing primers to add the (G4S)
3 linker region. The recombinant fragment was cloned into the NcoI-digested pET-C6-E6T-6H plasmid after digestion with NcoI restriction enzyme, thus, generating pET-C6B-E6T-6H. To generate the C6 mutant construct, which harbors an Ala residue and an Ile residue instead of the two Arg residues at position 100C and 100D in the CDR3 region, we amplified by SOE-PCR the coding region of the C6 with primers pETOM-For and pETOM-Rev, in combination with C6-Mut-Rev and C6-Mut-For as annealing primers. The resulting PCR fragment was sub-cloned into the NcoI/NotI-digested pET-C6-E6T-6H to obtain pET-C6M-E6T-6H. The plasmid pET-C6BM-E6T-6H, which encodes the bivalent form of the mutated C6 coding region, was constructed as described above. The additional Cys residue in the coding region of the bivalent C6 was obtained by amplification of the C6 coding region with primers VHH-BspHI-For and C6-Cys-Rev and sub-cloned into the pET-C6B-E6T-6H.
The pET-C6B-mCherry and pET-C6B-dTomato plasmids were constructed by inserting in frame the coding regions of mCherry protein or dTomato protein in the unique BamHI located in the E6 tag region. The dTomato coding region was subcloned from the ptdTomato-N1 vector (Clontech, Mountain View, CA, USA). All primers used to generate the above-described plasmids are listed in
Table S2.
The VHH variants were expressed in
E. coli BL21(DE3) plysS cells by addition of IPTG (1 mM) and incubation overnight at 20 °C. The expressed polypeptides were purified as previously described [
49], except that IMAC chromatography was performed on a HITRAP
TM IMAC HP 1 mL column (GE Healthcare) loaded with nickel ions. The C6 variants with a cysteine residue at the C-terminal end of the second VHH coding region were purified on HIS TRAP
TM Excel columns (GE Healthcare) in the presence of 2 mM TCEP. All buffers used in the process were supplemented with 1 mM EDTA and 0.2 mM PMSF. Where indicated, the eluted samples were further purified by size exclusion chromatography on a Superdex 75 10/300 GL column equilibrated in 20 mM HEPES buffer pH 7.2 containing 50 mM NaCl, 1 mM EDTA, 0.1 mM PMSF and 2 mM TCEP (optional). The C6B-mCherry and C6B-dTomato fusion proteins were purified by IMAC chromatography on HITRAP
TM columns as above and subsequently polished by size exclusion chromatography on a HILOAD 16/600 Superdex 200 PG column (GE Healthcare) equilibrated in PBS. All purified proteins were stored at −80 °C after addition of 10% glycerol.
4.3. ELISA
For the ELISA assays, microtiter wells (ThermoFisher Scientific) were coated with 1 µg/mL of phosphorylated or non-phosphorylated peptide CKATQASQEY in PBS overnight at 4 °C. The purified VHH preparations were diluted in PBS containing 0.2% non-fat died milk and following incubation at RT for 1 h they were revealed with mAb 4C6 and subsequent addition of HRP-conjugated rabbit anti-mouse IgG (GE Healthcare). After several washes with PBS containing 0.1% NP40 and addition of 3′,3′,5′,5′-tetramethylbenzidine (Sigma-Aldrich, St. Louis, MO, USA), the optical density was measured at 450 nm in an ELISA reader. The data were processed with R software using the
drc package [
50].
4.4. SPR Analysis
All experiments were performed on a Biacore T200 instrument at 25 °C in HBS-P buffer containing 10 mM HEPES (pH 7.4), 150 mM NaCl, 0.05% P20 surfactant. The phosphopeptide CKATQA(p)SQEY was immobilized on the biosensor surface (BR-1005-30; GE healthcare) through the SH group of the N-terminal cysteine using thiol coupling chemistry. The reference surface was treated similarly except that peptide injection was omitted. The purified VHH samples were serially injected in duplicate for 120 s over reference and peptide surfaces. Each sample injection was followed by a wash with HBS-P buffer during 600 s. Sensorgrams were corrected for signals from the reference flow cell as well as after running buffer injections. The Kd was determined by fitting the equilibrium response (Req) versus the concentration curve to a 1:1 interaction model with the Biacore 2.0.2 evaluation software (GE Healthcare). Responses were normalized relative to phosphopeptide density as fractional occupancy (FO) of target sites [
32].
4.5. 3D Structure Determination
Purified C6 protein was incubated for 1 h with a 1.3-fold excess of phosphopeptide treated with 2 mM N-ethyl maleimide to prevent dimerization. The complexes were subjected to size exclusion chromatography on a Superdex 75 10/300 GL column (GE Healthcare) equilibrated in 20 mM HEPES buffer pH 7.2, 150 mM NaCl. The peak fractions were concentrated to 5.1 mg/mL with a Amicon Ultra 3K filter (Merck-Millipore, Burlington, MA, USA). The crystallization experiments were carried out by the sitting-drop vapor diffusion method at 20 °C using a Mosquito Crystal dispensing robot (TTP Labtech) for mixing equal volumes (200 nL) of the C6-peptide sample and reservoir solutions in 96-well 2-drop MRC crystallization plates (Molecular Dimensions). Crystallization conditions were tested using commercially available screens (Qiagen, Molecular Dimensions, Hilden, Germany). Several wells were found positive after about one week of incubation and crystals obtained with 25% PEG 3350, 0.2 M sodium acetate. The crystals were transferred to 35% PEG 3350, 0.2M sodium acetate before being flash cooled in liquid nitrogen. The data were collected at the Proxima 2A beamline of the synchrotron Soleil at a wavelength 0.98 Å (12.65 keV) on an EIGER X 9M detector (Dectris) with 20% transmission. 360° of data were collected using 0.1° oscillation and 0.025 s exposure per image, with a crystal to detector distance of 134.25 mm. The data were indexed, integrated, and scaled using XDS [
51]. The 3D structure of the C6/phosphopeptide complex was solved by molecular replacement using the PHASER module of PHENIX [
52] with the structure of VHH PorM_01 (PDB ID: 5LZ0) edited to remove water molecules and the CDR loops, being used as a search model. Refinement was performed using the refine module of PHENIX [
52] followed by iterative model building in COOT [
53]. The structural figures were prepared with Chimera-X software (
http://www.rbvi.ucsf.edu/chimerax, accessed on 29 March 2020).
4.6. Cell Culture, Transduction, Histone Preparation, Western Blotting and FACS Analysis
The H1299 and U2OS cells (laboratory stocks) were maintained in Dulbecco’s modified Eagle’s tissue culture medium (DMEM; Life Technologies, Carlsbad, CA, USA) supplemented with L-glutamine (2 mM), gentamicin (50 µg/mL) and 10% heat inactivated fetal calf serum at 37 °C in a humidified 5% CO
2 atmosphere. Fresh cells were thawed from frozen stocks after 10 passages and mycoplasma contamination was tested by DAPI staining. Counting of the cells was performed with the automated cell counter LUNA-II (Logos Biosystems, Villeneuve d’Ascq, France). Where indicated, the cells were treated with either hydroxyurea (H; 2 mM), gemcitabine (G; 0.1 µM), AZD-7762 (A; 0.1 µM), clofarabine (C; 0.3 µM), triapine (T; 2 µM), camptothecin (CPT, 1 µM), epirubicin (EPI, 0.5 µM), etoposide (ETO, 10 µM), cisplatin (CIS, 10 µM), oxaliplatin (OXA, 10 µM), or combinations of two drugs at the same concentration as indicated. The drug concentrations used are those described in a previous work [
16]. All drugs were purchased from Sigma-Aldrich.
Transduction experiments with purified C6, C6B, C6B-dTomato proteins or Fab 3F4 were performed essentially as previously described [
30]. Briefly, 10
5 cells in PBS were mixed with the protein sample (0.5–2 µg) and subjected to electroporation (1550 V, 10 msec, 3 pulses) using the Neon transfection device (Life Technologies). The treated cells were incubated for 1 h at 37 Q°C in medium and, after centrifugation for 5 min at 100×
g, the pelleted cells were seeded and allowed to recover overnight in complete medium without antibiotics before addition of the drugs.
For the purification of the histone proteins, the harvested cells (approximately 107/mL) were lysed for 10 min at 4 °C in PBS supplemented with 0.5% Triton X100, 2 mM PMSF, 0.02% NaN3 and 1 mM Na3VO4. After centrifugation for 10 min at 6500× g at 4 °C, the recovered nuclei were acid extracted overnight at 4 °C in 0.2 M HCl. The histone proteins present in the clarified lysate were stored at −20 °C.
For the analysis of the H1299 proteins by Western blotting, soluble extracts (60 μg/lane) in RIPA buffer were used. γ-H2AX and β-actin were revealed with monoclonal antibody 3F4 (0.1 μg/mL) and rabbit polyclonal serum A2066 (Sigma-Aldrich), respectively. Bound secondary HRP-labeled antibodies were revealed with ECL reagent (GE Healthcare, Chicago, IL, USA). The intensity of the relevant signals was quantified with an Image QuantLAS 4000 imager (GE Healthcare, Chicago, IL, USA) using manufacturer’s software.
Analysis of the transduced cells by FACS was performed essentially as previously described [
54]. Briefly, the cells were fixed on ice with cold 70% ethanol for 1 h. After rehydratation, the cells were treated with RNaseA (10 µg/mL) and stained with PI (3 µM) (ThermoFisher Scientific). Analysis of the cycling state was performed with a Accuri C6+
TM flow cytometer (BD Life Sciences, San Jose, CA, USA) using manufacturer’s software.
4.7. Construction of the pβ-Actin Plasmids and Transient Transfection
The pβA-scFv-eGFP, a derivative of pDRIVE-hβ-actin [
55], was modified by PCR to insert in frame to the scFv the E6 tag and the mCherry protein using E6T-HindIII-For/E6T-HindIII-Rev and mCherry-For/mCherry-Rev primer pairs, respectively. This vector, which carries unique NcoI and SpeI restriction sites, was used to sub-clone the VHH variants as described above, thereby generating pβA-C6-E6T-mCherry, pβA-C6M-E6T-mCherry, pβA-C6B-E6T-mCherry, and pβA-C6BM-E6T-mCherry. All oligonucleotides used to construct these expression vectors are listed in
Table S2.
The day before transfection, 8 × 10⁴ cells were plated in 12-well culture plates containing glass coverslips. Transient DNA transfection was performed using jetPRIME (Polyplus Transfection, Illkirch, France) according to manufacturer’s instructions. The culture medium was replaced with fresh medium after 4–24 h of incubation with the polymer/plasmid mixtures. Cells were incubated (37 °C, 5% CO2) for 40 h (hydroxyurea-treated cells) or 24 h (gemcitabine + AZD-7762-treated cells), followed by microscopic analysis.
4.8. Immunofluorescence Microscopies
For the analysis by classical immunofluorescence microscopy, the transfected or transduced cells were fixed with 4% paraformaldehyde for 20 min and, after permeabilization with 0.2% Triton X100 for 5 min, they were incubated with mAb 3F4 or VHH preparations diluted in PBS containing either 10% fetal calf serum or 2% BSA. Where indicated, the cells were treated with CSK-100 modified buffer (100 mM NaCl, 300 mM sucrose, 3 mM MgCl
2, 10 mM HEPES pH 6.8, 1 mM EGTA, and 0.2% Triton X-100) for 5 min prior to fixation. The VHH molecules were revealed by addition of mAb 4C6, which binds to the E6 tag and bound antibodies were detected with Alexa Fluor 488 or 568 labelled-anti-mouse immunoglobulins (Life Technologies). Where indicated, Alexa 568 labelled-C6B molecules were used. The labelling of the purified bivalent C6 equipped with a cysteine residue at the C-terminus was performed essentially as previously described [
30]. Briefly, purified protein in 0.1 M KH
2PO
4 pH 6.5, 150 mM NaCl, 1 mM EDTA, 250 mM sucrose was mixed with a 1.2 molar amount of Alexa Fluor 568 maleimide derivative (ThermoFisher Scientific). After adjustment of the pH at 7.5 and subsequent incubation for 1 h at room temperature, the chemical reaction was blocked with N-ethylmaleimide in excess. The mixture was centrifuged through either a Zeba spin column with a cut-off of 7 kDa (GE Healthcare) or the fluorescent dye removal column provided by Thermofischer Scientific. The amount of fluorophore per bivalent C6 in the flow-through was calculated by spectrophotometry with a Nanodrop 2000 device (ThermoFisher Scientific). After incubation of the cells with the different reagents and several washes with PBS, the coverslips were mounted with 4′,6′-diamino-2phenyl-indole (DAPI) Fluoromount-G (Southern Biotech, Birmingham, AL, USA) and imaged with a Leica DM5500 microscope (Leica, Wetzlar, Germany) equipped with 20X and 63X objectives. The signal was recorded with a Leica DFC350FX camera. Confocal microscopy was performed as previously described [
21]. All microscopy images were processed using the Fiji/Image J software. For the measurement of the nuclear fluorescence intensity, the images of microscopy fields were acquired with the 20X objective. The nuclei were set with the DAPI channel acquisition as regions of interest (ROI) and the mean fluorescence intensity in each ROI was measured using the Fiji built-in-tool and data were processed with the R software.
Widefield fluorescence microscopy was performed on a home-built system composed by a Nikon TiE inverted microscope coupled to a high-numerical aperture (NA) TIRF objective (Apo TIRF 100X, oil, NA 1.49, Nikon). Live-sample were illuminated with a laser diode at 561 nm (10 W/cm2, Oxius) at 37 °C. Real-time imaging was performed by introducing a single edge dichroic mirror and a bandpass filter in the emission path of the microscope (Semrock, 560 nm edge BrightLine single-edge imaging-flat dichroic beamsplitter, 593/40 nm BrightLine single-band bandpass filter) and by using an EM-CCD camera (ImagEM, Hamamatsu, 0.106 µm pixel size) with a typical integration time of 100 ms. The videos were recorded using the perfect focus system of the microscope to avoid z-drift during the acquisition (1 image recorded every minute during 10 min). Images were processed using Fiji. To visualize the movement of the foci, we used a filtering procedure in which two different Gaussian blurs (A = 1.3 pixel and B = 2 pixels) were applied to each image of the stack. The improved stack was obtained by computing the difference between A and B. The Mosaic plugin was then used on the final stack to reconstruct the single foci trajectories over the whole acquisition.
4.9. Statistical Analysis
Statistical analysis was performed using R software version 3.6.1. Averages are represented as means +/−SD and the number of replicates is indicated in the figure legends. In the boxplots (
Figure 2,
Figure 3,
Figure 4 and
Figure 5), the bars indicate the median and interquartile range of the recorded fluorescence after processing with R software. The statistical significance of the data obtained after transfection (
Figure 3) was determined with the Student’s
t-test and indicated as ***
p-value < 0.001. Prior to the Student’s
t-test, normality and equality of variances were tested using Shapiro–Wilk’s test and Fisher’s
F-test, respectively. For the correlation analysis (
Figure 4), normality of the data was tested using Shapiro–Wilk’s test and correlation was evidenced by calculating the Pearson’s correlation coefficient.


 ,
, 
