Simple Summary
Despite political efforts across the world and Europe, social inequalities in cancer incidence are persistent. We studied the association between socioeconomic status (SES) and cancer incidence in nine Spanish provinces. Lower SES was associated with an increased risk of lung cancer among males. Higher SES was associated with an increased risk of breast cancer among females in Spain. Understanding the reasons behind the association between cancer incidence and SES could help develop appropriate public health programs to promote health and reduce socioeconomic inequalities in cancer incidence in Spain.
Abstract
Socioeconomic inequalities in cancer incidence are not well documented in southern Europe. We aim to study the association between socioeconomic status (SES) and colorectal, lung, and breast cancer incidence in Spain. We conducted a multilevel study using data from Spanish population-based cancer registries, including incident cases diagnosed for the period 2010–2013 in nine Spanish provinces. We used Poisson mixed-effects models, including the census tract as a random intercept, to derive cancer incidence rate ratios by SES, adjusted for age and calendar year. Male adults with the lowest SES, compared to those with the highest SES, showed weak evidence of being at increased risk of lung cancer (risk ratio (RR): 1.18, 95% CI: 0.94–1.46) but showed moderate evidence of being at reduced risk of colorectal cancer (RR: 0.84, 95% CI: 0.74–0.97). Female adults with the lowest SES, compared to those with the highest SES, showed strong evidence of lower breast cancer incidence with 24% decreased risk (RR: 0.76, 95% CI: 0.68–0.85). Among females, we did not find evidence of an association between SES and lung or colorectal cancer. The associations found between SES and cancer incidence in Spain are consistent with those obtained in other European countries.
1. Introduction
The burden of cancer is rising globally, exerting a significant strain on populations and health systems at all income levels. Given the sociodemographic change in Western societies, cancer control will be one of the most complex health challenges in the future [1]. Estimates of population-based cancer incidence serve to evaluate cancer’s burden on health systems worldwide [2]. Despite political efforts across the world and Europe, social inequalities in cancer incidence are a persistent problem [3]. Social inequalities in cancer outcomes have an economic impact on healthcare costs [4]. Thus, identifying and characterizing socioeconomic and geographic disparities in cancer outcomes helps optimize and redistribute healthcare services in a more equitable fashion.
In northern Europe, there is a long-standing tradition of measuring deprivation in small geographical areas but not in Spain [5]. Recently, a standardized measure of socioeconomic deprivation covering Spain’s whole territory has been developed using the national census data from 2011, namely, the Spanish Deprivation Index (SDI). The index allows one to characterize and compare socioeconomic inequalities in cancer outcomes as a function of census tracts [6].
Using this newly developed index, we aim to study the association between socioeconomic inequalities and cancer incidence for three anatomical sites from the European High Resolution Studies [7] (i.e., colorectal, lung, and breast cancers) in Spain. Furthermore, we aim to investigate how cancer incidence varies geographically in small areas after accounting for age and the SDI in Spain during the period 2010–2013.
2. Materials and Methods
2.1. Study Design, Participants, Data, and Setting
We developed a population-based multilevel study. Data were drawn from nine Spanish population-based cancer registries (Albacete, Bizkaia, Castellón, Cuenca, Girona, Gipuzkoa, Granada, Navarra, and Tarragona) that participated in the European High Resolution Studies (TRANSCAN-HIGHCARE project within ERA-Net) [7]. Supplementary Figure S1 shows the location, within peninsular Spain, of the nine provinces of the study. Colorectal, lung, and breast cancer cases >18 years and diagnosed during the period 2010–2013 by census tract level, including their age, sex, and year of diagnosis, were included in the study. Case codes were C18–C21 with malignant behavior (/3) for colorectal, C34.0–C34.9 with malignant behavior (/3) for lung, and C50.0–C50.9 with malignant behavior (/3) or in situ (/2) for breast cancer among females according to the topography code of the International Classification of Diseases for Oncology, 3rd Edition [8]. Colorectal cancer data were used in a previous work to assess socioeconomic inequalities (measured with SDI) on survival in Spain [9].
Population-based figures broken down by census tract level, age, calendar year, and sex were obtained from the Spanish Statistical Office. The SDI was created by Duque et al. [6] using data from the Spanish 2011 census conducted by the Spanish National Statistics Institute. The index includes information from six indicators mainly related to employment and education: percentage of manual workers (employed or unemployed), percentage of occasional workers (employed or unemployed), percentage of the population with insufficient education, and percentage of main homes without internet access [6]. The index has no direct information about income, but in the sensitivity analysis, we found a direct association between SDI and average income per census tract [10] (Supplementary Figure S2). We used the SDI divided in quintiles (Q), where Q5 represents the most deprived areas and Q1 the least deprived areas.
The internal review board of the Andalusian School of Public Health (CP17/00206) and the biomedical ethics committee of the Department of Health of the Andalusian Regional Government (study 0072-N-18) approved the study protocol.
2.2. Statistical Analysis
In the descriptive analysis, we first estimated the crude rates per 100,000 people for the overall period and by the quintiles of deprivation, categories of age, and sex. To compute the incidence rates, we used the total population at risk for the analyzed period. Afterward, we computed univariable- and multivariable-adjusted rate ratios using a Poisson mixed-effects model [11]. Models were stratified by sex. We added one variable at a time to control for confounding and used robust standard errors to account for overdispersion [12]. The final model was adjusted for SDI quintile, age in years, and calendar year. The model specification was given by
where Q is the random intercept for census tracts.
ln(cases/population) = β0 + β1 × (Quintile SDI) + β2 × (Age) + β3 × (Calendar year) + Q
We included the census tract as a random intercept (Q in (1)) to account for spatial heterogeneity. From the models, we derived the Empirical Bayesian Estimate to identify patterns of non-random variation in cancer incidence in Spain [13]. Using the posterior Empirical Bayesian prediction, we mapped the age- and SES-standardized cancer incidence smoothed rates adjusted for the SDI by census tract in Spain for colorectal, lung, and breast cancers.
We assessed different model specifications in the sensitivity analysis, including the non-linearity effect of age using restricted cubic splines. Furthermore, we assessed the consistency of the reported cancer incidence rates by calendar year and cancer registry with published evidence in official statistical sources [14].
We used Stata v.16.1 (StataCorp, College Station, TX, USA) [15] and R v.4.0.2 (R Foundation for Statistical Computing, Vienna, Austria) [16] for statistical analysis.
3. Results
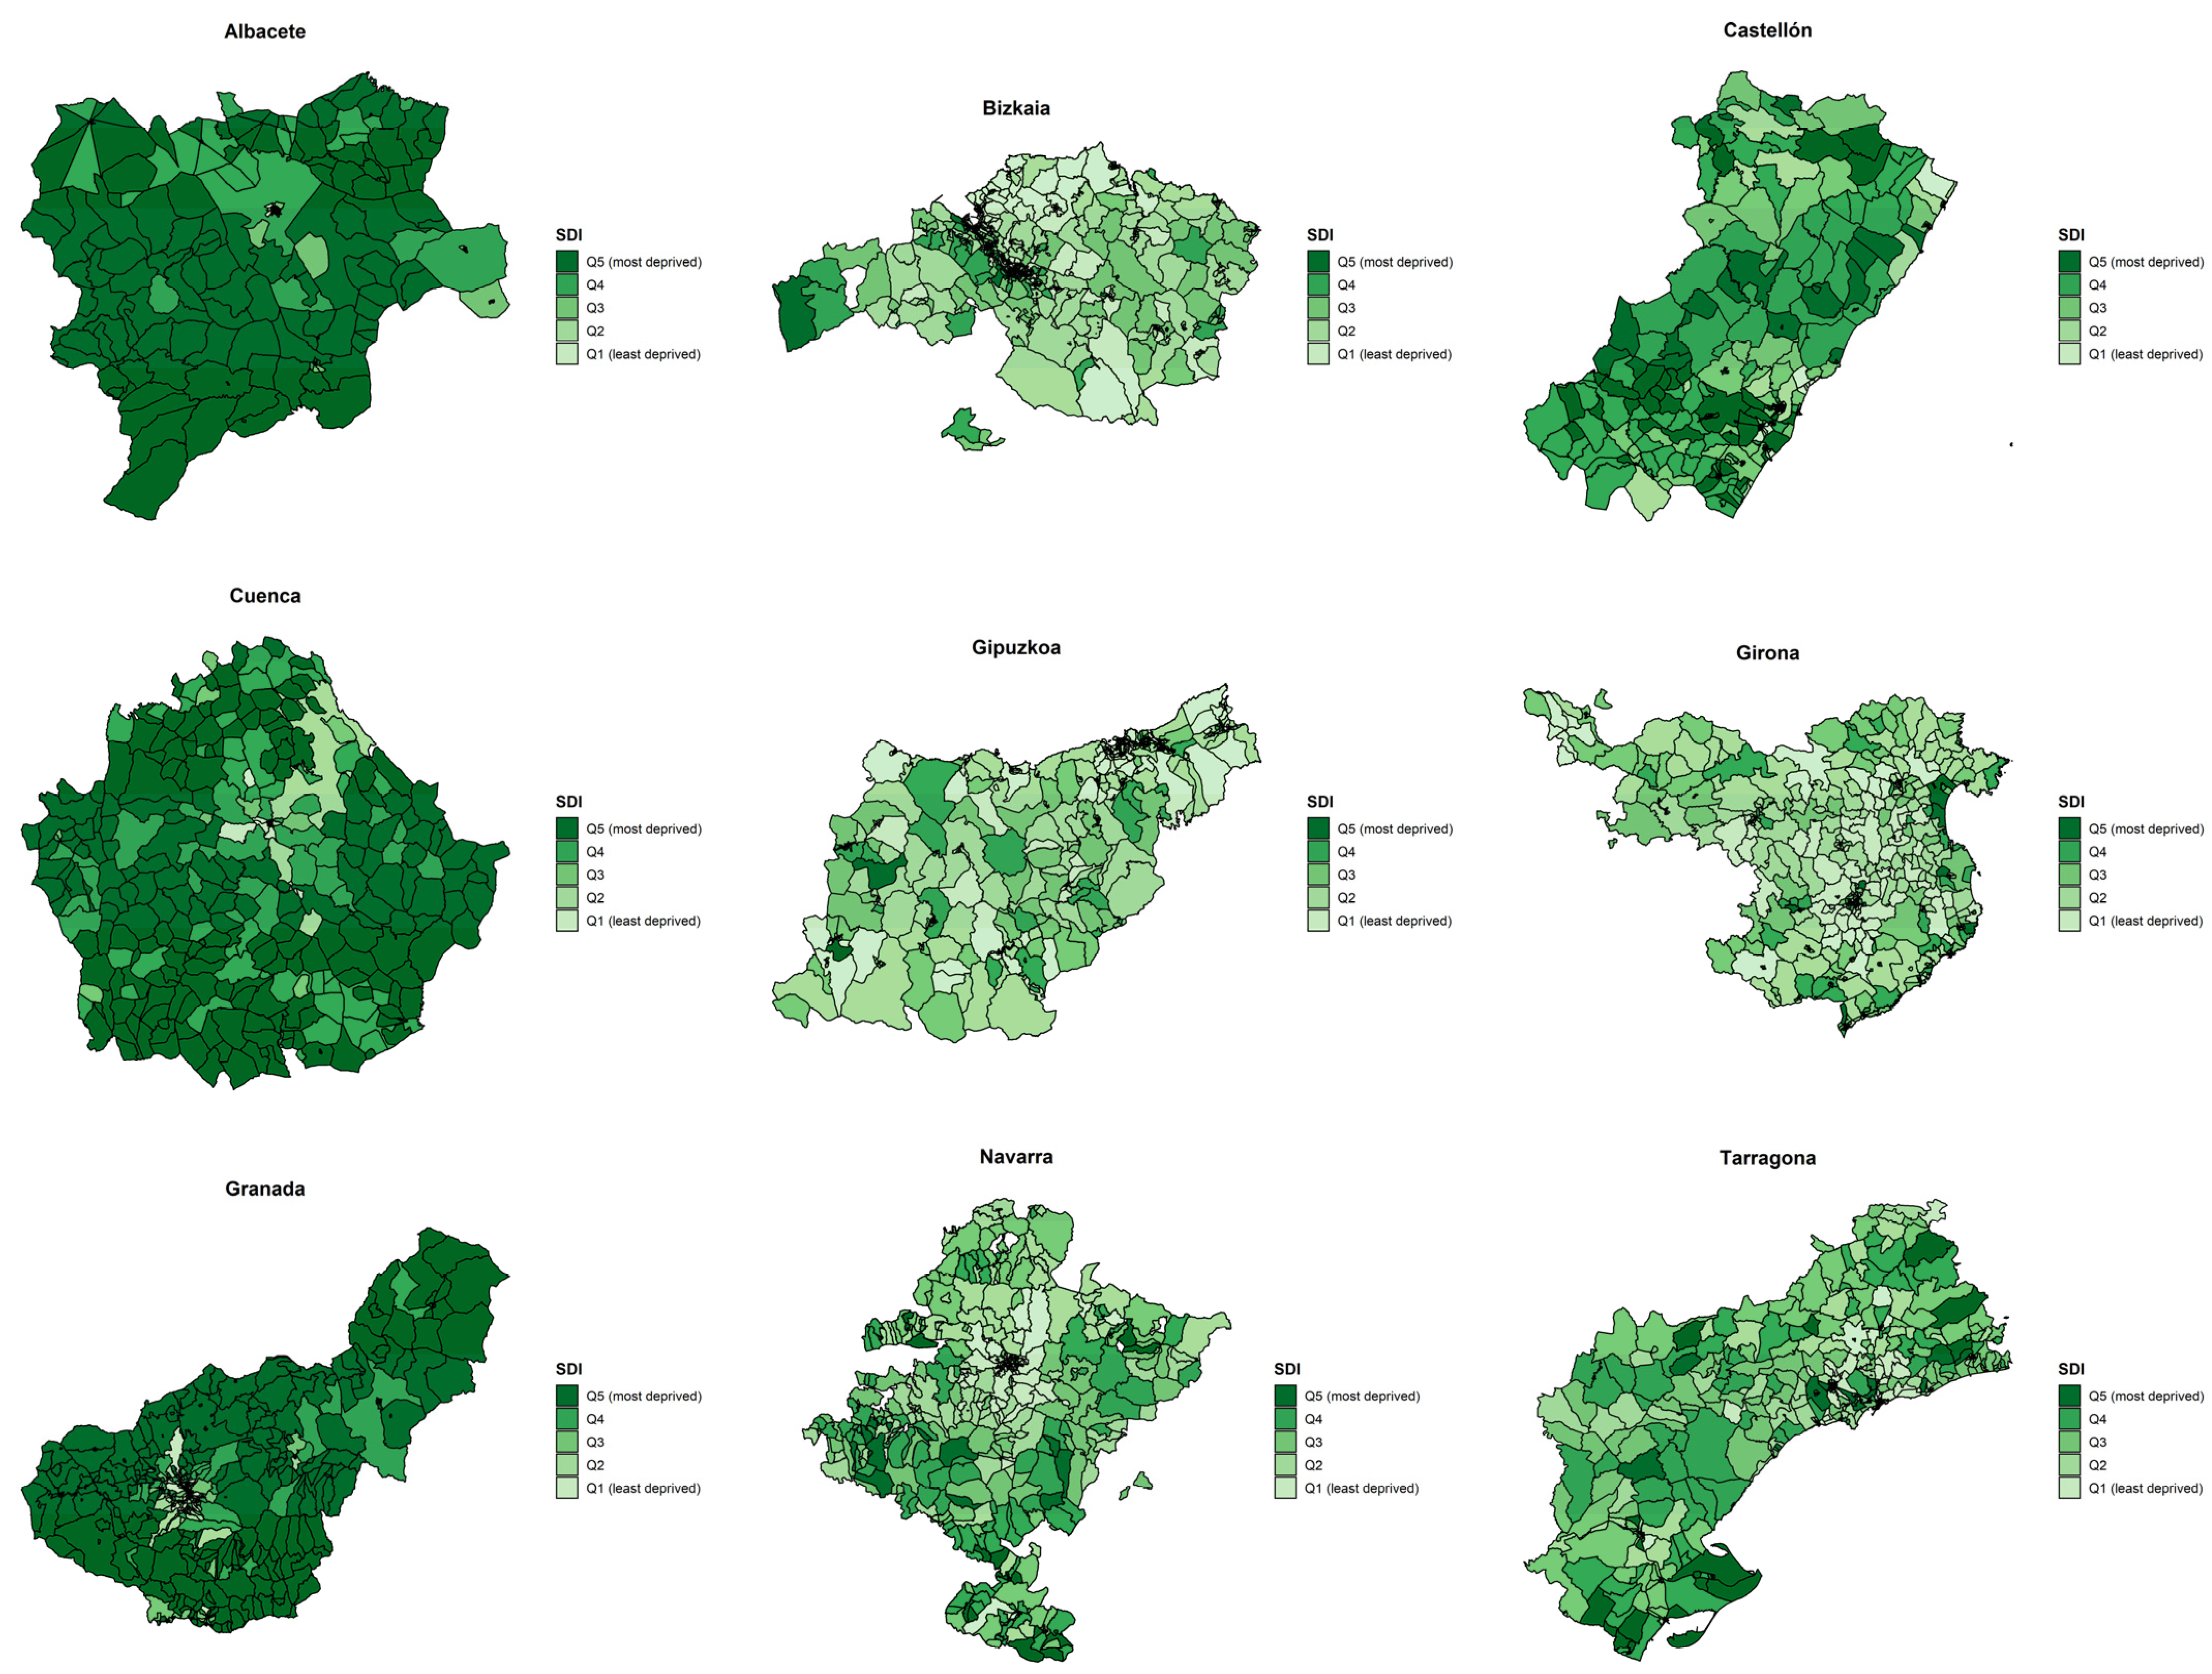
Figure 1 shows the SDI quintiles’ spatial distribution in 2011 by census tract for the nine Spanish provinces under study. Overall, there was a north–south pattern with the highest deprivation in the southern provinces (Granada, Albacete, and Cuenca) compared to those in the north of Spain (Bizkaia, Gipuzkoa, Girona, Navarra, and Tarragona). The province of Castellón showed an intermediate pattern between the northern and southern provinces. Supplementary Figure S3 shows the spatial distribution of the quintiles of SDI in the provinces’ capitals.
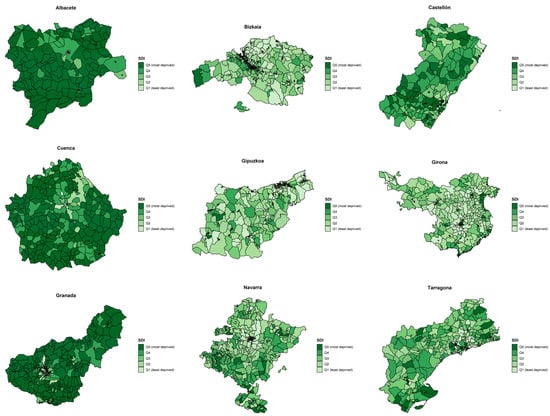
Figure 1.
Quintiles of the Spanish Deprivation Index (SDI) by census tract in the nine Spanish provinces under study, 2011.
Table 1 shows the total number of cancer cases, the population at risk, and the observed incidence rates per 100,000 people during the period 2010–2013 by cancer site, sex, quintiles of deprivation, and age groups.

Table 1.
Cancer incidence, population at risk, incidence rate per 100,000 people, and p-value for trend by sex, deprivation, and age groups in Spain for the period 2010–2013.
There were 3823 colorectal cancer cases and 6,147,118 people at risk in seven Spanish provinces during the period 2010–2013. Males showed a higher crude rate than females (77.4 per 100,000 males vs. 47.2 per 100,000 females). The crude incidence rate increased with age for both males and females, and, with quintiles of deprivation, only for females. Females with colorectal cancer living in the most deprived areas (i.e., Q5) showed 51.4 cases per 100,000 vs. 43.1 cases per 100,000 among females living in the least deprived areas (i.e., Q1).
There were 1067 lung cancer cases and 2,604,131 people at risk in two Spanish provinces during 2011–2012. Lung cancer risk increased with age for both males and females and with quintiles of deprivation only among males. Males with lung cancer living in the most deprived areas (i.e., Q5) showed a rate of 85.4 cases per 100,000 vs. 59.0 cases per 100,000 among males living in the least deprived areas (i.e., Q1).
There were 3157 breast cancer cases and 2,902,468 females at risk in six Spanish provinces during the period 2010–2013. Breast cancer incidence risk increased with age and decreased with deprivation levels (i.e., women living in the most deprived areas had a lower breast cancer incidence risk). Females with breast cancer living in the most deprived areas (i.e., Q5) showed a rate of 98.5 cases per 100,000 vs. 127.1 cases per 100,000 among females living in the least deprived areas (i.e., Q1).
Table 2 shows the cancer incidence risk by sex, adjusted for deprivation, age, calendar year, and accounting for the correlation within census tracts for colorectal, lung, and breast cancer during the period 2010–2013. After adjusting for age and calendar year (Model 3), the incidence risk of colorectal cancer among males living in the most deprived areas was 16% lower than for the males with colorectal cancer living in the least deprived areas (i.e., incidence rate ratio (IRR) Q5 vs. Q1: 0.84, 95% CI: 0.74–0.97). In females, there was no evidence of an association between deprivation and colorectal cancer incidence risk. There was weak evidence of an increased lung cancer incidence risk among the most deprived males (i.e., IRR Q5 vs. Q1: 1.18, 95% CI: 0.94–1.46) but not among women. For breast cancer, women from the least deprived areas showed an increased risk compared to women from the most deprived areas (i.e., IRR Q5 vs. Q1: 0.76, 95% CI: 0.68–0.85).

Table 2.
Cancer incidence rates ratios by sex, adjusted for deprivation and age in Spain for the period 2010–2013.
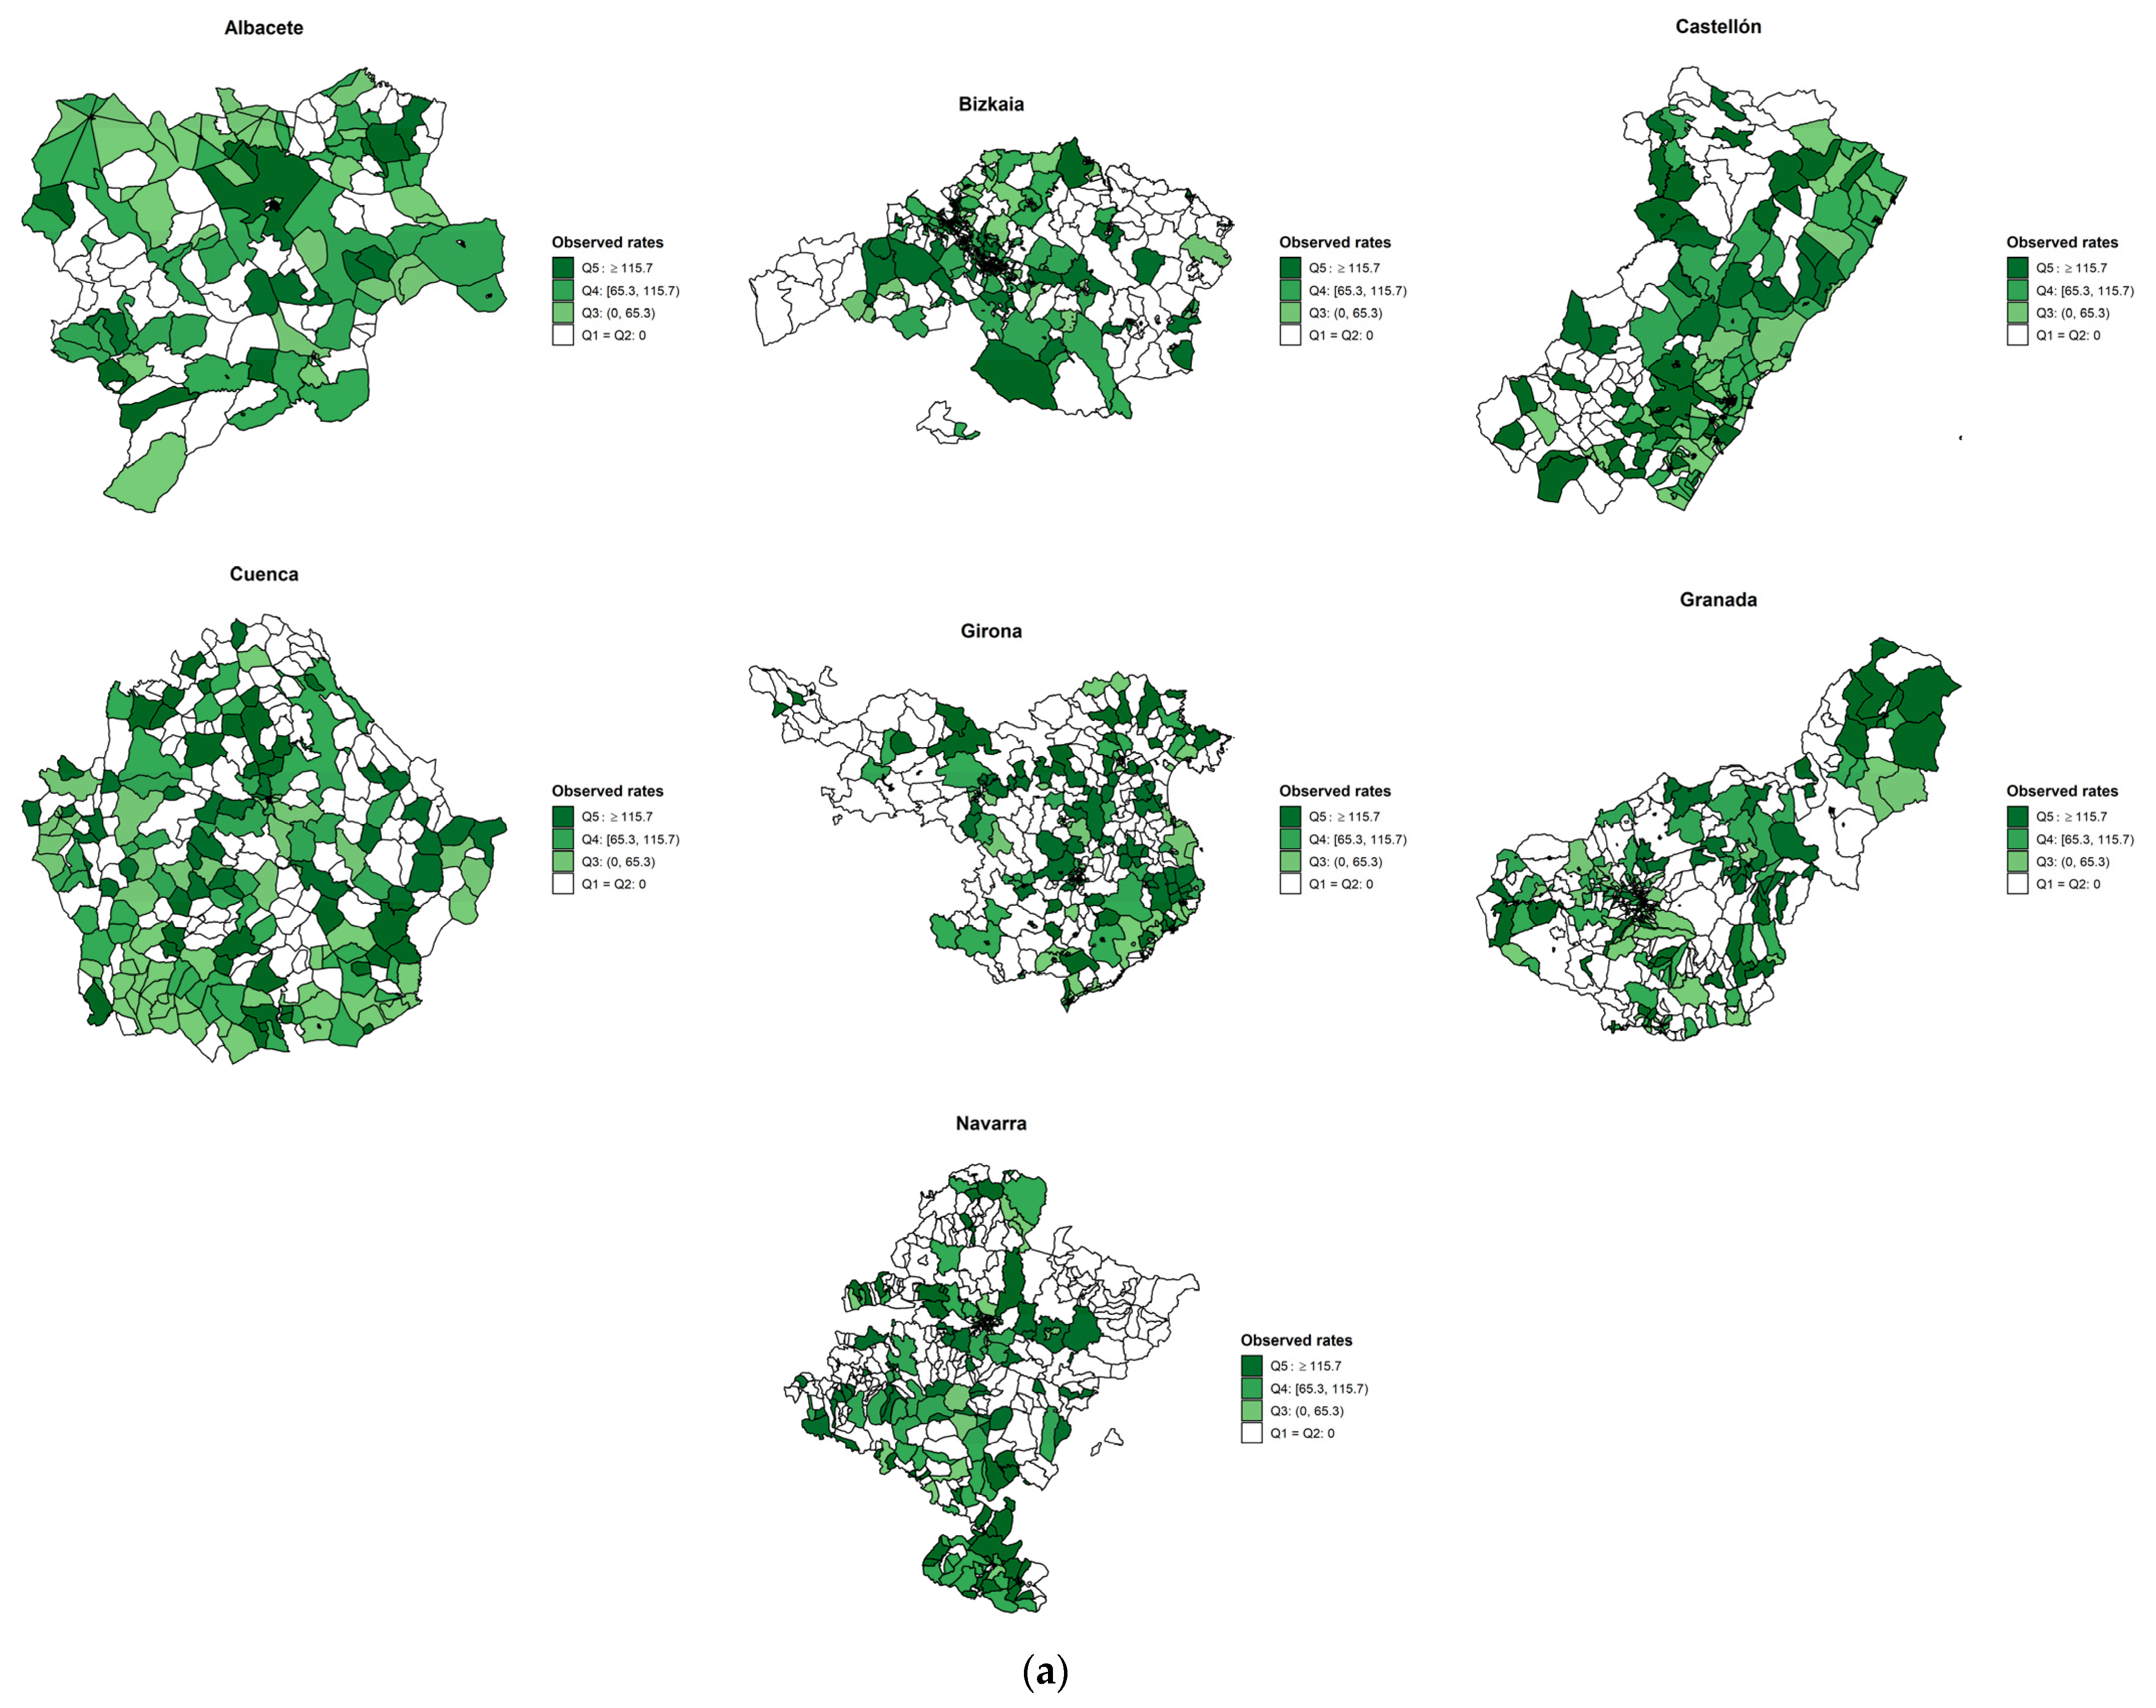
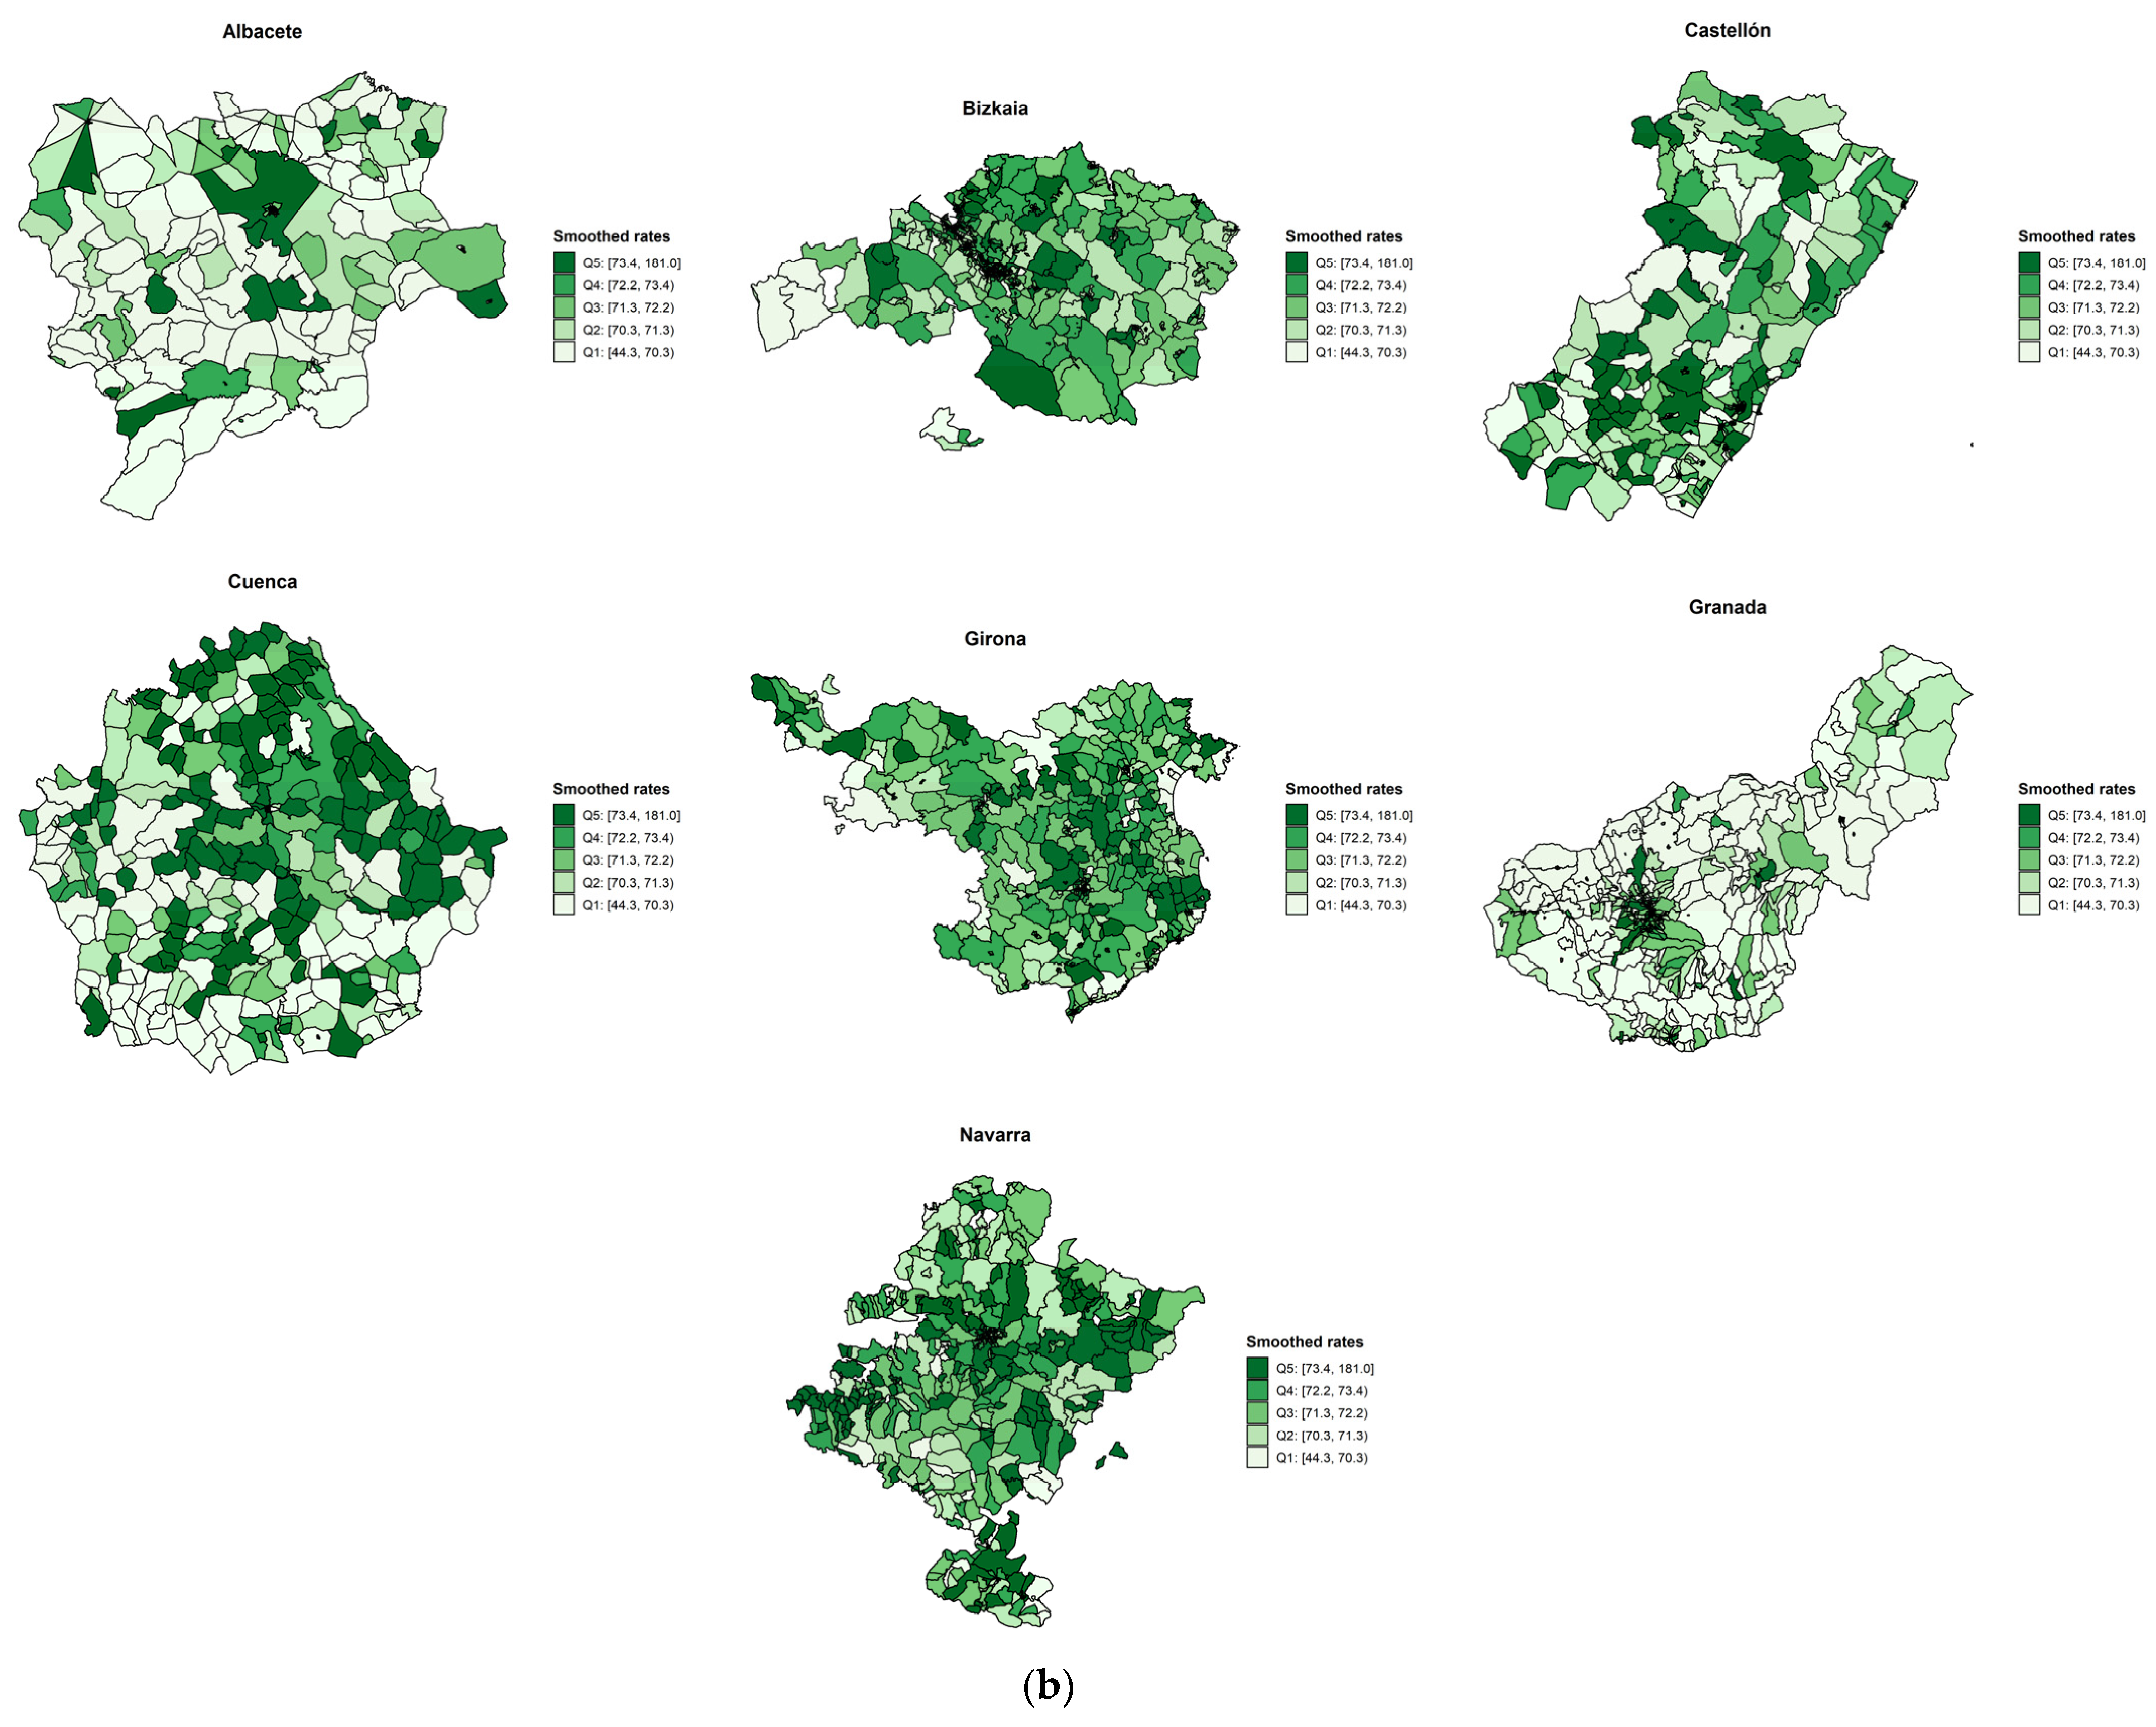
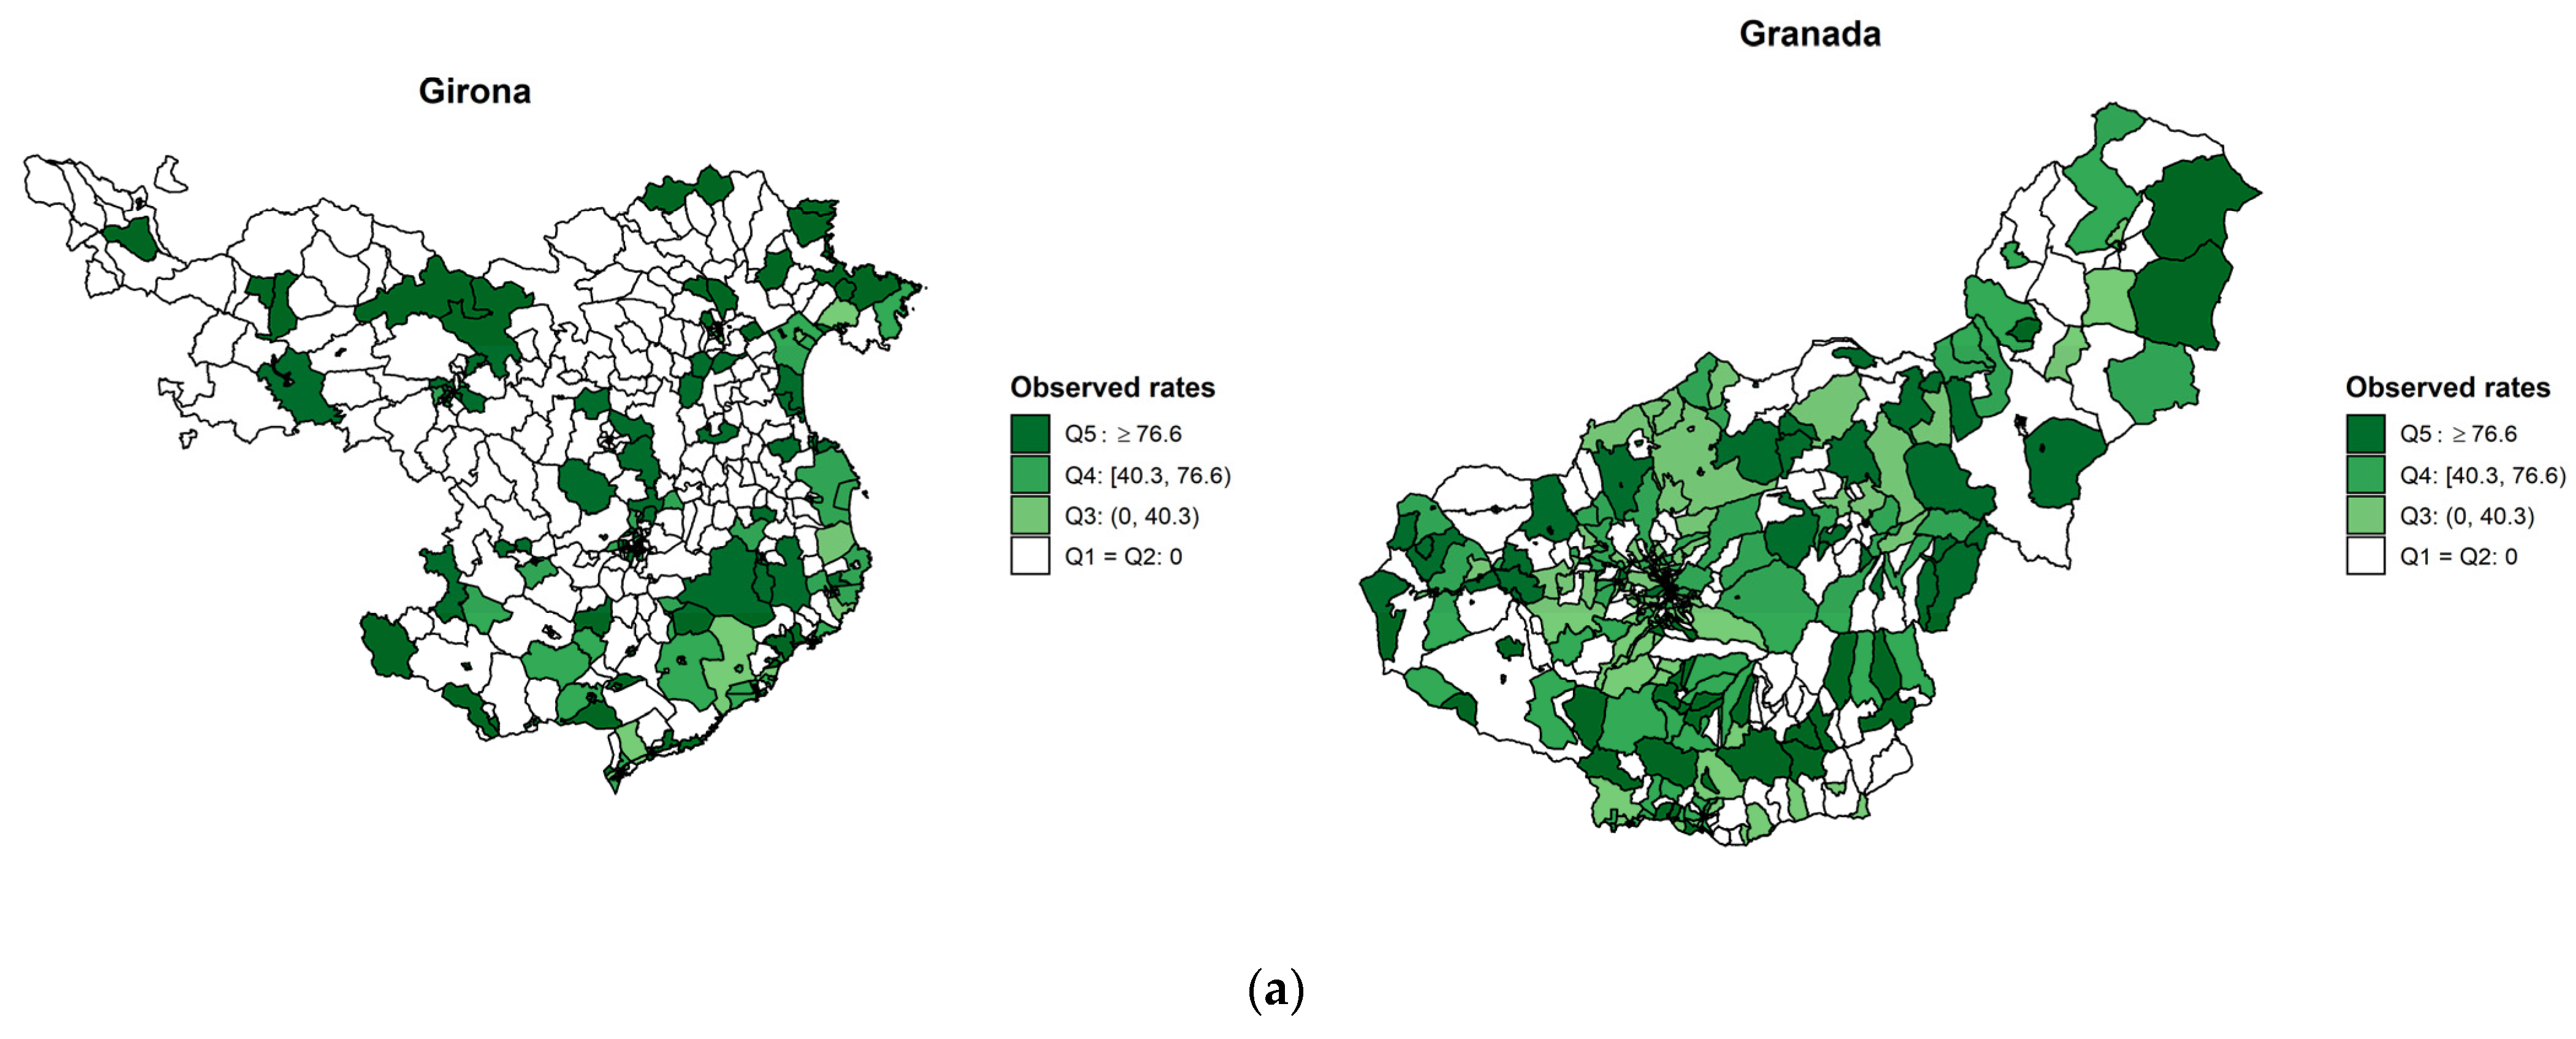
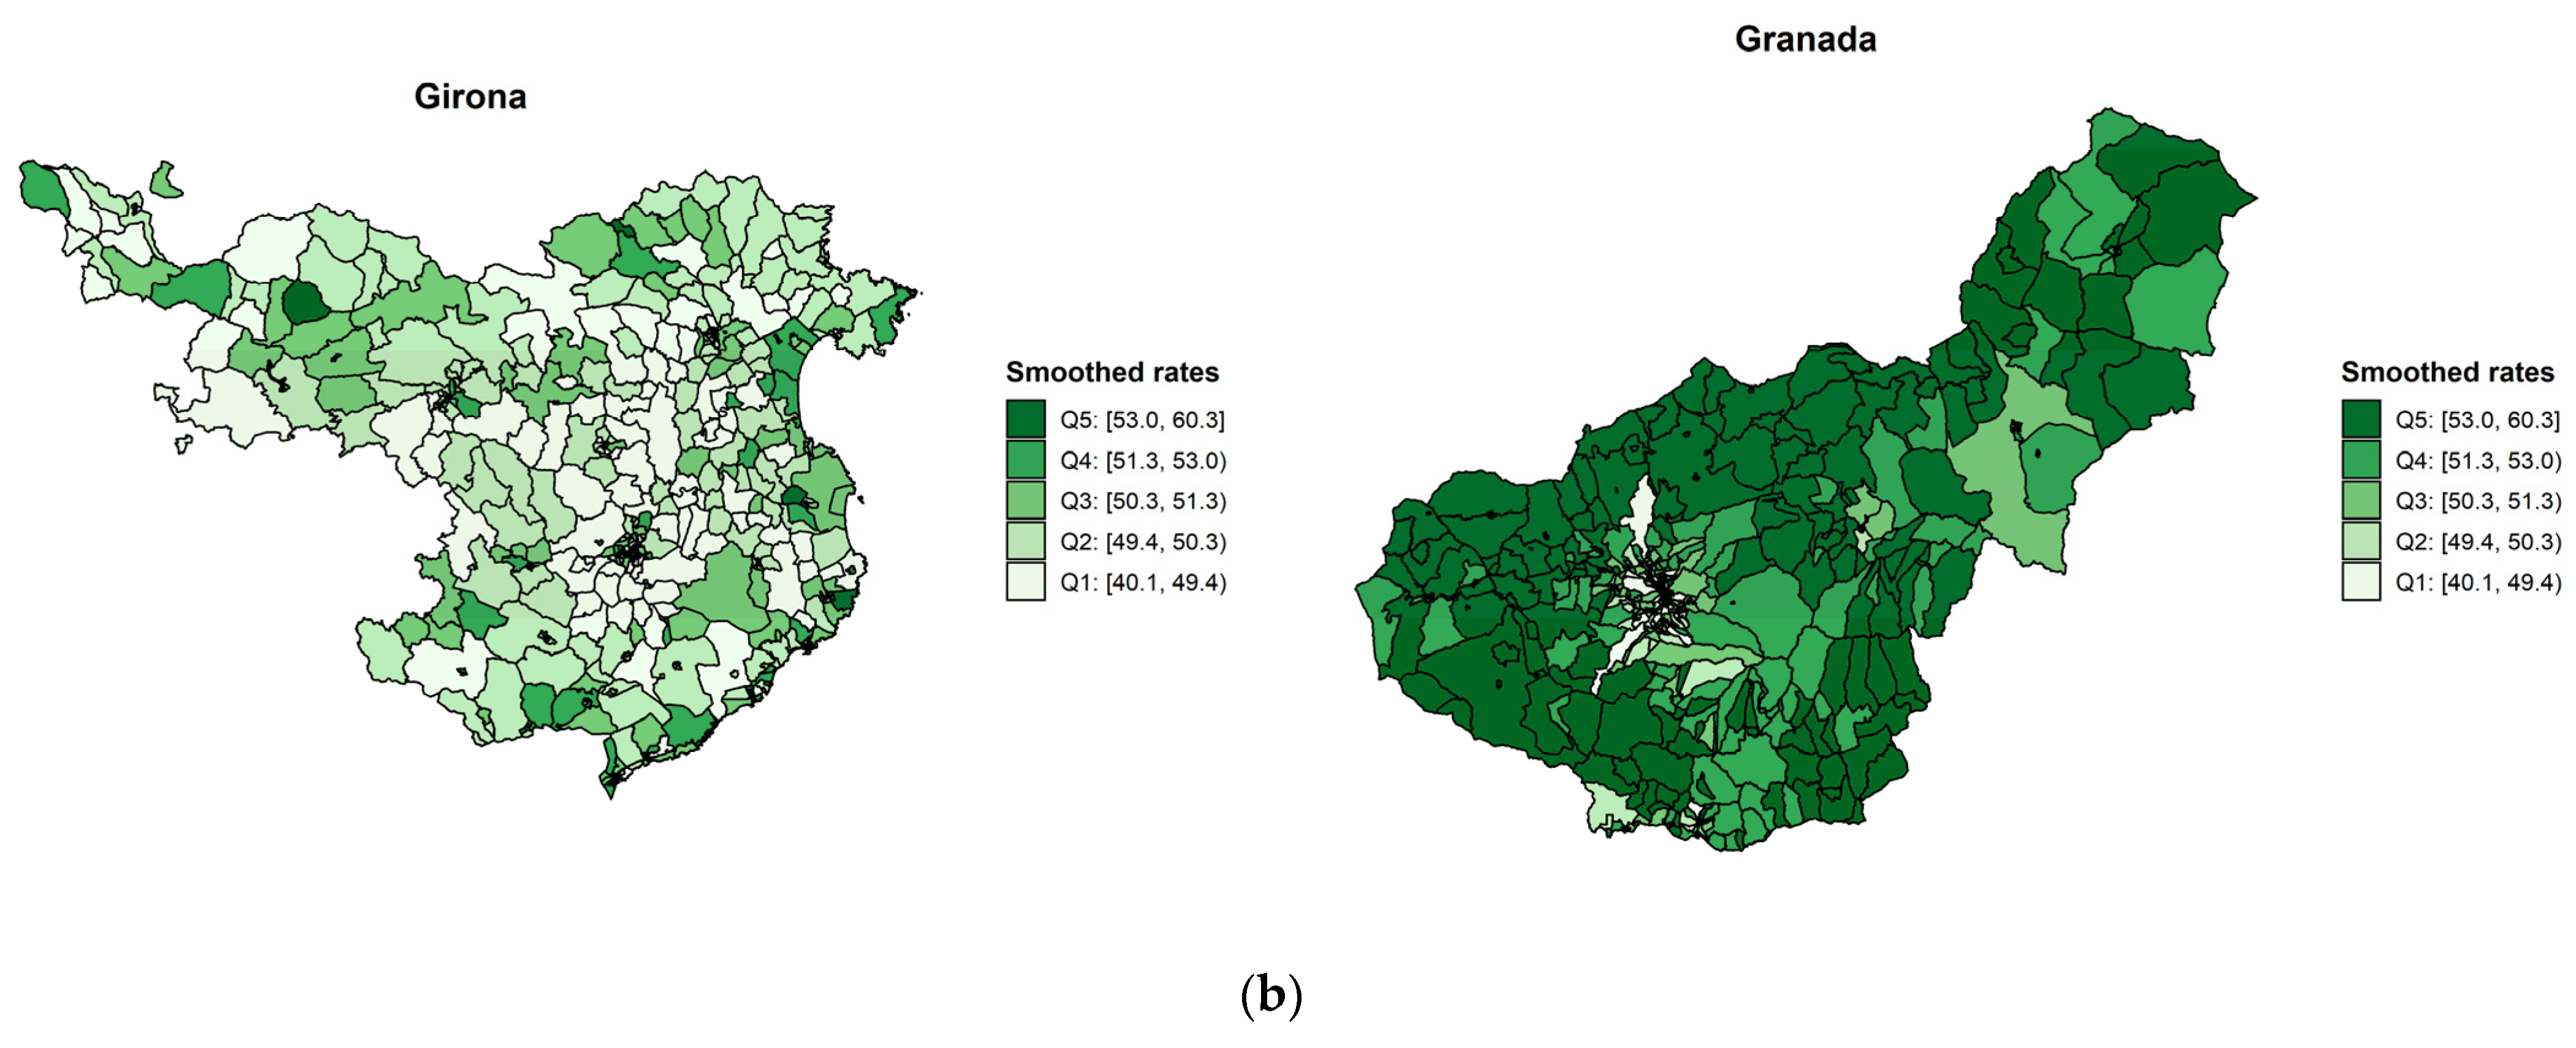
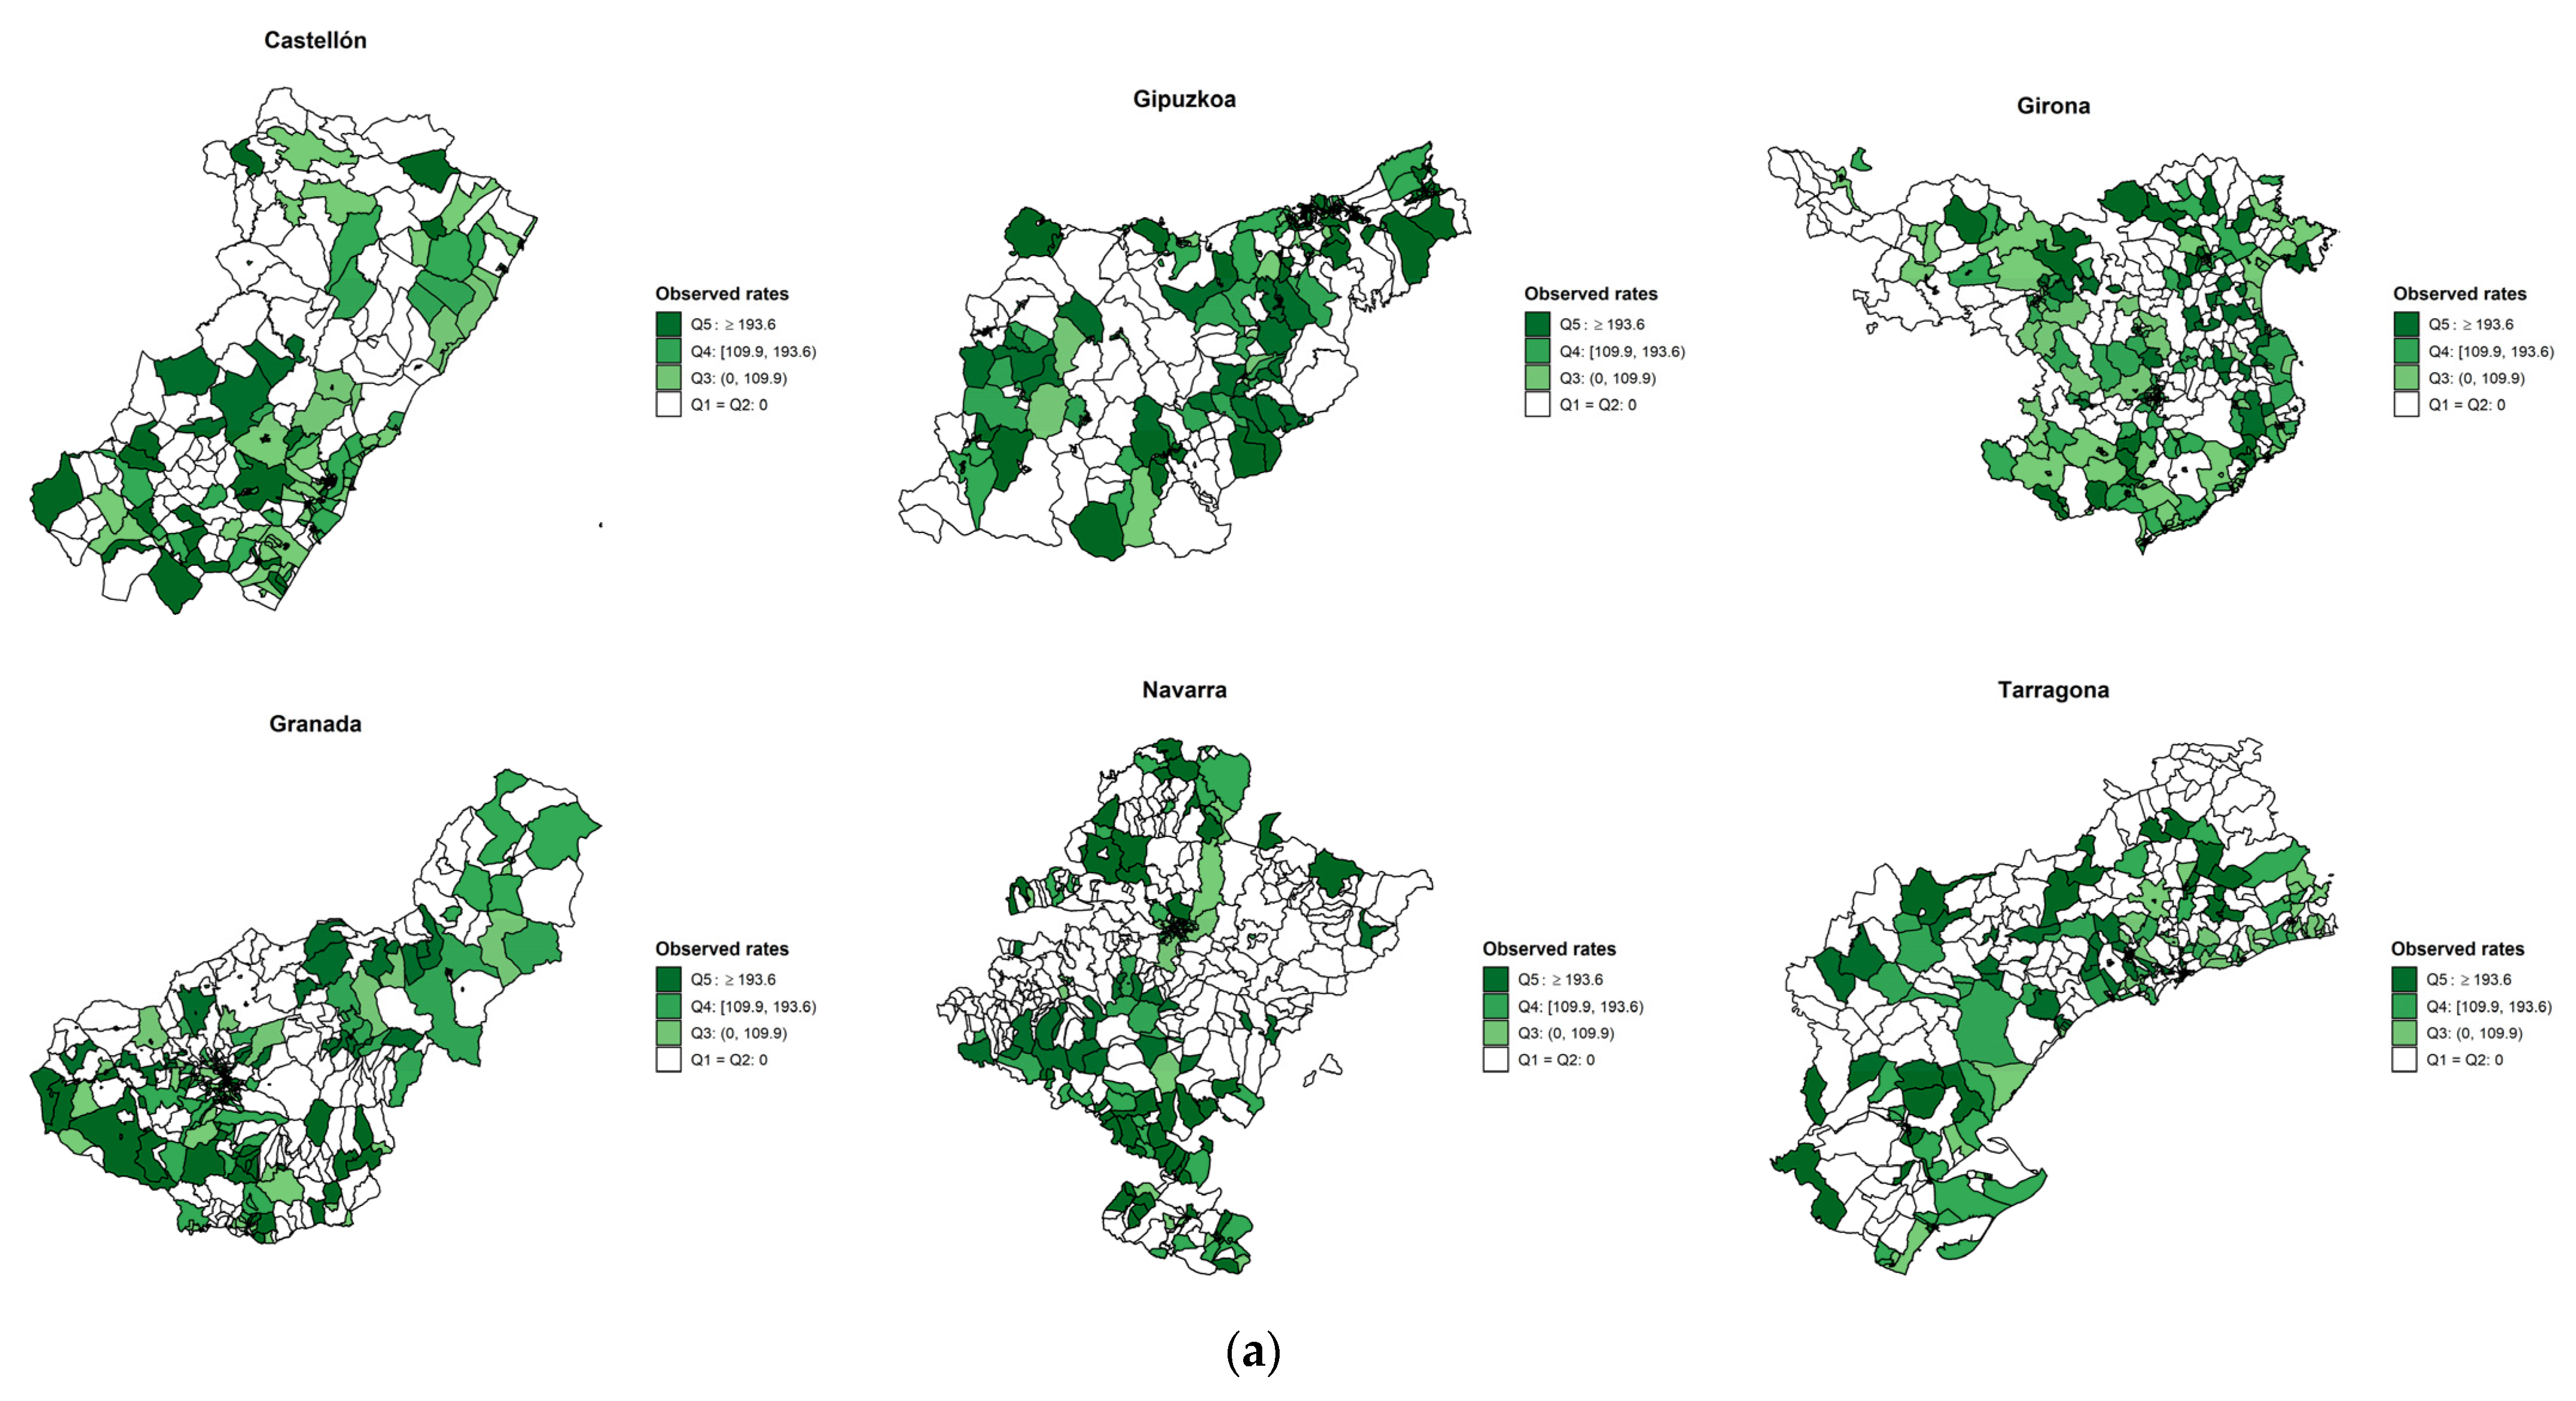
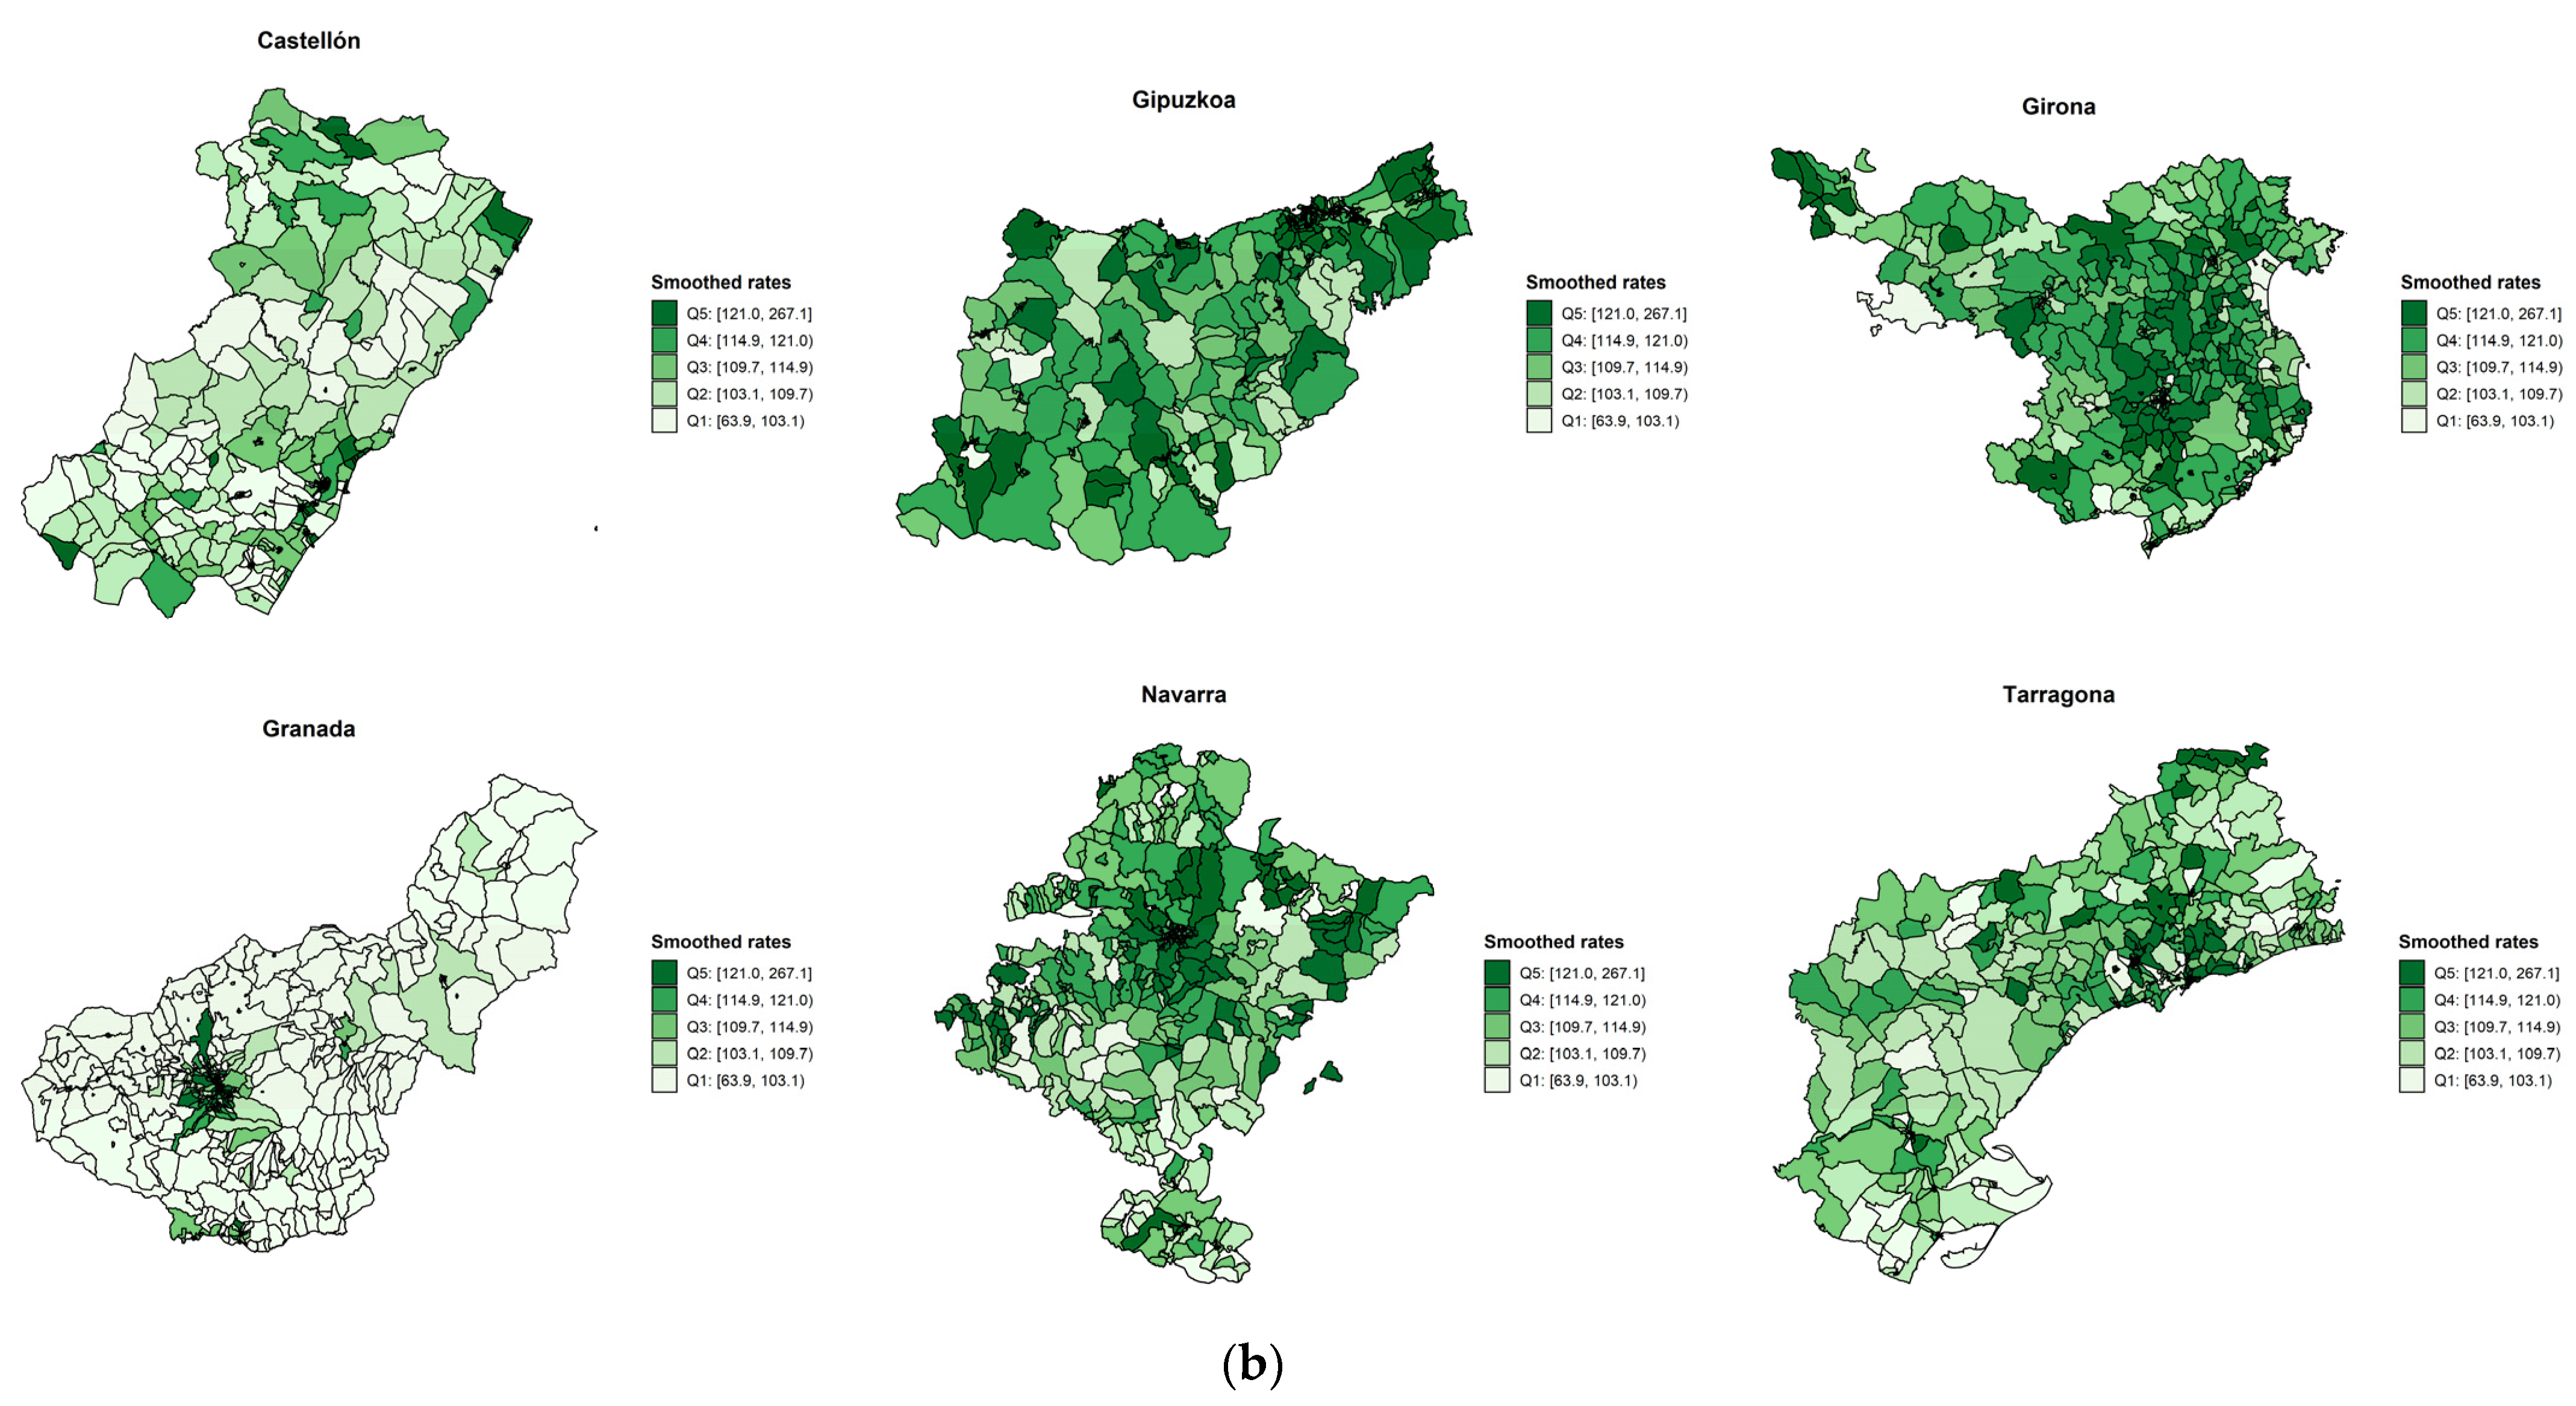
Figure 2, Figure 3 and Figure 4 show the observed and age- and SES-standardized incidence smoothed rates by census tracts for colorectal, lung, and breast cancers. The pattern of smoothed rates for colorectal cancer was characterized by a higher cancer incidence risk in northern Spanish provinces (i.e., Bizkaia, Girona, and Navarra) than in southern provinces (i.e., Granada and Albacete) (Figure 2). For lung cancer, Granada showed a higher risk than Girona (Figure 3). However, for breast cancer, the same north–south pattern was present, showing higher smoothed incidence rates in the northern provinces (i.e., Gipuzkoa, Navarra, Girona, and Tarragona) compared to the southern province of Granada (Figure 4). Furthermore, there was a north–south pattern regarding the spatial heterogeneity of the smoothed rates. The pattern was characterized by a higher heterogeneity of the rates in northern provinces than southern provinces except for lung cancer, where Granada showed a homogenous higher risk than Girona. Overall, for breast and colorectal cancer, the risk was higher in the census tracts from the province’s capital (Supplementary Figures S4 and S6), while the opposite pattern was found for lung cancer (Supplementary Figure S5).
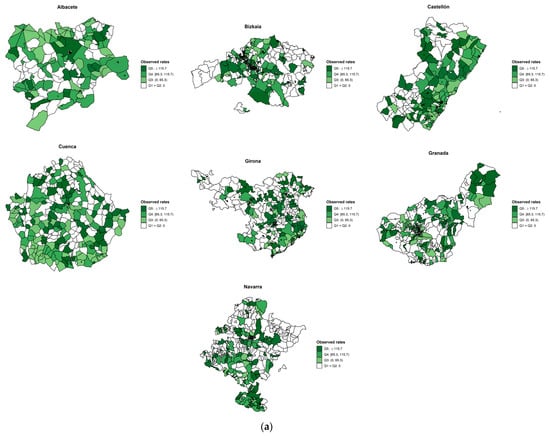
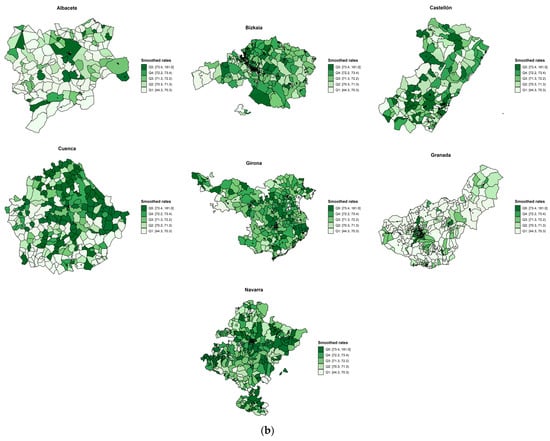
Figure 2.
(a) Observed colorectal incidence rates and (b) smoothed cancer incidence rates adjusted for deprivation and age by census tract in seven Spanish provinces during the period 2010–2013.
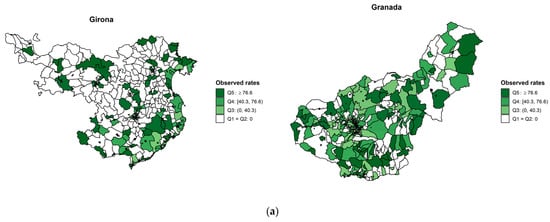
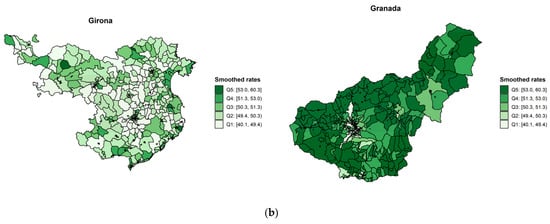
Figure 3.
(a) Lung observed incidence rates and (b) smoothed cancer incidence rates adjusted for deprivation and age by census tract in two Spanish provinces during the period 2011–2012.
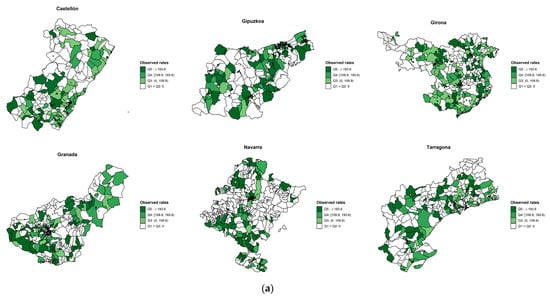
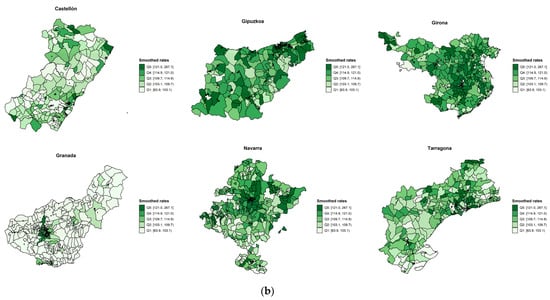
Figure 4.
(a) Breast observed incidence rates and (b) smoothed cancer incidence rates adjusted for deprivation and age by census tract in seven Spanish provinces during the period 2010–2013.
Including the non-linear effect of age did not improve the overall model goodness of fit in the sensitivity analyses. Furthermore, the reported incidence rates were consistent with previously published evidence from official sources [17].
4. Discussion
We found that males with the lowest SES showed an increased risk of lung cancer incidence and a reduced risk of colorectal cancer incidence than those with the highest SES. Females with the lowest SES had a reduction in breast cancer incidence. Among women, we did not find evidence of an association between SES and lung or colorectal cancer.
Overall, our results are consistent with current evidence from population-based studies regarding cancer incidence and SES in Europe [18]. Low SES was associated with an increased risk of lung cancer in Denmark [19], England [20,21], France [22,23], Germany [24,25,26], Ireland [27], Italy [28], Slovenia [29], Sweden [30], and Scotland [31,32]. We found the same result in men, but the risk was not clear in women, perhaps due to the reduced number of cases. Furthermore, we found an inverse association between SES and breast cancer risk characterized by an increased risk among women with higher SES than those with lower SES. Likewise, the same pattern was found in England [21], France [22], Germany [24,25], Ireland [27], Italy [28], Scotland [32], and Slovenia [29]. However, there is a varying pattern of colorectal cancer incidence risk in Europe. Low SES was associated with an increased risk in England [21], Germany [25,26], and Scotland [31], while in other European countries, there was a reverse association or no association at all [18,23,24,27,29,33]. In our study, we found that males of more deprived areas were at a lower risk of colorectal cancer. We argue that it might be that there are two distinguished patterns of colorectal cancer risk in Europe related to lifestyle and cultural risk factors associated with SES [34]. However, more evidence is needed based on large periods and sample sizes. Furthermore, differences in the availability and impact of colorectal and breast cancer regional screening programs [35] might be associated with differences in the geographical distribution of cancer incidence rates.
4.1. Strengths
To the best of our knowledge, this is the first time that the association between area level SES and cancer incidence has been assessed in several Spanish provinces in a population-based study. Our study adds evidence regarding socioeconomic inequalities in cancer incidence around southern Europe. Furthermore, our results are consistent with other European countries and previous studies from Spain’s northeast region [36].
The number of incident cancer cases reported by calendar year for the majority of cancer registries was exhaustive. Supplementary Tables S1–S3 show the distribution of the number of cases by anatomical site, year of diagnosis, and province. In the sensitivity analysis, we compared the reported incidence rates in our study by province and calendar year in the period 2011–2013 with official published statistics elsewhere [17]. Our study’s reported cancer incidence rates were consistent with the European Cancer Information System [17]. Even if there was no information from all the Spanish provinces in our study, most of the Spanish population-based cancer registries participated in the study, and the socioeconomic north–south gradient was well represented.
4.2. Limitations
Individual information on SES is often difficult to obtain due to ethical issues. Usually, it is not available at the population level, and cancer registries use census tracts and aggregated deprivation measures. SDI is not used as a proxy of individual SES but a measure of the contextual effect of living in a census tract with a specific SES. We highlight the importance of interpreting findings at the population level to minimize ecological fallacy risk. It has recently been shown that, in England and Wales, the average socioeconomic status at the area level correlates poorly with the individual SES in higher heterogeneity areas (i.e., ecological fallacy) [37]. Moreover, in our study, the SDI was derived for 2011, while cancer incidence is measured for the period 2010–2013. However, evidence shows that the aggregated measures of socioeconomic inequalities are consistent over time [38].
Finally, we suggest caution in interpreting the spatial patterns we identified. There is no significant random variability due to the short period under study and the limited number of cancer cases.
5. Conclusions
The study evaluates the association between socioeconomic inequalities and colorectal, lung, and breast cancer incidence in nine Spanish provinces during the period 2010–2013. The findings are consistent with other European countries, showing the association between socioeconomic inequalities and lung cancer among men and reduced breast cancer incidence among women with lower SES. Studying the causes of these associations could help develop appropriate public health programs to promote health and reduce socioeconomic inequalities in cancer incidence in Spain. Further collaborative studies are required to update the assessment of socioeconomic inequalities in colorectal, lung, and breast cancers over time in Spain and to evaluate public health programs.
Supplementary Materials
The following are available online at https://www.mdpi.com/article/10.3390/cancers13112820/s1, Figure S1: Map of peninsular Spain with the provinces of the study highlighted by anatomical site: (a) colorectum, (b) lung, (c) breast, Figure S2: Spanish deprivation index (2011) and average income (in EUR) per person (2015) by census tract in Spain, with generalized additive model (GAM) smoothing, Figure S3: Quintiles of the Spanish Deprivation Index (SDI) by census tract in the capitals of the nine Spanish provinces under study, 2011, Figure S4: Colorectal cancer smoothed cancer incidence rates adjusted for deprivation and age by census tract in the area of the capital of province in seven Spanish provinces during the period 2010–2013, Figure S5: Lung cancer smoothed cancer incidence rates adjusted for deprivation and age by census tract in the area of the capital of province in two Spanish provinces during the period 2011–2012, Figure S6: Breast cancer smoothed cancer incidence rates adjusted for deprivation and age by census tract in the area of the capital of province in six Spanish provinces during the period 2010–2013, Table S1: Number of colorectal cancer cases, population at risk, and crude cancer incidence rates by year of diagnosis and province in Spain during the period 2010–2013, Table S2: Number of lung cancer cases, population at risk, and crude cancer incidence rates by anatomical site, year of diagnosis, and province in Spain during the period 2011–2012, Table S3: Number of breast cancer cases, population at risk, and crude cancer incidence rates by anatomical site, year of diagnosis, and province in Spain during the period 2010–2013.
Author Contributions
D.R.-S., M.-J.S., and M.A.L.-F. designed the study. D.R.-S. and M.A.L.-F. analyzed the data and wrote the first manuscript draft. All the authors contributed to the data generation and curation, reviewed the study results, and drafted the manuscript’s different versions. All authors have read and agreed to the published version of the manuscript.
Funding
MALF was supported by a Spanish National Health Institute Carlos III Miguel Servet-I Investigator grant/award, grant number CP17/00206-EU-FEDER. This research was funded by Instituto de Salud Carlos III (ISCIII): PI18/01593 and CP17/00206-EU/FEDER, Asociación Española Contra el Cáncer (AECC): PROYE20023SÁNC and the Cancer Epidemiological Surveillance Subprogram (VICA) from the CIBER Epidemiologia y Salud Pública (CIBERESP) from the Instituto de Salud Carlos III. The Navarra Cancer Registry was partially supported by a grant from the La Caixa Foundation.
Institutional Review Board Statement
The internal review board of the Andalusian School of Public Health (CP17/00206) and the biomedical ethics committee of the Department of Health of the Andalusian Regional Government (study 0072-N-18) approved the study protocol.
Informed Consent Statement
The study was carried out in accordance with the principles of the Declaration of Helsinki. No samples were used, all data accessed for the study were fully anonymized and informed consent was waived. The participant Cancer Registries comply with national and European data protection and privacy regulations.
Data Availability Statement
This research has been conducted using the Spanish National Statistics Institute data under application number BE181/2018 granting access to the corresponding population and mortality data. De-identified participant data from the Spanish cancer registries data are available via the High Resolution Studies on application. Proposals should be directed to the Spanish National Statistics Institute (https://www.ine.es/, accessed on 27 May 2021) and the High Resolution Studies (http://www.hrstudies.eu/contacts.html, accessed on 27 May 2021) to gain access; data requestors will need to sign a data access agreement.
Acknowledgments
We thank Pamela Minicozzi and Milena Sant for developing the protocol and data collection tools for the European High Resolution studies. This paper will be part of the doctoral thesis developed by Daniel Redondo-Sánchez in the “Clinical Medicine and Public Health Program” of the University of Granada (Spain).
Conflicts of Interest
The authors declare no conflict of interest. The funders had no role in the design of the study; in the collection, analyses, or interpretation of data; in the writing of the manuscript, or in the decision to publish the results.
References
- Mander, T. Longevity and healthy ageing—Will healthcare be drowned by the grey Tsunami or sunk by the demographic iceberg? Post Reprod. Health 2014, 20, 8–10. [Google Scholar] [CrossRef]
- Allemani, C.; Matsuda, T.; Di Carlo, V.; Harewood, R.; Matz, M.; Nikšić, M.; Bonaventure, A.; Valkov, M.; Johnson, C.J.; Estève, J.; et al. Global surveillance of trends in cancer survival 2000-14 (CONCORD-3): Analysis of individual records for 37 513 025 patients diagnosed with one of 18 cancers from 322 population-based registries in 71 countries. Lancet 2018, 1023–1075. [Google Scholar] [CrossRef]
- Hashim, D.; Erdmann, F.; Zeeb, H. Editorial: Social Inequities in Cancer. Front. Oncol. 2019, 9, 233. [Google Scholar] [CrossRef]
- Luengo-Fernandez, R.; Leal, J.; Gray, A.; Sullivan, R. Economic burden of cancer across the European Union: A population-based cost analysis. Lancet Oncol. 2013, 14, 1165–1174. [Google Scholar] [CrossRef]
- Department for Communities and Local Government The English Indices of Deprivation 2015. Available online: https://www.gov.uk/government/uploads/system/uploads/attachment_data/file/465791/English_Indices_of_Deprivation_2015_-_Statistical_Release.pdf (accessed on 7 February 2018).
- Duque, I.; Domínguez-Berjón, M.; Cebrecos, A.; Prieto-Salceda, M.; Esnaola, S.; Sánchez, M.C.; Marí-Dell’Olmo, M. Índice de privación en España por sección censal en 2011. Gac. Sanit. 2020, in press. [Google Scholar] [CrossRef]
- European High Resolution Studies. Available online: http://www.hrstudies.eu/index.html (accessed on 30 January 2020).
- Fritz, A.; Percy, C.; Jack, A.; Shanmugaratnam, K.; Sobin, L.; Parkin, D.; Whelan, S. International Classification of Diseases for Oncology, 3rd ed.; World Health Organization: Geneva, Switzerland, 2000. [Google Scholar]
- Luque-Fernandez, M.A.; Redondo-Sánchez, D.; Rodríguez-Barranco, M.; Chang-Chan, Y.-L.; Salamanca-Fernández, E.; Núñez, O.; Fernandez-Navarro, P.; Pollán, M.; Sánchez, M.-J. Socioeconomic Inequalities in Colorectal Cancer Survival in Southern Spain: A Multilevel Population-Based Cohort Study. Clin. Epidemiol. 2020, 12, 797–806. [Google Scholar] [CrossRef]
- Spanish Household Income Distribution Map. 2015. Available online: https://www.ine.es/en/experimental/atlas/exp_atlas_tab_en.htm (accessed on 28 October 2019).
- J.Faraway, J. Extending the Linear Model with R Generalized Linear, Mixed Effects and Nonparametric Regression Models; Taylor & Francis Group, LLC.: New York, NY, USA, 2006; ISBN 0-203-49228-5. [Google Scholar]
- Rabe-Hesketh, S.; Skrondal, A. Multilevel and Longitudinal Modeling Using Stata, Volume II: Categorical Responses, Counts, and Survival. In StataCorp LP; Stata Press: College Station, TX, USA, 2012; ISBN 9781597181082. [Google Scholar]
- Clayton, D.; Kaldor, J. Empirical Bayes Estimates of Age-Standardized Relative Risks for Use in Disease Mapping. Biometrics 1987, 43, 671. [Google Scholar] [CrossRef] [PubMed]
- Bray, F.; Colombet, M.; Mery, L.; Piñeros, M.; Znaor, A.; Zanetti, R.; Ferlay, J. Cancer Incidence in Five Continents. Volume XI; IARC Scientific Publications: Lyon, France, 2017. [Google Scholar]
- StataCorp. Stata Statistical Software: Release 16; StataCorp: College Station, TX, USA, 2019. [Google Scholar]
- The R Foundation. The R Project for Statistical Computing; The R Foundation: Vienna, Austria, 2016. [Google Scholar]
- European Comission ECIS—European Cancer Information System. Available online: https://ecis.jrc.ec.europa.eu (accessed on 23 August 2020).
- Mihor, A.; Tomsic, S.; Zagar, T.; Lokar, K.; Zadnik, V. Socioeconomic inequalities in cancer incidence in Europe: A comprehensive review of population-based epidemiological studies. Radiol. Oncol. 2020, 54, 1–13. [Google Scholar] [CrossRef]
- Meijer, M.; Bloomfield, K.; Engholm, G. Neighbourhoods matter too: The association between neighbourhood socioeconomic position, population density and breast, prostate and lung cancer incidence in Denmark between 2004 and 2008. J. Epidemiol. Community Health 2013, 67, 6–13. [Google Scholar] [CrossRef] [PubMed]
- Shack, L.; Jordan, C.; Thomson, C.S.; Mak, V.; Møller, H. Variation in incidence of breast, lung and cervical cancer and malignant melanoma of skin by socioeconomic group in England. BMC Cancer 2008, 8, 271. [Google Scholar] [CrossRef]
- Public Health England; National Cancer Intelligence Network. Cancer by Deprivation in England. Incidence, 1996–2010. Mortality, 1997–2011; London, UK, 2014.
- Bryere, J.; Dejardin, O.; Launay, L.; Colonna, M.; Grosclaude, P.; Launoy, G. Socioeconomic status and site-specific cancer incidence, a Bayesian approach in a French Cancer Registries Network study. Eur. J. Cancer Prev. 2018, 27, 391–398. [Google Scholar] [CrossRef]
- Bryere, J.; Dejardin, O.; Bouvier, V.; Colonna, M.; Guizard, A.-V.; Troussard, X.; Pornet, C.; Galateau-Salle, F.; Bara, S.; Launay, L.; et al. Socioeconomic environment and cancer incidence: A French population-based study in Normandy. BMC Cancer 2014, 14, 87. [Google Scholar] [CrossRef]
- Eberle, A.; Luttmann, S.; Foraita, R.; Pohlabeln, H. Socioeconomic inequalities in cancer incidence and mortality—a spatial analysis in Bremen, Germany. J. Public Health 2010, 18, 227–235. [Google Scholar] [CrossRef]
- Hoebel, J.; Kroll, L.E.; Fiebig, J.; Lampert, T.; Katalinic, A.; Barnes, B.; Kraywinkel, K. Socioeconomic Inequalities in Total and Site-Specific Cancer Incidence in Germany: A Population-Based Registry Study. Front. Oncol. 2018, 8. [Google Scholar] [CrossRef]
- Kuznetsov, L.; Maier, W.; Hunger, M.; Meyer, M.; Mielck, A. Regional deprivation in Bavaria, Germany: Linking a new deprivation score with registry data for lung and colorectal cancer. Int. J. Public Health 2012, 57, 827–835. [Google Scholar] [CrossRef]
- Walsh, P.M.; McDevitt, J.; Deady, S.; O’Brien, K.; Comber, H. Cancer Inequalities in Ireland by Deprivation, Urban/Rural Status And Age: A National Cancer Registry Report; National Cancer Registry Ireland: Cork, Ireland, 2016.
- Spadea, T.; Zengarini, N.; Kunst, A.; Zanetti, R.; Rosso, S.; Costa, G. Cancer risk in relationship to different indicators of adult socioeconomic position in Turin, Italy. Cancer Causes Control 2010, 21, 1117–1130. [Google Scholar] [CrossRef] [PubMed]
- Lokar, K.; Zagar, T.; Zadnik, V. Estimation of the Ecological Fallacy in the Geographical Analysis of the Association of Socio-Economic Deprivation and Cancer Incidence. Int. J. Environ. Res. Public Health 2019, 16, 296. [Google Scholar] [CrossRef]
- Li, X.; Sundquist, J.; Zöller, B.; Sundquist, K. Neighborhood deprivation and lung cancer incidence and mortality: A multilevel analysis from Sweden. J. Thorac. Oncol. 2015, 10, 256–263. [Google Scholar] [CrossRef] [PubMed]
- Sharpe, K.H.; McMahon, A.D.; Raab, G.M.; Brewster, D.H.; Conway, D.I. Association between Socioeconomic Factors and Cancer Risk: A Population Cohort Study in Scotland (1991–2006). PLoS ONE 2014, 9, e89513. [Google Scholar] [CrossRef]
- Tweed, E.J.; Allardice, G.M.; McLoone, P.; Morrison, D.S. Socio-economic inequalities in the incidence of four common cancers: A population-based registry study. Public Health 2018, 154, 1–10. [Google Scholar] [CrossRef]
- Oliphant, R.; Brewster, D.H.; Morrison, D.S. The changing association between socioeconomic circumstances and the incidence of colorectal cancer: A population-based study. Br. J. Cancer 2011, 104, 1791–1796. [Google Scholar] [CrossRef] [PubMed]
- Haggar, F.A.; Boushey, R.P. Colorectal cancer epidemiology: Incidence, mortality, survival, and risk factors. Clin. Colon Rectal Surg. 2009, 22, 191–197. [Google Scholar] [CrossRef]
- Ascunce, N.; Salas, D.; Zubizarreta, R.; Almazán, R.; Ibáñez, J.; Ederra, M.; Fernández, R.; Moreo, P.; Natal, C.; Sánchez-Contador, C.; et al. Cancer screening in Spain. Ann. Oncol. 2010. [Google Scholar] [CrossRef]
- Garcia-Gil, M.; Elorza, J.-M.; Banque, M.; Comas-Cufí, M.; Blanch, J.; Ramos, R.; Méndez-Boo, L.; Hermosilla, E.; Bolibar, B.; Prieto-Alhambra, D. Linking of Primary Care Records to Census Data to Study the Association between Socioeconomic Status and Cancer Incidence in Southern Europe: A Nation-Wide Ecological Study. PLoS ONE 2014, 9, e109706. [Google Scholar] [CrossRef] [PubMed]
- Ingleby, F.C.; Belot, A.; Atherton, I.; Baker, M.; Elliss-Brookes, L.; Woods, L.M. Assessment of the concordance between individual-level and area-level measures of socio-economic deprivation in a cancer patient cohort in England and Wales. BMJ Open 2020, 10, 41714. [Google Scholar] [CrossRef] [PubMed]
- Atkinson, T. Social Exclusion, Poverty and Unemployment. In Exclusion, Employment and Opportunity; Centre for Analysis of Social Exclusion: London, UK, 1998; pp. 1–20. [Google Scholar]
Publisher’s Note: MDPI stays neutral with regard to jurisdictional claims in published maps and institutional affiliations. |
© 2021 by the authors. Licensee MDPI, Basel, Switzerland. This article is an open access article distributed under the terms and conditions of the Creative Commons Attribution (CC BY) license (https://creativecommons.org/licenses/by/4.0/).

