Simple Summary
Even today, there are no effective targeted therapies for intrahepatic cholangiocarcinoma (ICC) patients. Clarifying the molecular pathogenesis of ICC will contribute to the development of treatment strategies for this disease. In this study, we searched for the role of the miR-29-3p-family and its association with oncogenic pathway. Interestingly, aberrant expression of ITGA6 and ITGB1 was directly regulated by the miR-29-3p-family which are involved in multiple oncogenic pathways in ICC, and enhanced malignant transformation of ICC cells. Furthermore, SP1 which is a transcriptional activator of ITGA6/ITGB1, is regulated by the miR-29-3p-family. These molecules may be novel therapeutic targets for ICC.
Abstract
The aggressive nature of intrahepatic cholangiocarcinoma (ICC) renders it a particularly lethal solid tumor. Searching for therapeutic targets for ICC is an essential challenge in the development of an effective treatment strategy. Our previous studies showed that the miR-29-3p-family members (miR-29a-3p, miR-29b-3p and miR-29c-3p) are key tumor-suppressive microRNAs that control many oncogenic genes/pathways in several cancers. In this study, we searched for therapeutic targets for ICC using the miR-29-3p-family as a starting point. Our functional studies of cell proliferation, migration and invasion confirmed that the miR-29-3p-family act as tumor-suppressors in ICC cells. Moreover, in silico analysis revealed that “focal adhesion”, “ECM-receptor”, “endocytosis”, “PI3K-Akt signaling” and “Hippo signaling” were involved in oncogenic pathways in ICC cells. Our analysis focused on the genes for integrin-α6 (ITGA6) and integrin-β1 (ITGB1), which are involved in multiple pathways. Overexpression of ITGA6 and ITGB1 enhanced malignant transformation of ICC cells. Both ITGA6 and ITGB1 were directly regulated by the miR-29-3p-family in ICC cells. Interestingly, expression of ITGA6/ITGB1 was positively controlled by the transcription factor SP1, and SP1 was negatively controlled by the miR-29-3p-family. Downregulation of the miR-29-3p-family enhanced SP1-mediated ITGA6/ITGB1 expression in ICC cells. MicroRNA-based exploration is an attractive strategy for identifying therapeutic targets for ICC.
Keywords:
intrahepatic cholangiocarcinoma; miR-29a-3p; miR-29b-3p; miR-29c-3p; tumor-suppressor; ITGA6; ITGB1; SP1 1. Introduction
Cholangiocarcinoma is anatomically divided into intrahepatic cholangiocarcinoma (ICC) and extrahepatic cholangiocarcinoma. From cancer genomic analysis, each cancer contains characteristic gene mutations, suggesting molecular biological differences [1,2,3]. ICC is the second most common cancer of the liver after hepatocellular carcinoma (HCC). ICC constitutes about 5% of primary liver cancers, and global morbidity and mortality of the disease have increased significantly in recent years [4,5,6,7]. Due to the aggressive features of ICC (the high rate of metastasis), the prognosis of patients is very poor (5-year survival rate is less than 10%) [8]. Although surgical resection is the only strategy aiming at a complete cure, only about 30% of patients are operable [9]. Even today, there are no effective anti-cancer drugs or molecularly targeted therapies for ICC patients in the advanced stage of disease [1,2]. The lack of effective diagnostic markers for ICC is a major factor that delays the detection of this disease [10,11]. Clarifying the molecular pathogenesis of ICC based on the latest genomic analyses will contribute to the development of treatment strategies for this disease.
The Human Genome Project has revealed the presence of a vast number of non-coding RNA molecules (ncRNAs) in the human genome. These ncRNAs have important function within cells [12]. MicroRNAs (miRNAs) constitute a set of small ncRNAs (19 to 23 bases) that negatively regulate the expression of RNA transcripts in a sequence-dependent manner [13]. Over the last decade, accumulating evidence has shown that aberrantly expressed miRNAs are closely involved in cancer cell development, metastasis and drug-resistance [12,14,15]. For example, dysregulated miRNAs can disrupt tightly controlled RNA networks, triggering the transition of normal cells to diseased cells.
Identification of aberrantly expressed miRNAs in each type of cancer is the first step towards elucidating the roles of miRNA in the molecular pathogenesis of cancers. Based on miRNA expression signatures, we have revealed some of the roles of tumor-suppressive miRNAs and their controlled oncogenic targets and pathways in gastrointestinal cancers, e.g., esophageal cancer, gastric cancer and pancreatic ductal adenocarcinoma [16,17,18].
Previous study of ICC signatures showed that a total of 30 miRNAs (10 of which were upregulated and 20 were downregulated) were dysregulated in ICC tissues [19]. Moreover, the expression of three miRNAs (miR-675-5p, miR-652-3p and miR-338-3p) was characteristic of ICC. Those miRNA signatures were independent prognostic indicators based on multivariate analysis [19]. Other signatures showed that 38 miRNAs were differentially expressed in tumor and normal tissues [20]. Among these miRNAs, exogenous expression of miR-320 and miR-204 negatively controlled Mcl-1 and BCl-2 expression, respectively. Expression of those miRNAs facilitates chemotherapeutic drug-triggered apoptosis [20]. Upregulation of miR-191 in ICC tissues was detected by next-generation sequencing technology [21]. Overexpression of miR-191 enhanced ICC aggressive phenotypes, e.g., proliferation, invasion and migration abilities in vitro and in vivo [21].
Analysis of our RNA-sequence-based signatures revealed that the miR-29-3p-family (miR-29a-3p, miR-29b-3p and miR-29c-3p) was frequently downregulated in several cancers, suggesting these miRNAs acted as pivotal tumor-suppressors in cancer cells [22,23]. Importantly the miR-29-3p-family is downregulated in ICC tissues [24]. The aim of the study was to investigate the functional significance of the miR-29-3p-family and to identify oncogenic targets/pathways in ICC cells. Our ectopic expression assays showed that all members of the miR-29-3p-family acted as tumor-suppressors in ICC cells. Several oncogenic pathways (e.g., focal adhesion, ECM-receptor, endocytosis, PI3K–Akt signaling and Hippo signaling) were subject to control by the miR-29-3p-family. Furthermore, we revealed that the genes for integrin alfa-6 (ITGA6) and beta-1(ITGB1) were directly regulated by the miR-29-3p-family, and their overexpression enhanced migration and invasive abilities in ICC cells. In addition, we showed that transcription factor SP1 is involved in ITGA6 and ITGB1 expression, and that SP1 expression was negatively controlled by the miR-29-family in ICC cells.
Downregulation of the miR-29-3p-family activated several oncogenic pathways, and these events were closely involved in ICC oncogenesis. Oncogenic signaling pathways mediated by ITGA6/ITGB1 are likely therapeutic targets for this disease. Our miRNA-based approach will accelerate the understanding of the molecular pathogenesis of ICC.
2. Results
2.1. Downregulation of miR-29a-3p, miR-29b-3p and miR-29c-3p in ICC Clinical Specimens
The expression levels of miR-29a-3p, miR-29b-3p and miR-29c-3p were investigated to utilize the Gene Expression Omnibus (GEO) database (GSE: 53870). These datasets contained 63 ICC tissues and 9 normal intrahepatic bile ducts tissues. Downregulation of miR-29a-3p, miR-29b-3p and miR-29c-3p was confirmed in ICC tissues compared with normal tissues (p = 0.0003, p < 0.001 and p = 0.0210, respectively; Figure 1A). These miRNAs were clustered at two different human loci: miR-29b-1 and miR-29a were at 7q32.3 and miR-29b-2, and miR-29c was at 1q32.2. Mature sequences of miR-29a-3p and miR-29c-3p are identical. On the other hand, the mature sequence of miR-29b-3p differs at two bases on the 3′end. The seed sequences of the three miRNAs are identical (red letters; Figure 1B).
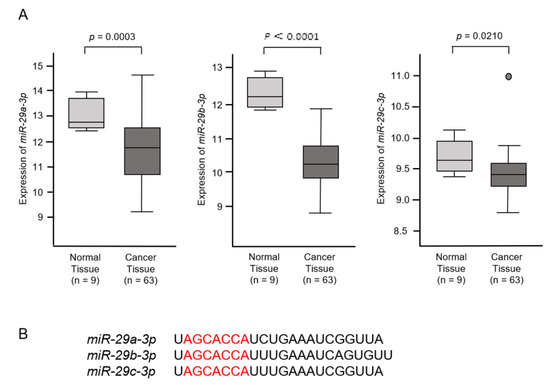
Figure 1.
In silico expression analysis of miR-29a-3p, miR-29b-3p and miR-29c-3p. (A) Expression levels of miR-29a-3p, miR-29b-3p and miR-29c-3p in ICC tissues. A total of 63 ICC cancer tissues and 9 normal intrahepatic bile ducts (NIBDs) were analyzed. (B) Mature sequences of the miR-29-family are shown. Mature sequences of miR-29a-3p and miR-29c-3p are identical. The mature sequence of miR-29b-3p differs in 2 bases on the 3′ end. The seed sequences of the 3 miRNAs are identical (red letters).
2.2. Effects of Ectopic Expression of miR-29a-3p, miR-29b-3p and miR-29c-3p on ICC Cell Proliferation, Migration and Invasion
The tumor-suppressive roles of miR-29a-3p, miR-29b-3p and miR-29c-3p were assessed by using ectopic expression assays in HuCCT1 and RBE cells. Cell proliferation assays showed no significant effects of these miRNAs transfected in two cell lines (Figure 2A). In contrast, cell migration and invasive abilities were significantly inhibited in miR-29a-3p, miR-29b-3p and miR-29c-3p-transfected cells (HuCCT1 and RBE) compared with mock- or miR-control-transfected cells (Figure 2B,C).
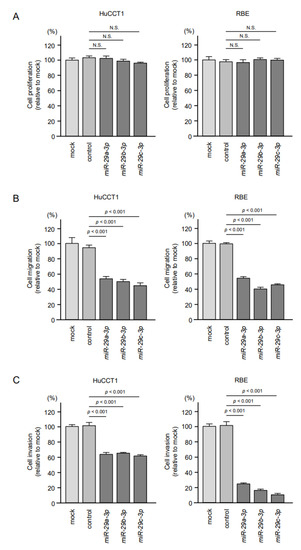
Figure 2.
Effects of miR-29a-3p, miR-29b-3p and miR-29c-3p on functions (cell proliferation, migration and invasion) of intrahepatic cholangiocarcinoma (ICC) cell lines (HuCCT1 and RBE). (A) Cell proliferation was assessed using XTT assays. Data were collected 72 h after miicroRNA transfection. Ectopic expression of miR-29a-3p, miR-29b-3p and miR-29c-3p did not affect cell proliferation. (B,C) Cell migration and invasive abilities were significantly blocked by ectopic expression of miR-29a-3p, miR-29b-3p and miR-29c-3p in ICC cells. Error bars represent mean ± standard error (SE).
2.3. Identification of Putative Pathways and Targets of the miR-29-3p-Family (miR-29a/b/c-3p) Regulation in ICC Cells
The seed sequences of the miR-29-3p-family are identical (Figure 1B). Thus, we predicted that the pathways and targets controlled by these miRNAs would be the same. Our strategy for the selection of miR-29-3p-family controlled pathways and target genes is shown in Figure 3.
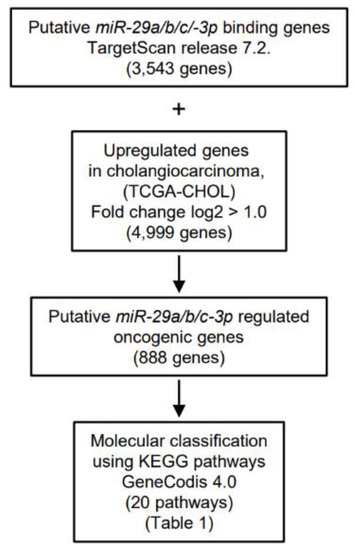
Figure 3.
Flowchart summarizing the search for oncogenic targets of miR-29-3p regulation in ICC cells. To identify miR-29-3p target genes, we screened putative targets using the TargetScan database and TCGA database. A total of 888 targets were upregulated in cholangiocarcinoma tissues. These genes were then categorized into KEGG (Kyoto Encyclopedia of Genes and Genomes) pathways using the GeneCodis database. Finally, 20 pathways that were regulated by miR-29-3p were identified.
First, based on the TargetScan database (release 7.2), we searched for putative genes that have target sites for the miR-29-3p-family (AGCACCA). A total of 3543 genes were identified. Second, we selected the upregulated genes in cholangiocarcinoma tissues compared with normal tissues by using TCGA database (36 cancer and 9 normal tissues, TCGA-CHOL) and Subio platform. A total of 4999 upregulated genes (log2 ratio > 1) were identified. Next, the two datasets were merged, and a total of 888 genes were selected as putative targets of miR-29-3p (i.e., upregulated genes in cholangiocarcinoma tissues that have miR-29-3p binding sites). Finally, we classified 888 genes (Table S1) based on their molecular functions using KEGG pathways (GeneCodis 4.0).
A total 20 pathways were identified as the miR-29-3p-family controlled oncogenic pathways in ICC cells (Table 1; Tables S2–S7). In this study, we focused on ITGA6 and ITGB1, both of which involve multiple pathways, indicating these two genes closely contributed to ICC oncogenesis.

Table 1.
Significantly enriched pathways regulated by the miR-29-3p-family in ICC cells.
2.4. Expression of ITGA6/ITGA6 and ITGB1/ITGB1 Genes and Proteins in ICC Clinical Specimens
We analyzed expression levels of ITGA6 and ITGB1 (RNA-Sequence data in 36 cases of TCGA-CHOL) using the GEPIA2 database platform. Expression of both ITGA6 and ITGB1 was significantly upregulated (p < 0.01; Figure 4A). We also examined the protein expression levels of ITGA6 and ITGB1 in an ICC clinical specimen using immunohistochemical methods. Expression of ITGA6 and ITGB1 was detected in the cancer cells (Figure 4B–D). Immunostaining confirmed that ITGB1 was expressed in normal cholangiocytes and hepatocytes (Figure S1B,D). Compared with ITGB1, expression of ITGA6 was hardly observed (Figure S1A,C).
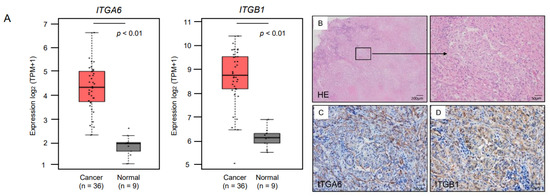
Figure 4.
Expression of ITGA6 and ITGB1 in ICC. (A) Expression levels of ITGA6 and ITGB1 in ICC tissues and normal tissues obtained from TCGA-CHOL based on the GEPIA2 platform. (B) H&E-stained sections of human ICC tissue. Areas in the boxed region at the left are shown magnified at right. (C,D) Representative images of tissues immunostained for ITGA6 and ITGB1. ITGA6 stained positive in the membranes of cancer cells in a clinical sample (original magnification × 100). ITGB1 stained positive in the membranes, cytoplasm and a part of the nuclei of cancer cells in a clinical sample (original magnification × 100).
2.5. Direct Regulation of ITGA6 and ITGB1 by miR-29a-3p, miR-29b-3p and miR-29c-3p in ICC Cells
We investigated direct regulation of ITGA6 by the miR-29-3p-family in ICC cells. Expression levels of both mRNA and protein were significantly reduced by ectopic expression of miR-29a-3p, miR-29b-3p and miR-29c-3p in ICC cells (HuCCT1 and RBE, Figure 5, Figure S2A). Similarly, ectopic expression of miR-29a-3p, miR-29b-3p and miR-29c-3p reduced expression levels of ITGB1/ITGB1 (Figure 6, Figure S2B).
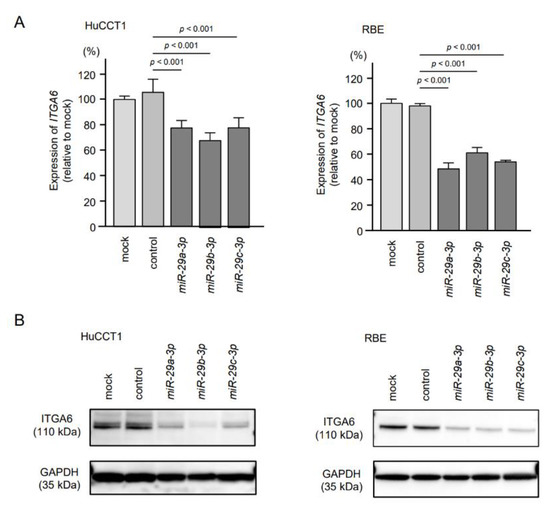
Figure 5.
Regulation of ITGA6/ITGA6 expression by ectopic expression of miR-29a-3p, miR-29b-3p and miR-29c-3p in intrahepatic cholangiocarcinoma (ICC) cells. (A) Expression levels of ITGA6 were significantly reduced by miR-29-3p transfection into ICC cells. GUSB was used as an internal control. (B) Protein expression levels of ITGA6 were significantly reduced by miR-29-family transfection into ICC cells (72 h after transfection). GAPDH was used as an internal control.
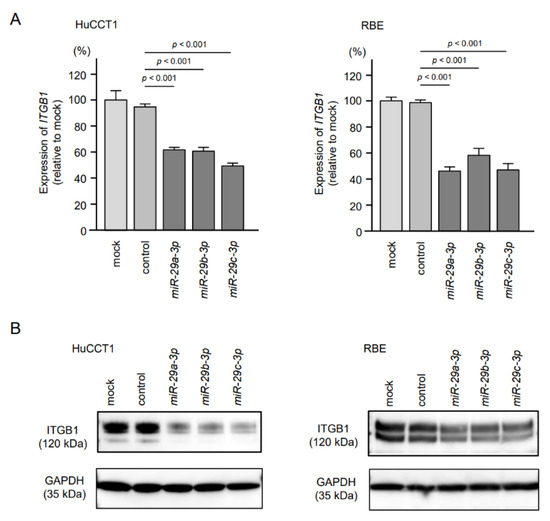
Figure 6.
Regulation of ITGB1/ITGB1 expression by ectopic expression of miR-29a-3p, miR-29b-3p and miR-29c-3p in intrahepatic cholangiocarcinoma (ICC) cells. (A) Expression levels of ITGB1 were significantly reduced by miR-29-3p transfection into ICC cells. GUSB was used as an internal control. (B) Protein expression levels of ITGB1 were significantly reduced by miR-29-3p transfection into ICC cells (72 h after transfection). GAPDH was used as an internal control.
Next, to assess whether the miR-29-family directly binds to the ITGA6 target site in ICC cells, we performed dual-luciferase reporter assays. Luciferase activity was significantly decreased following co-transfection of miR-29c-3p and a vector carrying the wild-type miR-29c-3p target site. In contrast, luciferase activity was not changed following co-transfection of miR-29c-3p and a vector carrying the deletion-type of the miR-29c-3p target site (Figure 7A). These results indicated that ITGA6 was directly regulated by miR-29a-3p, miR-29b-3p and miR-29c-3p in ICC cells. Similar results were confirmed in the dual-luciferase reporter assays of ITGB1 and miR-29c-3p, indicating that ITGB1 was directly regulated by miR-29a-3p, miR-29b-3p and miR-29c-3p in ICC cells (Figure 7B).
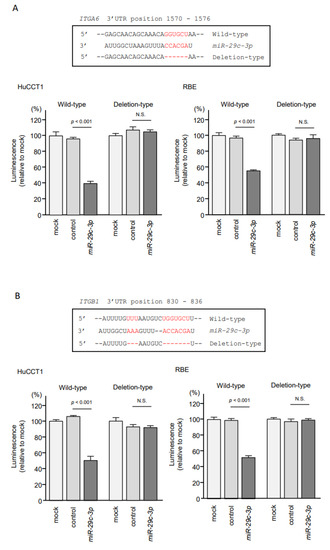
Figure 7.
Direct regulation of ITGA6 and ITGB1 expression by miR-29-3p in ICC cells. (A) Dual-luciferase reporter assays showed that luminescence activity was reduced by co-transfection with wild-type vector (containing the miR-29-3p binding site of ITGA6) and miR-29c-3p precursor in HuCCT1 and RBE cells. In contrast, no change of luminescence activity occurred after co-transfection with deletion-type vector luciferase activity with miR-29-3p transfection into ICC cells. Normalized data were calculated as the ratios of Renilla/firefly. (B) The luminescence activity was reduced by co-transfection with wild-type vector (containing miR-29-3p binding site of ITGB1) and miR-29c-3p precursor in HuCCT1 and RBE cells. In contrast, no change of luminescence activity occurred after co-transfection with deletion-type vector luciferase activity.
2.6. Effects of Knockdown of ITGA6 and ITGB1 on Cell Proliferation, Migration, and Invasion in ICC Cells
To assess the oncogenic functions of ITGA6/ITGB1 in ICC cells, we conducted knockdown assays of corresponding genes using small interfering RNAs (siRNAs). First, we evaluated the mRNA and protein knockdown efficiencies of siRNAs that targeted ITGA6 and ITGB1 in HuCCT1 and RBE cells. The expression levels of ITGA6/ITGA6 and ITGB1/ITGB1 were significantly reduced by all siRNA-transfected cells, HuCCT1 and RBE (Figure 8 and Figure 9, Figure S3A,B). Functional assays using siRNAs demonstrated that knockdown of ITGA6 and ITGB1 suppressed cancer cell malignant phenotypes, especially cell migration and invasive abilities (Figure 10 and Figure 11). Furthermore, both integrins (ITGA6 and ITGB1) were knocked down at the same time to examine the tumor suppressor effects, e.g., cell proliferation and migration, and invasive abilities. By knocking down both integrins, the malignant phenotypes of cancer cells were further controlled (Figure S4).
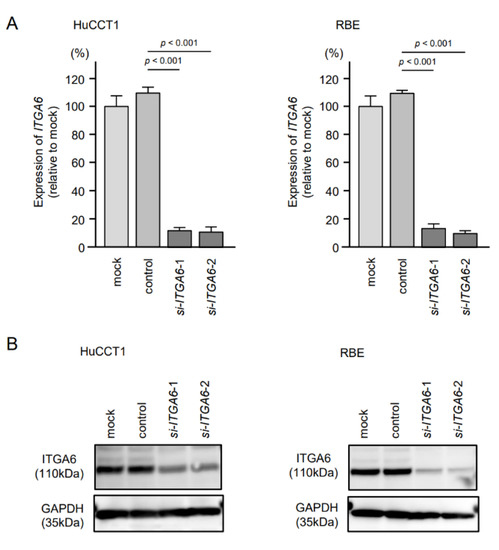
Figure 8.
Knockdown efficiency of siITGA6 in HuCCt1 and RBE cells. (A) Expression of ITGA6 in ICC cell lines was evaluated 72 h after transfection with si-ITGA6-1 or si-ITGA6-2. GUSB was used as an internal control. (B) Expression of ITGA6 in ICC cell lines was evaluated by Western blot analysis 72 h after transfection with si-ITGA6-1 or si-ITGA6-2. GAPDH was used as internal control.
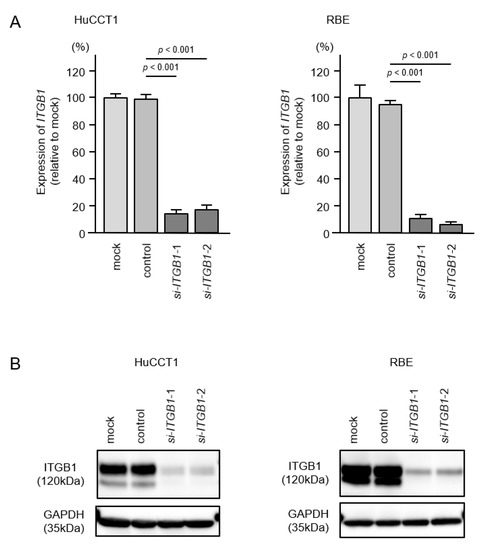
Figure 9.
Knockdown efficiency of siITGB1 in HuCCT1 and RBE cells. (A) Expression of ITGB1 in ICC cell lines was evaluated 72 h after transfection with si-ITGB1-1 or si-ITGB1-2. GUSB was used as an internal control. (B) Expression of ITGB1 in intrahepatic cholangiocarcinoma (ICC) cell lines was evaluated by Western blot analysis 72 h after transfection with si-ITGB1-1 and si-ITGB1-2. GAPDH was used as internal control.
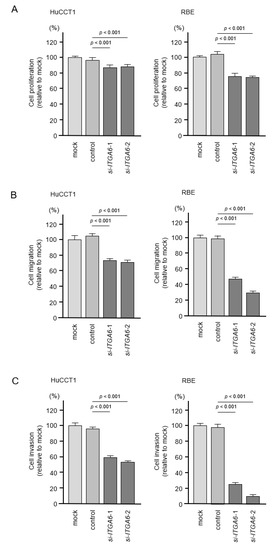
Figure 10.
Effects of knockdown of ITGA6 on cell proliferation, migration and invasion in HuCCT1 and RBE cell lines. (A) Cell proliferation was assessed using XTT assays. Data were collected 72 h after miRNA transfection. (B) Cell migration was assessed using wound healing assays. (C) Cell invasion was determined 72 h after seeding microRNA-transfected cells into chambers using Matrigel invasion assays. Error bars are represented as mean ± standard error (SE).
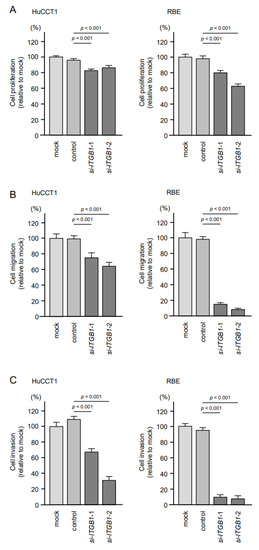
Figure 11.
Effects of knockdown of ITGB1 on cell proliferation, migration and invasion in HuCCT1 and RBE. (A) Cell proliferation was assessed using XTT assays. Data were collected 72 h after miRNA transfection. (B) Cell migration was assessed using wound healing assays. (C) Cell invasion was determined 72 h after seeding miRNA-transfected cells into chambers using Matrigel invasion assays. Error bars are represented as mean ± standard error (SE).
2.7. Identification of Transcriptional Regulators of ITGA6 and ITGB1 in ICC Cells
We further investigated the involvement of transcription factors (TFs) that positively regulated ITGA6 and ITGB1 expression in ICC cells based on in silico database analysis. GeneCodis database analysis and previous studies identified a total of 18 TFs (Table 2) [25,26,27].
Table 2.
Transcription factors for ITGA6 or ITGB1.
Among these TFs, expression of 12 TFs was upregulated in cholangiocarcinoma tissues (Figure S5). Moreover, expressions of six TF genes (SP1, CREB1, MAX, FHL2, RFX1, and HIF1A) was positively correlated with the expression of ITGA6 and ITGB1 in cholangiocarcinoma tissues (Figure S6). These TFs might be involved with the enhanced expression of ITGA6 and ITGB1 in ICC cells. Thus, further investigation was conducted.
2.8. Regulation of SP1 by miR-29a-3p, miR-29b-3p and miR-29c-3p in ICC Cells
Expression levels of SP1/SP1 in clinical specimens and positive correlations of SP1/ITGA6 and SP1/ITGB1 are shown in Figure 12 and Figure S7.
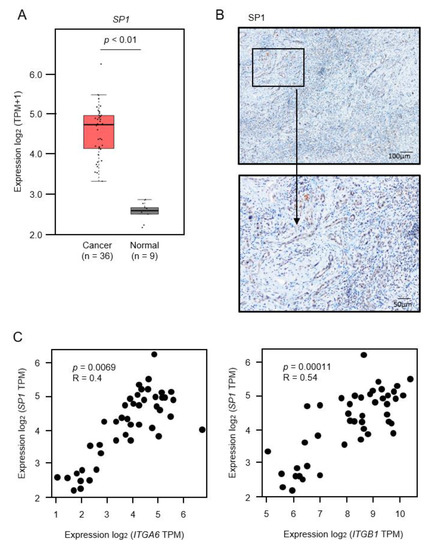
Figure 12.
Expression of SP1 in intrahepatic cholangiocarcinoma (ICC) clinical specimens. (A) Expression levels of SP1 in ICC tissues, normal tissues obtained from TCGA-CHOL through the GEPIA2 platform. (B) Immunostaining of SP1 in ICC clinical specimen. Areas in the boxed region above are shown magnified below (original magnification above: ×40, below: ×200). (C) Correlation of expression of SP1/ITGA6 and SP11/ITGB1 in cholangiocarcinoma tissues through GEPIA2 platform. Pearson’s rank tests between the expression levels of SP1/ITGA6 and SP1/ITGB1.
Interestingly, miR-29-3p binding sites were detected in the 3′-UTR region of SP1 mRNA. To evaluate whether direct regulation of SP1 by miR-29-3p-family in ICC cells occurred, we performed dual-luciferase reporter assays. Luciferase activity was significantly decreased following co-transfection of miR-29c-3p and a vector carrying the wild-type miR-29c-3p target site. In contrast, luciferase activity was not changed following co-transfection of miR-29c-3p and a vector carrying the deletion-type of the miR-29c-3p tar-get site (Figure 13A). These results indicated that SP1 was directly regulated by the miR-29-3p-family in ICC cells. Furthermore, both mRNA and protein expression levels of SP1/SP1 were reduced by ectopic expression of miR-29a-3p, miR-29b-3p and miR-29c-3p in HuCCT1 and RBE cells (Figure 13B,C, Figure S8). These data indicated that downregulation of miR-29a-3p, miR-29b-3p and miR-29c-3p enhanced SP1 expression, and this event accelerated the overexpression of ITGA6 and ITGB1 in ICC cells.
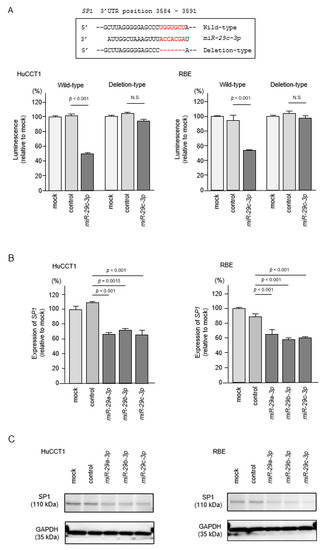
Figure 13.
Direct regulation of SP1 by miR-29-family in intrahepatic cholangiocarcinoma (ICC) cells. (A) The luminescence activity was reduced by co-transfection with wild-type vector (containing miR-29-3p binding site of SP1) and miR-29c-3p precursor in HuCCT1 and RBE cells. In contrast, no change of luminescence activity occurred after co-transfection with deletion-type vector luciferase activity. (B) Expression levels of SP1 were significantly reduced by miR-29a-3p, miR-29b-3p and miR-29c-3p transfection into ICC cells. GUSB was used as an internal control. (C) Protein expression levels of SP1 were significantly reduced by miR-29a-3p, miR-29b-3p, and miR-29c-3p transfection into ICC cells (72 h after transfection). GAPDH was used as an internal control.
3. Discussion
Among primary liver cancers, the incidence of ICC (15% of liver cancers) is second only to hepatocellular carcinoma (HCC), and the global incidence of ICC has increased over the past three decades [4,8]. Patients with ICC are advanced at the time of initial diagnosis because there are no effective early diagnostic markers [10,11]. Unfortunately, there is no effective treatment for inoperable cases [1,2]. Many studies have attempted to elucidate the molecular mechanisms underlying ICC [28,29]. Recently, genome-based analyses, including ncRNAs and miRNAs, have been vigorously conducted [12,15].
Recent study demonstrated that lncRNA-PAICC was overexpressed in ICC tissues, and expression of PAICC enhanced proliferation and invasion of ICC cells [30]. Importantly, oncogenic PAICC functioned as competitive endogenous RNA (ceRNA) that adsorbed tumor-suppressive miRNAs, miR-141-3p and miR-27a-3p, in cancer cells. Silencing of miR-141-3p and miR-27a-3p induced activation of the Hippo pathway in ICC cells [30]. Similarly, overexpression of lncRNA-UCA1 sponged miR-122, and this event enhanced proliferation and invasion of ICC cells [31]. Aberrant expression of lncRNAs and silencing tumor-suppressive miRNAs was closely associated with ICC oncogenesis [31].
In this study, we focused on the miR-29-3p-family because previous ICC signature and our miRNA signatures in several cancers revealed that the miR-29-3p-family was significantly downregulated in cancer tissues, suggesting that its members acted as key regulators, negatively controlling pivotal oncogenic targets and pathways [22,23,32]. Downregulation and tumor-suppressive functions of the miR-29-3p-family have been reported in several types of cancers [33,34]. Thus far, no detailed functional and targeted analysis of the miR-29-3p-family in ICC cells has been performed. In HCC cells, several studies showed that the miR-29-3p-family acted as tumor-suppressive miRNAs via negative control of several oncogenic targets, e.g., IGF2BP1, RPS15A and LOXL2 [35,36,37]. In cholangiocarcinoma, the serum concentration of miR-29b-3p was elevated compared to healthy controls and patients with primary sclerosing cholangitis [38]. The molecular mechanism increasing the level of miR-29b-3p in serum is not understood. It may be released from cancerous tissue.
Our next interest was the search for oncogenic molecular networks in ICC cells that were controlled by the tumor-suppressive miR-29-3p-family. Our in silico analysis identified 20 pathways, including “focal adhesion”, “ECM-receptor”, “endocytosis”, “PI3K-Akt signaling” and “Hippo signaling”. Analysis of the genes contained in these molecular pathways revealed that ITGA6 and ITGB1 were involved in multiple pathways. Integrins are cell surface proteins that interact with the extracellular matrix (ECM), modulating cell characteristics, such as cell shape, proliferation, and motility [39]. We also analyzed expression levels of other ITGs that form heterodimers with ITGB1 in ICC clinical specimens using GEPIA2 database (Figure S9). The expression of some ITGs, e.g., ITGAV, ITGA2, ITGA3, ITGA5, and ITGA7 were upregulated in ICC tissues. Additionally, upregulation of ITGB4 (form heterodimers with ITGA6) was detected in ICC tissues. It was suggested that not only the ITGA6/ITGB1 dimer but also the ITGs that form dimers with each of these may play an important role in ICC. Additionally, liver fibrosis is characterized by an abnormal accumulation of extracellular matrix (ECM) and is a common feature of chronic liver damage. The hepatic stellate cell (HSC) is involved in liver fibrosis, which is the formation of scar tissue in response to liver damage. Previous study showed that miR-29b was downregulated during HSC activation [40]. Ectopic expression of miR-29b inhibited several genes involved in HSC activation, e.g., COL1A1, COL1A2, DDR2, FN1, and ITGB1 [41]. A vast number of studies have shown that aberrant expression of ECM/integrin-mediated oncogenic signaling enhanced cancer cell malignant transformation, e.g., invasion, migration, the epithelial mesenchymal transition, metastasis and drug resistance [17,32].
Previous studies showed that several miRNAs (e.g., miR-29, miR-124-3p, miR-150, miR-218 and miR-199) directly controlled expression of ITGA6 and ITGB1 in several cancers. Ectopic expression of these miRNAs attenuated cancer cell migration, invasion and metastasis [17,32,42,43]. Our previous study of pancreatic ductal adenocarcinoma (PDAC) cells showed that aberrant expression of ITGA3 and ITGB1 (genes for two integrins that form homodimers) was significantly associated with poor prognosis of patients with PDAC [17]. Expression of ITGA3 and ITGB1 was directly regulated by tumor-suppressive miR-124-3p. Moreover, overexpression of miR-124-3p inhibited ITGA3/ITGB1-mediated oncogenic signaling, and attenuated cancer cell migration and invasive abilities [17]. In head and neck squamous cell carcinoma cells, ectopic expression of the miR-29-3p-family inhibited ITGB1-mediated oncogenic signaling [22]. At this time, no molecular-targeted drugs targeting the integrin-family are used for ICC. Searching for specific integrin-mediated molecular pathways in ICC will help develop new therapeutic agents. Integrin inhibitors have been clinically applied in autoimmune diseases, thrombosis, and several cancers, but with poor results, especially for malignant tumors [44,45,46]. This may be due to two aspects of their function: (1) integrins require structural changes due to their inside-out signals, and (2) multiple integrin units’ function in cancer cells [47]. Therefore, future development of therapy must control both integrin-related cascades as well as the presence of currently expressed ligands. In this study, we also investigated the involvement of transcription factors (TFs) that positively regulated ITGA6 and ITGB1 expression in ICC cells. Our in silico analysis revealed that a total of six TFs (SP1, CREB1, MAX, FHL2, RFX1 and HIF1A) were upregulated in cholangiocarcinoma tissues. We also found a positive correlation between ITGA6 and ITGB1 expression. Notably, among these TFs, SP1 has a miR-29-family binding site in the 3′-UTR region. Several studies showed that miR-29b and miR-29c directly regulated SP1 [48,49]. Our present data also showed inhibited expression of SP1 by ectopic expression of the miR-29-3p-family in ICC cells.
4. Conclusions
These findings indicated that downregulation of the miR-29-3p-family caused upregulation of ITGA6/ITGB1, and their transcriptional modulator SP1 in ICC cells. Overexpression of SP1 induces the expression of several genes involved in malignant transformation of cancer cells [50]. Therefore, reducing the expression of SP1 should permit control of cancers. A vast number of studies indicated that small-molecule drugs and natural products (bortezomib, retinoids, aspirin, metformin, and curcumin) downregulated SP1 expression in cancer cells [51,52]. It may be possible to control ICC by combining it with existing anti-cancer drugs.
5. Materials and Methods
5.1. ICC Cell Lines and Cell Culture
We used 2 human ICC cell lines: HuCCT1 and RBE, both purchased from the RIKEN Cell Bank (Tsukuba, Ibaraki, Japan). The cell lines were maintained in RPMI 1640 medium supplemented with 10% fetal bovine serum in a humidified atmosphere of 5% CO2 and 95% air at 37 °C. These cell lines were transferred from the RIKEN Bank in 2020 and were used in the present analysis.
5.2. RNA Extraction and Quantitative Real-Time Reverse Transcription Polymerase Chain Reaction (qRT-PCR)
The methods for total RNA extraction from clinical specimens and cell lines and for qRT-PCR have been described previously [16,17]. GUSB was used as the normalized control. The reagents used in the analysis are listed in Table S8.
5.3. Transfection of miRNAs, siRNAs, and Plasmid Vectors into ICC Cells
The transfection procedures of miRNAs, siRNAs, and plasmid vectors into ICC cells were described previously [16,17]. The reagents used in this study are listed in Table S8.
5.4. Functional Assays in ICC Cells (Cell Proliferation, Migration and Invasion)
The procedures for conducting the functional assays in cancer cells (e.g., proliferation, migration and invasion) have been described previously [16,17]. In brief, for proliferation assays, cells were transferred to 96-well plates. HuCCT1 and RBE cells were plated at 2.4 × 10³ cells per well. Cell proliferation was evaluated using the XTT assays 72 h after the transfection procedure. For migration and invasion assays, HuCCT1 cells or RBE cells at 1.2 × 10⁵ were transfected in 6-well plates. After 72 h, HuCCT1 or RBE cells were added into each chamber at 2.5 × 10⁵ per well. After 48 h, the cells on the lower surface were counted for analysis. All experiments were performed in triplicate.
5.5. Expression Analysis of miRNA, Target Genes and Transcriptional Factors Using Public Databases
To search for downregulated miRNAs in ICC clinical specimens, we obtained expression data from the GEO database (GSE53870). The expression data of 63 patients with ICC and 9 normal intrahepatic bile ducts are stored in the dataset. We imported TCGA-CHOL RNA seq data into Subio platform (https://www.subioplatform.com/ (accessed on 29 October 2020)) and analyzed gene expression by using the “compare 2 groups” tool of Subio platform. The expression level of each gene was extracted and analyzed from the TCGA-CHOL database through the GEPIA2 platform (http://gepia2.cancer-pku.cn/#index (accessed on 10 February 2021)).
5.6. Plasmid Construction and Dual-Luciferase Reporter Assays
Plasmid vectors containing wild type and deletion type sequences of miR-29-3p binding site in 3′-UTR of ITGA6 or ITGB1 or SP1 were prepared. The predicted binding site sequences were obtained from the TargetScanHuman database (https://www.targetscan.org/, release 7.2 (accessed on 1 December 2020)).
Cells were co-transfected with miR-29c-3p and the plasmid vectors for 36 h. The detailed procedures for dual-luciferase reporter assay were described in our previous studies [16,17].
5.7. Western Blotting and Immunohistochemistry
Cell lysates were prepared in RIPA buffer 72 h after transfection. Polyacrylamide gel electrophoresis was performed using 30 μg of protein lysate, and the protein lysates were transferred onto PVDF membranes (Thermo Fisher Scientific, Waltham, MA, USA). Membranes were blocked with skim milk and incubated with the indicated primary antibodies overnight at 4 °C. The antibodies used in this study are shown in Table S8. GAPDH was used as the internal control. The quantitation of the protein band intensity was analyzed by ImageJ software (NIH, Bethesda, MD, USA). We assessed expression of ITGA6, ITGB1 and SP1 proteins by immunohistochemistry. The procedure for immunostaining was described previously [16,17]. Clinical sample were obtained from a patient following resection at Kagoshima University Hospital at March 2017. The patient was diagnosed with mass-forming type ICC, T3N0M0 stage IIIA according to the 8th edition of the Union for International Cancer Control (UICC).
5.8. Statistical Analyses
All statistical analyses were performed using JMP Pro 15 (SAS Institute Inc., Cary, NC, USA). Differences between 2 groups were evaluated using Mann–Whitney U tests. For multiple groups, one-way analysis of variance and Dunnett’s test were applied. Correlation coefficients were evaluated using Pearson’s test. All data are presented as the mean ± SD. p-values less than 0.05 were considered significant.
Supplementary Materials
The following are available online at https://www.mdpi.com/article/10.3390/cancers13112804/s1, Figure S1: Immunostaining of ITGA6 and ITGB1 stained sections in normal liver tissues of 2 ICC clinical specimens. Arrowheads point to normal cholangiocytes, Figure S2A: Downregulation of ITGA6 by miR-29-3p-family transfection in ICC cells, Figure S2B: Downregulation of ITGB1 by miR-29-3p-family transfection in ICC cells, Figure S3A: Downregulation of ITGA6 by siRNA transfection in ICC cells, Figure S3B: Downregulation of ITGB1 by siRNA transfection in ICC cells, Figure S4: Effects of knockdown of both ITGA6 and ITGB1 on cell proliferation, migration and invasion in HuCCT1 and RBE, Figure S5: Expression of 11 upregulated transcription factors in cholangiocarcinoma tissues except SP1, Figure S6A: Correlation between ITGA6 and transcription factors in cholangiocarcinoma tissues. Figure S6B: Correlation between ITGB1 and transcription factors in cholangiocarcinoma tissues, Figure S7 (Related to Figure 12): Immunostaining of SP1 and H&E stained sections in 2 ICC clinical specimens Arrow heads point to normal cholangiocytes, Figure S8: Downregulation of SP1 by miR-29-3p-family transfection in ICC cells, Figure S9: Expression levels of ITGs forming dimer with ITGA6 and ITGB1 in ICC tissues and normal tissues obtained from TCGA-CHOL based on the GEPIA2 platform, Table S1: Candidate target genes regulated by miR-29-3p-family, Table S2: Putative target genes of intrahepatic cholangiocarcinoma for miR-29-3p-family in focal adhesion pathway, Table S3: Putative target genes of intrahepatic cholangiocarcinoma for miR-29-3p-family in small cell lung cancer, Table S4: Putative target genes of intrahepatic cholangiocarcinoma for miR-29-3p-family in pathways in cancer, Table S5: Putative target genes of intrahepatic cholangiocarcinoma for miR-29-3p-family in Human papillomavirus infection, Table S6: Putative target genes of intrahepatic cholangiocarcinoma for miR-29-3p-family in ECM-receptor interaction, Table S7: Putative target genes of intrahepatic cholangiocarcinoma for miR-29-3p-family in PI3K-Akt signaling pathway, Table S8: Reagents used in this study.
Author Contributions
Conceptualization, Y.H. and N.S.; data curation, Y.H., T.T. and S.M.; formal analysis, Y.H. and T.T.; funding acquisition, N.S., T.I., M.W., K.T. and T.O.; investigation, Y.H., Y.K. and Y.M.; methodology, N.S. and T.O.; project administration, N.S.; resources, T.I., H.K. and T.O.; supervision, T.O.; validation, T.T. and S.M.; visualization, Y.H. and N.S.; writing—original draft preparation, Y.H.; writing—review and editing, N.S., S.A. and H.K.; All authors have read and agreed to the published version of the manuscript.
Funding
This research was funded by JSPS KAKENHI grant (No. 18K08687, No.18K16422, No.19K03085, No.19K09077, No.20H03753).
Institutional Review Board Statement
The study was conducted according to the guidelines of the Declaration of Helsinki and approved by Ethics Committee of Kagoshima University (approval no. 160038 28-65, date of approval: 4 September 2016).
Informed Consent Statement
Written prior informed consent and approval were obtained from all patients who were diagnosed with ICC and resected at Kagoshima University Hospital.
Data Availability Statement
The data presented in this study are available on request from the corresponding author.
Conflicts of Interest
The authors declare no conflict of interest.
References
- Banales, J.M.; Marin, J.J.G.; Lamarca, A.; Rodrigues, P.M.; Khan, S.A.; Roberts, L.R.; Cardinale, V.; Carpino, G.; Andersen, J.B.; Braconi, C.; et al. Cholangiocarcinoma 2020: The next horizon in mechanisms and management. Nat. Rev. Gastroenterol. Hepatol. 2020, 17, 577–588. [Google Scholar] [CrossRef]
- Fostea, R.M.; Fontana, E.; Torga, G.; Arkenau, H.-T. Recent Progress in the Systemic Treatment of Advanced/Metastatic Cholangiocarcinoma. Cancers 2020, 12, 2599. [Google Scholar] [CrossRef]
- Ghidini, M.; Pizzo, C.; Botticelli, A.; Hahne, J.C.; Passalacqua, R.; Tomasello, G.; Petrelli, F. Biliary tract cancer: Current challenges and future prospects. Cancer Manag. Res. 2018, 11, 379–388. [Google Scholar] [CrossRef]
- McGlynn, K.A.; Tarone, R.E.; El-Serag, H.B. A Comparison of Trends in the Incidence of Hepatocellular Carcinoma and Intrahepatic Cholangiocarcinoma in the United States. Cancer Epidemiol. Biomark. Prev. 2006, 15, 1198–1203. [Google Scholar] [CrossRef]
- Bertuccio, P.; Bosetti, C.; Levi, F.; Decarli, A.; Negri, E.; La Vecchia, C. A comparison of trends in mortality from primary liver cancer and intrahepatic cholangiocarcinoma in Europe. Ann. Oncol. 2013, 24, 1667–1674. [Google Scholar] [CrossRef] [PubMed]
- Khan, S.A.; Taylor-Robinson, S.D.; Toledano, M.B.; Beck, A.; Elliott, P.; Thomas, H.C. Changing international trends in mortality rates for liver, biliary and pancreatic tumours. J. Hepatol. 2002, 37, 806–813. [Google Scholar] [CrossRef]
- Patel, T. Worldwide trends in mortality from biliary tract malignancies. BMC Cancer 2002, 2, 10. [Google Scholar] [CrossRef] [PubMed]
- Shaib, Y.H.; Davila, J.A.; McGlynn, K.; El-Serag, H.B. Rising incidence of intrahepatic cholangiocarcinoma in the United States: A true increase? J. Hepatol. 2004, 40, 472–477. [Google Scholar] [CrossRef] [PubMed]
- Liu, J.; Zhong, M.; Feng, Y.; Zeng, S.; Wang, Y.; Xu, H.; Zhou, H. Prognostic Factors and Treatment Strategies for Intrahepatic Cholangiocarcinoma from 2004 to 2013: Population-Based SEER Analysis. Transl. Oncol. 2019, 12, 1496–1503. [Google Scholar] [CrossRef]
- Doherty, B.; Nambudiri, V.E.; Palmer, W.C. Update on the Diagnosis and Treatment of Cholangiocarcinoma. Curr. Gastroenterol. Rep. 2017, 19, 2. [Google Scholar] [CrossRef] [PubMed]
- Macias, R.I.R.; Kornek, M.; Rodrigues, P.M.; Paiva, N.A.; Castro, R.E.; Urban, S.; Pereira, S.P.; Cadamuro, M.; Rupp, C.; Loosen, S.H.; et al. Diagnostic and prognostic biomarkers in cholangiocarcinoma. Liver Int. 2019, 39, 108–122. [Google Scholar] [CrossRef]
- Anfossi, S.; Babayan, A.; Pantel, K.; Calin, G.A. Clinical utility of circulating non-coding RNAs—An update. Nat. Rev. Clin. Oncol. 2018, 15, 541–563. [Google Scholar] [CrossRef]
- Bartel, D.P. MicroRNAs: Target Recognition and Regulatory Functions. Cell 2009, 136, 215–233. [Google Scholar] [CrossRef]
- Lin, S.; Gregory, R.I. MicroRNA biogenesis pathways in cancer. Nat. Rev. Cancer 2015, 15, 321–333. [Google Scholar] [CrossRef]
- Ha, M.; Kim, V.N. Regulation of microRNA biogenesis. Nat. Rev. Mol. Cell Biol. 2014, 15, 509–524. [Google Scholar] [CrossRef]
- Wada, M.; Goto, Y.; Tanaka, T.; Okada, R.; Moriya, S.; Idichi, T.; Noda, M.; Sasaki, K.; Kita, Y.; Kurahara, H.; et al. RNA sequencing-based microRNA expression signature in esophageal squamous cell carcinoma: Oncogenic targets by antitumor miR-143-5p and miR-143-3p regulation. J. Hum. Genet. 2020, 65, 1019–1034. [Google Scholar] [CrossRef]
- Idichi, T.; Seki, N.; Kurahara, H.; Fukuhisa, H.; Toda, H.; Shimonosono, M.; Yamada, Y.; Arai, T.; Kita, Y.; Kijima, Y.; et al. Involvement of anti-tumor miR-124-3p and its targets in the pathogenesis of pancreatic ductal adenocarcinoma: Direct regulation of ITGA3 and ITGB1 by miR-124-3p. Oncotarget 2018, 9, 28849–28865. [Google Scholar] [CrossRef]
- Kawagoe, K.; Wada, M.; Idichi, T.; Okada, R.; Yamada, Y.; Moriya, S.; Okubo, K.; Matsushita, D.; Arigami, T.; Kurahara, H.; et al. Regulation of aberrantly expressed SERPINH1 by antitumor miR-148a-5p inhibits cancer cell aggressiveness in gastric cancer. J. Hum. Genet. 2020, 65, 647–656. [Google Scholar] [CrossRef]
- Zhang, M.-Y.; Li, S.-H.; Huang, G.-L.; Lin, G.-H.; Shuang, Z.-Y.; Lao, X.-M.; Xu, L.; Lin, X.-J.; Wang, H.-Y.; Li, S.-P. Identification of a novel microRNA signature associated with intrahepatic cholangiocarcinoma (ICC) patient prognosis. BMC Cancer 2015, 15, 64. [Google Scholar] [CrossRef]
- Chen, L.; Yan, H.-X.; Yang, W.; Hu, L.; Yu, L.-X.; Liu, Q.; Li, L.; Huang, D.-D.; Ding, J.; Shen, F.; et al. The role of microRNA expression pattern in human intrahepatic cholangiocarcinoma. J. Hepatol. 2009, 50, 358–369. [Google Scholar] [CrossRef]
- Li, H.; Zhou, Z.-Q.; Yang, Z.-R.; Tong, D.-N.; Guan, J.; Shi, B.-J.; Nie, J.; Ding, X.-T.; Li, B.; Zhou, G.-W.; et al. MicroRNA-191 acts as a tumor promoter by modulating the TET1-p53 pathway in intrahepatic cholangiocarcinoma. Hepatology 2017, 66, 136–151. [Google Scholar] [CrossRef] [PubMed]
- Koshizuka, K.; Kikkawa, N.; Hanazawa, T.; Yamada, Y.; Okato, A.; Arai, T.; Katada, K.; Okamoto, Y.; Seki, N. Inhibition of integrin β1-mediated oncogenic signalling by the antitumor microRNA-29 family in head and neck squamous cell carcinoma. Oncotarget 2017, 9, 3663–3676. [Google Scholar] [CrossRef]
- Mizuno, K.; Seki, N.; Mataki, H.; Matsushita, R.; Kamikawaji, K.; Kumamoto, T.; Takagi, K.; Goto, Y.; Nishikawa, R.; Kato, M.; et al. Tumor-suppressive microRNA-29 family inhibits cancer cell migration and invasion directly targeting LOXL2 in lung squamous cell carcinoma. Int. J. Oncol. 2016, 48, 450–460. [Google Scholar] [CrossRef]
- Qin, X.; Song, Y. Bioinformatics Analysis Identifies the Estrogen Receptor 1 (ESR1) Gene and hsa-miR-26a-5p as Potential Prognostic Biomarkers in Patients with Intrahepatic Cholangiocarcinoma. Med. Sci. Monit. 2020, 26, 921815. [Google Scholar] [CrossRef]
- Poos, K.; Smida, J.; Nathrath, M.; Maugg, D.; Baumhoer, D.; Korsching, E. How MicroRNA and Transcription Factor Co-regulatory Networks Affect Osteosarcoma Cell Proliferation. PLoS Comput. Biol. 2013, 9, e1003210. [Google Scholar] [CrossRef]
- Zhuang, H.; Zhou, Z.; Ma, Z.; Li, Z.; Liu, C.; Huang, S.; Zhang, C.; Hou, B. Characterization of the prognostic and oncologic values of ITGB superfamily members in pancreatic cancer. J. Cell. Mol. Med. 2020, 24, 13481–13493. [Google Scholar] [CrossRef]
- Hamurcu, Z.; Kahraman, N.; Ashour, A.; Ozpolat, B. FOXM1 transcriptionally regulates expression of integrin β1 in triple-negative breast cancer. Breast Cancer Res. Treat. 2017, 163, 485–493. [Google Scholar] [CrossRef]
- Nakamura, H.; Arai, Y.; Totoki, Y.; Shirota, T.; ElZawahry, A.; Kato, M.; Hama, N.; Hosoda, F.; Urushidate, T.; Ohashi, S.; et al. Genomic spectra of biliary tract cancer. Nat. Genet. 2015, 47, 1003–1010. [Google Scholar] [CrossRef]
- Fujimoto, A.; Furuta, M.; Totoki, Y.; Tsunoda, T.; Kato, M.; Shiraishi, Y.; Tanaka, H.; Taniguchi, H.; Kawakami, Y.; Ueno, M.; et al. Whole-genome mutational landscape and characterization of noncoding and structural mutations in liver cancer. Nat. Genet. 2016, 48, 500–509. [Google Scholar] [CrossRef]
- Xia, L.; Chen, X.; Yang, J.; Zhu, S.; Zhang, L.; Yin, Q.; Hong, Y.; Chen, H.; Chen, G.; Li, H. Long Non-Coding RNA-PAICC Promotes the Tumorigenesis of Human Intrahepatic Cholangiocarcinoma by Increasing YAP1 Transcription. Front. Oncol. 2021, 10, 595533. [Google Scholar] [CrossRef]
- Li, O.; Yi, W.; Yang, P.; Guo, C.; Peng, C. Long non-coding RNA UCA1 promotes proliferation and invasion of intrahepatic cholangiocarcinoma cells through targeting microRNA-122. Exp. Ther. Med. 2019, 18, 25–32. [Google Scholar] [CrossRef]
- Kinoshita, T.; Nohata, N.; Hanazawa, T.; Kikkawa, N.; Yamamoto, N.; Yoshino, H.; Itesako, T.; Enokida, H.; Nakagawa, M.; Okamoto, Y.; et al. Tumour-suppressive microRNA-29s inhibit cancer cell migration and invasion by targeting laminin–integrin signalling in head and neck squamous cell carcinoma. Br. J. Cancer 2013, 109, 2636–2645. [Google Scholar] [CrossRef]
- Leng, Y.; Chen, Z.; Ding, H.; Zhao, X.; Qin, L.; Pan, Y. Overexpression of microRNA-29b inhibits epithelial-mesenchymal transition and angiogenesis of colorectal cancer through the ETV4/ERK/EGFR axis. Cancer Cell Int. 2021, 21, 17. [Google Scholar] [CrossRef] [PubMed]
- Feng, S.; Luo, S.; Ji, C.; Shi, J. miR-29c-3p regulates proliferation and migration in ovarian cancer by targeting KIF4A. World J. Surg. Oncol. 2020, 18, 315. [Google Scholar] [CrossRef]
- Yang, J.; Gong, X.; Yang, J.; Ouyang, L.; Xiao, R.; You, X.; Ouyang, Y. Suppressive role of microRNA-29 in hepatocellular carcinoma via targeting IGF2BP1. Int. J. Clin. Exp. Pathol. 2018, 11, 1175–1185. [Google Scholar] [PubMed]
- Zhang, N.-S.; Dai, G.-L.; Liu, S.-J. MicroRNA-29 family functions as a tumor suppressor by targeting RPS15A and regulating cell cycle in hepatocellular carcinoma. Int. J. Clin. Exp. Pathol. 2017, 10, 8031–8042. [Google Scholar]
- Wong, C.C.-L.; Tse, A.P.-W.; Huang, Y.-P.; Zhu, Y.-T.; Chiu, D.K.-C.; Lai, R.K.-H.; Au, S.L.-K.; Kai, A.K.-L.; Lee, J.M.-F.; Wei, L.L.; et al. Lysyl oxidase-like 2 is critical to tumor microenvironment and metastatic niche formation in hepatocellular carcinoma. Hepatology 2014, 60, 1645–1658. [Google Scholar] [CrossRef]
- Loosen, S.H.; Lurje, G.; Wiltberger, G.; Vucur, M.; Koch, A.; Kather, J.N.; Paffenholz, P.; Tacke, F.; Ulmer, F.T.; Trautwein, C.; et al. Serum levels of miR-29, miR-122, miR-155 and miR-192 are elevated in patients with cholangiocarcinoma. PLoS ONE 2019, 14, e0210944. [Google Scholar] [CrossRef] [PubMed]
- Takada, Y.; Ye, X.; Simon, S. The integrins. Genome Biol. 2007, 8, 215. [Google Scholar] [CrossRef]
- Sekiya, Y.; Ogawa, T.; Yoshizato, K.; Ikeda, K.; Kawada, N. Suppression of hepatic stellate cell activation by microRNA-29b. Biochem. Biophys. Res. Commun. 2011, 412, 74–79. [Google Scholar] [CrossRef]
- Volpes, R.; Oord, J.J.V.D.; Desmet, V.J. Integrins as differential cell lineage markers of primary liver tumors. Am. J. Pathol. 1993, 142, 1483–1492. [Google Scholar]
- Koshizuka, K.; Nohata, N.; Hanazawa, T.; Kikkawa, N.; Arai, T.; Okato, A.; Fukumoto, I.; Katada, K.; Okamoto, Y.; Seki, N. Deep sequencing-based microRNA expression signatures in head and neck squamous cell carcinoma: Dual strands of pre-miR-150 as antitumor miRNAs. Oncotarget 2017, 8, 30288–30304. [Google Scholar] [CrossRef]
- Koshizuka, K.; Hanazawa, T.; Kikkawa, N.; Arai, T.; Okato, A.; Kurozumi, A.; Kato, M.; Katada, K.; Okamoto, Y.; Seki, N. Regulation of ITGA3 by the anti-tumor miR-199 family inhibits cancer cell migration and invasion in head and neck cancer. Cancer Sci. 2017, 108, 1681–1692. [Google Scholar] [CrossRef]
- Sandborn, W.J.; Feagan, B.G.; Rutgeerts, P.; Hanauer, S.; Colombel, J.-F.; Sands, B.E.; Lukas, M.; Fedorak, R.; Lee, S.; Bressler, B.; et al. Vedolizumab as Induction and Maintenance Therapy for Crohn’s Disease. N. Engl. J. Med. 2013, 369, 711–721. [Google Scholar] [CrossRef]
- Mas-Moruno, C.; Rechenmacher, F.; Kessler, H. Cilengitide: The First Anti-Angiogenic Small Molecule Drug Candidate. Design, Synthesis and Clinical Evaluation. Anti-Cancer Agents Med. Chem. 2010, 10, 753–768. [Google Scholar] [CrossRef]
- Kurozumi, K.; Ichikawa, T.; Onishi, M.; Fujii, K.; Date, I. Cilengitide Treatment for Malignant Glioma: Current Status and Future Direction. Neurol. Med. Chir. 2012, 52, 539–547. [Google Scholar] [CrossRef]
- Armstrong, P.C.; Peter, K. GPIIb/IIIa inhibitors: From bench to bedside and back to bench again. Thromb. Haemost. 2012, 107, 808–814. [Google Scholar] [CrossRef]
- Li, J.; Du, S.; Sheng, X.; Liu, J.; Cen, B.; Huang, F.; He, Y. MicroRNA-29b Inhibits Endometrial Fibrosis by Regulating the Sp1-TGF-β1/Smad-CTGF Axis in a Rat Model. Reprod. Sci. 2015, 23, 386–394. [Google Scholar] [CrossRef]
- Zhang, G.; Shi, H.; Wang, L.; Zhou, M.; Wang, Z.; Liu, X.; Cheng, L.; Li, W.; Li, X. MicroRNA and Transcription Factor Mediated Regulatory Network Analysis Reveals Critical Regulators and Regulatory Modules in Myocardial Infarction. PLoS ONE 2015, 10, e0135339. [Google Scholar] [CrossRef]
- Beishline, K.; Azizkhan-Clifford, J. Sp1 and the ‘hallmarks of cancer’. FEBS J. 2015, 282, 224–258. [Google Scholar] [CrossRef]
- Safe, S.; Abbruzzese, J.L.; Abdelrahim, M.; Hedrick, E. Specificity Protein Transcription Factors and Cancer: Opportunities for Drug Development. Cancer Prev. Res. 2018, 11, 371–382. [Google Scholar] [CrossRef] [PubMed]
- Vizcaíno, C.; Mansilla, S.; Portugal, J. Sp1 transcription factor: A long-standing target in cancer chemotherapy. Pharmacol. Ther. 2015, 152, 111–124. [Google Scholar] [CrossRef] [PubMed]


Publisher’s Note: MDPI stays neutral with regard to jurisdictional claims in published maps and institutional affiliations. |
© 2021 by the authors. Licensee MDPI, Basel, Switzerland. This article is an open access article distributed under the terms and conditions of the Creative Commons Attribution (CC BY) license (https://creativecommons.org/licenses/by/4.0/).