Simple Summary
Metabolic flexibility is one of the key hallmarks of cancer and metabolites are the final products of this adaptation, reflecting the aberrant changes of tumors. However, the metabolic plasticity of each cancer type is still unknown, and specifically to date, there are no data on metabolic profile in neuroendocrine tumors. The aim of our retrospective study was to assess the metabolomic profile of NET patients to understand metabolic deregulation in these tumors and identify novel biomarkers with clinical potential. We provided, for the first time, a comprehensive metabolic profile of NET patients and identifies a distinctive metabolic signature in plasma of potential clinical use, selecting a reduced set of metabolites of high diagnostic accuracy. We have identified 32 novel enriched metabolic pathways in NETs related with the TCA cycle, and with arginine, pyruvate or glutathione metabolism, which have distinct implications in oncogenesis and may open innovative avenues of clinical research.
Abstract
Purpose: High-throughput “-omic” technologies have enabled the detailed analysis of metabolic networks in several cancers, but NETs have not been explored to date. We aim to assess the metabolomic profile of NET patients to understand metabolic deregulation in these tumors and identify novel biomarkers with clinical potential. Methods: Plasma samples from 77 NETs and 68 controls were profiled by GC−MS, CE−MS and LC−MS untargeted metabolomics. OPLS-DA was performed to evaluate metabolomic differences. Related pathways were explored using Metaboanalyst 4.0. Finally, ROC and OPLS-DA analyses were performed to select metabolites with biomarker potential. Results: We identified 155 differential compounds between NETs and controls. We have detected an increase of bile acids, sugars, oxidized lipids and oxidized products from arachidonic acid and a decrease of carnitine levels in NETs. MPA/MSEA identified 32 enriched metabolic pathways in NETs related with the TCA cycle and amino acid metabolism. Finally, OPLS-DA and ROC analysis revealed 48 metabolites with diagnostic potential. Conclusions: This study provides, for the first time, a comprehensive metabolic profile of NET patients and identifies a distinctive metabolic signature in plasma of potential clinical use. A reduced set of metabolites of high diagnostic accuracy has been identified. Additionally, new enriched metabolic pathways annotated may open innovative avenues of clinical research.
1. Introduction
Reprogrammed metabolism encompasses the capacity of cells to respond or adapt their metabolic signaling to support and enable cell survival in unfavorable or hostile conditions. This ability is enhanced in cancer cells in order to improve their adaptive phenotype and maintain both viability and uncontrolled proliferation. Metabolic flexibility is therefore one of the key hallmarks of cancer [1], although the pathways involved in the metabolic plasticity of each cancer type remain to be elucidated. Metabolites are the final products of this adaptation, reflecting the aberrant changes in the genomic, transcriptomic and proteomic variability of tumors, and provide therefore useful biological and clinical information on cancer initiation and progression [2,3,4]. This, together with the fact that metabolomics can be easily performed in readily accessible biological samples (plasma, urine), makes metabolic profiling of cancer patients a promising tool to characterize the tumor phenotype and identify novel biomarkers of potential clinical use. Systems medicine approaches integrating high-throughput “-omic” technologies into diagnostic platforms have indeed enabled the detailed analysis of metabolic networks (known as metabolomics) in several cancers of high incidence, prevalence and mortality [5,6,7,8], but these do not include neuroendocrine neoplasms (NENs).
NENs comprise a heterogeneous family of rare tumors of increasing incidence and challenging clinical management [9]. Although they can arise in virtually any organ, the most common primary tumor sites are the lungs (25%) and the digestive tract (~65%). Well-differentiated neuroendocrine tumors (NETs) account for ~80% of all NENs, have a rather indolent clinical behavior, as compared to their exocrine counterparts, and are associated with a good to moderate prognosis depending on primary tumor site, proliferative index (ki67 or mitotic index) and tumor stage. About 20% of NETs have also the unique ability to produce and secrete amines or peptide hormones to the blood stream, the so-called “functioning tumors”, that produce specific endocrine syndromes (i.e., carcinoid syndrome) that may seriously impair patients quality of life and prognosis [10]. Survival has improved over time for all NETs, likely reflecting earlier diagnosis and improvements in therapy [11,12]. However, a significant proportion of patients are still diagnosed with advanced stages of disease, highlighting the need to identify novel specific biomarkers that may contribute to an earlier detection and an increased likelihood of cure.
The study of hereditary genetic syndromes associated with an increased predisposition to develop NETs (~5%) has contributed to partially elucidate some of the mechanisms involved in their tumorigenesis [13,14,15,16,17,18]. Germline mutations in MEN1, RET, CDKN1B, VHL, NF1 and TSC1/2 are the molecular alterations most frequently detected in hereditary NENs. Although some of these mutations have a relevant representation in sporadic NETs (i.e., MEN1, TSC1/2), other molecular alterations involved in epigenetic regulation, DNA repair, telomeres regulation and chromosomal rearrangements have been also implicated [19,20,21]. Despite these recent advances, however, the molecular mechanisms of NET genesis and progression remain largely unraveled. In addition, few authors have explored NETs from a metabolomic perspective. A pilot prospective study analyzed urine samples from 28 gastroenteropancreatic NET patients by nuclear magnetic resonance (NMR) spectroscopy, and showed distinct metabolomic phenotypes by primary tumor site (small bowel versus pancreatic NEN) and function [22]. A second recent work described the metabolomic fingerprint of 46 small intestine NET tissues analyzed by NMR spectroscopy, suggesting the existence of complex metabolic pathways in NETs, possibly influencing tumor development and evolution, and thereby clinical outcome [23]. With the exception of these two small studies, the metabolomic profile of patients with NETs has not been studied to date.
In this context, the aim of our study was to perform a comprehensive metabolic profiling of NETs to better understand metabolic dysregulation in these tumors and identify novel biomarkers of potential clinical use. To this aim, multiplatform untargeted metabolomic analyses were performed in plasma samples of 77 patients with advanced gastrointestinal and lung NETs, and 68 non-cancer individuals (controls). The diagnostic potential and biological relevance of differential metabolites identified was assessed, and dysregulated pathways were explored to provide further insight into the molecular mechanisms involved in NET development and progression.
2. Results
2.1. Metabolomic Profiling in Plasma of Patients with Neuroendocrine Tumors
The metabolite fingerprint was assessed using a multiplatform LC-MS, GC-MS and CE-MS approach in plasma of 77 patients diagnosed with NETs and of 68 non-cancer individuals (controls). Main characteristics of the study population are summarized in Table S1. All patients had well-differentiated G1-2 NETs (33.8% G1 and 66.2% G2), the most common primary tumor site was the small intestine (58.4%) and one-third had functioning tumors (carcinoid syndrome).
Data obtained after peak alignment and filtering were used for multivariate analysis of unsupervised principal components (PCAs) to verify the distribution of QCs in each technique. System stability, performance and reproducibility of sample treatment procedures were reflected with the spontaneous grouping of these QC samples (Figure S1).
For each platform in multivariate analysis, unsupervised (Figure S2), and supervised PLS-DA and OPLS-DA models were also conducted. OPLS-DA supervised models were used to model differences between groups and were validated using permutation tests (Figure 1A–D).
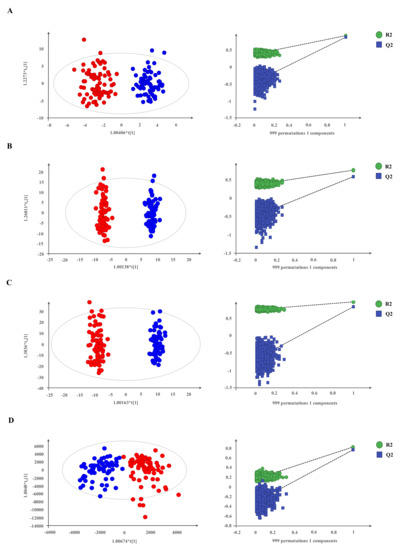
Figure 1.
Supervised models show a clear separation between NET patients and non-cancer individuals. (A–D) OPLS-DA score plots and permutation tests of OPLS-DA models for each platform through 999 permutations. Panel (A) for CE-MS data (R2 = 0.872, Q2 = 0.843); panel (B), LC-MS/ESI(+) data (R2 = 0.954, Q2 = 0.871); panel (C), LC-MS/ESI(−) data (R2 = 0.885, Q2 = 0.788) and panel (D), GC-MS data (R2 = 0.781, Q2 = 0.744). Red dots, NETs (n = 77); blue dots, non-cancer individuals (n = 68).
All analytical techniques clearly discriminated NET patients from non-cancer individuals in the applied models. A total of 1006 metabolites were detected and univariate analysis revealed the following individually significant differential metabolites between cases and controls: 75 compounds in CE–MS, 150 in LC–MS ESI(+), 296 in LC–MS ESI(−) and 19 in GC–MS. These variables were annotated and/or identified as described in “Annotation and compound identification” in the Material and Methods section and are summarized in Table 1.

Table 1.
List of the statistically significant annotated metabolites discriminating between the plasma profiles of control (n = 68) and NET patients (n = 77) with their statistical characteristics after UVDA and MVDA (percentage of change, p-value, p(corr) and VIP) and analytical descriptors (measured mass and its deviation from the theoretical one, experimental retention time, analytical platform on which it has been detected, identification source where DB corresponds to database result, confidence level for identification according to the metabolomics standards initiative and its corresponding Human Metabolome Database (HMDB) code (http://www.hmdb.ca/, accessed on 16 December 2020)). (* = Multiple identification options).
The integration of metabolic data acquired by different analytical platforms resulted in 155 identified metabolites with a differential availability in NET patients (p < 0.05), when compared to non-cancer individuals. Metabolite identification of some specific metabolites (arginine, glutamine, phenylalanine, among others) across more than one analytical platform significantly increases the confidence of metabolite identification (Table 1). No significant differences were found by gender, age, grade, primary tumor site and hormonal syndrome.
2.2. NETs Show a Particular Signature of Metabolites with Diagnostic Potential
The unsupervised heatmap cluster plot of the 155 metabolites identified with a differential availability in NET patients as compared to non-cancer individuals is shown in Figure S3. Given the relevant capacity to discriminate NET patients from non-cancer individuals, we applied ROC analysis and calculated the AUC of each identified metabolite to determine their individual performance as NET diagnostic biomarkers. We also calculated the variable importance in projection (VIP) score from the OPLS-DA model. VIP score estimates the importance of each metabolite in the model and therefore, their ability to discriminate NETs from non-cancer patients. Table S2 summarizes the ROC and OPLS-DA analyses of the 155 differential plasmatic metabolites identified between NETs and controls. Those with an AUC > 0.85, a VIP > 1.0 and a |p(corr)| > 0.5 or both were considered as metabolites with biomarker potential. Twenty-seven metabolites had both an AUC > 0.85 and a VIP > 1.0 and a |p(corr)| > 0.5; 17 metabolites had only a VIP > 1.0 and a |p(corr)| > 0.5 and 5 metabolites had only an AUC > 0.85. Overall, thus, we identified 49 metabolites with significant diagnostic potential.
Next, to determine which molecules were directly related to NETs independent of other clinical factors, we performed a logistic regression model (LRM) for each selected metabolite adjusted for gender, age, glycemia, creatinine levels and selected concomitant drugs as potential confounding variables before the inclusion in the model (Table S3). Only up to two significant drug associations (p < 0.05) were included in the LRM of each metabolite in order to avoid overfitting due to excessive explicative features. Out of the 49 metabolites assessed, only one metabolite, suberyl-glycine, was not significantly contributing to explain the classification output in its model (Table S4), indicating a poorer diagnostic ability. Thus, 48 metabolites were significantly contributing to explain the classification model (NET vs. non-cancer patients), independent of other confounding factors. The unsupervised heatmap cluster plot of these 48 metabolites clearly discriminated two clusters, one gathered all NET patients and the other one all the non-cancer individuals (Figure 2).
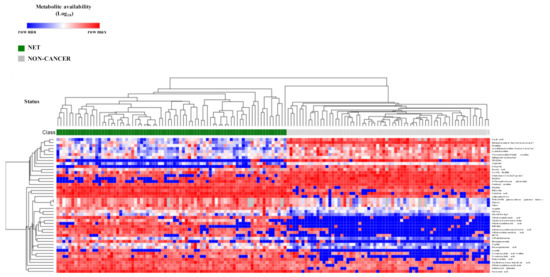
Figure 2.
Metabolite biomarker candidates show high diagnostic potential of NET patients. Unsupervised hierarchical heatmap of differential plasmatic metabolites (n = 48) between NET (n = 77) and non-cancer (n = 68) patients. All samples are shown in columns and metabolites in rows. Hierarchical clustering was performed on rows and columns using One minus Pearson correlation metric and average as linkage method. Individual values were coded as colors, ranging from blue (row minimum) to red (row maximum). This analysis clearly discriminated two clusters, one encompassing all NET patients and the other one all non-oncologic control patients.
Finally, to validate the identity, differential expression and biomarker potential of these 48 metabolites, we performed a targeted metabolomic analysis (LC- QQQ-MS) of 13 selected metabolites based on their nature, stability and ability to be analyzed and quantified (Table S5), as described in Material and Methods.
Arginine, 1-methyladenosine, biliverdin, 5-hidroxyindolacetic acid, linoleoylcarnitine, oleoylcarnitine, sphingosine-1-phosphate, 15-hidroxyeicosatetraenoic acid, ursodeoxycholic acid and ursodeoxycholic acid 3-sulfate identities were confirmed as potential diagnostic biomarkers of NETs, while bilirubin, 3-hidroxydodecanodioic acid and 3-hidroxydodecanoic were not (Table S6), probably due to their instability. Distribution of plasma abundance and ROC curves of the validated metabolites with diagnostic potential in NETs and non-cancer patients were showed in Figure 3.
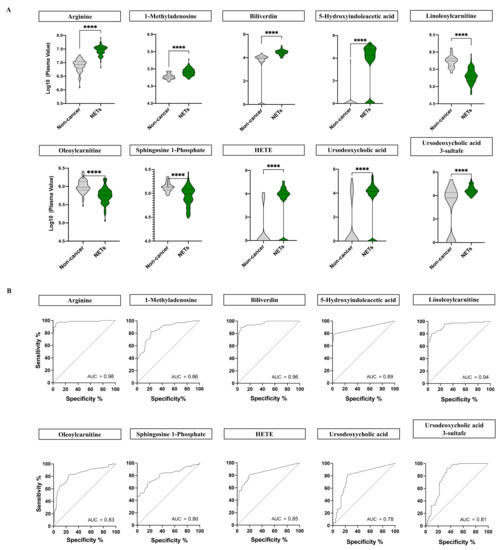
Figure 3.
(A) Plasma abundance of the 10 validated metabolites with diagnostic potential in NETs. Violin plots and non-parametric Mann-Whitney U test were performed to assess the abundance and distribution of the 10 validated metabolites in NET patients (n = 77) and non-cancer individuals (n = 68). Log plasma values in NET patients are shown in green whereas non-cancer individuals are plotted in grey. Continuous lines correspond to the median values whereas dashed lines relate to quartiles Overall, all the validated metabolites showed significant differences (****; p < 0.0001) between NET and non-cancer individuals. (B) Receiver operating characteristic (ROC) curves of the 10 validated metabolites with biomarker potential in NETs. The curves were built based on the area under the curve (AUC) analysis of patients (n = 77) and non-cancer individuals (n = 68). The optimal cut-off points were selected according to the maximization of the Youden Index. Overall, all the validated metabolites showed high biomarker potential with AUC > 0.75.
2.3. Biochemical and Functional Nature of Identified Metabolites in NET Patients
To better understand the molecular nature of metabolites involved in NETs we classified the 155 differential metabolites according to their biochemical class. The main predominant categories identified were amino acids, peptides and their derivatives (27.7%), fatty acids (16.1%), glycerophopholipids (14.2%), steroids and derivatives (9.7%) and carbohydrates and their conjugates (3.9%) (Figure 4A). Seventy-two percent of all differential metabolites were upregulated in NET patients. The proportion of up- or downregulated metabolites by biochemical class is summarized in Figure 4B.
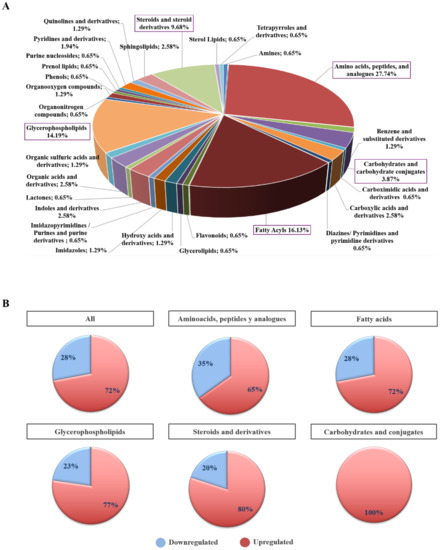
Figure 4.
Biochemical classification of differential plasma metabolites in NET patients. (A) Pie chart showing the percentage distribution of biochemical classes of differential and annotated plasmatic metabolites (n = 155) in NETs (n = 77) vs. non-cancer (n = 68) individuals. Metabolites were classified into 28 classes according to their biochemical nature. This analysis revealed amino acids, peptides and analogues (n = 43; 27.74%), fatty acyls (n = 26; 16.13%), glycerophospholipids (n = 22; 14.19%), steroids and steroid derivatives (n = 16; 9.68%), and carbohydrates and carbohydrate conjugates (n = 6; 3.87%) as the most represented biochemical classes. (B) Bar chart summarizing the percentage of up- and downregulated plasmatic metabolites in the main biochemical classes found to be biologically relevant in NET (n = 77) vs. non-cancer (n = 68) individuals. Overall, upregulation (72%) prevailed over downregulation (28%) in our metabolite set (n =155). This upregulated vs. downregulated metabolite trend remained constant for all main biochemical classes: amino acids, peptides and analogues (65% vs. 35%), fatty acyls (72% vs. 28%), glycerophospholipids (77% vs. 23%), steroids and steroid derivatives (80% vs. 20%), and carbohydrates and carbohydrate conjugates (100%).
Interestingly, the main predominant categories of lipids following the official classification [24] were glycerophospholipids, fatty acids and sterols. Glycerophospholipids represent the largest class of lipids found to be altered. Lyso forms were increased in contrast to glycerophosphocolines and glycerophosphoethanolamines which were downregulated. Oxidized lysoglycerophospholipids (oxLPCs) were found with increased abundances in the NET group, and there are very few studies to date where oxLPCs have been measured. Fatty acids and their derivatives account for about 30% of the measured lipids, and it is easily noticed that there was an overall decrease in carnitine levels. In addition to that, we have been able to identify increased levels of oxidized derivatives of arachidonic acid (HETE) [25]. Other predominant group, sterols, consisted mainly of bile acids and had a high content in the NET group.
NET patients also presented higher levels of sugars and citric acid and lower levels of lactic and pyruvic acid, which are key metabolites in glycolysis and the tricarboxylic acid cycle (TCA)). A remarkable increase in serotonin and its principal metabolite, 5-hydroxyindoleacetic acid, was also detected in the NET cohort, a hormone secreted in excess in patients with carcinoid syndrome.
2.4. Differential Metabolites in NET Patients Are Related with Molecular Pathways Associated with Cancer
Considering the functional relevance of the selected metabolites documented in the literature, we found several enriched pathways related to oncogenesis, some specifically involved in NET development, such as angiogenesis, mTOR pathway, tryptophan metabolism, Warburg effect, oxidative stress, and urea cycle, among others (Figure S5A). The proportion of metabolites up- or downregulated by the pathway is summarized in Figure S5B.
Pathway analysis of the 155 differential metabolites identified several molecular dysregulated pathways in NETs. Metabolite Pathway Analysis (MPA) showed that arginine biosynthesis, arginine and proline metabolism, animoacyl-tRNA biosynthesis, citrate cycle and pyruvate, glutathione, glyoxylate, dicarboxylate, alanine, aspartate and glutamate metabolisms were the most commonly dysregulated pathways in NET patients (Figure 5A and Table S7). Moreover, Metabolite Set Enrichment Analysis (MSEA), where we used different sets of metabolites from MPA, suggested that tryptophan metabolism and urea cycle, among others, were also dysregulated in NETs (Figure 5B and Table S8).
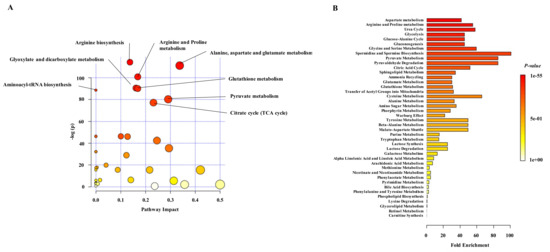
Figure 5.
Pathway analysis of differential plasma metabolites in NET patients. (A) Metabolite Pathway Analysis (MPA) representing the significant enriched pathways (FDR < 0.05) by availability of selected metabolites (n = 155) in plasma of NET patients. The x-axis indicates the impact of matched metabolites of our dataset on the pathway from the topology analysis. The -log(pval) is plotted in the y axis and shows to which extent the pathway is enriched. Circle size represents the impact factor of matched metabolites in the pathway, and circle color indicates the pathway enrichment significance. The most enriched pathways among the 32 significant ones were: arginine biosynthesis (FDR: 1.0143 × 10−48); alanine, aspartate and glutamate metabolism (FDR: 2.2363 × 10−47); arginine and proline metabolism (FDR: 6.3629 × 10−43); glyoxylate and dicarboxylate metabolism (FDR: 1.8621 × 10−38); glutathione metabolism (FDR: 2.8086 × 10−38); aminoacyl-tRNA biosynthesis (FDR: 1.1784 × 10−37); pyruvate metabolism (FDR: 5.0802 × 10⁻³⁴) and citrate cycle (FDR: 1.0634 × 10⁻³²). (B) MSEA of differential plasma metabolites in NET patients. X-axis represents the fold enrichment of each metabolite set and the colour of the bars indicates the raw p-value. Thirty-four metabolite sets were significantly enriched (FDR < 0.05). Aspartate metabolism (Q = 28.809), arginine and proline metabolism (Q = 38.272), urea cycle (Q = 40.438), glycolysis (Q = 31.619) and glucose and alanine cycle (Q = 31.619) were the most significantly enriched metabolite sets.
MPA and MSEA performed with the 48 metabolites with greater diagnostic potential confirmed arginine biosynthesis, arginine and proline metabolism, amimoacyl-tRNA biosynthesis, citrate cycle, pyruvate and glutathione metabolism, and urea cycle were the most relevant dysregulated pathways in NET patients (Figure S4, Tables S9 and S10).
3. Discussion
Our study provides, for the first time, a comprehensive metabolomic profile of NETs, assessed by multiplatform untargeted metabolomic profiling of plasma samples in a large cohort of patients with advanced disease, and identifies a distinctive metabolic signature of potential clinical use. The integration of metabolic data acquired by GC, CE and LC coupled to MS identified 155 differential compounds between NETs and non-cancer patients. ROC and OPLS-DA analysis revealed 49 specific metabolites of diagnostic potential, 48 of which significantly contributed to the model after adjustment for other potential confounding variables such as gender, age, glycemia, creatinine levels and concomitant drug therapy. The unsupervised heatmap cluster plot of these 48 metabolites clearly identified two distinct clusters, one encompassing all NET patients and the other one all non-cancer individuals. Although biochemical assessment of several peptides is currently used in the clinic for the diagnosis and follow-up of NET patients, the use of general tumor markers such as chromogranin A (CgA) or neuron-specific enolase (NSE) is not recommended for screening nor are they sufficiently reliable as sole diagnostic procedures as they may be increased in several other oncological and non-oncological conditions [26]. In this context, the high diagnostic accuracy of the identified metabolites in our study may provide very valuable new tools to improve the specific detection of NETs.
Differential metabolites identified were related with classical cancer pathways (apoptosis, cell cycle) and NET signaling (tryptophan metabolism, angiogenesis or the mTOR pathway). In addition, we identified 32 novel enriched metabolic pathways in NETs related with the TCA cycle, and with arginine, pyruvate or glutathione metabolism, which have distinct implications in oncogenesis. To date, only two small studies have partially explored the metabolomic profile of NET patients, but none of them using plasma samples as main source of metabolic analysis. Kinross et al. conducted a prospective pilot study that analyzed urine samples of 28 gastroenteropancreatic NETs by 1H-NMR spectroscopic profiling. Distinct metabolomic phenotypes were identified by primary tumor site (small bowel versus pancreatic NEN) and function, and they also observed that variations in hippurate metabolism strongly contributed to the class description. This study had, however, important limitations such as the limited sample size, the substantial age gap between control and tumor populations, and the lack of control of other potential confounding variables such as gender, renal function or concomitant drug therapy [22]. More recently, Imperiale et al. assessed the metabolomic fingerprint of 46 small intestinal NET primary tumors and 18 liver NET metastases by 1H-NMR spectroscopy, as compared to 30 normal small intestine and liver samples, and results suggested alterations in crucial metabolic pathways such as the tricarboxylic acid cycle (TCA cycle). Our study also shows an increase in the TCA cycle activity, reflected by the high availability of isocitrate/citrate compounds in the plasma of NET patients (+64%). Moreover, high levels of glucose (+174%), glutamine (+69%) and fatty acids, which fuel the TCA cycle further support the hypothesis of TCA upregulation in NETs. Studies conducted in other hormone-dependent tumors, such as prostate cancer, emphasize the relevance of altered intermediary metabolism in malignant transformation. More specifically, the metabolic transformation of citrate-producing normal cells to citrate-oxidizing malignant cells has been implicated in oncogenesis. Citrate oxidation in the TCA cycle to produce ATP has important implications on cellular bioenergetics, cell growth, apoptosis, lipogenesis and angiogenesis [27]. The TCA cycle is a convergence point in the cellular respiration machinery, strictly regulated to fulfill cell bioenergetics, biosynthetic and redox balance requirements. Although several tumors types are characterized by a marked deregulation of TCA enzymes [28], its involvement in cancer metabolism remains incompletely understood.
The presence of high levels of isocitrate/citrate in plasma of NET patients could also derive from exported citrate from the mitochondrial pool to be used for lipogenesis [29]. Our data show a characteristic lipidome in NET patients, mainly represented by the enrichment of glycerophospholipids, fatty acids and sterols. More specifically, oxidized lysoglycerophospholipids (oxLPCs) were found with increased abundances in NETs indicating a strong oxidative stress in these tumors, as well as high levels of oxidized derivatives of arachidonic acid (HETE), and a major decrease in carnitine levels [25]. L-carnitine is an essential metabolite, critical for the bidirectional transport of long-chain fatty acyl and the acyl coenzyme A between the cytosol and the mitochondria, which has been considered a bottleneck in the metabolism control of cancer cells [30,31]. Recent reports suggest that the carnitine system is essential for the metabolic adaptation of cancer cells, which obtain energy from beta-oxidation of lipids. Thus, low levels of carnitine in plasma of NET patients may be related to the active carnitine system in tumor mitochondria and the upregulation of beta-oxidation pathways.
Arachidonic acid (AA) is a polyunsaturated fatty acid, which is subsequently metabolized through three different enzymatic pathways (cyclooxygenase (COX), lipoxygenase (LOX) and cytochrome (CYP) P450) leading to a wide variety of lipid mediators (HETE) involved in multiple physiological and pathophysiological processes [32]. In addition to high levels of AA in plasma of NET patients, we have also found an important increase of eicosanoids derivatives, intimately related to inflammatory responses [32].
Tumor progression is also dependent on cholesterol metabolism as proliferating cells increase cholesterol uptake. Cancer cells adapt the high requirements of intracellular cholesterol through different mechanisms including the endogenous production of cholesterol and fatty acids, a reduction of their efflux through transporters or an increase in the uptake of low-density lipid particles [33]. Plasma of NET patients show high content of sterols, mainly bile acids, and cholesterol derivatives such as vitamin D, biliverdin and bilirubin, suggesting the dependency of NETs on lipid and sterol metabolism.
Vascularization and angiogenesis have a particular relevance in NET development and progression [34], and several differential metabolites identified in our study may contribute to the angiogenesis switch. For example, arginine was found to be upregulated in NETs and is the main source of nitric oxide. NO exhibits both anti- and pro-tumoral effects, and is deeply involved in the regulation of angiogenesis, apoptosis, cell cycle, invasion and metastasis [35]. Similarly, lysophosphatidic acid, HETEs or biliverdin induce angiogenesis by upregulation of VEGFA, VEGFC, IL-1β and IL-8 [36,37,38]. Overall, these findings further support the relevant role that angiogenesis plays in the pathogenesis of NETs.
The mTOR pathway is also critical in NETs [39]. In fact, an mTOR inhibitor, everolimus, has demonstrated antiproliferative activity in these neoplasms and is approved for the treatment of advanced gastrointestinal, pancreatic and lung NETs [40,41]. In our study, we detected very high plasma levels of arginine (+243%) and glutamine (+69%) in NET patients, which are, together with leucine, stimulators of mTOR via the regulation complex. Moreover, an increased abundance of phosphatidylcholine (+51% PC(32:0), +39% PC(38:2) and −28% PC(38:5)) was also observed, the synthesis of which is promoted by mTORC1. Interestingly, the mTOR pathway has been associated with cancer through its role in the regulation of polyamine dynamics [42]. Polyamine levels are associated with a reduction of apoptosis and an increase of cancer cell proliferation and expression of metastasis-related genes, although the mechanisms underlying these effects have not been well defined [43]. Of note, we detected a 38% increase in the acetylspermidine polyamine, illustrating the relevance of polyamines metabolism inNETs. Recently, Chalishazar et al. observed that MYC-driven small-cell lung cancer (SCLC) preferentially depends on arginine-regulated pathways, including polyamine biosynthesis and mTOR pathway activation [44]. ASS1, which indirectly produces arginine in the urea cycle, is often decreased or even abolished through epigenetic silencing in many cancers, including SCLC. Moreover, ASS1 knockdown results in increased mTOR activity and in arginine auxotrophy. Thus, arginine deprivation could be a promising therapeutic strategy for cancers that depend on arginine for their survival [3]. Finally, we also found abundance differences in hypoxanthine. Low levels of hypoxanthine both in urine and plasma samples are often observed in cancer patients, especially in patients with advanced disease stages [45], as hyperproliferative tissues require increased DNA synthesis. Accordingly, we observed a 34% decrease of hypoxanthine abundance in the plasma of NET patients. The underlying mechanism of hypoxanthine downregulation in NET patients is unclear, but it is plausible that alterations in purine metabolism may occur during tumor progression. Consistent with this hypothesis, an inverse correlation was found in our study between hypoxanthine plasma levels and the tumor proliferative rate or Ki-67 index (r2 = −0.243, p = 0.033).
One of the strengths of our study is that it was performed in plasma samples of a large and homogeneous population, uniformly and prospectively collected and analyzed. Moreover, a set of metabolites was validated in a target analysis with a different analytical platform in the same cohort. Nevertheless, results shall be further investigated in an independent NET patient cohort and metabolomic profiling of patients with exocrine tumors of similar tissue origin (lung and gastrointestinal carcinomas) would be very helpful to validate the specific metabolomic profile of NETs and to confirm the diagnostic potential of the metabolic signature identified. Moreover, complementary -omic approaches, such as exome, transcriptome or methylome of these patients, are needed to further understand the underlying mechanisms in NET development and progression. In particular, the metabolomic profile could be combined with complementary analytical approaches in plasma such as cell-free nucleic acids profiling that might be particularly useful for early diagnostics and patient stratification for personalized clinical management. Plasma -omic profiling has the additional advantage of providing a dynamic characterization of disease biology, which could be eventually utilized, beyond accompanying diagnostics, for targeted prevention or screening, individualized treatment strategies, therapeutic monitoring and prediction of patient’s outcome.
4. Material and Methods
4.1. Study Population
The study population included patients with advanced, well-differentiated NETs of lung or gastrointestinal origin. Main clinical and pathological features of the study population are summarized in Table S1. Blood samples were obtained for metabolomic analysis from 77 NET patients and 68 non-cancer individuals as the control group. The distribution of gender, age and body mass index (BMI) was similar in the NET and non-cancer cohorts (Table S11). Peripheral blood was collected in sodium EDTA tubes according to standard procedures and fractionated at 3000 rpm for 5 min. Plasma layer was recovered in sterile cryotubes, frozen and stored until use at −80 °C. The study protocol was approved by the institutional ethics committee and all patients provided informed consent prior to study entry.
4.2. Multiplatform Metabolic Fingerprinting
A multiplatform non-targeted metabolomics approach was performed to provide a wide coverage of the metabolome under study. Samples were analyzed according to standard protocols through different separation techniques coupled to mass spectrometry: capillary electrophoresis 7100 coupled to a MS with time-of-flight analyzer, TOF-MS 6224 (Agilent Technologies, Santa Clara, CA, USA) (CE−MS), HPLC system 1290 Infinity II coupled with 6545 QTOF MS detector (Agilent Technologies, Santa Clara, CA, USA) (LC−MS) and GC system 7890A coupled to a mass spectrometer 5975C (Agilent Technologies, Santa Clara, CA, USA) (GC−MS) [46,47,48] (see File S1).
4.2.1. Data Processing
The raw data obtained by CE−MS were processed with MassHunter Profinder software version B.08.00, applying the Molecular Feature Extraction (MFE) and Find by Ion (FbI) function by Recursive Feature Extraction (RFE). For LC−MS, the raw data were reprocessed by the MFE with MassHunter Qualitative (B.06.00, Agilent Software, Santa Clara, USA) and DA Reprocessor Offline Utilities B.05.00 (Agilent) and Mass Profiler Professional software (B.14.9 Agilent Software, Santa Clara, USA) to find coeluting adducts and aligned and filtered the data. Raw data files from GC−MS analysis were converted to the appropriate format for quantitative analysis through MassHunter Workstation GC−MS Translator (B.04.01) and deconvolution was carried out through Agilent MassHunter Unknowns Analysis Tool 7.0. For more specific details, see File S1.
4.2.2. Statistical Analysis
After correction (see File S1), the data underwent a Quality Assurance procedure, data normality for every platform was assessed by Kolmogorov−Smirnov and Shapiro−Wilk tests and Levene’s test was used to test for variance ratio. To determine the statistical significance of each metabolite separately, differences between non-cancer individuals and NET cases were evaluated by applying Student’s t-test (p ≤ 0.05) using MATLAB (R2015a, MathWorks, Natick, MA, USA). Benjamini−Hochberg multiple post-correction method was applied to all p-values to control the false positive rate at level α = 0.05.
Multivariate analysis (MVA) was performed in SIMCA 15.0 (Sartorius Stedim Biotech) OPLS-DA model built was used to assess the S-plot and, for variable selection, volcano plots of variable importance in projection (VIP) score and p(corr) [49]. For more specific details, see Supplementary Material and Methods.
4.2.3. Annotation and Compound Identification
An initial annotation of features from LC−MS and CE−MS based on the m/z of the compounds showing significant differences in class separation was performed by CEU Mass Mediator tool [50] (see File S1).
To confirm the annotation of the compounds, LC−MS/MS analysis was carried out by data independent analysis (DIA) and the identification of each metabolite was achieved by manual MS/MS spectra interpretation. Some CE−MS annotations could also be confirmed through in-source fragmentation obtained at high fragmentor voltage (200 V) [51] (see File S1).
4.2.4. Targeted Analysis
Standards used and the corresponding sources are included in Table S12. Two calibration curves were prepared according to the solubility of the standards. An aqueous mixture containing arginine, 1-methyladenosine, biliverdin and bilirubin was diluted to 6 different concentration levels (ca. 1 ng/mL to 1 µg/mL) and another mixture containing 5-hydroxyindoleacetic acid, 3-hydroxydodecanedioic acid, linoleoylcarnitine, oleoylcarnitine, sphingosine-1-phosphate, 3-hydroxydodecanoic acid, HETE, ursodeoxycholic acid and ursodeoxycholic acid 3-sulfate was diluted inMeOH/EtOH (1:1). Plasma samples were prepared using the same protocol used for untargeted HPLC/MS analysis [47]. Targeted analysis was performed on an Agilent 1290 Infinity UHPLC (Agilent Technologies, Waldbronn, Germany) system coupled with an Agilent 6460 Triple Quadrupole Mass Spectrometer with an electrospray ionization (ESI) source (HPLC QqQ MS/MS). In the final method, chromatographic separation of compounds was achieved with a Zorbax C8 Eclipse Plus column (Agilent Technologies, 2.1 × 150 mm, 1.8 μm) thermostated at 55 °C. For individual analytes, MS-related parameters were tuned by the Agilent MassHunter Optimizer (software version B.07.00, Agilent Software, Santa Clara, USA) using authentic standards for reference. MassHunter Optimizer automatically optimized the data acquisition parameters for MRM (multiple-reaction monitoring) mode. System control and initial chromatogram review were performed with Agilent MassHunter Qualitative software (version B.08.00, Agilent Software, Santa Clara, USA). Data reprocessing were carried out using Agilent MassHunter QQQ Quantitative software program (version B.09.00, Agilent Software, Santa Clara, USA). Metabolites were quantified according to the response factor of the respective calibration curve.
4.3. Metabolite Classification and Pathway Analysis
The discriminant metabolites summarized in Table 1 were classified by biochemical classes and by their relationship with specific molecular pathways (apoptosis, cell cycle, angiogenesis, mTOR pathway, Warburg effect, oxidative stress, tryptophan metabolism, collagen metabolism, carnitine metabolism, methionine cycle, arachidonic acid metabolism, urea cycle, polyamines, and heme metabolism). In order to refine the identification of aberrant molecular pathways in NET patients we analysed our data by Metabolite Pathway Analysis (MPA) and Metabolite Set Enrichment Analysis (MSEA) using MetaboAnalyst 4.0 platform (http://www.metaboanalyst.ca/, accessed on 8 December 2020) [52]. The databases of reference employed were KEGG homo sapiens (Oct 2019) and SMPD [53,54].
4.4. Clinical and Molecular Data Analysis
In order to evaluate the diagnostic potential of metabolites, Receiver Operating Characteristic (ROC) curves and Area Under the Curve (AUCs) were assessed, and sensitivity and specificity values were calculated (according to Youden Index) [55]. Associations with relevant clinical features (age, gender, BMI, glycemia and creatinine plasma levels) and common concomitant medications selected by their putative influence in metabolomics (Table S13) were assessed in metabolites with AUC > 0.85, using Fisher’s exact test, chi-squared test or Pearson correlation, as appropriate (p < 0.05 were considered significant). Next, logistic regression models were built for each metabolite adjusting for age, gender, glycemia, creatinine plasma levels and significant patient medication selected from association analysis. Metabolites with AUC > 0.85 were considered as potential biomarkers. Additionally, differential metabolites from OPLS-DA models with VIP >1.0 and |p(corr)| > 0.5 were also considered as potential biomarkers.
4.5. Heatmap and Hierarchical Clustering
Heatmaps were conducted with the log10 value of each metabolite levels in plasma samples. Unsupervised hierarchical clustering was performed for metabolites and patients using Pearson correlation and average as linkage method. Both were conducted using the Morpheus Software (Broad Institute; https://software.broadinstitute.org/morpheus, accessed on 18 December 2020).
5. Conclusions
In conclusion, untargeted plasma metabolomic profiling of NET patients, that integrated metabolic data acquired by GC, CE and LC in both polarity modes coupled to MS, has identified a distinct metabolic signature of potential clinical use. Indeed, our study has identified and validated a reduced set of metabolites of high diagnostic accuracy that may improve the specific detection of NETs. Differential metabolites were related with classical cancer pathways (apoptosis, cell cycle) and NET signaling (tryptophan metabolism, angiogenesis, mTOR). In addition, MPA/MSEA analysis of these metabolites has revealed new enriched metabolic pathways in NETs, related with the TCA cycle and with arginine, pyruvate or glutathione metabolism, which have distinct implications in oncogenesis and may open innovative avenues of clinical research, including the identification of potential novel targets for therapy. This is to our knowledge the most comprehensive metabolic profiling study performed to date in NETs and provides very valuable information to develop useful biomarkers for the management of these patients in clinical practice.
Supplementary Materials
The following are available online at https://www.mdpi.com/article/10.3390/cancers13112634/s1, Figure S1: PCA-X score plots, Figure S2: PCA-X unsupervised models, Figure S3: NETs show a specific metabolomic profile, Figure S4: Pathway analysis of 48 metabolites with diagnostic potential, Figure S5: Pathway classification of differential plasma metabolites in NET patients, Table S1: Clinical, biochemical and pathological features of NET population, Table S2: Metabolites with biomarker potential in NET patients, Table S3: Drugs as potential confounding variables, Table S4: Logistic regression analysis of metabolites with biomarker potential in the plasma of NET patients, Table S5: Metabolites candidates for targeted validation, Table S6: Validation of potential diagnostic biomarkers of NETs, Table S7: Relevant metabolic pathways related to the identified differential plasma metabolites in NET patients by Metabolite Pathway Analysis (MPA), Table S8: Relevant metabolic pathways related to the identified differential plasma metabolites in NET patients by Metabolite Set Enrichment Analysis (MSEA), Table S9: Relevant metabolic pathways related to the diagnostic biomarker metabolites in NET patients by Metabolite Pathway Analysis (MPA), Table S10: Relevant metabolic pathways related to the diagnostic biomarker metabolites in NET patients by Metabolite Set Enrichment Analysis (MSEA), Table S11: Distribution of age, gender and body mass index in NET patients and non-cancer individuals, Table S12: Standards and the corresponding sources used for the targeted analysis, Table S13: Drug intake of NET and non-cancer patients, File S1: Supplementary Materials and Methods.
Author Contributions
B.S., A.L.-L., C.B. and R.G.-C. designed the study. A.L.-L. performed and C.B. and A.L.-G. oversaw the laboratory analysis. B.S., A.L.-L., A.L.-P., C.C.-P. and A.L.-G. ana-lyzed the data. A.L.S., B.G.-C., M.C.R.-M., P.E.-O., J.S., B.R.-C. and R.R., contributed to interpret-ing and discussing the results and to writing the manuscript. All authors have read and agreed to the published version of the manuscript.
Funding
This work was partially funded by Pfizer, Project G1808 from the Spanish National Taskforce on Neuroendocrine Tumors (GETNE), Ministry of Science, Innovation and Universities of Spain (MICINN) and FEDER funding (Ref. RTI2018-095166-B-I00) and Autonomous Community of Madrid (NOVELREN-CM. Ref: B2017/BMD3751). B.S. is funded by AECC (POSTDO46SOLD, Spain). A.L.-L. thanks CEU-International Doctoral School (CEINDO) for her fellowship. A.L.-P. is funded by CAM (PEJD-2019-PRE/BMD-17058, Progama de Empleo Juvenil (YEI), co-funded by European Union (ERDF/ESF, “Investing in your future”). C.C.-P. was partially funded by CAM (PEJD-2016-PRE/BMD-2666). B.R.-C. was partially funded by CAM (PEJD-2017-PRE/BMD-4981). ALS is funded by Instituto de Salud Carlos III (Contrato Rio Hortega). M.R.-M. is funded by AECC (CLSEN19003RIES).
Institutional Review Board Statement
The study was conducted according to the guidelines of the Declaration of Helsinki, and the study protocol was approved by the Ethics Committee of Hospital Universitario 12 de Octubre (Madrid, Spain) (protocol code 19/159, date of approval 25 June 2019).
Informed Consent Statement
Written informed consent was provided by patients prior to study participation.
Data Availability Statement
The data presented in this study are available from the corresponding author upon reasonable request.
Acknowledgments
We would like to thank all patients for the plasma samples provided for this study.
Conflicts of Interest
The authors declare no conflict of interest.
References
- Cairns, R.A.; Harris, I.S.; Mak, T.W. Regulation of Cancer Cell Metabolism. Nat. Rev. Cancer 2011, 11, 85–95. [Google Scholar] [CrossRef] [PubMed]
- Suhre, K.; Shin, S.-Y.; Petersen, A.-K.; Mohney, R.P.; Meredith, D.; Wägele, B.; Altmaier, E.; CARDIoGRAM; Deloukas, P.; Erdmann, J.; et al. Human Metabolic Individuality in Biomedical and Pharmaceutical Research. Nature 2011, 477, 54–60. [Google Scholar] [CrossRef] [PubMed]
- Sullivan, L.B.; Gui, D.Y.; Vander Heiden, M.G. Altered Metabolite Levels in Cancer: Implications for Tumour Biology and Cancer Therapy. Nat. Rev. Cancer 2016, 16, 680–693. [Google Scholar] [CrossRef] [PubMed]
- Newgard, C.B. Metabolomics and Metabolic Diseases: Where Do We Stand? Cell Metab. 2017, 25, 43–56. [Google Scholar] [CrossRef]
- Oakman, C.; Tenori, L.; Claudino, W.M.; Cappadona, S.; Nepi, S.; Battaglia, A.; Bernini, P.; Zafarana, E.; Saccenti, E.; Fornier, M.; et al. Identification of a Serum-Detectable Metabolomic Fingerprint Potentially Correlated with the Presence of Micrometastatic Disease in Early Breast Cancer Patients at Varying Risks of Disease Relapse by Traditional Prognostic Methods. Ann. Oncol. Off. J. Eur. Soc. Med. Oncol. 2011, 22, 1295–1301. [Google Scholar] [CrossRef]
- Martín-Blázquez, A.; Díaz, C.; González-Flores, E.; Franco-Rivas, D.; Jiménez-Luna, C.; Melguizo, C.; Prados, J.; Genilloud, O.; Vicente, F.; Caba, O.; et al. Untargeted LC-HRMS-Based Metabolomics to Identify Novel Biomarkers of Metastatic Colorectal Cancer. Sci. Rep. 2019, 9, 20198. [Google Scholar] [CrossRef]
- Bertini, I.; Cacciatore, S.; Jensen, B.V.; Schou, J.V.; Johansen, J.S.; Kruhøffer, M.; Luchinat, C.; Nielsen, D.L.; Turano, P. Metabolomic NMR Fingerprinting to Identify and Predict Survival of Patients with Metastatic Colorectal Cancer. Cancer Res. 2012, 72, 356–364. [Google Scholar] [CrossRef]
- Deja, S.; Porebska, I.; Kowal, A.; Zabek, A.; Barg, W.; Pawelczyk, K.; Stanimirova, I.; Daszykowski, M.; Korzeniewska, A.; Jankowska, R.; et al. Metabolomics Provide New Insights on Lung Cancer Staging and Discrimination from Chronic Obstructive Pulmonary Disease. J. Pharm. Biomed. Anal. 2014, 100, 369–380. [Google Scholar] [CrossRef]
- González-Flores, E.; Serrano, R.; Sevilla, I.; Viúdez, A.; Barriuso, J.; Benavent, M.; Capdevila, J.; Jimenez-Fonseca, P.; López, C.; Garcia-Carbonero, R. SEOM Clinical Guidelines for the Diagnosis and Treatment of Gastroenteropancreatic and Bronchial Neuroendocrine Neoplasms (NENs) (2018). Clin. Transl. Oncol. 2019, 21, 55–63. [Google Scholar] [CrossRef]
- Hofland, J.; Kaltsas, G.; de Herder, W.W. Advances in the Diagnosis and Management of Well-Differentiated Neuroendocrine Neoplasms. Endocr. Rev. 2020, 41, 371–403. [Google Scholar] [CrossRef]
- Dasari, A.; Shen, C.; Halperin, D.; Zhao, B.; Zhou, S.; Xu, Y.; Shih, T.; Yao, J.C. Trends in the Incidence, Prevalence, and Survival Outcomes in Patients With Neuroendocrine Tumors in the United States. JAMA Oncol. 2017, 3, 1335–1342. [Google Scholar] [CrossRef]
- Nuñez-Valdovinos, B.; Carmona-Bayonas, A.; Jimenez-Fonseca, P.; Capdevila, J.; Castaño-Pascual, Á.; Benavent, M.; Barrio, J.J.P.; Teule, A.; Alonso, V.; Custodio, A.; et al. Neuroendocrine Tumor Heterogeneity Adds Uncertainty to the World Health Organization 2010 Classification: Real-World Data from the Spanish Tumor Registry (R-GETNE). Oncologist 2018, 23, 422–432. [Google Scholar] [CrossRef]
- Stevenson, M.; Lines, K.E.; Thakker, R.V. Molecular Genetic Studies of Pancreatic Neuroendocrine Tumors: New Therapeutic Approaches. Endocrinol. Metab. Clin. N. Am. 2018, 47, 525–548. [Google Scholar] [CrossRef]
- Brandi, M.L.; Gagel, R.F.; Angeli, A.; Bilezikian, J.P.; Beck-Peccoz, P.; Bordi, C.; Conte-Devolx, B.; Falchetti, A.; Gheri, R.G.; Libroia, A.; et al. Guidelines for Diagnosis and Therapy of MEN Type 1 and Type 2. J. Clin. Endocrinol. Metab. 2001, 86, 5658–5671. [Google Scholar] [CrossRef]
- Thakker, R.V. Multiple Endocrine Neoplasia Type 1 (MEN1) and Type 4 (MEN4). Mol. Cell. Endocrinol. 2014, 386, 2–15. [Google Scholar] [CrossRef]
- Rednam, S.P.; Erez, A.; Druker, H.; Janeway, K.A.; Kamihara, J.; Kohlmann, W.K.; Nathanson, K.L.; States, L.J.; Tomlinson, G.E.; Villani, A.; et al. Von Hippel-Lindau and Hereditary Pheochromocytoma/Paraganglioma Syndromes: Clinical Features, Genetics, and Surveillance Recommendations in Childhood. Clin. Cancer Res. Off. J. Am. Assoc. Cancer Res. 2017, 23, e68–e75. [Google Scholar] [CrossRef]
- Jett, K.; Friedman, J.M. Clinical and Genetic Aspects of Neurofibromatosis 1. Genet. Med. Off. J. Am. Coll. Med. Genet. 2010, 12, 1–11. [Google Scholar] [CrossRef]
- Larson, A.M.; Hedgire, S.S.; Deshpande, V.; Stemmer-Rachamimov, A.O.; Harisinghani, M.G.; Ferrone, C.R.; Shah, U.; Thiele, E.A. Pancreatic Neuroendocrine Tumors in Patients with Tuberous Sclerosis Complex. Clin. Genet. 2012, 82, 558–563. [Google Scholar] [CrossRef]
- Scarpa, A.; Chang, D.K.; Nones, K.; Corbo, V.; Patch, A.-M.; Bailey, P.; Lawlor, R.T.; Johns, A.L.; Miller, D.K.; Mafficini, A.; et al. Whole-Genome Landscape of Pancreatic Neuroendocrine Tumours. Nature 2017, 543, 65–71. [Google Scholar] [CrossRef]
- Jiao, Y.; Shi, C.; Edil, B.H.; de Wilde, R.F.; Klimstra, D.S.; Maitra, A.; Schulick, R.D.; Tang, L.H.; Wolfgang, C.L.; Choti, M.A.; et al. DAXX/ATRX, MEN1, and MTOR Pathway Genes Are Frequently Altered in Pancreatic Neuroendocrine Tumors. Science 2011, 331, 1199–1203. [Google Scholar] [CrossRef]
- Karpathakis, A.; Dibra, H.; Pipinikas, C.; Feber, A.; Morris, T.; Francis, J.; Oukrif, D.; Mandair, D.; Pericleous, M.; Mohmaduvesh, M.; et al. Prognostic Impact of Novel Molecular Subtypes of Small Intestinal Neuroendocrine Tumor. Clin. Cancer Res. 2016, 22, 250–258. [Google Scholar] [CrossRef]
- Kinross, J.M.; Drymousis, P.; Jiménez, B.; Frilling, A. Metabonomic Profiling: A Novel Approach in Neuroendocrine Neoplasias. Surgery 2013, 154, 1185–1192; discussion 1192–1193. [Google Scholar] [CrossRef]
- Imperiale, A.; Poncet, G.; Addeo, P.; Ruhland, E.; Roche, C.; Battini, S.; Cicek, A.E.; Chenard, M.P.; Hervieu, V.; Goichot, B.; et al. Metabolomics of Small Intestine Neuroendocrine Tumors and Related Hepatic Metastases. Metabolites 2019, 9, 300. [Google Scholar] [CrossRef]
- Fahy, E.; Subramaniam, S.; Murphy, R.C.; Nishijima, M.; Raetz, C.R.H.; Shimizu, T.; Spener, F.; van Meer, G.; Wakelam, M.J.O.; Dennis, E.A. Update of the LIPID MAPS Comprehensive Classification System for Lipids. J. Lipid Res. 2009, 50, S9–S14. [Google Scholar] [CrossRef]
- López-López, Á.; Godzien, J.; Soldevilla, B.; Gradillas, A.; López-Gonzálvez, Á.; Lens-Pardo, A.; La Salvia, A.; Del Carmen Riesco-Martínez, M.; García-Carbonero, R.; Barbas, C. Oxidized Lipids in the Metabolic Profiling of Neuroendocrine Tumors - Analytical Challenges and Biological Implications. J. Chromatogr. A 2020, 1625, 461233. [Google Scholar] [CrossRef]
- Sansone, A.; Lauretta, R.; Vottari, S.; Chiefari, A.; Barnabei, A.; Romanelli, F.; Appetecchia, M. Specific and Non-Specific Biomarkers in Neuroendocrine Gastroenteropancreatic Tumors. Cancers 2019, 11, 1113. [Google Scholar] [CrossRef]
- Costello, L.C.; Franklin, R.B. The Intermediary Metabolism of the Prostate: A Key to Understanding the Pathogenesis and Progression of Prostate Malignancy. Oncology 2000, 59, 269–282. [Google Scholar] [CrossRef]
- Anderson, N.M.; Mucka, P.; Kern, J.G.; Feng, H. The Emerging Role and Targetability of the TCA Cycle in Cancer Metabolism. Protein Cell 2018, 9, 216–237. [Google Scholar] [CrossRef]
- Jiang, L.; Boufersaoui, A.; Yang, C.; Ko, B.; Rakheja, D.; Guevara, G.; Hu, Z.; DeBerardinis, R.J. Quantitative Metabolic Flux Analysis Reveals an Unconventional Pathway of Fatty Acid Synthesis in Cancer Cells Deficient for the Mitochondrial Citrate Transport Protein. Metab. Eng. 2017, 43, 198–207. [Google Scholar] [CrossRef]
- Reuter, S.E.; Evans, A.M. Carnitine and Acylcarnitines. Clin. Pharmacokinet. 2012, 51, 553–572. [Google Scholar] [CrossRef]
- Gao, B.; Lue, H.-W.; Podolak, J.; Fan, S.; Zhang, Y.; Serawat, A.; Alumkal, J.J.; Fiehn, O.; Thomas, G.V. Multi-Omics Analyses Detail Metabolic Reprogramming in Lipids, Carnitines, and Use of Glycolytic Intermediates between Prostate Small Cell Neuroendocrine Carcinoma and Prostate Adenocarcinoma. Metabolites 2019, 9, 82. [Google Scholar] [CrossRef] [PubMed]
- Powell, W.S.; Rokach, J. Biosynthesis, Biological Effects, and Receptors of Hydroxyeicosatetraenoic Acids (HETEs) and Oxoeicosatetraenoic Acids (Oxo-ETEs) Derived from Arachidonic Acid. Biochim. Biophys. Acta 2015, 1851, 340–355. [Google Scholar] [CrossRef] [PubMed]
- Huang, B.; Song, B.-L.; Xu, C. Cholesterol Metabolism in Cancer: Mechanisms and Therapeutic Opportunities. Nat. Metab. 2020, 2, 132–141. [Google Scholar] [CrossRef] [PubMed]
- La Rosa, S.; Uccella, S.; Finzi, G.; Albarello, L.; Sessa, F.; Capella, C. Localization of Vascular Endothelial Growth Factor and Its Receptors in Digestive Endocrine Tumors: Correlation with Microvessel Density and Clinicopathologic Features. Hum. Pathol. 2003, 34, 18–27. [Google Scholar] [CrossRef]
- Keshet, R.; Erez, A. Arginine and the Metabolic Regulation of Nitric Oxide Synthesis in Cancer. Dis. Model. Mech. 2018, 11. [Google Scholar] [CrossRef]
- Xu, Y. Targeting Lysophosphatidic Acid in Cancer: The Issues in Moving from Bench to Bedside. Cancers 2019, 11, 1523. [Google Scholar] [CrossRef]
- Panagiotopoulos, A.A.; Kalyvianaki, K.; Castanas, E.; Kampa, M. Eicosanoids in Prostate Cancer. Cancer Metastasis Rev. 2018, 37, 237–243. [Google Scholar] [CrossRef]
- Chau, L.-Y. Heme Oxygenase-1: Emerging Target of Cancer Therapy. J. Biomed. Sci. 2015, 22, 22. [Google Scholar] [CrossRef]
- Lamberti, G.; Brighi, N.; Maggio, I.; Manuzzi, L.; Peterle, C.; Ambrosini, V.; Ricci, C.; Casadei, R.; Campana, D. The Role of MTOR in Neuroendocrine Tumors: Future Cornerstone of a Winning Strategy? Int. J. Mol. Sci. 2018, 19, 747. [Google Scholar] [CrossRef]
- Yao, J.C.; Shah, M.H.; Ito, T.; Bohas, C.L.; Wolin, E.M.; Van Cutsem, E.; Hobday, T.J.; Okusaka, T.; Capdevila, J.; de Vries, E.G.E.; et al. Everolimus for Advanced Pancreatic Neuroendocrine Tumors. N. Engl. J. Med. 2011, 364, 514–523. [Google Scholar] [CrossRef]
- Yao, J.C.; Fazio, N.; Singh, S.; Buzzoni, R.; Carnaghi, C.; Wolin, E.; Tomasek, J.; Raderer, M.; Lahner, H.; Voi, M.; et al. Everolimus for the Treatment of Advanced, Non-Functional Neuroendocrine Tumours of the Lung or Gastrointestinal Tract (RADIANT-4): A Randomised, Placebo-Controlled, Phase 3 Study. Lancet Lond. Engl. 2016, 387, 968–977. [Google Scholar] [CrossRef]
- Zabala-Letona, A.; Arruabarrena-Aristorena, A.; Martín-Martín, N.; Fernandez-Ruiz, S.; Sutherland, J.D.; Clasquin, M.; Tomas-Cortazar, J.; Jimenez, J.; Torres, I.; Quang, P.; et al. MTORC1-Dependent AMD1 Regulation Sustains Polyamine Metabolism in Prostate Cancer. Nature 2017, 547, 109–113. [Google Scholar] [CrossRef]
- Gerner, E.W.; Meyskens, F.L. Polyamines and Cancer: Old Molecules, New Understanding. Nat. Rev. Cancer 2004, 4, 781–792. [Google Scholar] [CrossRef]
- Chalishazar, M.D.; Wait, S.J.; Huang, F.; Ireland, A.S.; Mukhopadhyay, A.; Lee, Y.; Schuman, S.S.; Guthrie, M.R.; Berrett, K.C.; Vahrenkamp, J.M.; et al. MYC-Driven Small-Cell Lung Cancer Is Metabolically Distinct and Vulnerable to Arginine Depletion. Clin. Cancer Res. Off. J. Am. Assoc. Cancer Res. 2019, 25, 5107–5121. [Google Scholar] [CrossRef]
- Kim, K.; Yeo, S.-G.; Yoo, B.C. Identification of Hypoxanthine and Phosphoenolpyruvic Acid as Serum Markers of Chemoradiotherapy Response in Locally Advanced Rectal Cancer. Cancer Res. Treat. Off. J. Korean Cancer Assoc. 2015, 47, 78–89. [Google Scholar] [CrossRef]
- Naz, S.; Garcia, A.; Rusak, M.; Barbas, C. Method Development and Validation for Rat Serum Fingerprinting with CE-MS: Application to Ventilator-Induced-Lung-Injury Study. Anal. Bioanal. Chem. 2013, 405, 4849–4858. [Google Scholar] [CrossRef]
- Godzien, J.; Kalaska, B.; Adamska-Patruno, E.; Siroka, J.; Ciborowski, M.; Kretowski, A.; Barbas, C. Oxidized Glycerophosphatidylcholines in Diabetes through Non-Targeted Metabolomics: Their Annotation and Biological Meaning. J. Chromatogr. B Analyt. Technol. Biomed. Life. Sci. 2019, 1120, 62–70. [Google Scholar] [CrossRef]
- Dudzik, D.; Zorawski, M.; Skotnicki, M.; Zarzycki, W.; Kozlowska, G.; Bibik-Malinowska, K.; Vallejo, M.; García, A.; Barbas, C.; Ramos, M.P. Metabolic Fingerprint of Gestational Diabetes Mellitus. J. Proteomics 2014, 103, 57–71. [Google Scholar] [CrossRef]
- Wheelock, Å.M.; Wheelock, C.E. Trials and Tribulations of ’omics Data Analysis: Assessing Quality of SIMCA-Based Multivariate Models Using Examples from Pulmonary Medicine. Mol. Biosyst. 2013, 9, 2589–2596. [Google Scholar] [CrossRef]
- Gil de la Fuente, A.; Godzien, J.; Fernández López, M.; Rupérez, F.J.; Barbas, C.; Otero, A. Knowledge-Based Metabolite Annotation Tool: CEU Mass Mediator. J. Pharm. Biomed. Anal. 2018, 154, 138–149. [Google Scholar] [CrossRef]
- Mamani-Huanca, M.; Gradillas, A.; Gil de la Fuente, A.; López-Gonzálvez, Á.; Barbas, C. Unveiling the Fragmentation Mechanisms of Modified Amino Acids as the Key for Their Targeted Identification. Anal. Chem. 2020, 92, 4848–4857. [Google Scholar] [CrossRef] [PubMed]
- Chong, J.; Wishart, D.S.; Xia, J. Using MetaboAnalyst 4.0 for Comprehensive and Integrative Metabolomics Data Analysis. Curr. Protoc. Bioinforma. 2019, 68, e86. [Google Scholar] [CrossRef] [PubMed]
- Kanehisa, M.; Goto, S.; Sato, Y.; Kawashima, M.; Furumichi, M.; Tanabe, M. Data, Information, Knowledge and Principle: Back to Metabolism in KEGG. Nucleic Acids Res. 2014, 42, D199–D205. [Google Scholar] [CrossRef] [PubMed]
- Jewison, T.; Su, Y.; Disfany, F.M.; Liang, Y.; Knox, C.; Maciejewski, A.; Poelzer, J.; Huynh, J.; Zhou, Y.; Arndt, D.; et al. SMPDB 2.0: Big Improvements to the Small Molecule Pathway Database. Nucleic Acids Res. 2014, 42, D478–D484. [Google Scholar] [CrossRef]
- Habibzadeh, F.; Habibzadeh, F.; Habibzadeh, P.; Yadollahie, M. On Determining the Most Appropriate Test Cut-off Value: The Case of Tests with Continuous Results. Biochem. Med. 2016, 26, 297–307. [Google Scholar] [CrossRef]


Publisher’s Note: MDPI stays neutral with regard to jurisdictional claims in published maps and institutional affiliations. |
© 2021 by the authors. Licensee MDPI, Basel, Switzerland. This article is an open access article distributed under the terms and conditions of the Creative Commons Attribution (CC BY) license (https://creativecommons.org/licenses/by/4.0/).