
Global Chromatin Changes Resulting from Single-Gene Inactivation—The Role of SMARCB1 in Malignant Rhabdoid Tumor

 , and
, and 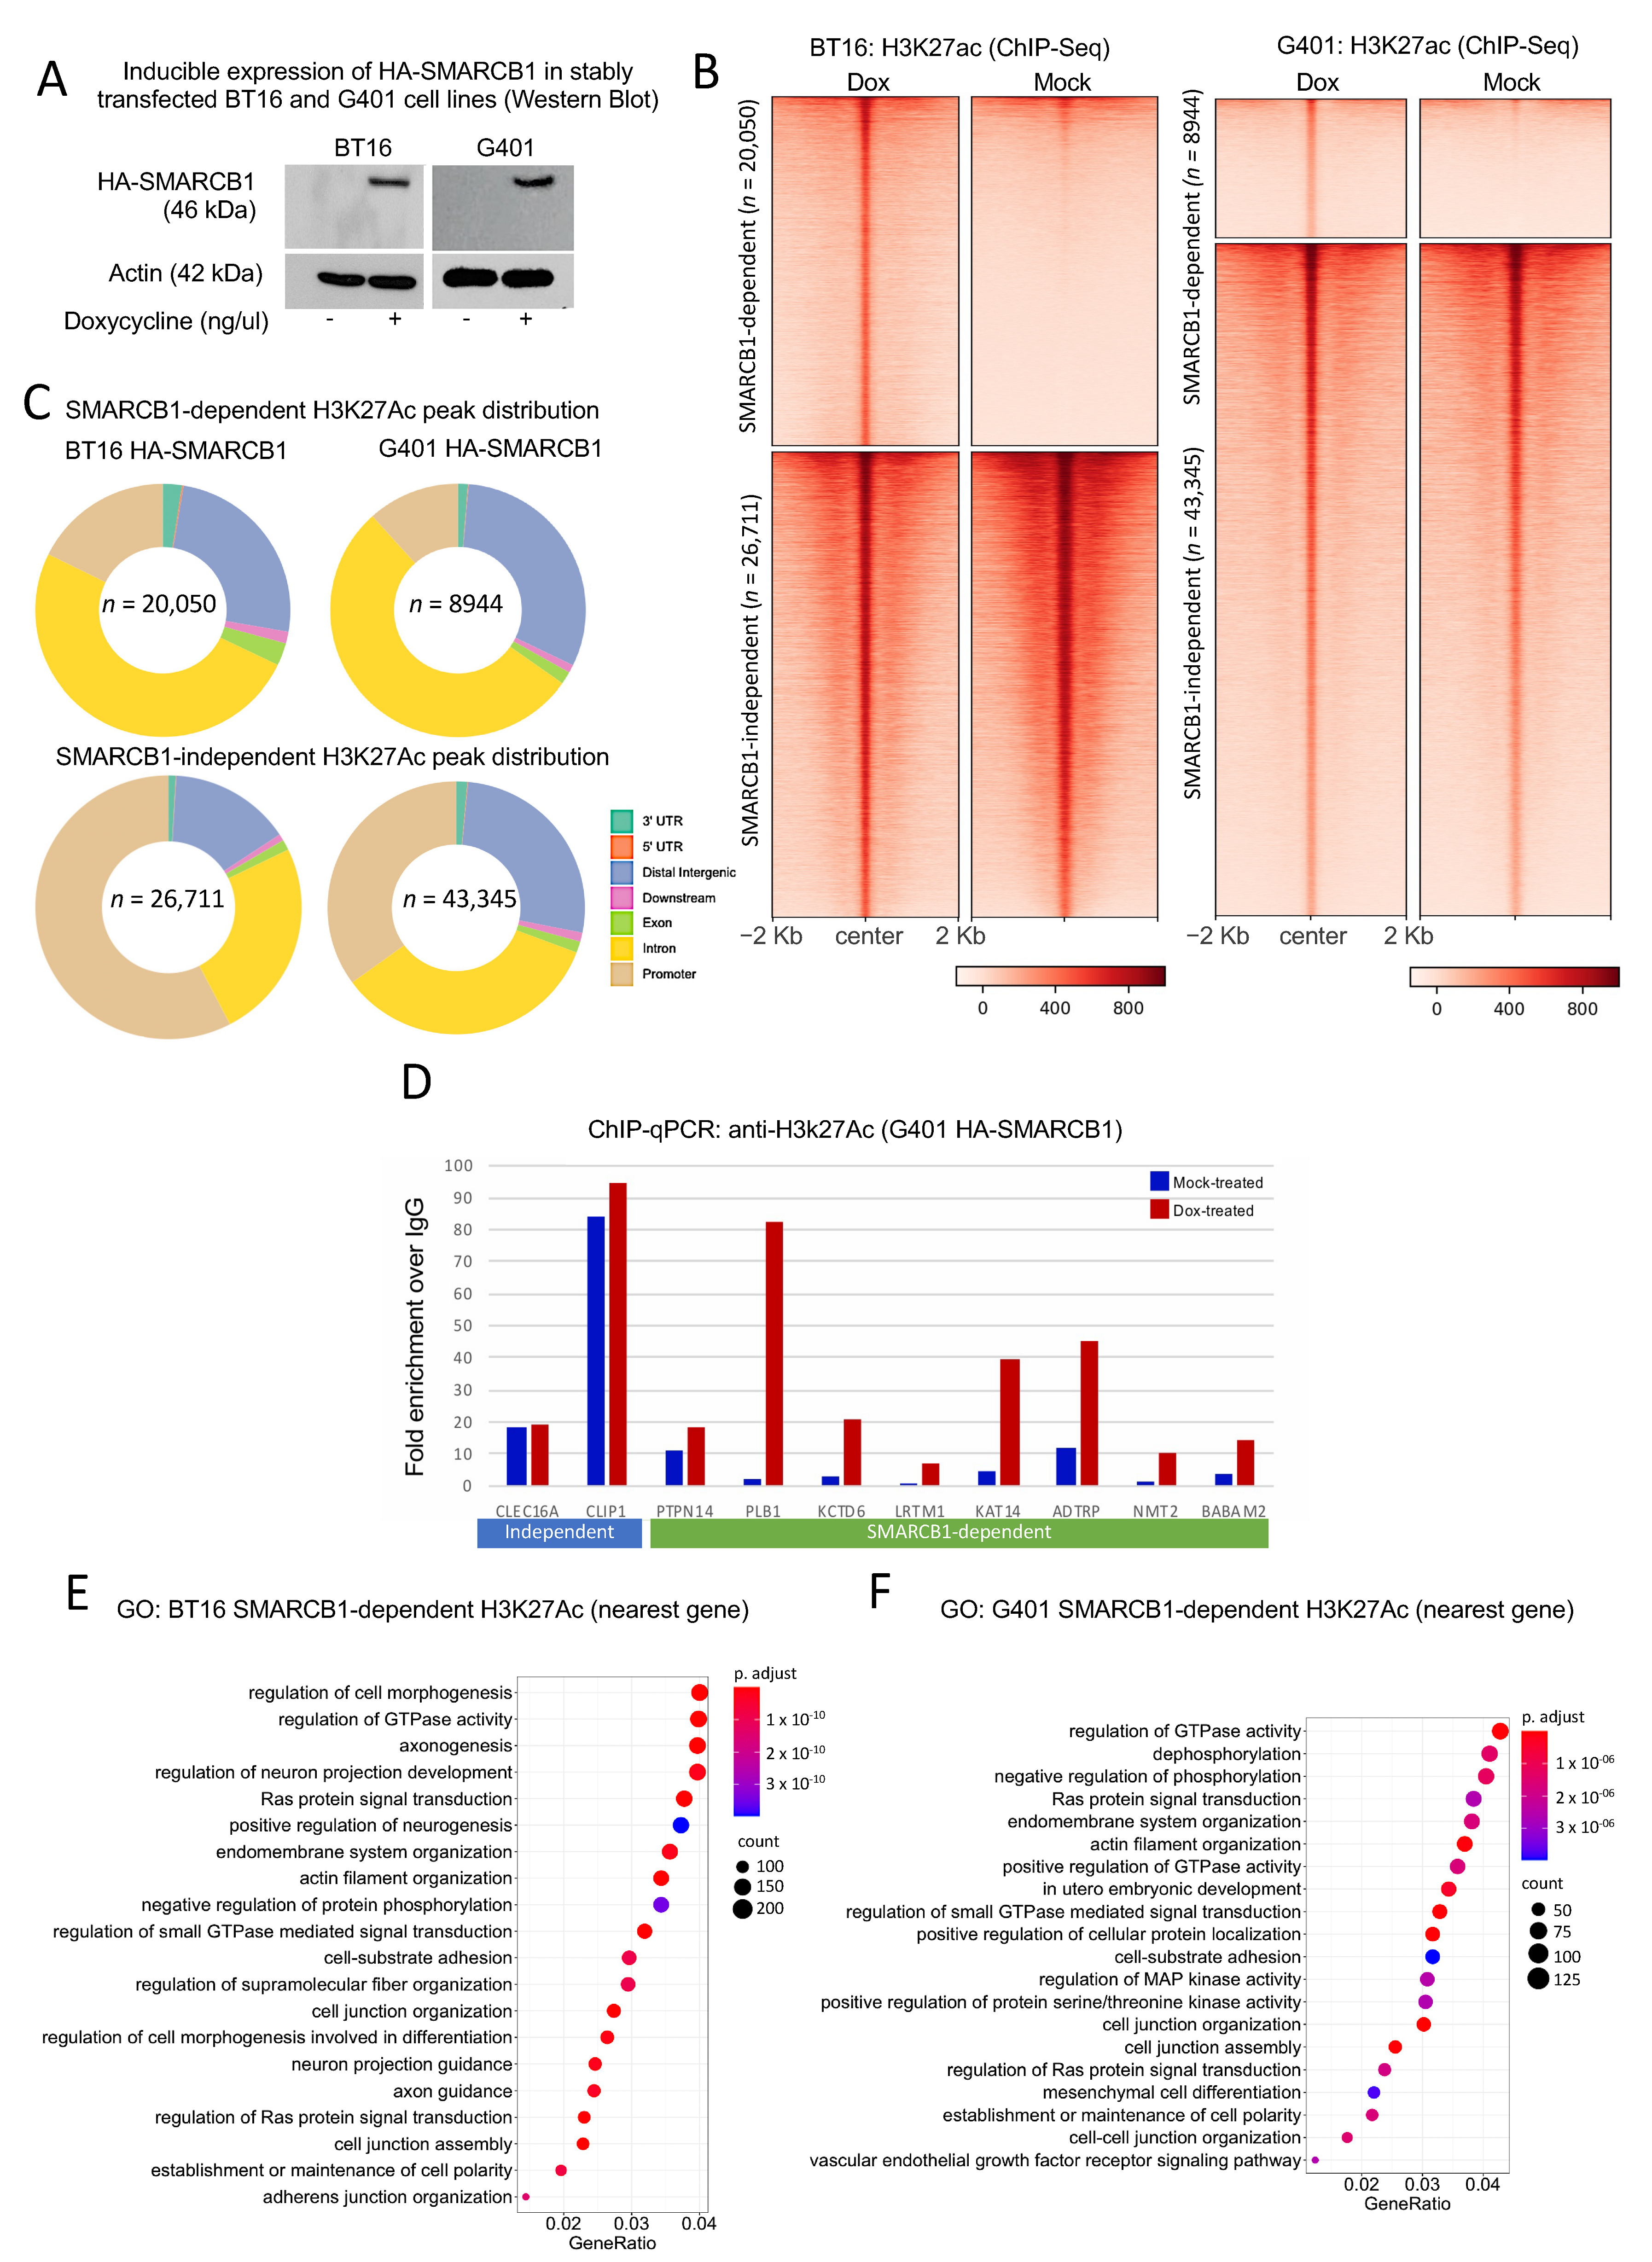
Simple Summary
Abstract
1. Introduction
2. Results
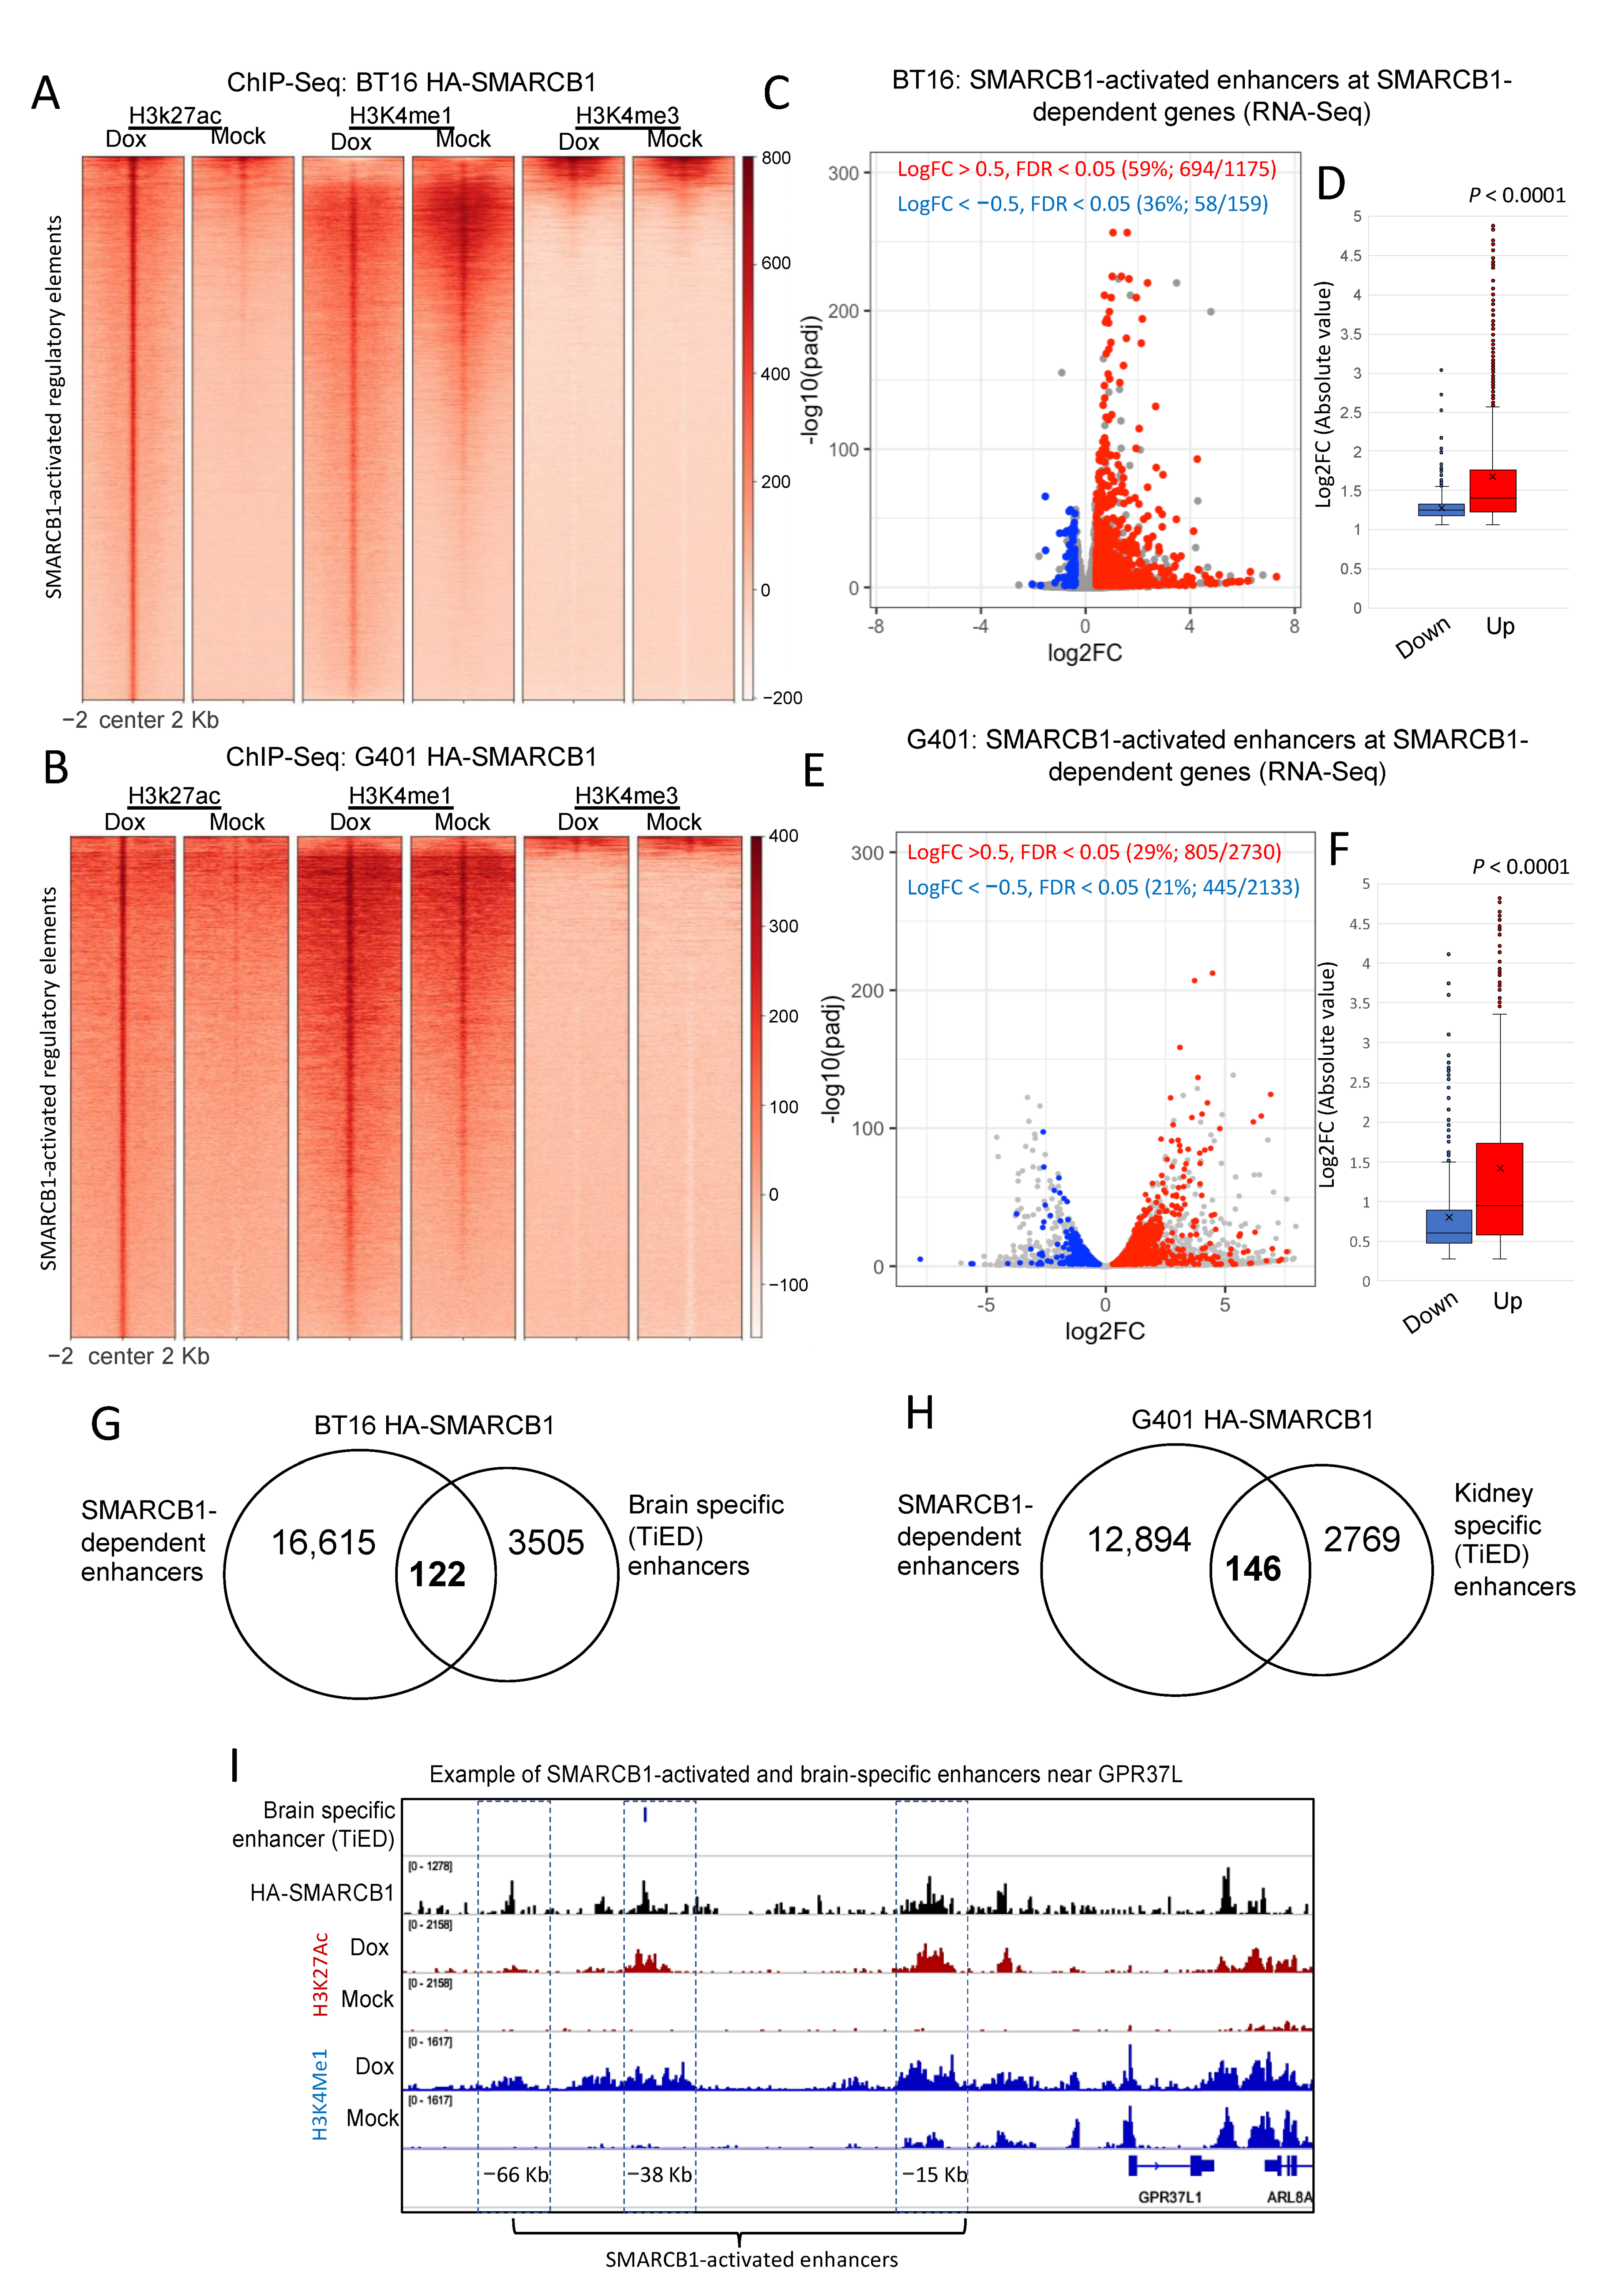
2.1. Restoration of SMARCB1 Leads to Widespread Chromatin Activation in MRT Cell Lines Particularly at Distal Regulatory Elements
2.2. SMARCB1-Dependent H3K27ac Peaks Overlap a Subset of Tissue-Specific Enhancers
2.3. Re-Expression of SMARCB1 Leads to Increased SWI/SNF Complex Occupancy at Distal Enhancers
2.4. BRD9 and BRG1 Contribute to Cell Survival in BT16 and G401 Cell Lines
2.5. DNA Methylation May Contribute Additional/Alternative Means of Repressing Developmental Gene Expression in MRTK Tumors
3. Discussion
4. Materials and Methods
4.1. Cell Line Generation
4.2. Tissue Homogenization
4.3. One- and Two-Step Crosslinking Reaction
4.4. Chromatin Immunoprecipitation (ChIP) and Sequencing
4.5. Phenol/Chloroform-Extraction and Ethanol Precipitated
4.6. Library Preparation and Sequencing
4.7. ChIP-Seq Data Analysis
Identification of Kidney-Specific Enhancers
4.8. DNA Methylation Analysis
4.9. RNA-Seq Data Analysis
5. Conclusions
Supplementary Materials
Author Contributions
Funding
Institutional Review Board Statement
Informed Consent Statement
Data Availability Statement
Conflicts of Interest
References
- Hanahan, D.; Weinberg, R.A. The Hallmarks of Cancer. Cell 2000, 100, 57–70. [Google Scholar] [CrossRef]
- Hanahan, D.; Weinberg, R.A. Hallmarks of Cancer: The Next Generation. Cell 2011, 144, 646–674. [Google Scholar] [CrossRef] [PubMed]
- Versteege, I.; Sévenet, N.; Lange, J.; Rousseau-Merck, M.-F.; Ambros, P.; Handgretinger, R.; Aurias, A.; Delattre, O. Truncating mutations of hSNF5/INI1 in aggressive paediatric cancer. Nat. Cell Biol. 1998, 394, 203–206. [Google Scholar] [CrossRef]
- Biegel, J.A.; Zhou, J.Y.; Rorke, L.B.; Stenstrom, C.; Wainwright, L.M.; Fogelgren, B. Germ-line and acquired mutations of INI1 in atyp-ical teratoid and rhabdoid tumors. Cancer Res. 1999, 59, 74–79. [Google Scholar]
- Hasselblatt, M.; Gesk, S.; Oyen, F.; Rossi, S.; Viscardi, E.; Giangaspero, F.; Giannini, C.; Judkins, A.R.; Frühwald, M.C.; Obser, T.; et al. Nonsense Mutation and Inactivation of SMARCA4 (BRG1) in an Atypical Teratoid/Rhabdoid Tumor Showing Retained SMARCB1 (INI1) Expression. Am. J. Surg. Pathol. 2011, 35, 933–935. [Google Scholar] [CrossRef]
- Lee, R.S.; Stewart, C.; Carter, S.L.; Ambrogio, L.; Cibulskis, K.; Sougnez, C.; Lawrence, M.S.; Auclair, D.; Mora, J.; Golub, T.R.; et al. A remarkably simple genome underlies highly malignant pediatric rhabdoid cancers. J. Clin. Investig. 2012, 122, 2983–2988. [Google Scholar] [CrossRef]
- Sévenet, N.; Sheridan, E.; Amram, D.; Schneider, P.; Handgretinger, R.; Delattre, O. Constitutional Mutations of the hSNF5/INI1 Gene Predispose to a Variety of Cancers. Am. J. Hum. Genet. 1999, 65, 1342–1348. [Google Scholar] [CrossRef] [PubMed]
- Schneppenheim, R.; Frühwald, M.C.; Gesk, S.; Hasselblatt, M.; Jeibmann, A.; Kordes, U.; Kreuz, M.; Leuschner, I.; Subero, J.I.M.; Obser, T.; et al. Germline Nonsense Mutation and Somatic Inactivation of SMARCA4/BRG1 in a Family with Rhabdoid Tumor Predisposition Syndrome. Am. J. Hum. Genet. 2010, 86, 279–284. [Google Scholar] [CrossRef]
- Mohrmann, L.; Verrijzer, C.P. Composition and functional specificity of SWI2/SNF2 class chromatin remodeling complexes. Biochim. Biophys. Acta Gene Struct. Expr. 2005, 1681, 59–73. [Google Scholar] [CrossRef] [PubMed]
- Ho, L.; Ronan, J.L.; Wu, J.; Staahl, B.T.; Chen, L.; Kuo, A.; Lessard, J.; Nesvizhskii, A.I.; Ranish, J.; Crabtree, G.R. An embryonic stem cell chromatin remodeling complex, esBAF, is essential for embryonic stem cell self-renewal and pluripotency. Proc. Natl. Acad. Sci. USA 2009, 106, 5181–5186. [Google Scholar] [CrossRef] [PubMed]
- Tang, L.; Nogales, E.; Ciferri, C. Structure and function of SWI/SNF chromatin remodeling complexes and mechanistic implications for transcription. Prog. Biophys. Mol. Biol. 2010, 102, 122–128. [Google Scholar] [CrossRef]
- Bannister, A.J.; Kouzarides, T. The CBP co-activator is a histone acetyltransferase. Nat. Cell Biol. 1996, 384, 641–643. [Google Scholar] [CrossRef] [PubMed]
- Dawson, M.A.; Kouzarides, T. Cancer Epigenetics: From Mechanism to Therapy. Cell 2012, 150, 12–27. [Google Scholar] [CrossRef] [PubMed]
- Gelato, K.A.; Fischle, W. Role of histone modifications in defining chromatin structure and function. Biol. Chem. 2008, 389, 353–363. [Google Scholar] [CrossRef] [PubMed]
- Janzen, W.P.; Wigle, T.J.; Jin, J.; Frye, S.V. Epigenetics: Tools and technologies. Drug Discov. Today Technol. 2010, 7, e59–e65. [Google Scholar] [CrossRef] [PubMed]
- Dawson, M.A.; Kouzarides, T.; Huntly, B.J. Targeting Epigenetic Readers in Cancer. N. Engl. J. Med. 2012, 367, 647–657. [Google Scholar] [CrossRef]
- Baker, L.A.; Allis, C.D.; Wang, G.G. PHD fingers in human diseases: Disorders arising from misinterpreting epigenetic marks. Mutat. Res. Mol. Mech. Mutagen. 2008, 647, 3–12. [Google Scholar] [CrossRef] [PubMed]
- Mohrmann, L.; Langenberg, K.; Krijgsveld, J.; Kal, A.J.; Heck, A.J.R.; Verrijzer, C.P. Differential Targeting of Two Distinct SWI/SNF-Related Drosophila Chromatin-Remodeling Complexes. Mol. Cell. Biol. 2004, 24, 3077–3088. [Google Scholar] [CrossRef] [PubMed]
- Alver, B.H.; Kim, K.H.; Lu, P.; Wang, X.; Manchester, H.E.; Wang, W.; Haswell, J.R.; Park, P.J.; Roberts, C.W.M. The SWI/SNF chromatin remodelling complex is required for maintenance of lineage specific enhancers. Nat. Commun. 2017, 8, 14648. [Google Scholar] [CrossRef]
- Mikkelsen, T.S.; Ku, M.; Jaffe, D.B.; Issac, B.; Lieberman, E.; Giannoukos, G.; Alvarez, P.; Brockman, W.; Kim, T.-K.; Koche, R.P.; et al. Genome-wide maps of chromatin state in pluripotent and lineage-committed cells. Nature 2007, 448, 553–560. [Google Scholar] [CrossRef] [PubMed]
- Wilson, B.G.; Roberts, C.W.M. SWI/SNF nucleosome remodellers and cancer. Nat. Rev. Cancer 2011, 11, 481–492. [Google Scholar] [CrossRef]
- Johann, P.D.; Erkek, S.; Zapatka, M.; Kerl, K.; Buchhalter, I.; Hovestadt, V.; Jones, D.T.; Sturm, D.; Hermann, C.; Wang, M.S.; et al. Atypical Teratoid/Rhabdoid Tumors Are Comprised of Three Epigenetic Subgroups with Distinct Enhancer Landscapes. Cancer Cell 2016, 29, 379–393. [Google Scholar] [CrossRef] [PubMed]
- Nakayama, R.T.; Pulice, J.L.; Valencia, A.M.; McBride, M.J.; McKenzie, Z.M.; Gillespie, M.A.; Ku, W.L.; Teng, M.; Cui, K.; Williams, R.T.; et al. SMARCB1 is required for widespread BAF complex–mediated activation of enhancers and bivalent promoters. Nat. Genet. 2017, 49, 1613–1623. [Google Scholar] [CrossRef] [PubMed]
- Wang, X.; Lee, R.S.; Alver, B.H.; Haswell, J.R.; Wang, S.; Mieczkowski, J.; Drier, Y.; Gillespie, S.M.; Archer, T.C.; Wu, J.N.; et al. SMARCB1-mediated SWI/SNF complex function is essential for enhancer regulation. Nat. Genet. 2017, 49, 289–295. [Google Scholar] [CrossRef] [PubMed]
- Whyte, W.A.; Orlando, D.A.; Hnisz, D.; Abraham, B.J.; Lin, C.Y.; Kagey, M.H.; Rahl, P.B.; Lee, T.I.; Young, R.A. Master Transcription Factors and Mediator Establish Super-Enhancers at Key Cell Identity Genes. Cell 2013, 153, 307–319. [Google Scholar] [CrossRef] [PubMed]
- Xiong, L.; Kang, R.; Ding, R.; Kang, W.; Zhang, Y.; Liu, W.; Huang, Q.; Meng, J.; Guo, Z. Genome-wide Identification and Characterization of Enhancers Across 10 Human Tissues. Int. J. Biol. Sci. 2018, 14, 1321–1332. [Google Scholar] [CrossRef] [PubMed]
- Gatchalian, J.; Malik, S.; Ho, J.; Lee, D.-S.; Kelso, T.W.R.; Shokhirev, M.N.; Dixon, J.R.; Hargreaves, D.C. A non-canonical BRD9-containing BAF chromatin remodeling complex regulates naive pluripotency in mouse embryonic stem cells. Nat. Commun. 2018, 9, 1–16. [Google Scholar] [CrossRef]
- Alpsoy, A.; Dykhuizen, E.C. Glioma tumor suppressor candidate region gene 1 (GLTSCR1) and its paralog GLTSCR1-like form SWI/SNF chromatin remodeling subcomplexes. J. Biol. Chem. 2018, 293, 3892–3903. [Google Scholar] [CrossRef]
- Kenny, C.; Hokamp, K.; O’Sullivan, M.J. (School of Medicine, Trinity College, University of Dublin, Dublin 2, Ireland). Personal communication, 2021.
- Krämer, K.F.; Moreno, N.; Frühwald, M.C.; Kerl, K. BRD9 Inhibition, Alone or in Combination with Cytostatic Compounds as a Therapeutic Approach in Rhabdoid Tumors. Int. J. Mol. Sci. 2017, 18, 1537. [Google Scholar] [CrossRef]
- Wang, X.; Wang, S.; Troisi, E.C.; Howard, T.P.; Haswell, J.R.; Wolf, B.K.; Hawk, W.H.; Ramos, P.; Oberlick, E.M.; Tzvetkov, E.P.; et al. BRD9 defines a SWI/SNF sub-complex and constitutes a specific vulnerability in malignant rhabdoid tumors. Nat. Commun. 2019, 10, 1–11. [Google Scholar] [CrossRef]
- Saxonov, S.; Berg, P.; Brutlag, D.L. A genome-wide analysis of CpG dinucleotides in the human genome distinguishes two distinct classes of promoters. Proc. Natl. Acad. Sci. USA 2006, 103, 1412–1417. [Google Scholar] [CrossRef]
- Ueno, H.; Okita, H.; Akimoto, S.; Kobayashi, K.; Nakabayashi, K.; Hata, K.; Fujimoto, J.; Hata, J.-I.; Fukuzawa, M.; Kiyokawa, N. DNA Methylation Profile Distinguishes Clear Cell Sarcoma of the Kidney from Other Pediatric Renal Tumors. PLoS ONE 2013, 8, e62233. [Google Scholar] [CrossRef]
- Chun, H.-J.E.; Lim, E.L.; Heravi-Moussavi, A.; Saberi, S.; Mungall, K.L.; Bilenky, M.; Carles, A.; Tse, K.; Shlafman, I.; Zhu, K.; et al. Genome-Wide Profiles of Extra-cranial Malignant Rhabdoid Tumors Reveal Heterogeneity and Dysregulated Developmental Pathways. Cancer Cell 2016, 29, 394–406. [Google Scholar] [CrossRef] [PubMed]
- Roberts, C.W.M.; Orkin, S.H. The SWI/SNF complex—chromatin and cancer. Nat. Rev. Cancer 2004, 4, 133–142. [Google Scholar] [CrossRef]
- Medina, P.P.; Romero, O.A.; Kohno, T.; Montuenga, L.M.; Pio, R.; Yokota, J.; Sanchez-Cespedes, M. Frequent BRG1/SMARCA4-inactivating mutations in human lung cancer cell lines. Hum. Mutat. 2008, 29, 617–622. [Google Scholar] [CrossRef] [PubMed]
- Reisman, D.; Glaros, S.; A Thompson, E. The SWI/SNF complex and cancer. Oncogene 2009, 28, 1653–1668. [Google Scholar] [CrossRef] [PubMed]
- Garraway, L.A.; Lander, E.S. Lessons from the Cancer Genome. Cell 2013, 153, 17–37. [Google Scholar] [CrossRef] [PubMed]
- Wang, X.; Haswell, J.R.; Roberts, C.M.W. Molecular Pathways: SWI/SNF (BAF) Complexes Are Frequently Mutated in Cancer—Mechanisms and Potential Therapeutic Insights. Clin. Cancer Res. 2014, 20, 21–27. [Google Scholar] [CrossRef] [PubMed]
- Lee, C.-K.; Shibata, Y.; Rao, B.; Strahl, B.D.; Lieb, J.D. Evidence for nucleosome depletion at active regulatory regions genome-wide. Nat. Genet. 2004, 36, 900–905. [Google Scholar] [CrossRef]
- Sparmann, A.; Van Lohuizen, M. Polycomb silencers control cell fate, development and cancer. Nat. Rev. Cancer 2006, 6, 846–856. [Google Scholar] [CrossRef]
- Pietersen, A.M.; van Lohuizen, M. Stem cell regulation by polycomb repressors: Postponing commitment. Curr. Opin. Cell Biol. 2008, 20, 201–207. [Google Scholar] [CrossRef]
- Bracken, A.P.; Dietrich, N.; Pasini, D.; Hansen, K.H.; Helin, K. Genome-wide mapping of Polycomb target genes unravels their roles in cell fate transitions. Genes Dev. 2006, 20, 1123–1136. [Google Scholar] [CrossRef] [PubMed]
- Bracken, A.P.; Helin, K. Polycomb group proteins: Navigators of lineage pathways led astray in cancer. Nat. Rev. Cancer 2009, 9, 773–784. [Google Scholar] [CrossRef]
- Calo, E.; Wysocka, J. Modification of Enhancer Chromatin: What, How, and Why? Mol. Cell 2013, 49, 825–837. [Google Scholar] [CrossRef]
- Tamkun, J.W.; Deuring, R.; Scott, M.P.; Kissinger, M.; Pattatucci, A.M.; Kaufman, T.C.; Kennison, J.A. brahma: A regulator of Drosophila homeotic genes structurally related to the yeast transcriptional activator SNF2SWI2. Cell 1992, 68, 561–572. [Google Scholar] [CrossRef]
- Kennison, J.A. The Polycomb and Trithorax Group Proteins of Drosophila: Trans-Regulators of Homeotic Gene Function. Annu. Rev. Genet. 1995, 29, 289–303. [Google Scholar] [CrossRef] [PubMed]
- Shao, Z.; Raible, F.; Mollaaghababa, R.; Guyon, J.R.; Wu, C.-T.; Bender, W.; Kingston, R.E. Stabilization of Chromatin Structure by PRC1, a Polycomb Complex. Cell 1999, 98, 37–46. [Google Scholar] [CrossRef]
- Francis, N.J.; Saurin, A.J.; Shao, Z.; E Kingston, R. Reconstitution of a Functional Core Polycomb Repressive Complex. Mol. Cell 2001, 8, 545–556. [Google Scholar] [CrossRef]
- Kwon, H.; Imbalzano, A.N.; Khavari, P.A.; Kingston, R.E.; Green, M.R. Nucleosome disruption and enhancement of activator binding by a human SW1/SNF complex. Nat. Cell Biol. 1994, 370, 477–481. [Google Scholar] [CrossRef]
- Carlson, M.; Osmond, B.C.; Neigeborn, L.; Botstein, D. A Suppressor of snf1 mutations causes constitutive high-level invertase synthesis in yeast. Genetics 1984, 107, 19–32. [Google Scholar] [CrossRef]
- Doan, D.N.; Veal, T.M.; Yan, Z.; Wang, W.; Jones, S.N.; Imbalzano, A.N. Loss of the INI1 tumor suppressor does not impair the expression of multiple BRG1-dependent genes or the assembly of SWI/SNF enzymes. Oncogene 2004, 23, 3462–3473. [Google Scholar] [CrossRef] [PubMed]
- Phelan, M.L.; Sif, S.; Narlikar, G.J.; E Kingston, R. Reconstitution of a Core Chromatin Remodeling Complex from SWI/SNF Subunits. Mol. Cell 1999, 3, 247–253. [Google Scholar] [CrossRef]
- Wang, W.; Côté, J.; Xue, Y.; Zhou, S.; Khavari, P.A.; Biggar, S.R.; Muchardt, C.; Kalpana, G.V.; Goff, S.P.; Yaniv, M.; et al. Purification and biochemical heterogeneity of the mammalian SWI-SNF complex. EMBO J. 1996, 15, 5370–5382. [Google Scholar] [CrossRef] [PubMed]
- Lemon, B.; Inouye, C.; King, D.S.; Tjian, R. Selectivity of chromatin-remodelling cofactors for ligand-activated transcription. Nat. Cell Biol. 2001, 414, 924–928. [Google Scholar] [CrossRef]
- Kaeser, M.D.; Aslanian, A.; Dong, M.-Q.; Yates, J.R.; Emerson, B.M. BRD7, a Novel PBAF-specific SWI/SNF Subunit, Is Required for Target Gene Activation and Repression in Embryonic Stem Cells. J. Biol. Chem. 2008, 283, 32254–32263. [Google Scholar] [CrossRef]
- Hohmann, A.F.; Vakoc, C.R. A rationale to target the SWI/SNF complex for cancer therapy. Trends Genet. 2014, 30, 356–363. [Google Scholar] [CrossRef]
- Pulice, J.L.; Kadoch, C. Composition and Function of Mammalian SWI/SNF Chromatin Remodeling Complexes in Human Disease. Cold Spring Harb. Symp. Quant. Biol. 2016, 81, 53–60. [Google Scholar] [CrossRef] [PubMed]
- Euskirchen, G.M.; Auerbach, R.K.; Davidov, E.; Gianoulis, T.A.; Zhong, G.; Rozowsky, J.; Bhardwaj, N.; Gerstein, M.B.; Snyder, M. Diverse Roles and Interactions of the SWI/SNF Chromatin Remodeling Complex Revealed Using Global Approaches. PLoS Genet. 2011, 7, e1002008. [Google Scholar] [CrossRef]
- Zhou, V.W.; Goren, A.; Bernstein, B.E. Charting histone modifications and the functional organization of mammalian genomes. Nat. Rev. Genet. 2010, 12, 7–18. [Google Scholar] [CrossRef]
- Jagani, Z.; Mora-Blanco, E.L.; Sansam, C.G.; McKenna, E.S.; Wilson, B.; Chen, D.; Klekota, J.; Tamayo, P.; Nguyen, P.T.L.; Tolstorukov, M.; et al. Loss of the tumor suppressor Snf5 leads to aberrant activation of the Hedgehog-Gli pathway. Nat. Med. 2010, 16, 1429–1433. [Google Scholar] [CrossRef]
- Mora-Blanco, E.L.; Mishina, Y.; Tillman, E.J.; Cho, Y.-J.; Thom, C.S.; Pomeroy, S.L.; Shao, W.; Roberts, C.W. Activation of β-catenin/TCF targets following loss of the tumor suppressor SNF5. Oncogene 2014, 33, 933–938. [Google Scholar] [CrossRef]
- Kim, K.H.; Roberts, C.W. Mechanisms by which SMARCB1 loss drives rhabdoid tumor growth. Cancer Genet. 2014, 207, 365–372. [Google Scholar] [CrossRef]
- Kuwahara, Y.; Wei, D.; Durand, J.; Weissman, B.E. SNF5 Reexpression in Malignant Rhabdoid Tumors Regulates Transcription of Target Genes by Recruitment of SWI/SNF Complexes and RNAPII to the Transcription Start Site of Their Promoters. Mol. Cancer Res. 2013, 11, 251–260. [Google Scholar] [CrossRef]
- Michel, B.C.; D’Avino, A.R.; Cassel, S.H.; Mashtalir, N.; McKenzie, Z.M.; McBride, M.J.; Valencia, A.M.; Zhou, Q.; Bocker, M.; Soares, L.M.M.; et al. A non-canonical SWI/SNF complex is a synthetic lethal target in cancers driven by BAF complex perturbation. Nat. Cell Biol. 2018, 20, 1410–1420. [Google Scholar] [CrossRef]
- Kenny, C.; McDonagh, N.; Lazaro, A.; O’Meara, E.; Klinger, R.; O’Connor, D.; Roche, F.; Hokamp, K.; O’Sullivan, M.J. Dysregulated mitogen-activated protein kinase signalling as an oncogenic basis for clear cell sarcoma of the kidney. J. Pathol. 2018, 244, 334–345. [Google Scholar] [CrossRef] [PubMed]
- Tian, B.; Yang, J.; Brasier, A.R. Two-Step Cross-linking for Analysis of Protein–Chromatin Interactions. Methods Mol. Biol. 2012, 809, 105–120. [Google Scholar] [CrossRef]
- Andrews, S. FastQC: A Quality Control Tool for High Throughput Sequence Data; Babraham Institute: Babraham, UK, 2010. [Google Scholar]
- Langmead, B.; Salzberg, S.L. Fast gapped-read alignment with Bowtie 2. Nat. Methods 2012, 9, 357–359. [Google Scholar] [CrossRef] [PubMed]
- Li, H.; Handsaker, B.; Wysoker, A.; Fennell, T.; Ruan, J.; Homer, N.; Marth, G.; Abecasis, G.; Durbin, R.; 1000 Genome Project Data Processing Subgroup. The Sequence Alignment/Map Format and SAMtools. Bioinformatics 2009, 25, 2078–2079. [Google Scholar] [CrossRef]
- Zhang, Y.; Liu, T.; A Meyer, C.; Eeckhoute, J.; Johnson, D.S.; E Bernstein, B.; Nussbaum, C.; Myers, R.M.; Brown, M.; Li, W.; et al. Model-based Analysis of ChIP-Seq (MACS). Genome Biol. 2008, 9, R137–R139. [Google Scholar] [CrossRef] [PubMed]
- Ramírez, F.; Ryan, D.P.; Grüning, B.; Bhardwaj, V.; Kilpert, F.; Richter, A.S.; Heyne, S.; Dündar, F.; Manke, T. deepTools2: A next generation web server for deep-sequencing data analysis. Nucleic Acids Res. 2016, 44, W160–W165. [Google Scholar] [CrossRef] [PubMed]
- Quinlan, A.R. BEDTools: The Swiss-Army Tool for Genome Feature Analysis. Curr. Protoc. Bioinform. 2014, 47, 11–12. [Google Scholar] [CrossRef] [PubMed]
- Love, M.I.; Huber, W.; Anders, S. Moderated estimation of fold change and dispersion for RNA-seq data with DESeq2. Genome Biol. 2014, 15, 550. [Google Scholar] [CrossRef] [PubMed]


Publisher’s Note: MDPI stays neutral with regard to jurisdictional claims in published maps and institutional affiliations. |
© 2021 by the authors. Licensee MDPI, Basel, Switzerland. This article is an open access article distributed under the terms and conditions of the Creative Commons Attribution (CC BY) license (https://creativecommons.org/licenses/by/4.0/).
Share and Cite
Kenny, C.; O’Meara, E.; Ulaş, M.; Hokamp, K.; O’Sullivan, M.J. Global Chromatin Changes Resulting from Single-Gene Inactivation—The Role of SMARCB1 in Malignant Rhabdoid Tumor. Cancers 2021, 13, 2561. https://doi.org/10.3390/cancers13112561
Kenny C, O’Meara E, Ulaş M, Hokamp K, O’Sullivan MJ. Global Chromatin Changes Resulting from Single-Gene Inactivation—The Role of SMARCB1 in Malignant Rhabdoid Tumor. Cancers. 2021; 13(11):2561. https://doi.org/10.3390/cancers13112561
Chicago/Turabian StyleKenny, Colin, Elaine O’Meara, Mevlüt Ulaş, Karsten Hokamp, and Maureen J. O’Sullivan. 2021. "Global Chromatin Changes Resulting from Single-Gene Inactivation—The Role of SMARCB1 in Malignant Rhabdoid Tumor" Cancers 13, no. 11: 2561. https://doi.org/10.3390/cancers13112561
APA StyleKenny, C., O’Meara, E., Ulaş, M., Hokamp, K., & O’Sullivan, M. J. (2021). Global Chromatin Changes Resulting from Single-Gene Inactivation—The Role of SMARCB1 in Malignant Rhabdoid Tumor. Cancers, 13(11), 2561. https://doi.org/10.3390/cancers13112561