
Cell-Penetrating CEBPB and CEBPD Leucine Zipper Decoys as Broadly Acting Anti-Cancer Agents

 , ,
, ,  and
and 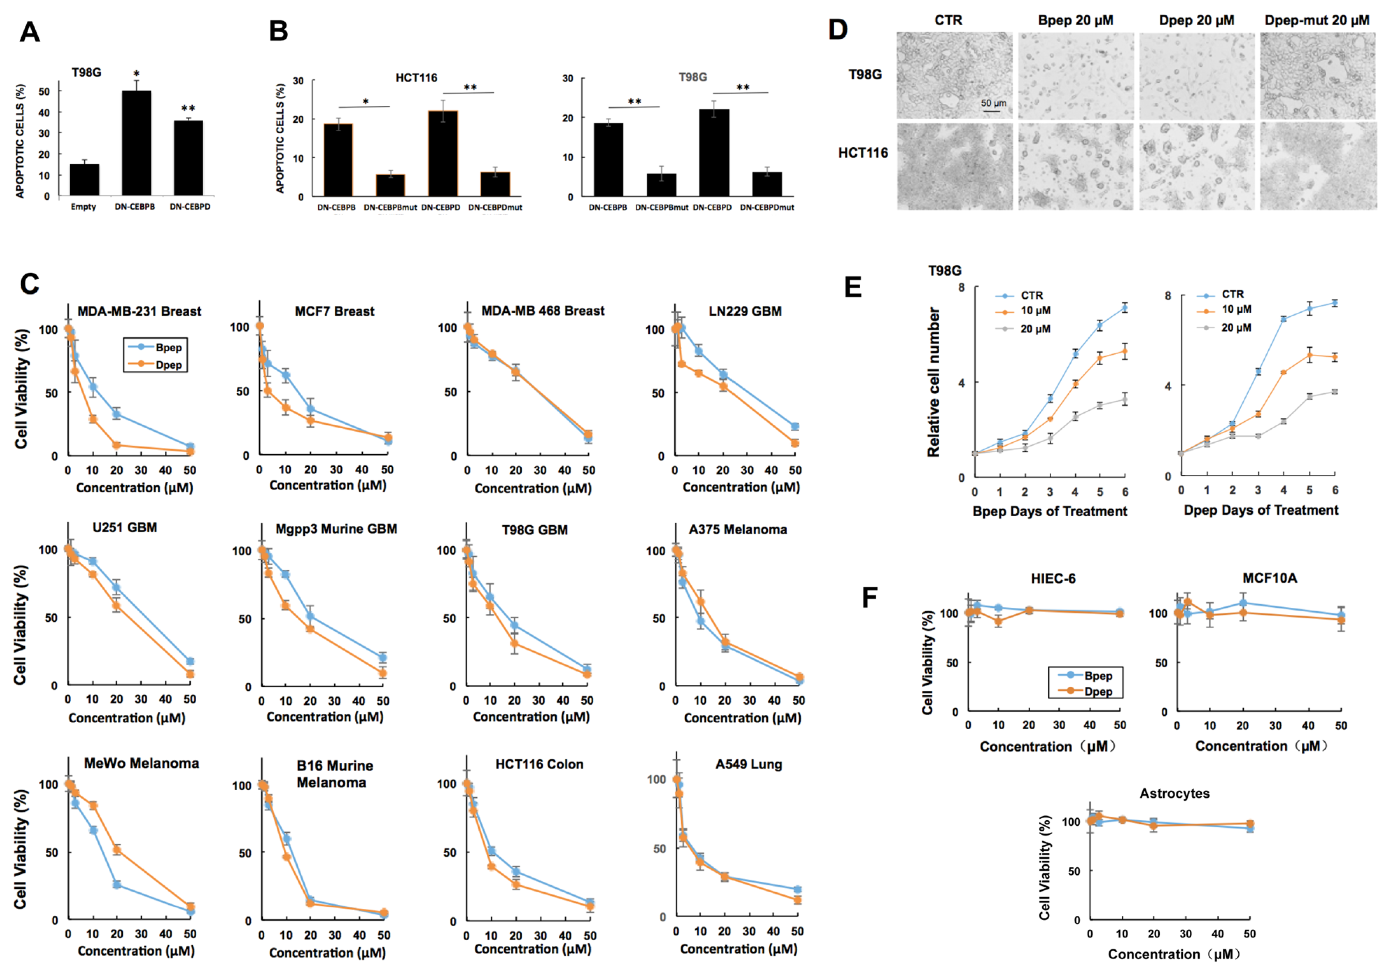
Abstract
Simple Summary
Abstract
1. Introduction
2. Materials and Methods
2.1. Cell Culture, Peptides and siRNA Treatment
2.2. Cell Viability
2.3. Colony Formation Assays
2.4. Plasmids
2.5. Transfection Assays of WT and Mutant DN-CEBPB or DN-CEBPD
2.6. Annexin V-FITC/PI Double Staining Assay
2.7. qPCR
2.8. Western Immunoblotting
2.9. Migration Scratch Assay
2.10. Mouse Tumor Models
2.11. Statistical Analyses
3. Results
3.1. dn-CEBPB and -CEBPD Expression Compromises Cancer Cell Survival
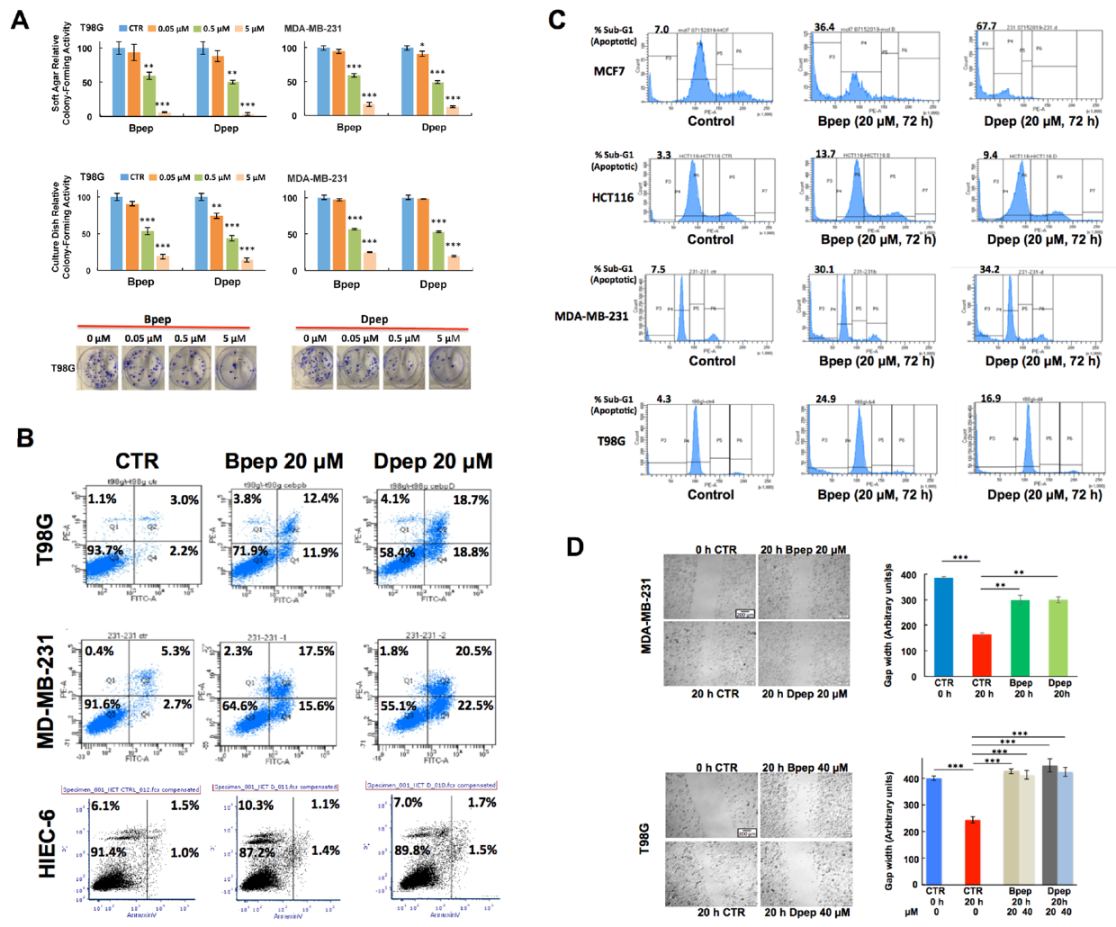
3.2. Cell-Penetrating dn-CEBPB and dn-CEBPD Peptides Compromise Growth/Survival of Multiple Cancer Cell Lines
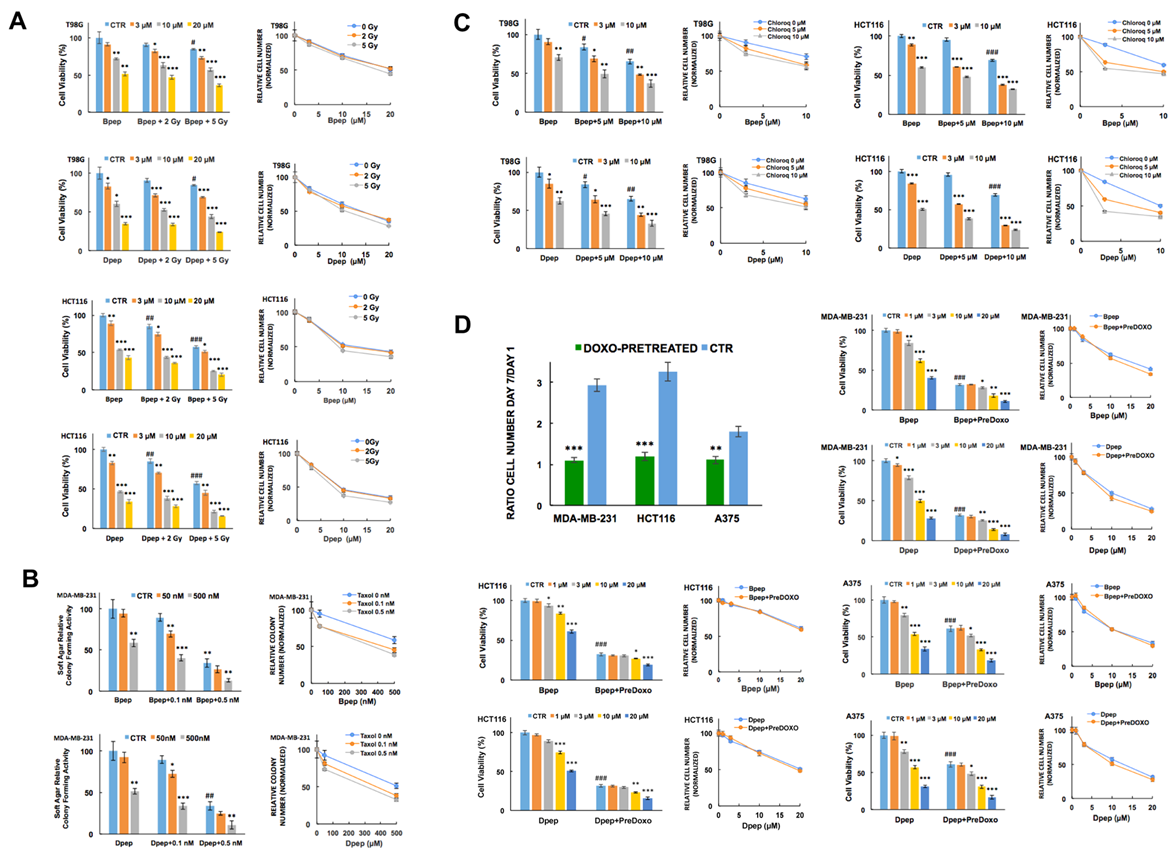
3.3. Bpep and Dpep Act in Combination with Other Cancer Therapeutics
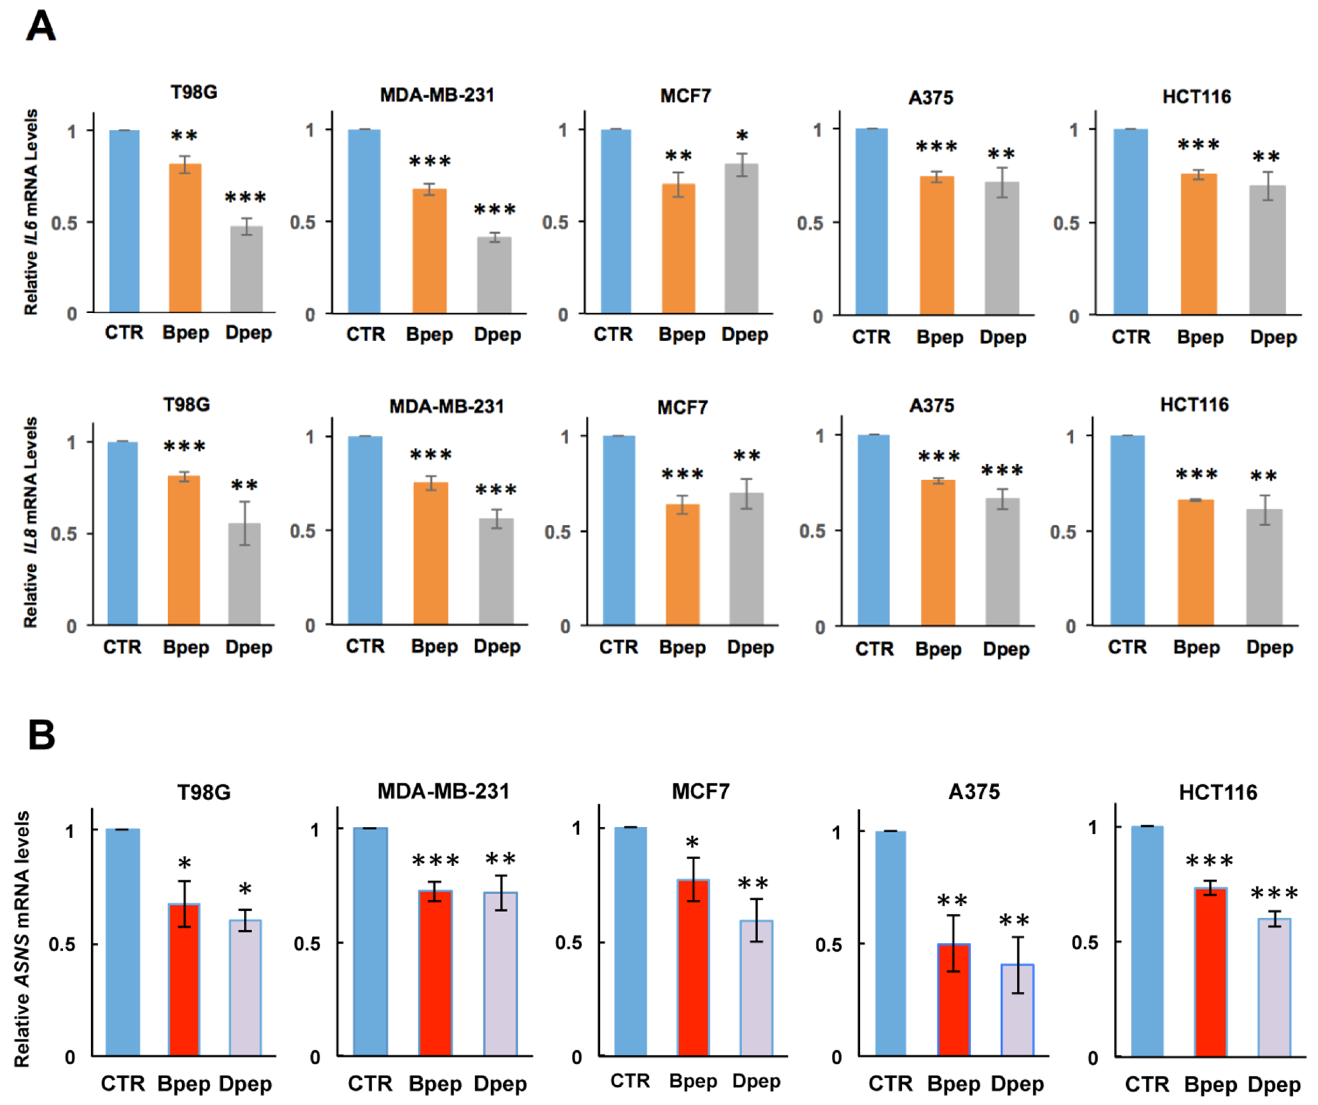
3.4. Bpep and Dpep Suppress Expression of Direct CEBPB and CEBPD Targets IL6, IL8 and ASNS
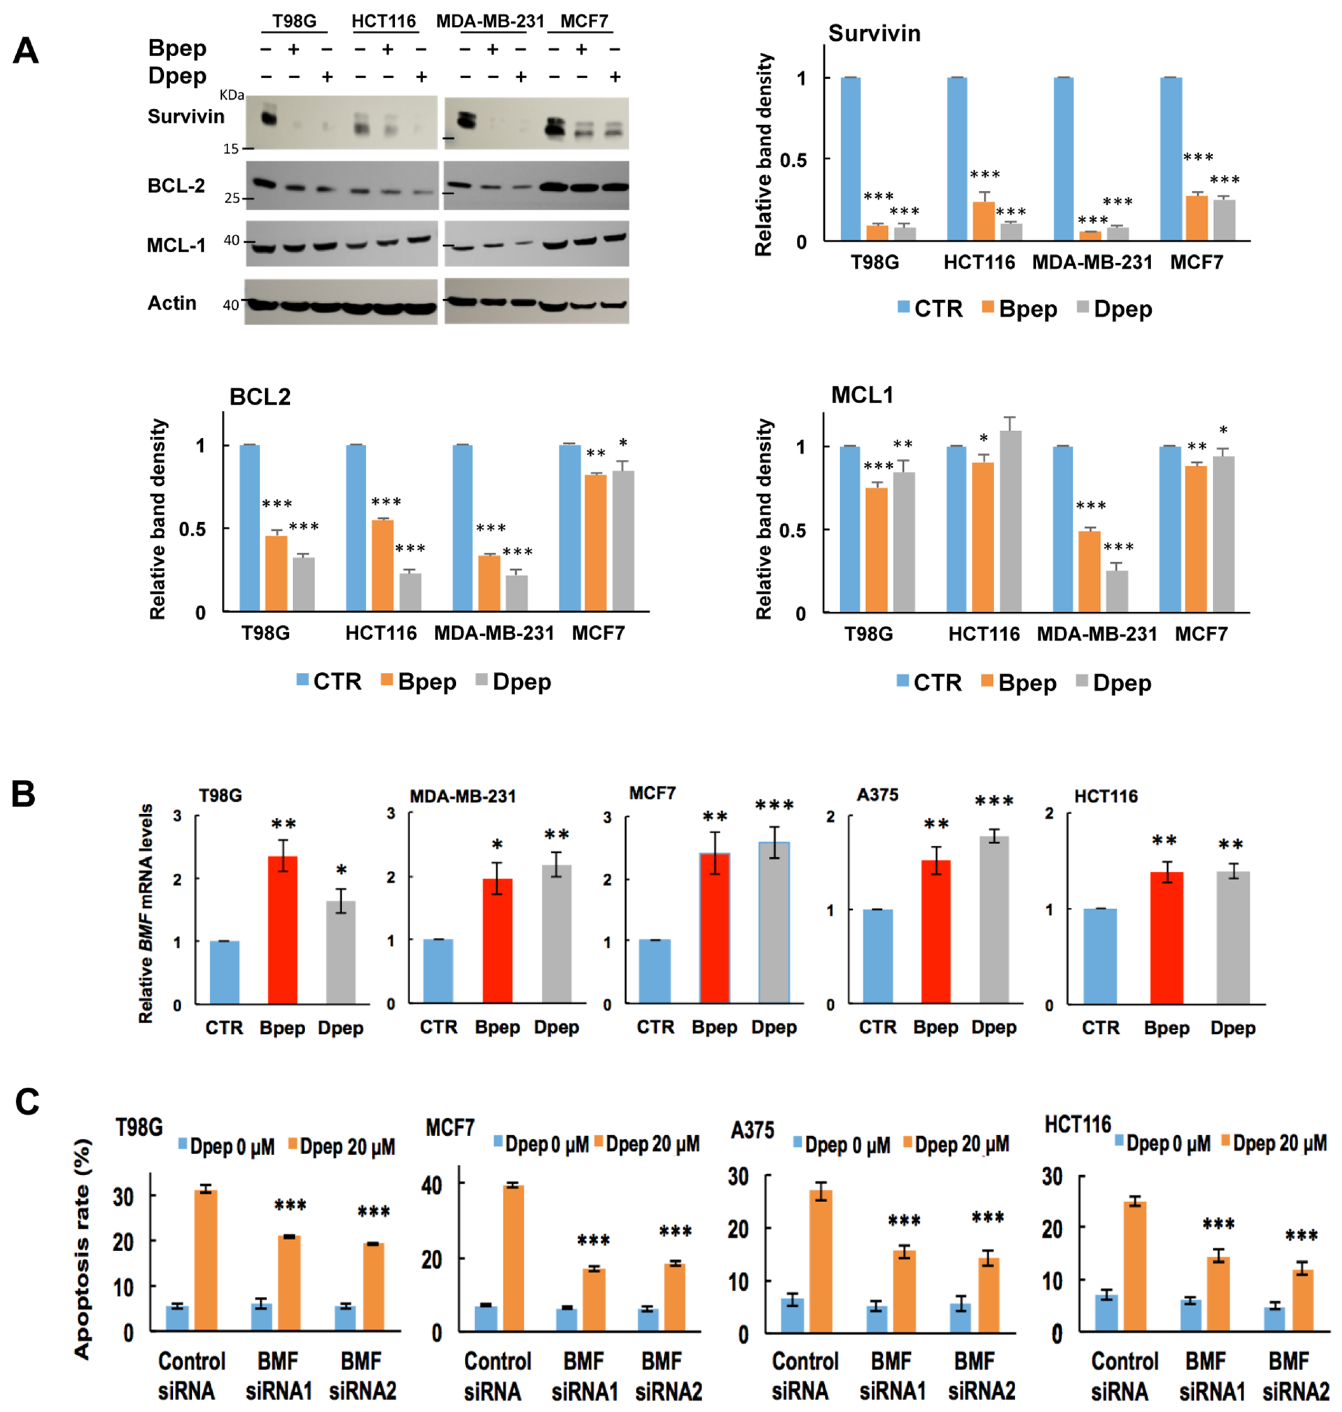
3.5. Bpep and Dpep Deplete Anti-Apoptotic Protein Survivin and Reduce Expression of Direct ATF5 Targets BCL2 and MCL1
3.6. BMF Is Upregulated by Bpep and Dpep and Is Required for Dpep-Promoted Cancer Cell Apoptosis
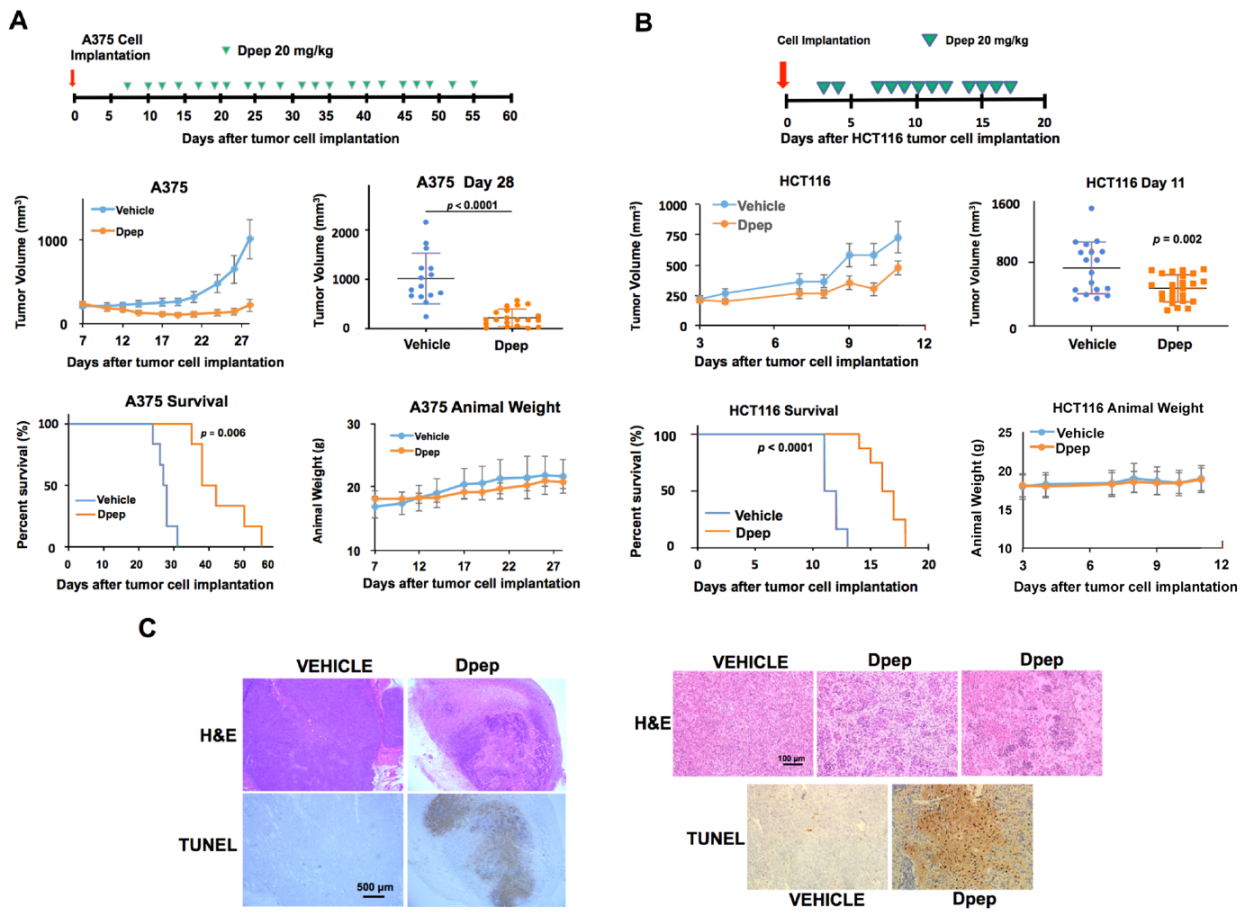
3.7. Bpep and Dpep Are Active In Vivo
4. Discussion
5. Conclusions
Supplementary Materials
Author Contributions
Funding
Institutional Review Board Statement
Informed Consent Statement
Data Availability Statement
Acknowledgments
Conflicts of Interest
References
- Gomis, R.R.; Alarcón, C.; Nadal, C.; Van Poznak, C.; Massagué, J. C/EBPβ at the core of the TGFβ cytostatic response and its evasion in metastatic breast cancer cells. Cancer Cell 2006, 10, 203–214. [Google Scholar] [CrossRef] [PubMed]
- Angelastro, J.M.; Canoll, P.D.; Kuo, J.; Weicker, M.; Costa, A.; Bruce, J.N.; A Greene, L. Selective destruction of glioblastoma cells by interference with the activity or expression of ATF5. Oncogene 2005, 25, 907–916. [Google Scholar] [CrossRef] [PubMed]
- Piva, R.; Pellegrino, E.; Mattioli, M.; Agnelli, L.; Lombardi, L.; Boccalatte, F.; Costa, G.; Ruggeri, B.A.; Cheng, M.; Chiarle, R.; et al. Functional validation of the anaplastic lymphoma kinase signature identifies CEBPB and Bcl2A1 as critical target genes. J. Clin. Investig. 2006, 116, 3171–3182. [Google Scholar] [CrossRef] [PubMed]
- Monaco, S.E.; Angelastro, J.M.; Szabolcs, M.; Greene, L.A. The transcription factor ATF5 is widely expressed in carcinomas, and interference with its function selectively kills neoplastic, but not nontransformed, breast cell lines. Int. J. Cancer 2007, 120, 1883–1890. [Google Scholar] [CrossRef]
- Oh, W.J.; Rishi, V.; Orosz, A.; Gerdes, M.J.; Vinson, C. Inhibition of CCAAT/Enhancer Binding Protein Family DNA Binding in Mouse Epidermis Prevents and Regresses Papillomas. Cancer Res. 2007, 67, 1867–1876. [Google Scholar] [CrossRef]
- Sheng, Z.; Li, L.; Zhu, L.J.; Smith, T.W.; Demers, A.; Ross, A.H.; Moser, R.P.; Green, M.R. A genome-wide RNA interference screen reveals an essential CREB3L2-ATF5-MCL1 survival pathway in malignant glioma with therapeutic implications. Nat. Med. 2010, 16, 671–677. [Google Scholar] [CrossRef]
- Carro, M.S.; Lim, W.K.; Alvarez, M.J.; Bollo, R.J.; Zhao, X.; Snyder, E.Y.; Sulman, E.P.; Anne, S.L.; Doetsch, F.; Colman, H.; et al. The transcriptional network for mesenchymal transformation of brain tumours. Nature 2009, 463, 318–325. [Google Scholar] [CrossRef]
- Rousseau, J.; Gagné, V.; Labuda, M.; Beaubois, C.; Sinnett, D.; Laverdière, C.; Moghrabi, A.; Sallan, S.E.; Silverman, L.B.; Neuberg, D.; et al. ATF5 polymorphisms influence ATF function and response to treatment in children with childhood acute lymphoblastic leukemia. Blood 2011, 118, 5883–5890. [Google Scholar] [CrossRef]
- Sarkar, T.R.; Sharan, S.; Wang, J.; Pawar, S.A.; Cantwell, C.A.; Johnson, P.F.; Morrison, D.K.; Wang, J.-M.; Sterneck, E. Identification of a Src Tyrosine Kinase/SIAH2 E3 Ubiquitin Ligase Pathway That Regulates C/EBP Expression and Contributes to Transformation of Breast Tumor Cells. Mol. Cell. Biol. 2011, 32, 320–332. [Google Scholar] [CrossRef]
- Hu, M.; Wang, B.; Qian, D.; Li, L.; Zhang, L.; Song, X.; Liu, D.X. Interference with ATF5 function enhances the sensitivity of human pancreatic cancer cells to paclitaxel-induced apoptosis. Anticancer Res. 2012, 32, 4385–4394. [Google Scholar]
- Wang, Y.-H.; Wu, W.-J.; Wang, W.-J.; Huang, H.-Y.; Li, W.-M.; Yeh, B.-W.; Wu, T.-F.; Shiue, Y.-L.; Sheu, J.J.-C.; Wang, J.-M.; et al. CEBPDamplification and overexpression in urothelial carcinoma: A driver of tumor metastasis indicating adverse prognosis. Oncotarget 2015, 6, 31069–31084. [Google Scholar] [CrossRef]
- Ishihara, S.; Yasuda, M.; Ishizu, A.; Ishikawa, M.; Shirato, H.; Haga, H. Activating transcription factor 5 enhances radioresistance and malignancy in cancer cells. Oncotarget 2015, 6, 4602–4614. [Google Scholar] [CrossRef]
- Nukuda, A.; Endoh, H.; Yasuda, M.; Mizutani, T.; Kawabata, K.; Haga, H. Role of ATF5 in the invasive potential of diverse human cancer cell lines. Biochem. Biophys. Res. Commun. 2016, 474, 509–514. [Google Scholar] [CrossRef]
- Banerjee, S.; Aykin-Burns, N.; Krager, K.J.; Shah, S.K.; Melnyk, S.B.; Hauer-Jensen, M.; Pawar, S.A. Loss of C/EBPδ enhances IR-induced cell death by promoting oxidative stress and mitochondrial dysfunction. Free Radic. Biol. Med. 2016, 99, 296–307. [Google Scholar] [CrossRef]
- Angelastro, J.M. Targeting ATF5 in Cancer. Trends Cancer 2017, 3, 471–474. [Google Scholar] [CrossRef]
- Gardiner, J.D.; Abegglen, L.M.; Huang, X.; Carter, B.E.; Schackmann, E.A.; Stucki, M.; Paxton, C.N.; Randall, R.L.; Amatruda, J.F.; Putnam, A.R.; et al. C/EBPβ-1 promotes transformation and chemoresistance in Ewing sarcoma cells. Oncotarget 2017, 8, 26013–26026. [Google Scholar] [CrossRef]
- Zhang, Y.; Wang, H.-R.; Wrana, J.L. Smurf1: A Link between Cell Polarity and Ubiquitination. Cell Cycle 2004, 3, 389–390. [Google Scholar] [CrossRef]
- Ben-Shmuel, S.; Rashed, R.; Rostoker, R.; Isakov, E.; Shen-Orr, Z.; Leroith, D. Activating Transcription Factor-5 Knockdown Reduces Aggressiveness of Mammary Tumor Cells and Attenuates Mammary Tumor Growth. Front. Endocrinol. 2017, 8, 173. [Google Scholar] [CrossRef]
- Wang, W.-J.; Li, C.-F.; Chu, Y.-Y.; Wang, Y.-H.; Hour, T.-C.; Yen, C.-J.; Chang, W.-C.; Wang, J.-M. Inhibition of the EGFR/STAT3/CEBPD Axis Reverses Cisplatin Cross-resistance with Paclitaxel in the Urothelial Carcinoma of the Urinary Bladder. Clin. Cancer Res. 2017, 23, 503–513. [Google Scholar] [CrossRef]
- Messenger, Z.J.; Hall, J.R.; Jima, D.D.; House, J.S.; Tam, H.W.; Tokarz, D.A.; Smart, R.C. C/EBPβ deletion in oncogenic Ras skin tumors is a synthetic lethal event. Cell Death Dis. 2018, 9, 1054. [Google Scholar] [CrossRef]
- Liu, D.; Zhang, X.-X.; Li, M.-C.; Cao, C.-H.; Wan, D.-Y.; Xi, B.-X.; Tan, J.-H.; Wang, J.; Yang, Z.-Y.; Feng, X.-X.; et al. C/EBPβ enhances platinum resistance of ovarian cancer cells by reprogramming H3K79 methylation. Nat. Commun. 2018, 9, 1–13. [Google Scholar] [CrossRef]
- Feldheim, J.; Kessler, A.F.; Schmitt, D.; Wilczek, L.; Linsenmann, T.; Dahlmann, M.; Monoranu, C.M.; Ernestus, R.-I.; Hagemann, C.; Löhr, M. Expression of activating transcription factor 5 (ATF5) is increased in astrocytomas of different WHO grades and correlates with survival of glioblastoma patients. OncoTargets Ther. 2018, 11, 8673–8684. [Google Scholar] [CrossRef]
- Wang, F.; Gao, Y.; Tang, L.; Ning, K.; Geng, N.; Zhang, H.; Li, Y.; Li, Y.; Liu, F.; Li, F. A novel PAK4-CEBPB-CLDN4 axis involving in breast cancer cell migration and invasion. Biochem. Biophys. Res. Commun. 2019, 511, 404–408. [Google Scholar] [CrossRef]
- Du, Q.; Tan, Z.; Shi, F.; Tang, M.; Xie, L.; Zhao, L.; Li, Y.; Hu, J.; Zhou, M.; Bode, A.; et al. PGC1α/CEBPB/CPT1A axis promotes radiation resistance of nasopharyngeal carcinoma through activating fatty acid oxidation. Cancer Sci. 2019, 110, 2050–2062. [Google Scholar] [CrossRef]
- Wang, D.; Cheng, X.; Li, Y.; Guo, M.; Zhao, W.; Qiu, J.; Zheng, Y.; Meng, M.; Ping, X.; Chen, X.; et al. C/EBPδ-Slug-Lox1 axis promotes metastasis of lung adenocarcinoma via oxLDL uptake. Oncogene 2019, 39, 833–848. [Google Scholar] [CrossRef]
- Wang, D.; Ruan, X.; Liu, X.; Xue, Y.; Shao, L.; Yang, C.; Zhu, L.; Yang, Y.; Li, Z.; Yu, B.; et al. SUMOylation of PUM2 promotes the vasculogenic mimicry of glioma cells via regulating CEBPD. Clin. Transl. Med. 2020, 10. [Google Scholar] [CrossRef] [PubMed]
- Wu, H.; Gu, J.; Zhou, D.; Cheng, W.; Wang, Y.; Wang, Q.; Wang, X. LINC00160 mediated paclitaxel-And doxorubicin-resistance in breast cancer cells by regulating TFF3 via transcription factor C/EBPβ. J. Cell. Mol. Med. 2020, 24, 8589–8602. [Google Scholar] [CrossRef]
- Kudo, T.; Prentzell, M.T.; Mohapatra, S.R.; Sahm, F.; Zhao, Z.; Grummt, I.; Wick, W.; Opitz, C.A.; Platten, M.; Green, E.W. Constitutive Expression of the Immunosuppressive Tryptophan Dioxygenase TDO2 in Glioblastoma Is Driven by the Transcription Factor C/EBPβ. Front. Immunol. 2020, 11. [Google Scholar] [CrossRef] [PubMed]
- Hua, Z.-Y.; Hansen, J.N.; He, M.; Dai, S.-K.; Choi, Y.; Fulton, M.D.; Lloyd, S.M.; Szemes, M.; Sen, J.; Ding, H.-F.; et al. PRMT1 promotes neuroblastoma cell survival through ATF5. Oncogenesis 2020, 9, 1–12. [Google Scholar] [CrossRef] [PubMed]
- Arias, A.; Lamé, M.W.; Santarelli, L.; Hen, R.; A Greene, L.; Angelastro, J.M. Regulated ATF5 loss-of-function in adult mice blocks formation and causes regression/eradication of gliomas. Oncogene 2011, 31, 739–751. [Google Scholar] [CrossRef] [PubMed]
- Cates, C.C.; Arias, A.D.; Wong, L.S.N.; Lamé, M.W.; Sidorov, M.; Cayanan, G.; Rowland, D.J.; Fung, J.; Karpel-Massler, G.; Siegelin, M.D.; et al. Regression/Eradication of gliomas in mice by a systemically-deliverable ATF5 dominant-negative peptide. Oncotarget 2016, 7, 12718–12730. [Google Scholar] [CrossRef]
- Karpel-Massler, G.; Horst, B.A.; Shu, C.; Chau, L.; Tsujiuchi, T.; Bruce, J.N.; Canoll, P.; Greene, L.A.; Angelastro, J.M.; Siegelin, M.D. A Synthetic Cell-Penetrating Dominant-Negative ATF5 Peptide Exerts Anticancer Activity against a Broad Spectrum of Treatment-Resistant Cancers. Clin. Cancer Res. 2016, 22, 4698–4711. [Google Scholar] [CrossRef]
- Sun, X.; Jefferson, P.; Zhou, Q.; Angelastro, J.M.; Greene, L.A. Dominant-Negative ATF5 Compromises Cancer Cell Survival by Targeting CEBPB and CEBPD. Mol. Cancer Res. 2020, 18, 216–228. [Google Scholar] [CrossRef]
- Olive, M.; Williams, S.C.; Dezan, C.; Johnson, P.F.; Vinson, C. Design of a C/EBP-specific, Dominant-negative bZIP Protein with Both Inhibitory and Gain-of-function Properties. J. Biol. Chem. 1996, 271, 2040–2047. [Google Scholar] [CrossRef]
- Reinke, A.W.; Baek, J.; Ashenberg, O.; Keating, A.E. Networks of bZIP Protein-Protein Interactions Diversified Over a Billion Years of Evolution. Science 2013, 340, 730–734. [Google Scholar] [CrossRef]
- Vinson, C.R.; Hai, T.; Boyd, S.M. Dimerization specificity of the leucine zipper-containing bZIP motif on DNA binding: Prediction and rational design. Genes Dev. 1993, 7, 1047–1058. [Google Scholar] [CrossRef]
- Dupont, E.; Prochiantz, A.; Joliot, A. Penetratin Story: An Overview. Methods Mol. Biol. 2015, 1324, 29–37. [Google Scholar] [CrossRef]
- Sonabend, A.M.; Yun, J.; Lei, L.; Leung, R.; Soderquist, C.; Crisman, C.; Gill, B.J.; Carminucci, A.; Sisti, J.; Castelli, M.; et al. Murine cell line model of proneural glioma for evaluation of anti-tumor therapies. J. Neurooncol. 2013, 112, 375–382. [Google Scholar] [CrossRef]
- Beaulieu, J.-F.; Ménard, D. Isolation, Characterization, and Culture of Normal Human Intestinal Crypt and Villus Cells. Methods Mol. Biol. 2012, 806, 157–173. [Google Scholar] [CrossRef]
- Zhou, Q.; Chai, W. Suppression of STN1 enhances the cytotoxicity of chemotherapeutic agents in cancer cells by elevating DNA damage. Oncol. Lett. 2016, 12, 800–808. [Google Scholar] [CrossRef]
- Ullah, I.; Chung, K.; Bae, S.; Li, Y.; Kim, C.; Choi, B.; Nam, H.Y.; Kim, S.H.; Yun, C.-O.; Lee, K.Y.; et al. Nose-to-Brain Delivery of Cancer-Targeting Paclitaxel-Loaded Nanoparticles Potentiates Antitumor Effects in Malignant Glioblastoma. Mol. Pharm. 2020, 17, 1193–1204. [Google Scholar] [CrossRef] [PubMed]
- Rodrigues-Ferreira, S.; Moindjie, H.; Haykal, M.M.; Nahmias, C. Predicting and Overcoming Taxane Chemoresistance. Trends Mol. Med. 2020, 27, 138–151. [Google Scholar] [CrossRef] [PubMed]
- Xu, R.; Ji, Z.; Xu, C.; Zhu, J. The clinical value of using chloroquine or hydroxychloroquine as autophagy inhibitors in the treatment of cancers. Medicine 2018, 97, e12912. [Google Scholar] [CrossRef] [PubMed]
- Caron, N.J.; Quenneville, S.P.; Tremblay, J.P. Endosome disruption enhances the functional nuclear delivery of Tat-fusion proteins. Biochem. Biophys. Res. Commun. 2004, 319, 12–20. [Google Scholar] [CrossRef]
- Van Der Zanden, S.Y.; Qiao, X.; Neefjes, J. New insights into the activities and toxicities of the old anticancer drug doxorubicin. FEBS J. 2020. [Google Scholar] [CrossRef]
- A Fornari, F.; Jarvis, W.D.; Grant, S.; Orr, M.S.; Randolph, J.K.; White, F.K.; Mumaw, V.R.; Lovings, E.T.; Freeman, R.H.; A Gewirtz, D. Induction of differentiation and growth arrest associated with nascent (nonoligosomal) DNA fragmentation and reduced c-myc expression in MCF-7 human breast tumor cells after continuous exposure to a sublethal concentration of doxorubicin. Cell Growth Differ. 1994, 5, 723–733. [Google Scholar]
- Bojko, A.; Czarnecka-Herok, J.; Charzynska, A.; Dabrowski, M.; Sikora, E. Diversity of the Senescence Phenotype of Cancer Cells Treated with Chemotherapeutic Agents. Cells 2019, 8, 1501. [Google Scholar] [CrossRef]
- Kuilman, T.; Michaloglou, C.; Vredeveld, L.C.; Douma, S.; Van Doorn, R.; Desmet, C.J.; Aarden, L.A.; Mooi, W.J.; Peeper, D.S. Oncogene-Induced Senescence Relayed by an Interleukin-Dependent Inflammatory Network. Cell 2008, 133, 1019–1031. [Google Scholar] [CrossRef]
- Hungness, E.S.; Luo, G.-J.; Pritts, T.A.; Sun, X.; Robb, B.W.; Hershko, D.; Hasselgren, P.-O. Transcription factors C/EBP-beta and -delta regulate IL-6 production in IL-1beta-stimulated human enterocytes. J. Cell. Physiol. 2002, 192, 64–70. [Google Scholar] [CrossRef]
- Taher, M.Y.; Davies, D.M.; Maher, J. The role of the interleukin (IL)-6/IL-6 receptor axis in cancer. Biochem. Soc. Trans. 2018, 46, 1449–1462. [Google Scholar] [CrossRef]
- David, J.; Dominguez, C.; Hamilton, D.H.; Palena, C. The IL-8/IL-8R Axis: A Double Agent in Tumor Immune Resistance. Vaccines 2016, 4, 22. [Google Scholar] [CrossRef]
- Al Sarraj, J.; Vinson, C.; Thiel, G. Regulation of asparagine synthetase gene transcription by the basic region leucine zipper transcription factors ATF5 and CHOP. Biol. Chem. 2005, 386, 873–879. [Google Scholar] [CrossRef]
- Siu, F.; Chen, C.; Zhong, C.; Kilberg, M.S. CCAAT/Enhancer-binding Protein-β Is a Mediator of the Nutrient-sensing Response Pathway That Activates the Human Asparagine Synthetase Gene. J. Biol. Chem. 2001, 276, 48100–48107. [Google Scholar] [CrossRef]
- Chiu, M.; Taurino, G.; Bianchi, M.G.; Kilberg, M.S.; Bussolati, O. Asparagine Synthetase in Cancer: Beyond Acute Lymphoblastic Leukemia. Front. Oncol. 2020, 9, 1480. [Google Scholar] [CrossRef]
- Wheatley, S.P.; Altieri, D.C. Survivin at a glance. J. Cell Sci. 2019, 132. [Google Scholar] [CrossRef]
- Warrier, N.M.; Agarwal, P.; Kumar, P. Emerging Importance of Survivin in Stem Cells and Cancer: The Development of New Cancer Therapeutics. Stem Cell Rev. Rep. 2020, 16, 828–852. [Google Scholar] [CrossRef]
- García, D.M.; Manero-Rupérez, N.; Quesada, R.; Korrodi-Gregório, L.; Soto-Cerrato, V. Therapeutic strategies involving survivin inhibition in cancer. Med. Res. Rev. 2019, 39, 887–909. [Google Scholar] [CrossRef]
- Sun, X.; Angelastro, J.M.; Merino, D.; Zhou, Q.; Siegelin, M.D.; Greene, L.A. Dominant-negative ATF5 rapidly depletes survivin in tumor cells. Cell Death Dis. 2019, 10, 1–12. [Google Scholar] [CrossRef] [PubMed]
- Dluzen, D.; Li, G.; Tacelosky, D.; Moreau, M.; Liu, D.X. BCL-2 Is a Downstream Target of ATF5 That Mediates the Prosurvival Function of ATF5 in a Cell Type-dependent Manner. J. Biol. Chem. 2011, 286, 7705–7713. [Google Scholar] [CrossRef]
- Li, G.; Li, W.; Angelastro, J.M.; Greene, L.A.; Liu, D.X. Identification of a Novel DNA Binding Site and a Transcriptional Target for Activating Transcription Factor 5 in C6 Glioma and MCF-7 Breast Cancer Cells. Mol. Cancer Res. 2009, 7, 933–943. [Google Scholar] [CrossRef]
- Fiorese, C.; Schulz, A.M.; Lin, Y.-F.; Rosin, N.; Pellegrino, M.W.; Haynes, C.M. The Transcription Factor ATF5 Mediates a Mammalian Mitochondrial UPR. Curr. Biol. 2016, 26, 2037–2043. [Google Scholar] [CrossRef]
- Madarampalli, B.; Yuan, Y.; Liu, D.; Lengel, K.; Xu, Y.; Li, G.; Yang, J.; Liu, X.; Lu, Z.; Liu, D.X. ATF5 Connects the Pericentriolar Materials to the Proximal End of the Mother Centriole. Cell 2015, 162, 580–592. [Google Scholar] [CrossRef] [PubMed]
- Mann, I.K.; Chatterjee, R.; Zhao, J.; He, X.; Weirauch, M.T.; Hughes, T.R.; Vinson, C. CG methylated microarrays identify a novel methylated sequence bound by the CEBPB ATF4 heterodimer that is active in vivo. Genome Res. 2013, 23, 988–997. [Google Scholar] [CrossRef] [PubMed]
- Summers, M.A.; McDonald, M.M.; Croucher, P.I. Cancer Cell Dormancy in Metastasis. Cold Spring Harb. Perspect. Med. 2020, 10, a037556. [Google Scholar] [CrossRef]
- Park, S.-Y.; Nam, J.-S. The force awakens: Metastatic dormant cancer cells. Exp. Mol. Med. 2020, 52, 569–581. [Google Scholar] [CrossRef]
- Kurppa, K.J.; Liu, Y.; To, C.; Zhang, T.; Fan, M.; Vajdi, A.; Knelson, E.H.; Xie, Y.; Lim, K.; Cejas, P.; et al. Treatment-Induced Tumor Dormancy through YAP-Mediated Transcriptional Reprogramming of the Apoptotic Pathway. Cancer Cell 2020, 37, 104–122.e12. [Google Scholar] [CrossRef]


Publisher’s Note: MDPI stays neutral with regard to jurisdictional claims in published maps and institutional affiliations. |
© 2021 by the authors. Licensee MDPI, Basel, Switzerland. This article is an open access article distributed under the terms and conditions of the Creative Commons Attribution (CC BY) license (https://creativecommons.org/licenses/by/4.0/).
Share and Cite
Zhou, Q.; Sun, X.; Pasquier, N.; Jefferson, P.; Nguyen, T.T.T.; Siegelin, M.D.; Angelastro, J.M.; Greene, L.A. Cell-Penetrating CEBPB and CEBPD Leucine Zipper Decoys as Broadly Acting Anti-Cancer Agents. Cancers 2021, 13, 2504. https://doi.org/10.3390/cancers13102504
Zhou Q, Sun X, Pasquier N, Jefferson P, Nguyen TTT, Siegelin MD, Angelastro JM, Greene LA. Cell-Penetrating CEBPB and CEBPD Leucine Zipper Decoys as Broadly Acting Anti-Cancer Agents. Cancers. 2021; 13(10):2504. https://doi.org/10.3390/cancers13102504
Chicago/Turabian StyleZhou, Qing, Xiotian Sun, Nicolas Pasquier, Parvaneh Jefferson, Trang T. T. Nguyen, Markus D. Siegelin, James M. Angelastro, and Lloyd A. Greene. 2021. "Cell-Penetrating CEBPB and CEBPD Leucine Zipper Decoys as Broadly Acting Anti-Cancer Agents" Cancers 13, no. 10: 2504. https://doi.org/10.3390/cancers13102504
APA StyleZhou, Q., Sun, X., Pasquier, N., Jefferson, P., Nguyen, T. T. T., Siegelin, M. D., Angelastro, J. M., & Greene, L. A. (2021). Cell-Penetrating CEBPB and CEBPD Leucine Zipper Decoys as Broadly Acting Anti-Cancer Agents. Cancers, 13(10), 2504. https://doi.org/10.3390/cancers13102504