Inhibitors of the Transcription Factor STAT3 Decrease Growth and Induce Immune Response Genes in Models of Malignant Pleural Mesothelioma (MPM)

 ,
, 
 ,
,  , , , and
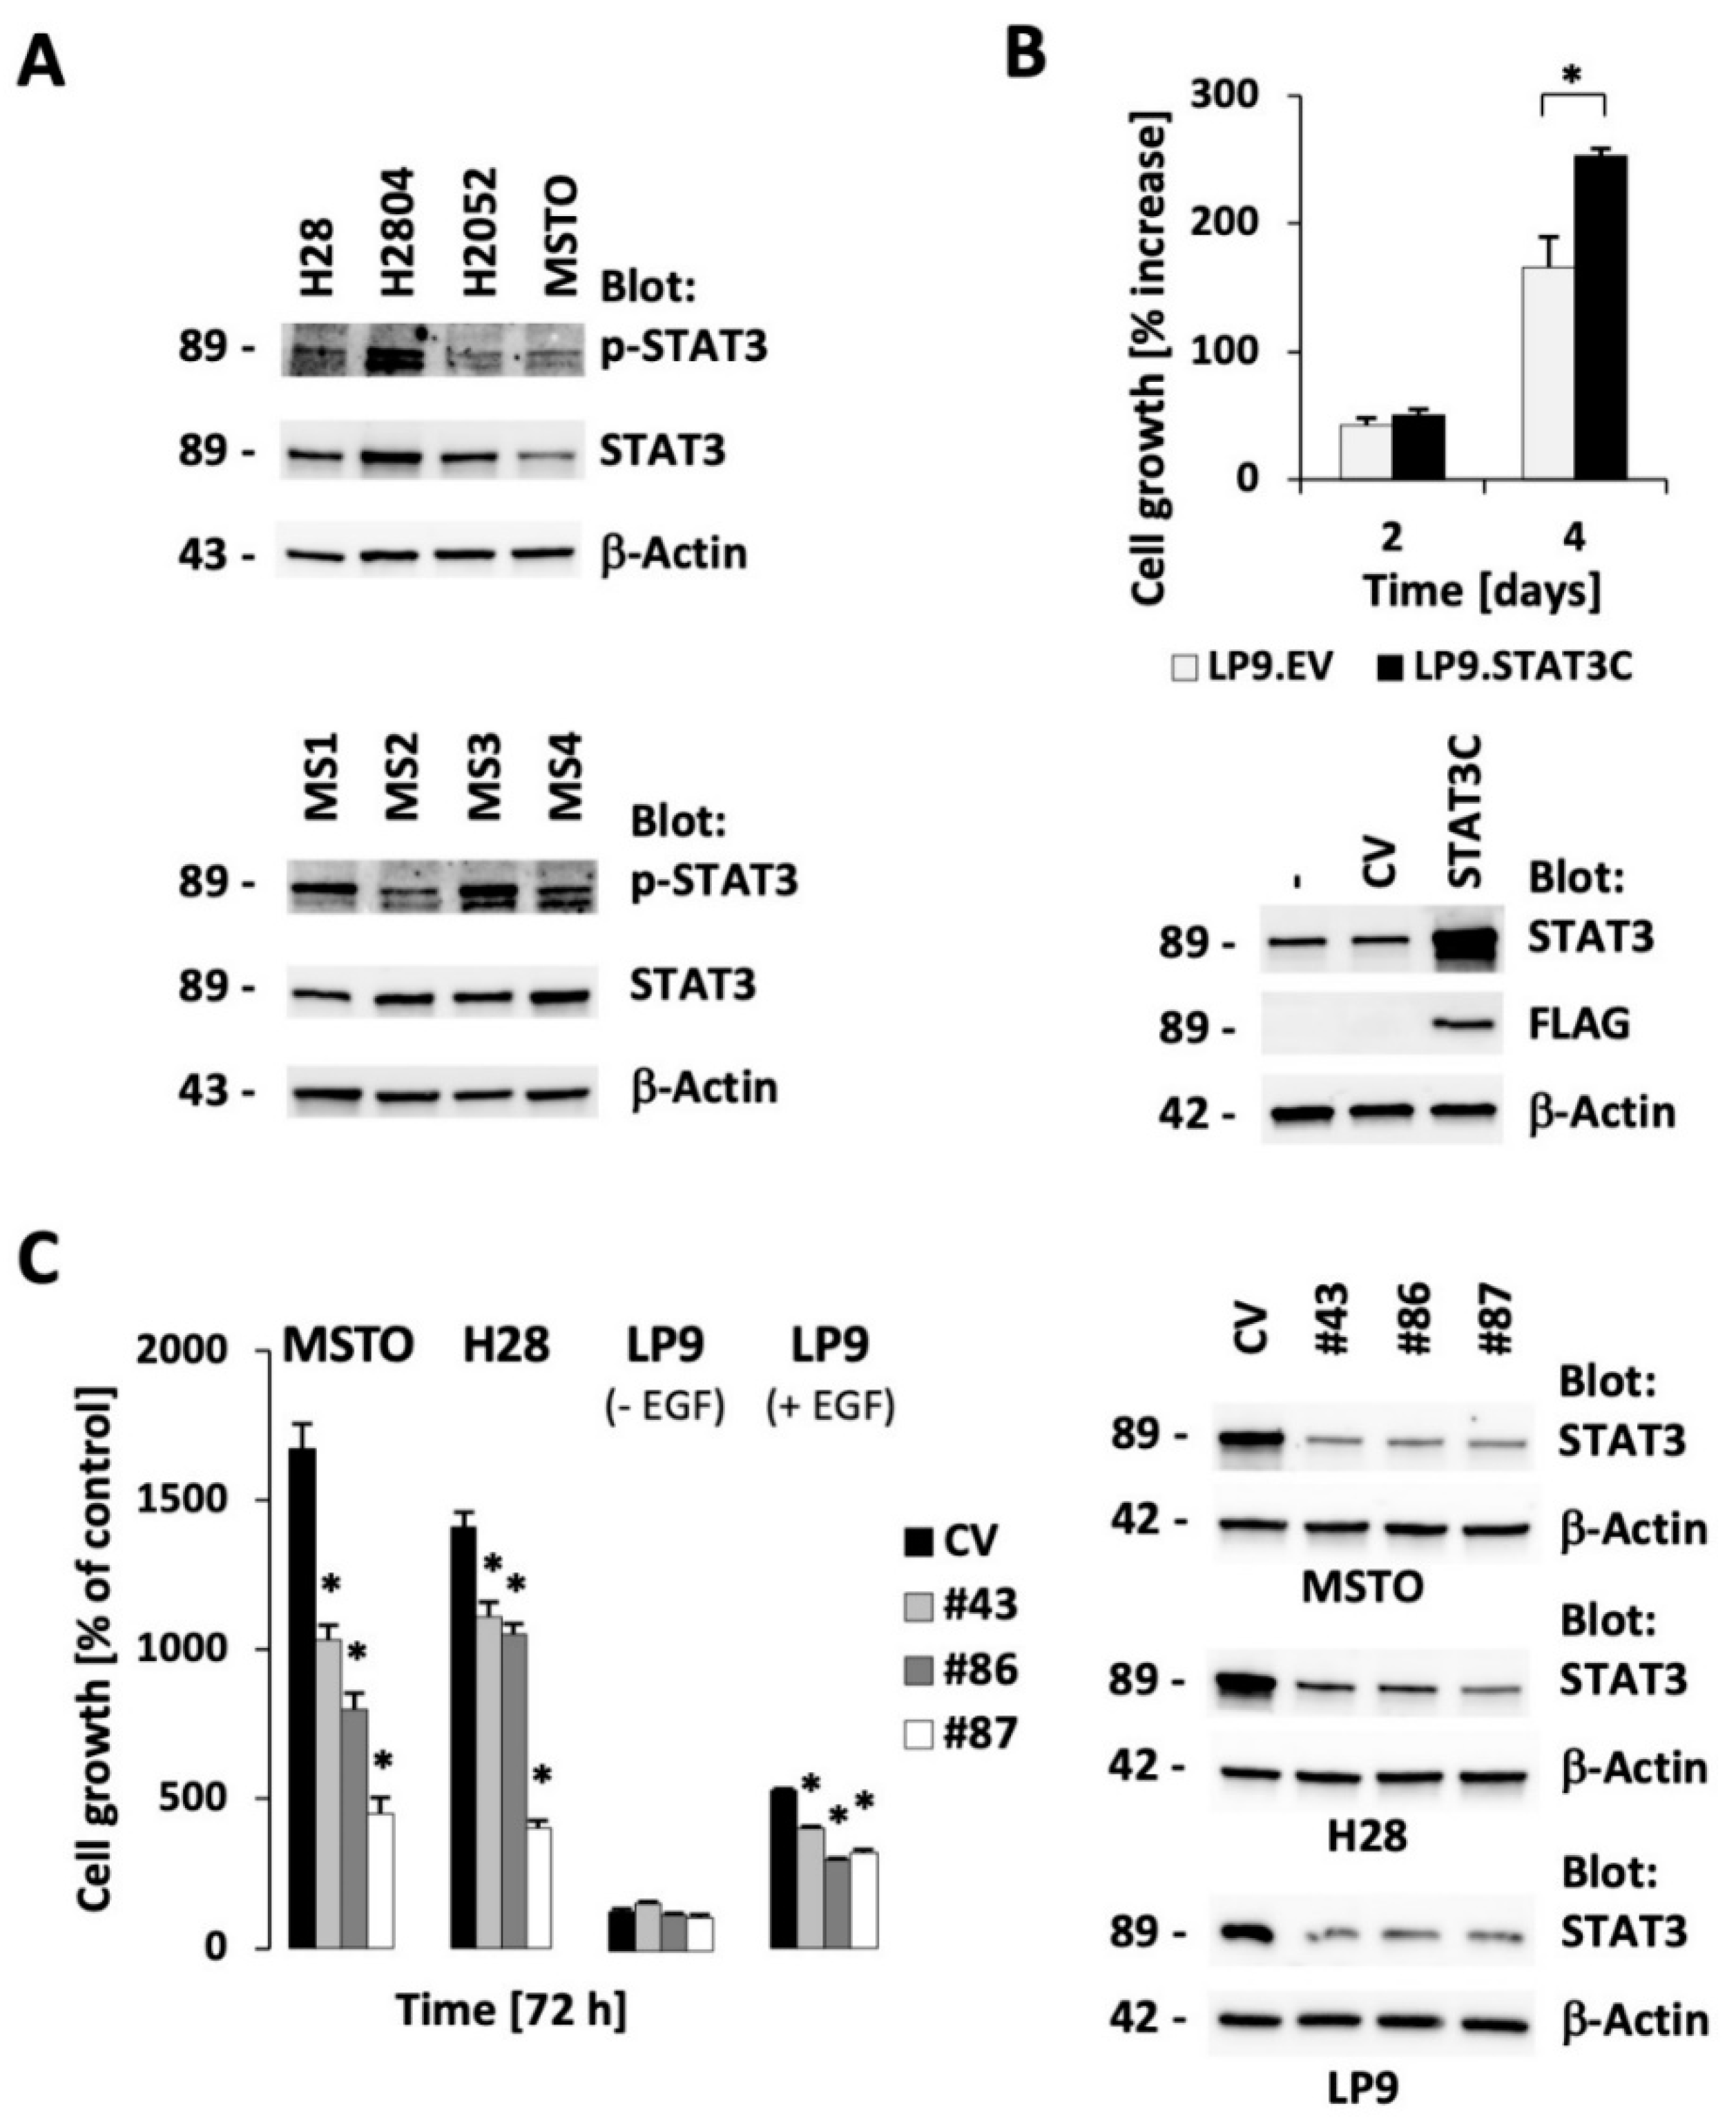
Abstract
Simple Summary
Abstract
1. Introduction
2. Results
2.1. STAT3 Expression is Essential for Optimal Cell Growth in Malignant Pleural Mesothelioma (MPM) Cell Lines
2.2. The Small Molecule Drugs Atovaquone and Pyrimethamine Inhibit Growth of MPM Cells
2.3. Atovaquone Inhibits Growth in Preclinical Models of MPM
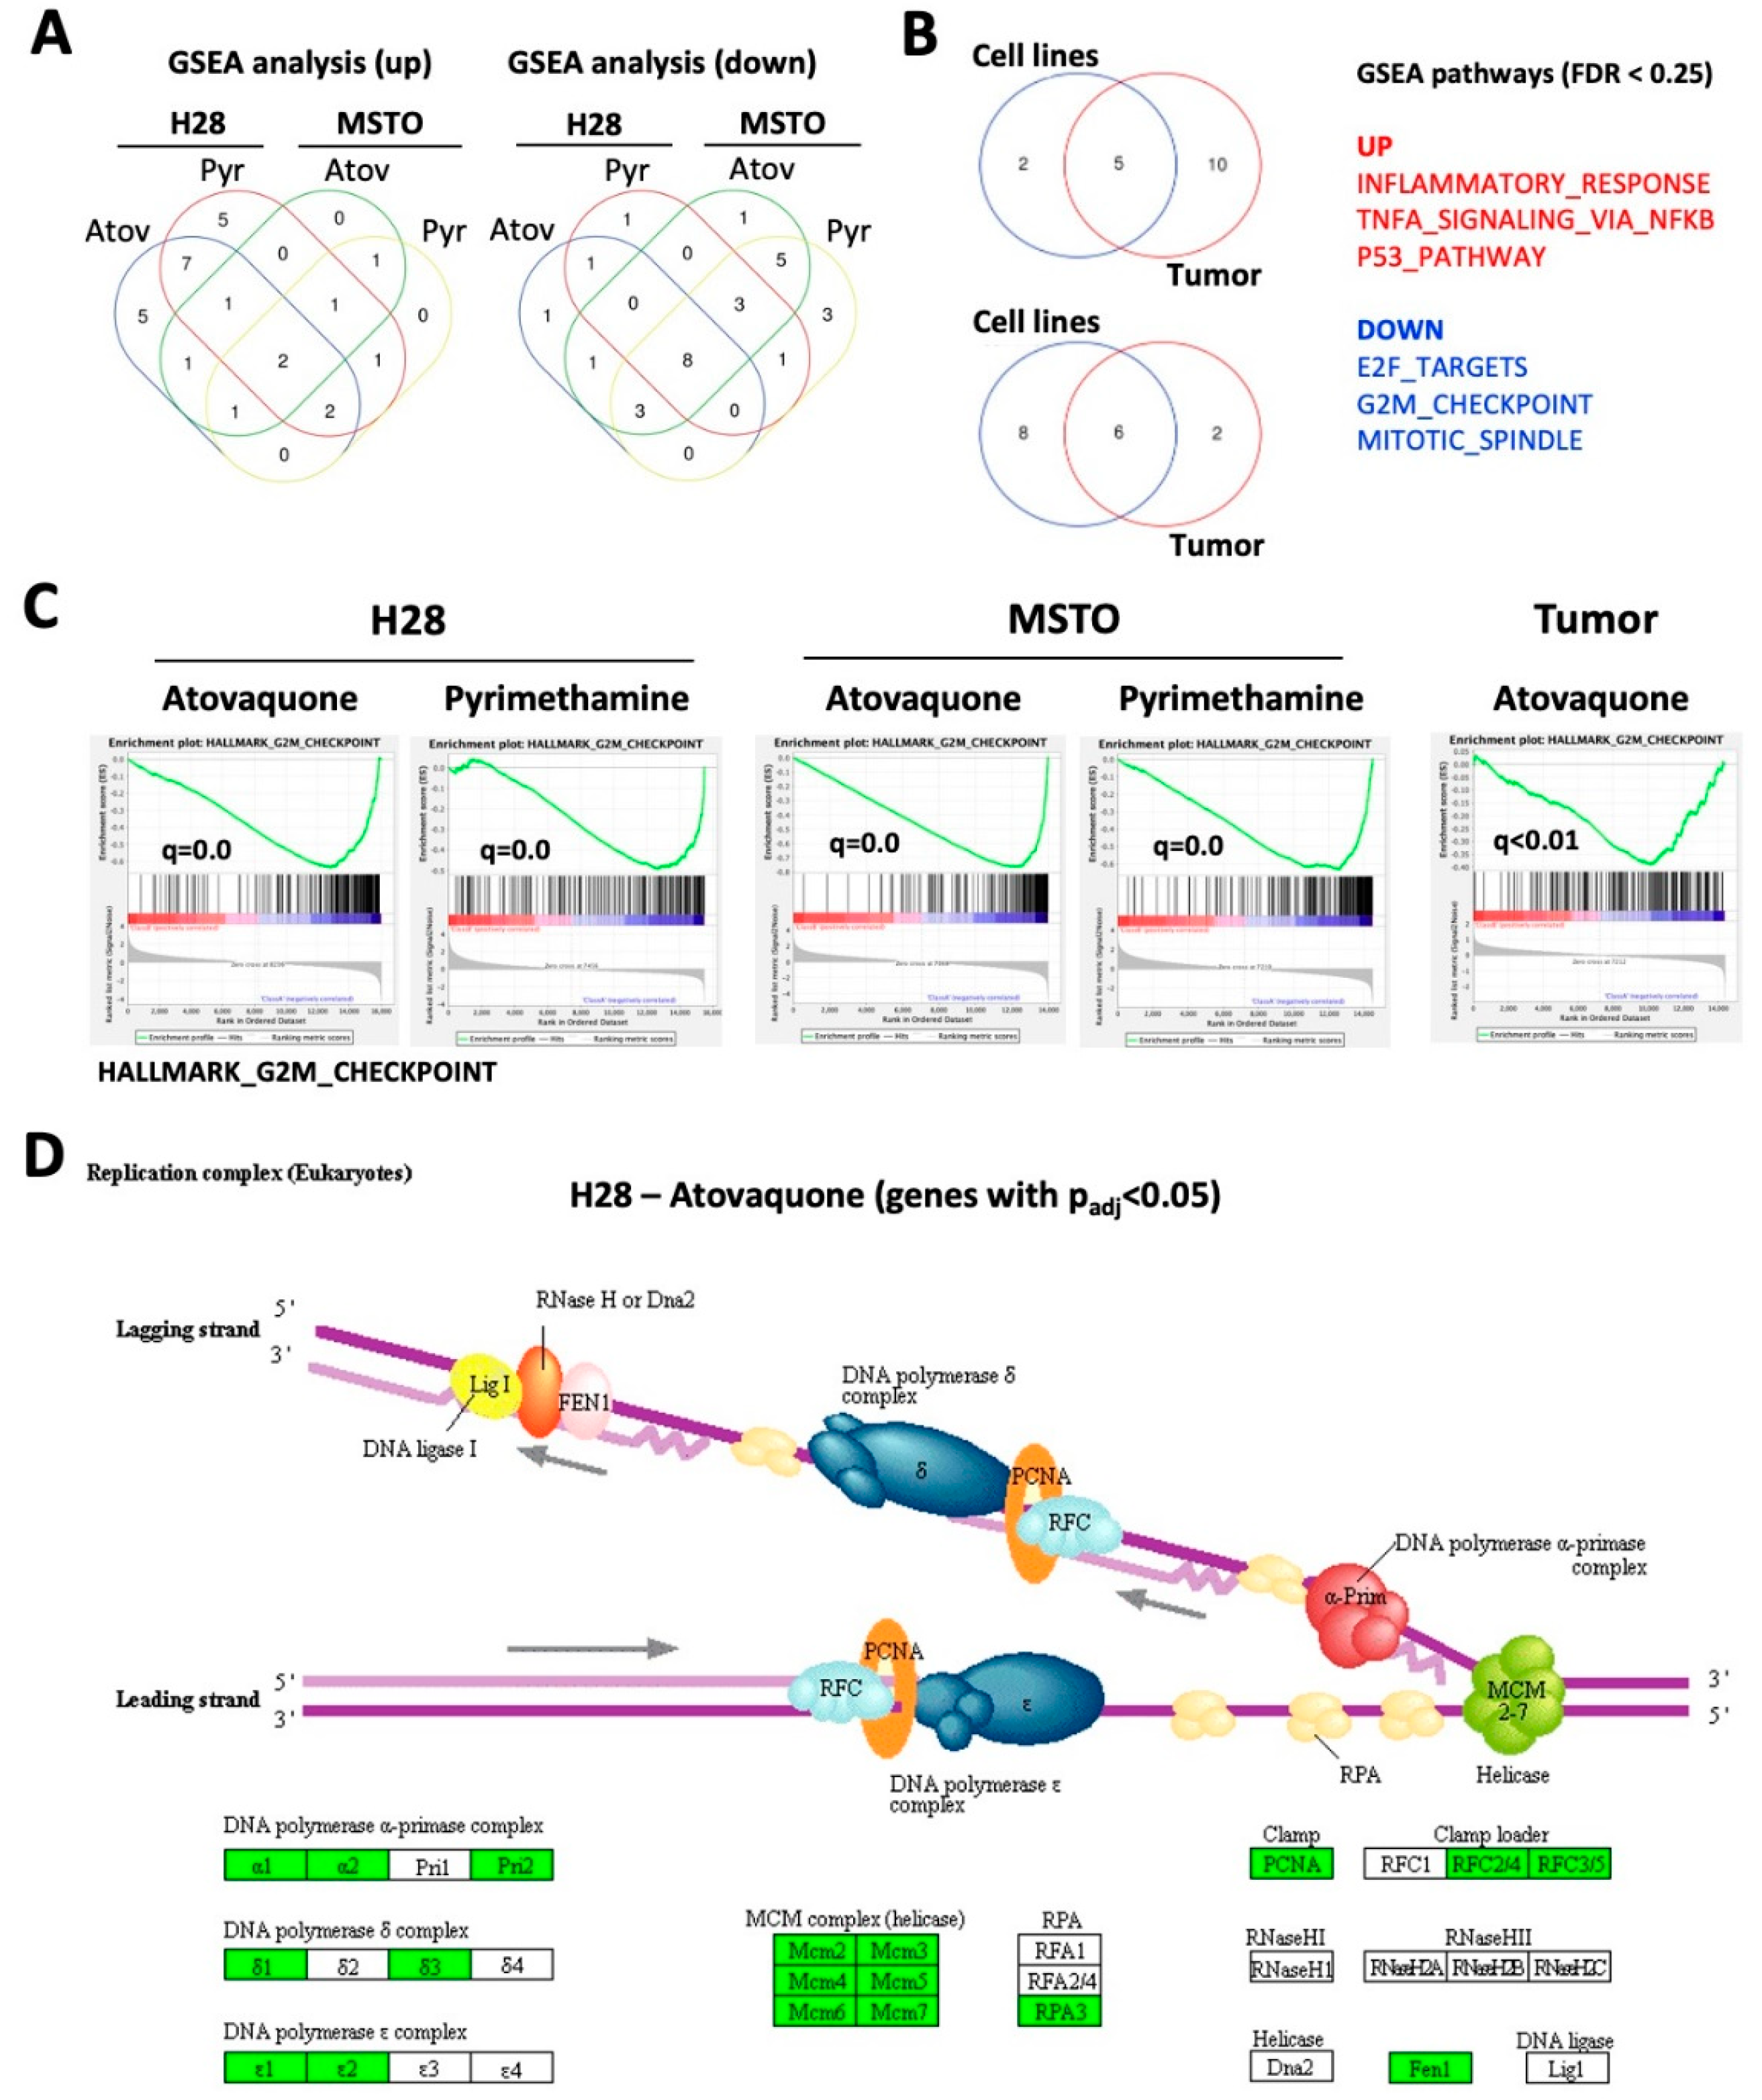
2.4. Atovaquone and Pyrimethamine Target Genes in Cell Growth Pathways
2.5. Induction of Immune Response Genes by Atovaquone and Pyrimethamine in MPM Cells
3. Discussion
4. Materials and Methods
4.1. Isolation of Primary MPM Cells
4.2. MPM Spheroid Culture in Microfluidic Chambers
4.3. Xenograft Mouse Models
5. Conclusions
Supplementary Materials
Author Contributions
Funding
Acknowledgments
Conflicts of Interest
Abbreviations
| MPM | Malignant Pleural Mesothelioma |
| STAT3 | Signal Transducer and Activator of Transcription 3 |
| ICOSLG | Inducible T-Cell Costimulator Ligand |
| NF-κB | Nuclear Factor Kappa-Light-Chain-Enhancer of Activated B Cells |
| EPHA2 | Ephrin Type-A Receptor 2 |
| NOD/SCID | Nonobese Diabetic/Severe Combined Immunodeficiency |
| GSEA | Gene Set Enrichment Analysis |
| EV/CV | Empty Vector/Control Vector |
References
- Liou, D.Z.; Berry, M.F. Diagnosis and management of mesothelioma. AME Med. J. 2018, 3, 99. [Google Scholar] [CrossRef]
- Gordon, G.J.; Dong, L.; Yeap, B.Y.; Richards, W.G.; Glickman, J.N.; Edenfield, H.; Mani, M.; Colquitt, R.; Maulik, G.; Van Oss, B.; et al. Four-gene expression ratio test for survival in patients undergoing surgery for mesothelioma. J. Natl. Cancer Inst. 2009, 101, 678–686. [Google Scholar] [CrossRef] [PubMed]
- Cantini, L.; Hassan, R.; Sterman, D.H.; Aerts, J. Emerging Treatments for Malignant Pleural Mesothelioma: Where Are We Heading? Front. Oncol. 2020, 10, 343. [Google Scholar] [CrossRef] [PubMed]
- Galoczova, M.; Coates, P.; Vojtesek, B. STAT3, stem cells, cancer stem cells and p63. Cell Mol. Biol. Lett. 2018, 23, 12. [Google Scholar] [CrossRef]
- Roca Suarez, A.A.; Van Renne, N.; Baumert, T.F.; Lupberger, J. Viral manipulation of STAT3: Evade, exploit, and injure. PLoS Pathog. 2018, 14, e1006839. [Google Scholar] [CrossRef]
- Pencik, J.; Pham, H.T.; Schmoellerl, J.; Javaheri, T.; Schlederer, M.; Culig, Z.; Merkel, O.; Moriggl, R.; Grebien, F.; Kenner, L. JAK-STAT signaling in cancer: From cytokines to non-coding genome. Cytokine 2016, 87, 26–36. [Google Scholar] [CrossRef]
- Achcar Rde, O.; Cagle, P.T.; Jagirdar, J. Expression of activated and latent signal transducer and activator of transcription 3 in 303 non-small cell lung carcinomas and 44 malignant mesotheliomas: Possible role for chemotherapeutic intervention. Arch Pathol. Lab. Med. 2007, 131, 1350–1360. [Google Scholar] [CrossRef]
- Canino, C.; Luo, Y.; Marcato, P.; Blandino, G.; Pass, H.I.; Cioce, M. A STAT3-NFkB/DDIT3/CEBPbeta axis modulates ALDH1A3 expression in chemoresistant cell subpopulations. Oncotarget 2015, 6, 12637–12653. [Google Scholar] [CrossRef]
- Dabir, S.; Kluge, A.; Kresak, A.; Yang, M.; Fu, P.; Groner, B.; Wildey, G.; Dowlati, A. Low PIAS3 expression in malignant mesothelioma is associated with increased STAT3 activation and poor patient survival. Clin. Cancer Res. 2014, 20, 5124–5132. [Google Scholar] [CrossRef]
- Bueno, R.; Stawiski, E.W.; Goldstein, L.D.; Durinck, S.; De Rienzo, A.; Modrusan, Z.; Gnad, F.; Nguyen, T.T.; Jaiswal, B.S.; Chirieac, L.R.; et al. Comprehensive genomic analysis of malignant pleural mesothelioma identifies recurrent mutations, gene fusions and splicing alterations. Nat. Genet. 2016, 48, 407–416. [Google Scholar] [CrossRef]
- Hmeljak, J.; Sanchez-Vega, F.; Hoadley, K.A.; Shih, J.; Stewart, C.; Heiman, D.; Tarpey, P.; Danilova, L.; Drill, E.; Gibb, E.A.; et al. Integrative Molecular Characterization of Malignant Pleural Mesothelioma. Cancer Discov. 2018, 8, 1548–1565. [Google Scholar] [CrossRef] [PubMed]
- Tan, Y.C.; Srivastava, S.; Won, B.M.; Kanteti, R.; Arif, Q.; Husain, A.N.; Li, H.; Vigneswaran, W.T.; Pang, K.M.; Kulkarni, P.; et al. EPHA2 mutations with oncogenic characteristics in squamous cell lung cancer and malignant pleural mesothelioma. Oncogenesis 2019, 8, 49. [Google Scholar] [CrossRef] [PubMed]
- Xiang, M.; Kim, H.; Ho, V.T.; Walker, S.R.; Bar-Natan, M.; Anahtar, M.; Liu, S.; Toniolo, P.A.; Kroll, Y.; Jones, N.; et al. Gene expression-based discovery of atovaquone as a STAT3 inhibitor and anticancer agent. Blood 2016, 128, 1845–1853. [Google Scholar] [CrossRef] [PubMed]
- Takakura, A.; Nelson, E.A.; Haque, N.; Humphreys, B.D.; Zandi-Nejad, K.; Frank, D.A.; Zhou, J. Pyrimethamine inhibits adult polycystic kidney disease by modulating STAT signaling pathways. Hum. Mol. Genet. 2011, 20, 4143–4154. [Google Scholar] [CrossRef]
- Khan, M.W.; Saadalla, A.; Ewida, A.H.; Al-Katranji, K.; Al-Saoudi, G.; Giaccone, Z.T.; Gounari, F.; Zhang, M.; Frank, D.A.; Khazaie, K. The STAT3 inhibitor pyrimethamine displays anti-cancer and immune stimulatory effects in murine models of breast cancer. Cancer Immunol. Immunother. 2018, 67, 13–23. [Google Scholar] [CrossRef]
- Doglioni, C.; Dei Tos, A.P.; Laurino, L.; Iuzzolino, P.; Chiarelli, C.; Celio, M.R.; Viale, G. Calretinin: A novel immunocytochemical marker for mesothelioma. Am. J. Surg. Pathol. 1996, 20, 1037–1046. [Google Scholar] [CrossRef]
- Gotzos, V.; Vogt, P.; Celio, M.R. The calcium binding protein calretinin is a selective marker for malignant pleural mesotheliomas of the epithelial type. Pathol. Res. Pract. 1996, 192, 137–147. [Google Scholar] [CrossRef]
- Kawamura, K.; Hiroshima, K.; Suzuki, T.; Chai, K.; Yamaguchi, N.; Shingyoji, M.; Yusa, T.; Tada, Y.; Takiguchi, Y.; Tatsumi, K.; et al. CD90 is a diagnostic marker to differentiate between malignant pleural mesothelioma and lung carcinoma with immunohistochemistry. Am. J. Clin. Pathol. 2013, 140, 544–549. [Google Scholar] [CrossRef]
- Abdul Rahim, S.N.; Ho, G.Y.; Coward, J.I. The role of interleukin-6 in malignant mesothelioma. Transl. Lung Cancer Res. 2015, 4, 55–66. [Google Scholar] [CrossRef]
- Vogelzang, N.J.; Rusthoven, J.J.; Symanowski, J.; Denham, C.; Kaukel, E.; Ruffie, P.; Gatzemeier, U.; Boyer, M.; Emri, S.; Manegold, C.; et al. Phase III study of pemetrexed in combination with cisplatin versus cisplatin alone in patients with malignant pleural mesothelioma. J. Clin. Oncol. 2003, 21, 2636–2644. [Google Scholar] [CrossRef]
- Nelson, E.A.; Walker, S.R.; Kepich, A.; Gashin, L.B.; Hideshima, T.; Ikeda, H.; Chauhan, D.; Anderson, K.C.; Frank, D.A. Nifuroxazide inhibits survival of multiple myeloma cells by directly inhibiting STAT3. Blood 2008, 112, 5095–5102. [Google Scholar] [CrossRef] [PubMed]
- Baggish, A.L.; Hill, D.R. Antiparasitic agent atovaquone. Antimicrob. Agents Chemother. 2002, 46, 1163–1173. [Google Scholar] [CrossRef] [PubMed]
- Jacobson, J.M.; Davidian, M.; Rainey, P.M.; Hafner, R.; Raasch, R.H.; Luft, B.J. Pyrimethamine pharmacokinetics in human immunodeficiency virus-positive patients seropositive for Toxoplasma gondii. Antimicrob. Agents Chemother. 1996, 40, 1360–1365. [Google Scholar] [CrossRef] [PubMed]
- Harada, A.; Sekido, N.; Akahoshi, T.; Wada, T.; Mukaida, N.; Matsushima, K. Essential involvement of interleukin-8 (IL-8) in acute inflammation. J. Leukoc. Biol. 1994, 56, 559–564. [Google Scholar] [CrossRef]
- Marinelli, O.; Nabissi, M.; Morelli, M.B.; Torquati, L.; Amantini, C.; Santoni, G. ICOS-L as a Potential Therapeutic Target for Cancer Immunotherapy. Curr. Protein Pept. Sci. 2018, 19, 1107–1113. [Google Scholar] [CrossRef]
- Epling-Burnette, P.K.; Liu, J.H.; Catlett-Falcone, R.; Turkson, J.; Oshiro, M.; Kothapalli, R.; Li, Y.; Wang, J.M.; Yang-Yen, H.F.; Karras, J.; et al. Inhibition of STAT3 signaling leads to apoptosis of leukemic large granular lymphocytes and decreased Mcl-1 expression. J. Clin. Investig. 2001, 107, 351–362. [Google Scholar] [CrossRef]
- Gritsko, T.; Williams, A.; Turkson, J.; Kaneko, S.; Bowman, T.; Huang, M.; Nam, S.; Eweis, I.; Diaz, N.; Sullivan, D.; et al. Persistent activation of stat3 signaling induces survivin gene expression and confers resistance to apoptosis in human breast cancer cells. Clin. Cancer Res. 2006, 12, 11–19. [Google Scholar] [CrossRef]
- Yu, H.; Pardoll, D.; Jove, R. STATs in cancer inflammation and immunity: A leading role for STAT3. Nat. Rev. Cancer 2009, 9, 798–809. [Google Scholar] [CrossRef]
- Heppler, L.N.; Frank, D.A. Targeting Oncogenic Transcription Factors: Therapeutic Implications of Endogenous STAT Inhibitors. Trends Cancer 2017, 3, 816–827. [Google Scholar] [CrossRef]
- Guanizo, A.C.; Fernando, C.D.; Garama, D.J.; Gough, D.J. STAT3: A multifaceted oncoprotein. Growth Factors 2018, 36, 1–14. [Google Scholar] [CrossRef]
- Aref, A.R.; Campisi, M.; Ivanova, E.; Portell, A.; Larios, D.; Piel, B.P.; Mathur, N.; Zhou, C.; Coakley, R.V.; Bartels, A.; et al. 3D microfluidic ex vivo culture of organotypic tumor spheroids to model immune checkpoint blockade. Lab. Chip. 2018, 18, 3129–3143. [Google Scholar] [CrossRef] [PubMed]
- Schulz-Heddergott, R.; Stark, N.; Edmunds, S.J.; Li, J.; Conradi, L.C.; Bohnenberger, H.; Ceteci, F.; Greten, F.R.; Dobbelstein, M.; Moll, U.M. Therapeutic Ablation of Gain-of-Function Mutant p53 in Colorectal Cancer Inhibits Stat3-Mediated Tumor Growth and Invasion. Cancer Cell 2018, 34, 298–314 e297. [Google Scholar] [CrossRef] [PubMed]
- Hernandez-Monge, J.; Rousset-Roman, A.B.; Medina-Medina, I.; Olivares-Illana, V. Dual function of MDM2 and MDMX toward the tumor suppressors p53 and RB. Genes Cancer 2016, 7, 278–287. [Google Scholar] [CrossRef] [PubMed][Green Version]
- McFarland, B.C.; Gray, G.K.; Nozell, S.E.; Hong, S.W.; Benveniste, E.N. Activation of the NF-kappaB pathway by the STAT3 inhibitor JSI-124 in human glioblastoma cells. Mol. Cancer Res. 2013, 11, 494–505. [Google Scholar] [CrossRef] [PubMed]
- Hanahan, D.; Weinberg, R.A. Hallmarks of cancer: The next generation. Cell 2011, 144, 646–674. [Google Scholar] [CrossRef]
- Alfaro, C.; Sanmamed, M.F.; Rodriguez-Ruiz, M.E.; Teijeira, A.; Onate, C.; Gonzalez, A.; Ponz, M.; Schalper, K.A.; Perez-Gracia, J.L.; Melero, I. Interleukin-8 in cancer pathogenesis, treatment and follow-up. Cancer Treat Rev. 2017, 60, 24–31. [Google Scholar] [CrossRef]
- Galffy, G.; Mohammed, K.A.; Nasreen, N.; Ward, M.J.; Antony, V.B. Inhibition of interleukin-8 reduces human malignant pleural mesothelioma propagation in nude mouse model. Oncol. Res. 1999, 11, 187–194. [Google Scholar]
- Feijoo, E.; Alfaro, C.; Mazzolini, G.; Serra, P.; Penuelas, I.; Arina, A.; Huarte, E.; Tirapu, I.; Palencia, B.; Murillo, O.; et al. Dendritic cells delivered inside human carcinomas are sequestered by interleukin-8. Int. J. Cancer 2005, 116, 275–281. [Google Scholar] [CrossRef]
- Fu, T.; He, Q.; Sharma, P. The ICOS/ICOSL pathway is required for optimal antitumor responses mediated by anti-CTLA-4 therapy. Cancer Res. 2011, 71, 5445–5454. [Google Scholar] [CrossRef]
- Jenkins, R.W.; Aref, A.R.; Lizotte, P.H.; Ivanova, E.; Stinson, S.; Zhou, C.W.; Bowden, M.; Deng, J.; Liu, H.; Miao, D.; et al. Ex Vivo Profiling of PD-1 Blockade Using Organotypic Tumor Spheroids. Cancer Discov. 2018, 8, 196–215. [Google Scholar] [CrossRef]


Publisher’s Note: MDPI stays neutral with regard to jurisdictional claims in published maps and institutional affiliations. |
© 2020 by the authors. Licensee MDPI, Basel, Switzerland. This article is an open access article distributed under the terms and conditions of the Creative Commons Attribution (CC BY) license (http://creativecommons.org/licenses/by/4.0/).
Share and Cite
Lapidot, M.; Case, A.E.; Larios, D.; Gandler, H.I.; Meng, C.; Tošić, I.; Weisberg, E.L.; Poitras, M.J.; Gokhale, P.C.; Paweletz, C.P.; et al. Inhibitors of the Transcription Factor STAT3 Decrease Growth and Induce Immune Response Genes in Models of Malignant Pleural Mesothelioma (MPM). Cancers 2021, 13, 7. https://doi.org/10.3390/cancers13010007
Lapidot M, Case AE, Larios D, Gandler HI, Meng C, Tošić I, Weisberg EL, Poitras MJ, Gokhale PC, Paweletz CP, et al. Inhibitors of the Transcription Factor STAT3 Decrease Growth and Induce Immune Response Genes in Models of Malignant Pleural Mesothelioma (MPM). Cancers. 2021; 13(1):7. https://doi.org/10.3390/cancers13010007
Chicago/Turabian StyleLapidot, Moshe, Abigail E. Case, Dalia Larios, Helen I. Gandler, Chengcheng Meng, Isidora Tošić, Ellen L. Weisberg, Michael J. Poitras, Prafulla C. Gokhale, Cloud P. Paweletz, and et al. 2021. "Inhibitors of the Transcription Factor STAT3 Decrease Growth and Induce Immune Response Genes in Models of Malignant Pleural Mesothelioma (MPM)" Cancers 13, no. 1: 7. https://doi.org/10.3390/cancers13010007
APA StyleLapidot, M., Case, A. E., Larios, D., Gandler, H. I., Meng, C., Tošić, I., Weisberg, E. L., Poitras, M. J., Gokhale, P. C., Paweletz, C. P., Podar, K., Salgia, R., Saladi, S. V., Griffin, J. D., Frank, D. A., Bueno, R., & Sattler, M. (2021). Inhibitors of the Transcription Factor STAT3 Decrease Growth and Induce Immune Response Genes in Models of Malignant Pleural Mesothelioma (MPM). Cancers, 13(1), 7. https://doi.org/10.3390/cancers13010007