Omics Analysis of Educated Platelets in Cancer and Benign Disease of the Pancreas

 ,
,  , ,
, ,  , ,
, ,  ,
,  ,
, 
Abstract
:Simple Summary
Abstract
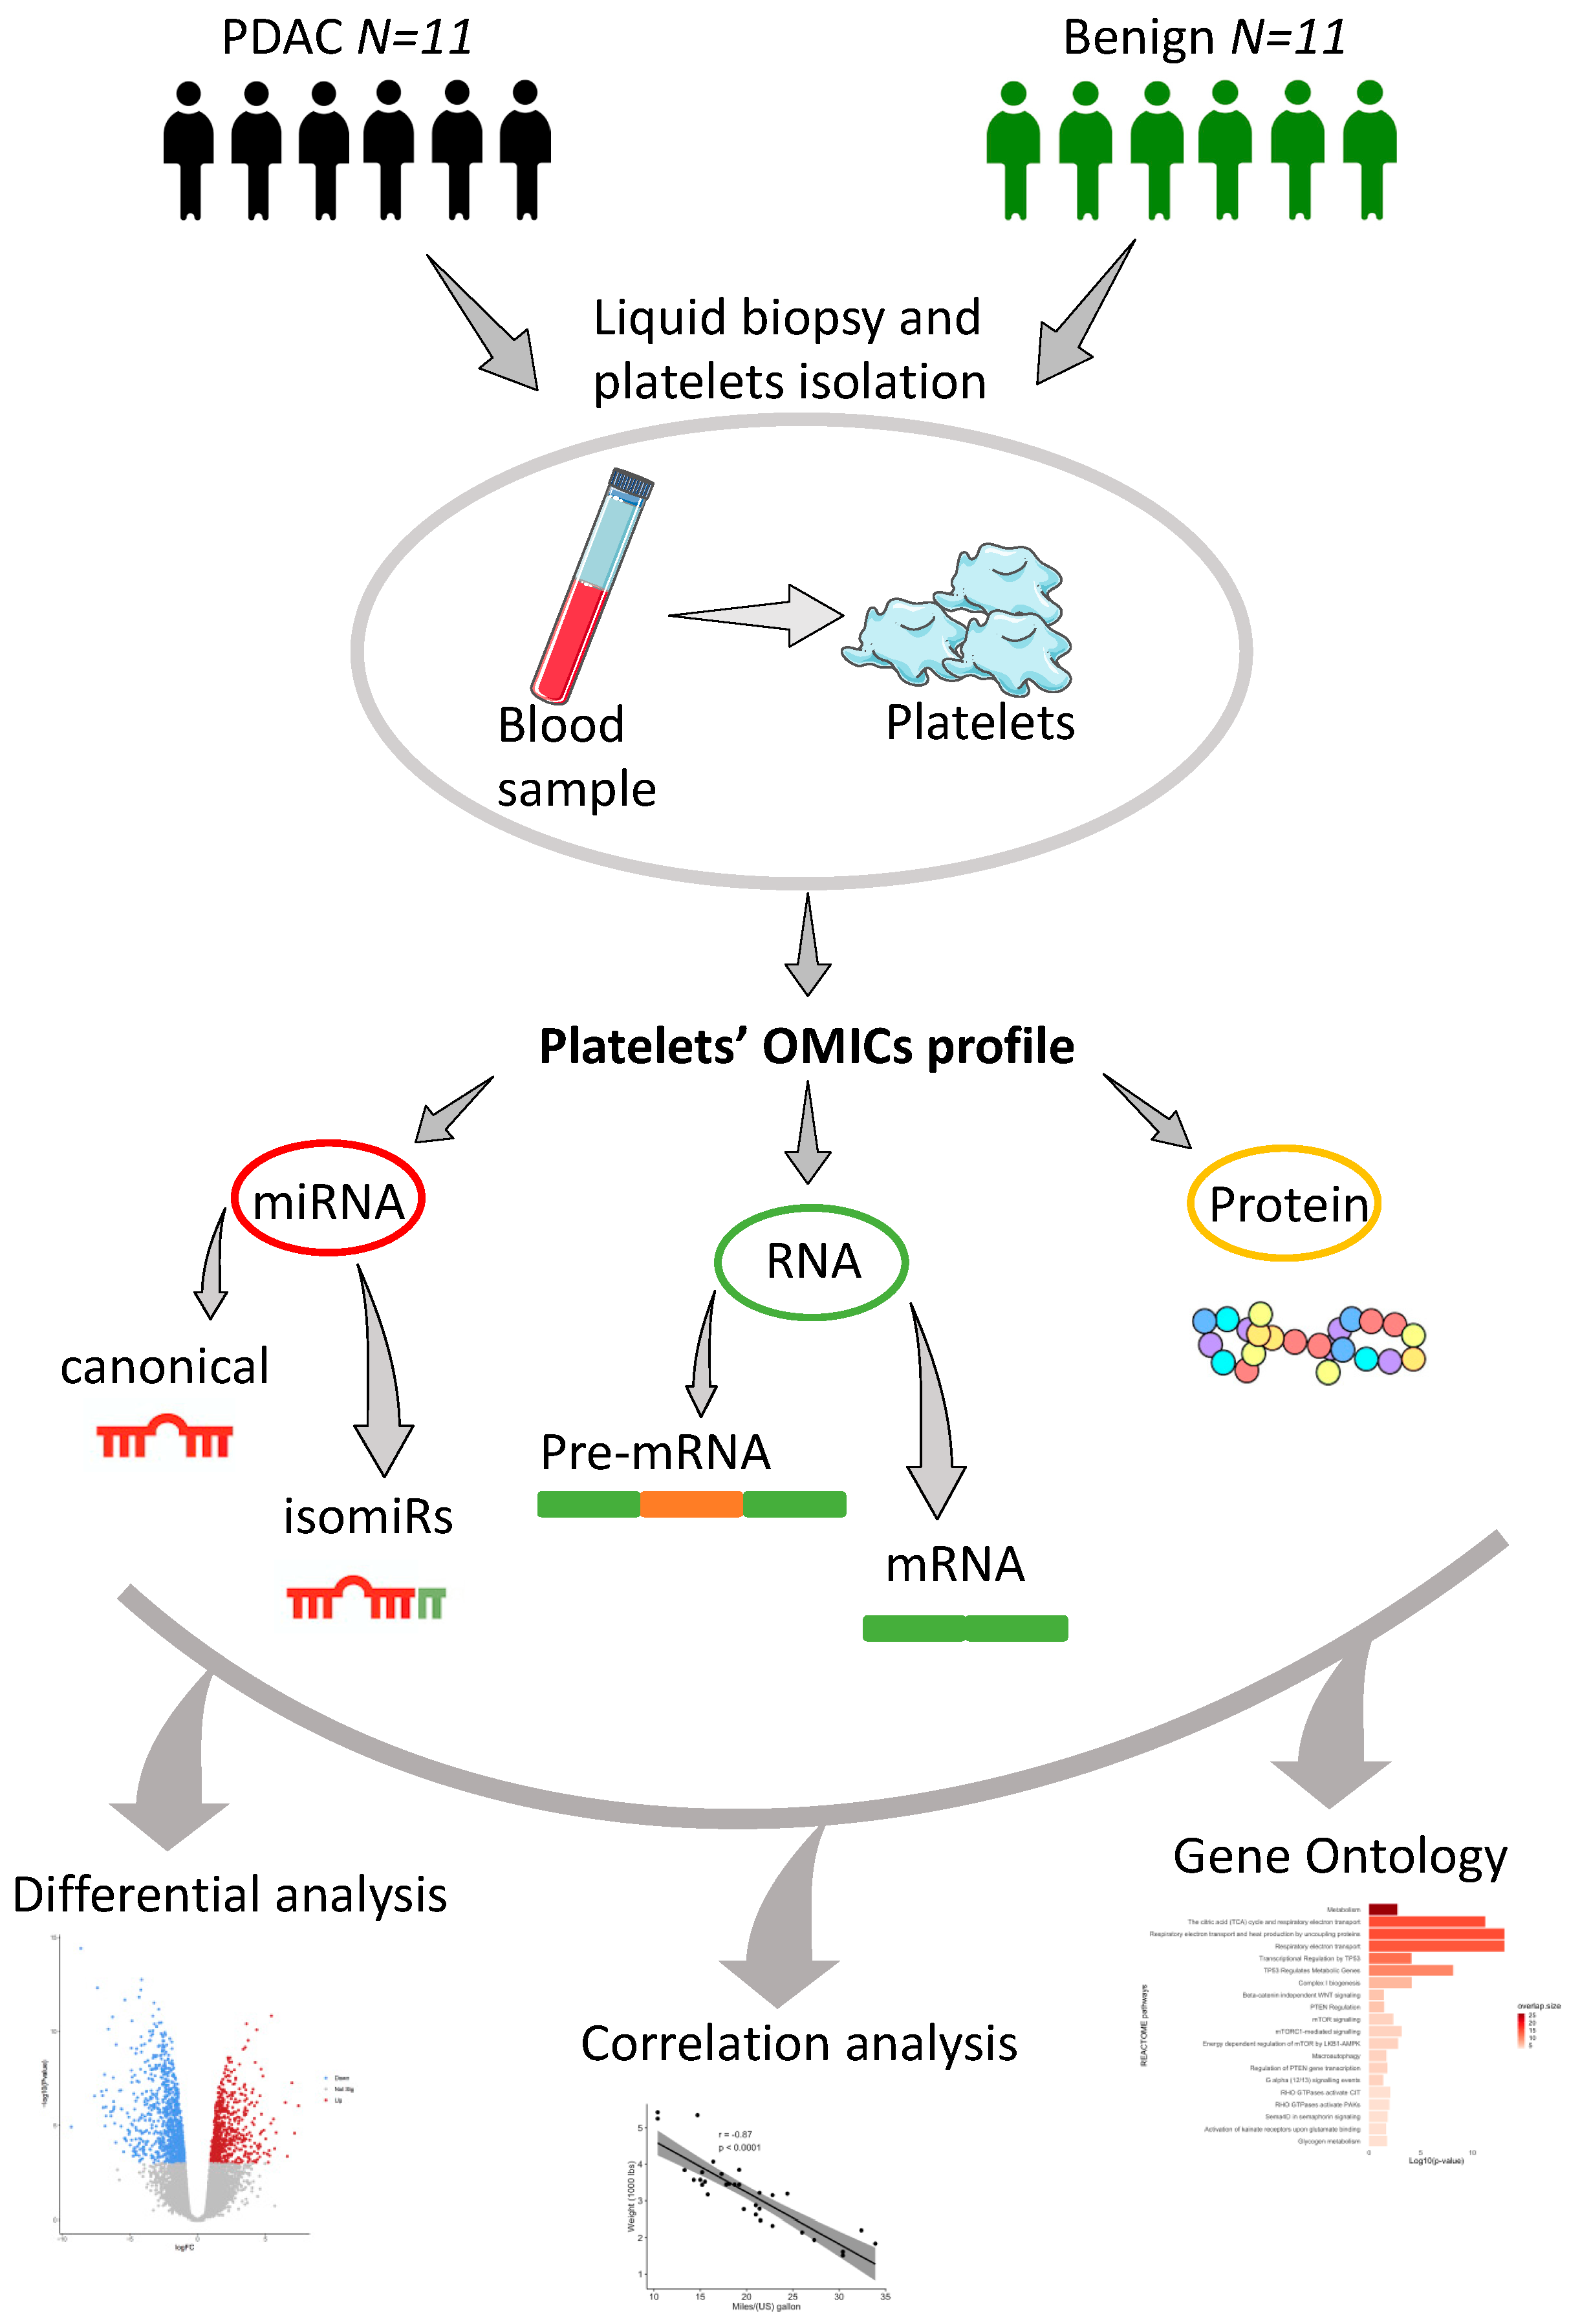
1. Introduction
2. Results
2.1. Differential Analysis
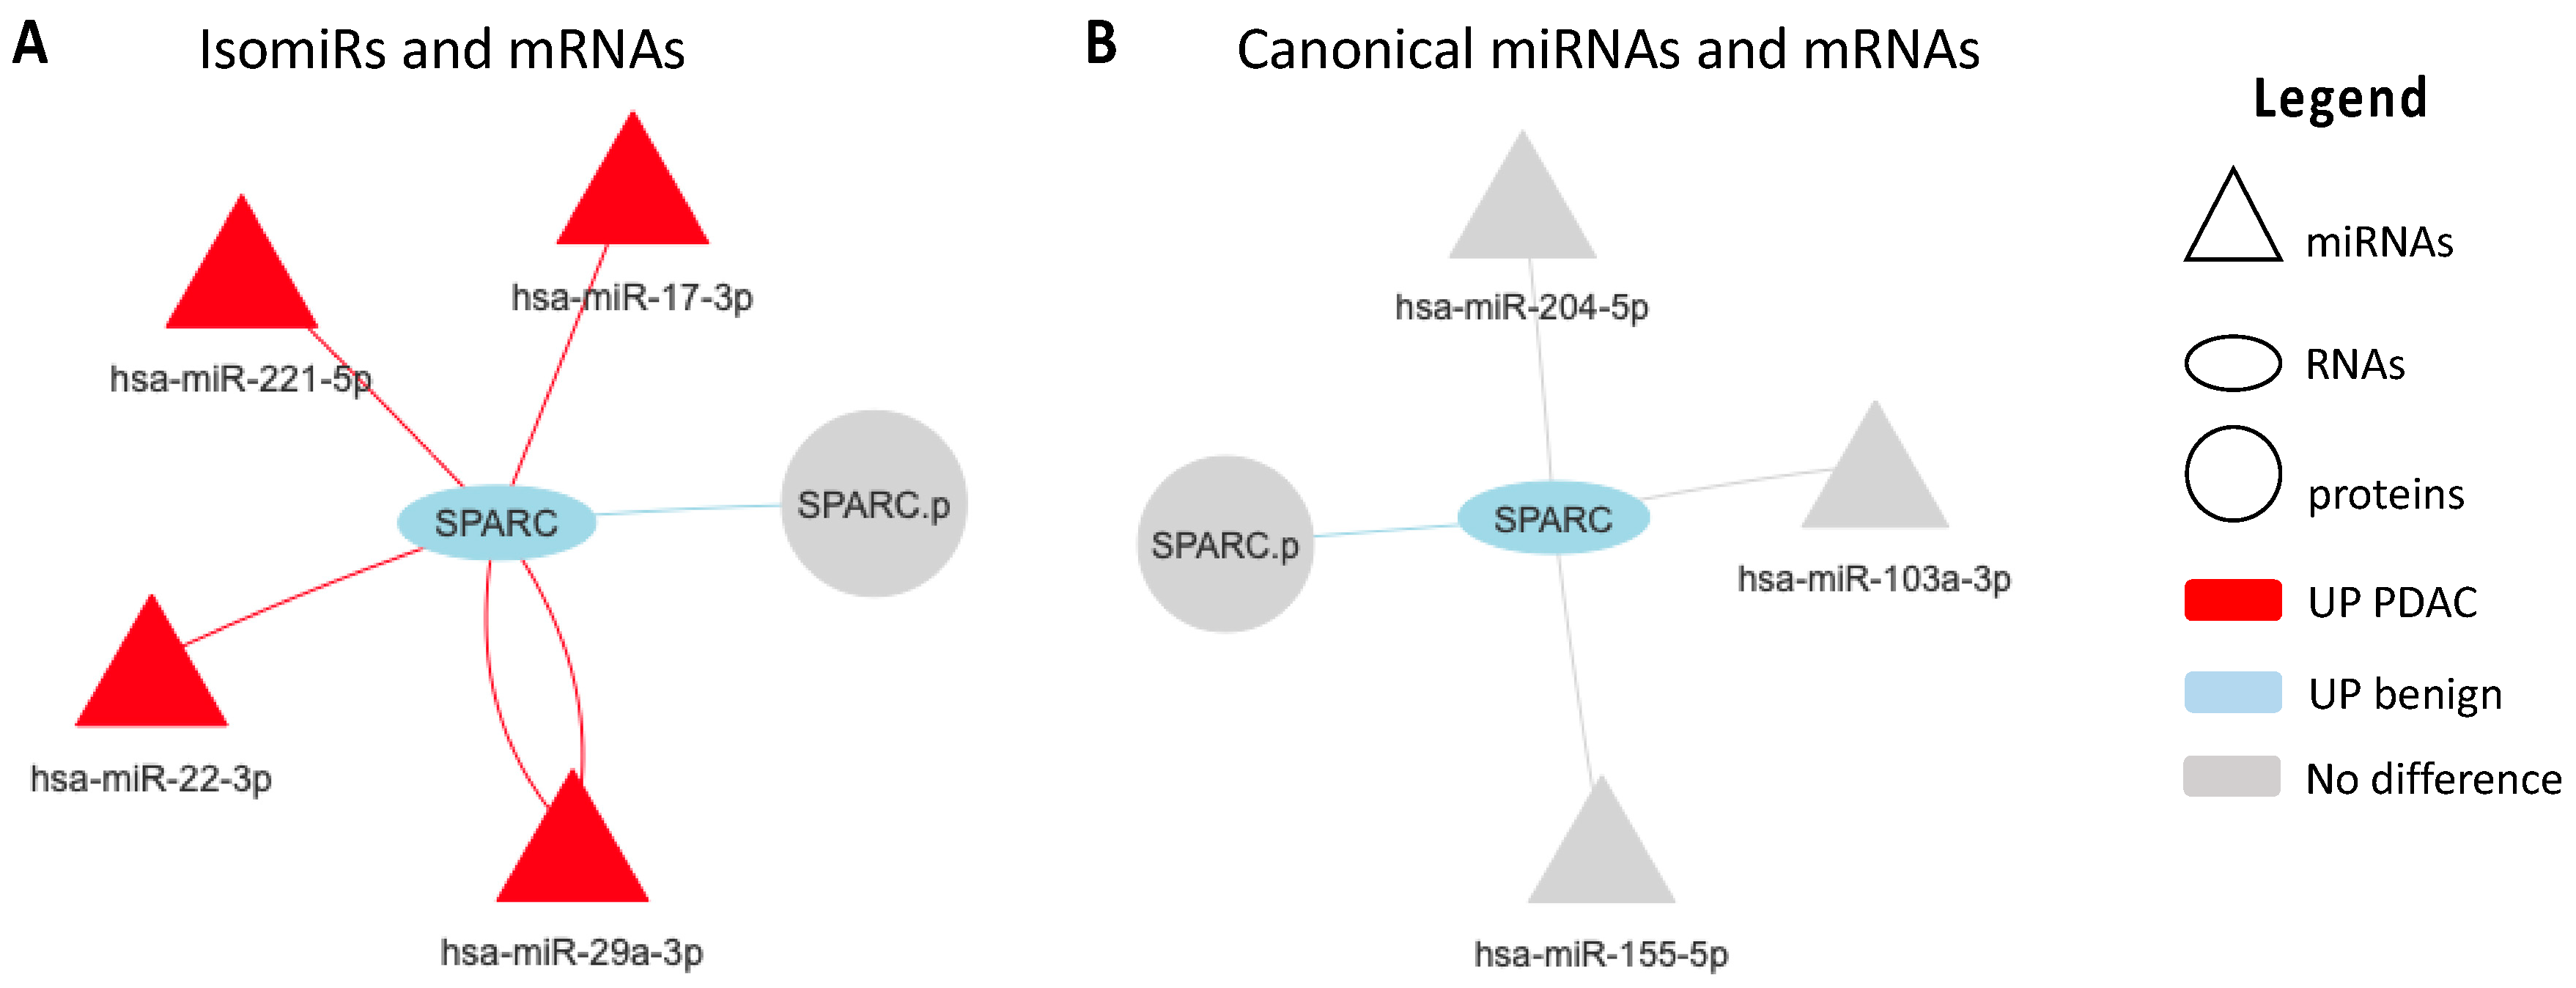
2.2. Regulatory Networks
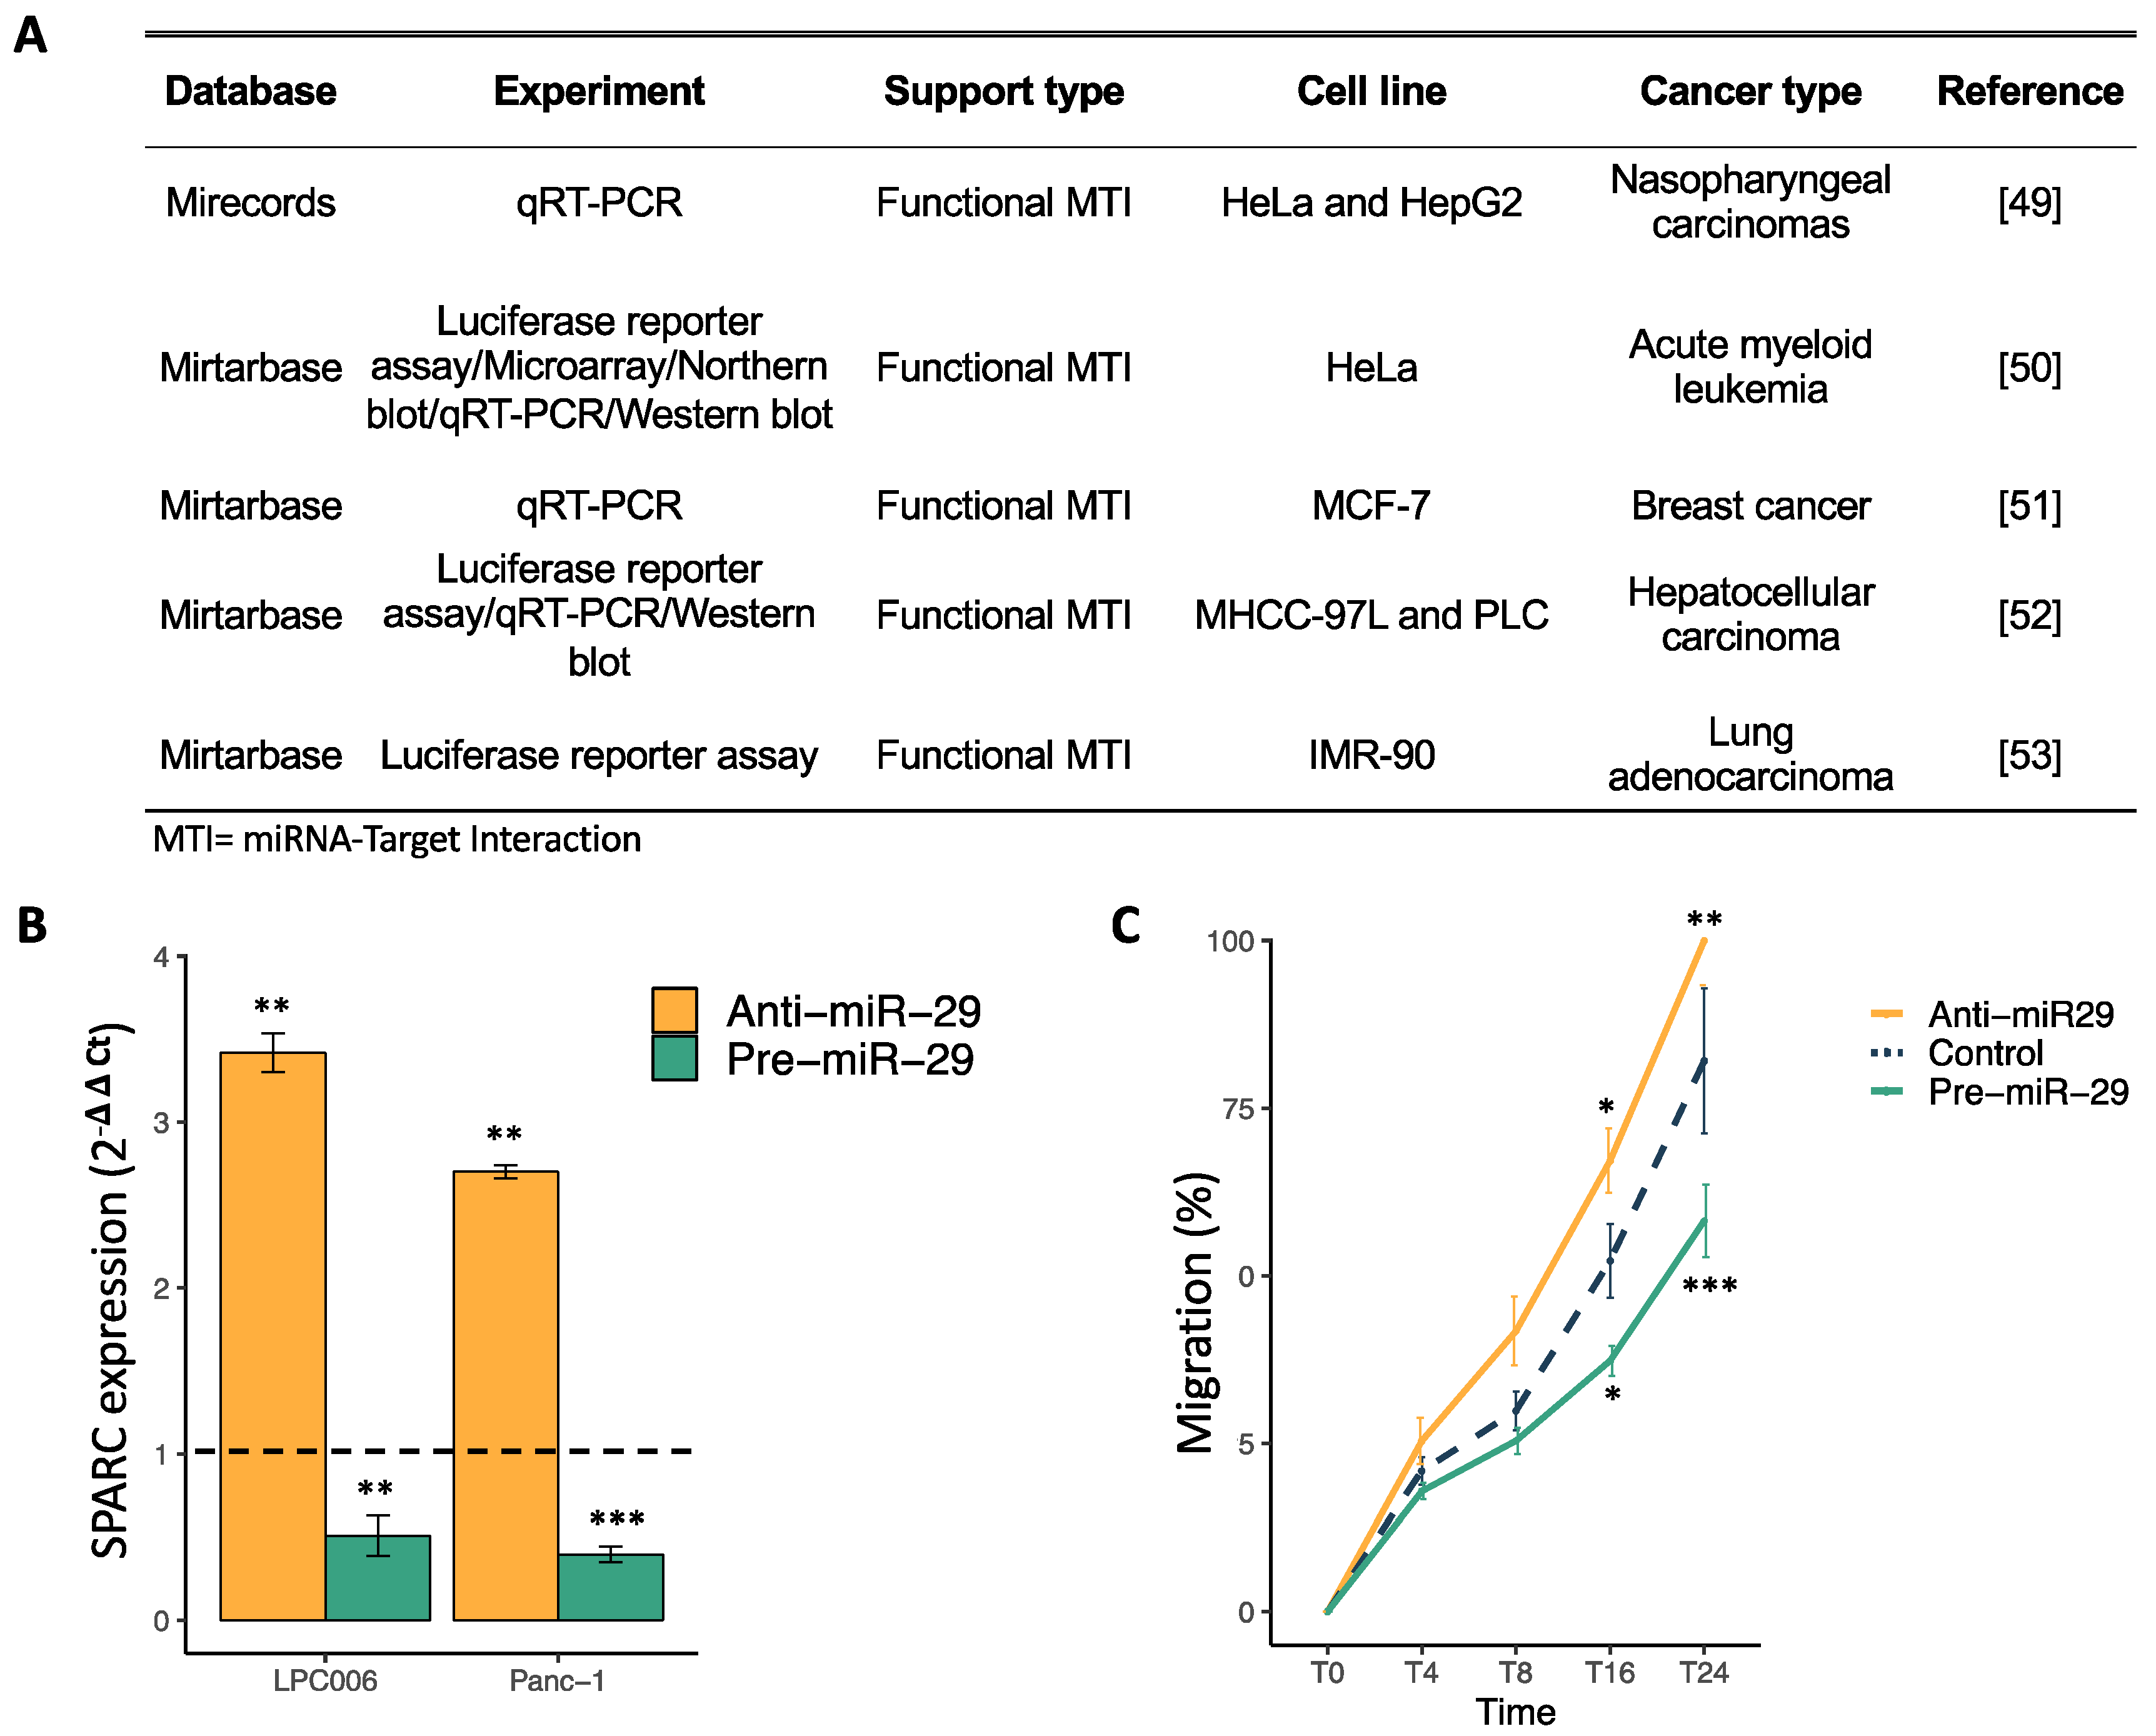
2.3. SPARC Is a Direct Target of miR-29a-3p and Its Modulation Affect Cell Migration
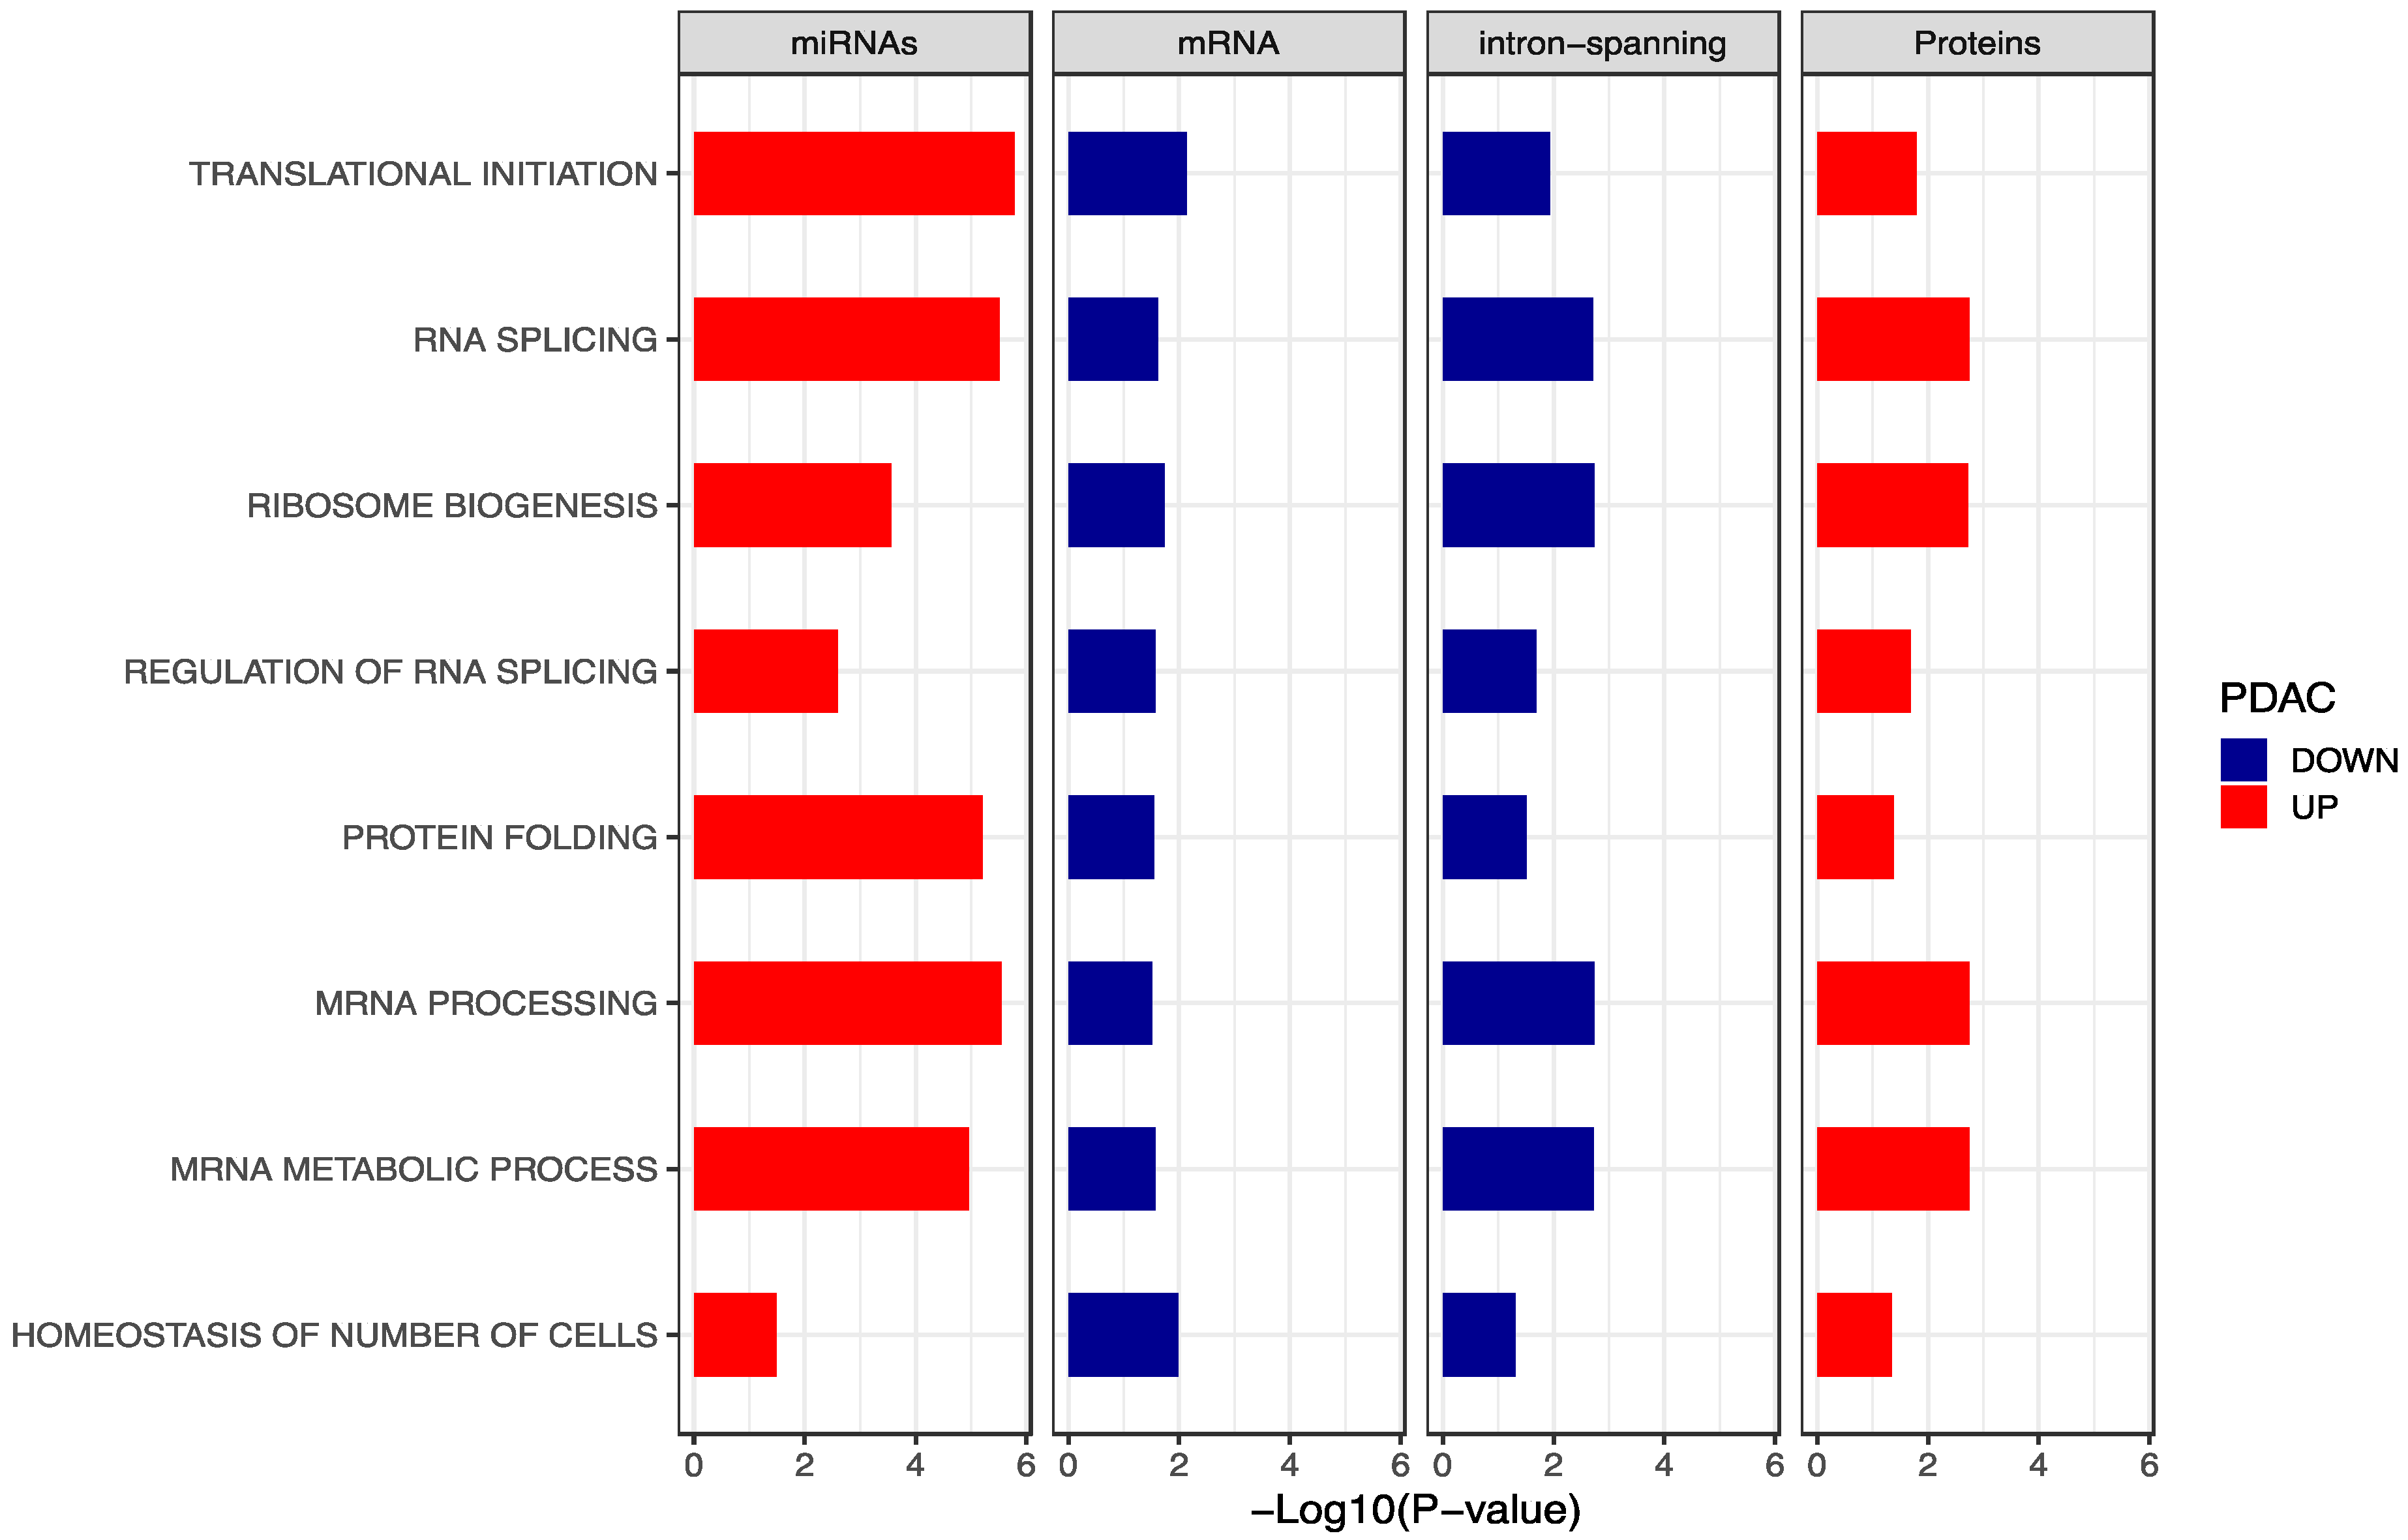
2.4. Integration of Gene Set Enrichment Analyses
2.5. Different Isomirs Profile in PDAC and Benign Platelets of Patient
3. Discussion
4. Materials and Methods
4.1. Patients and Samples Collection
4.2. Isolation of RNA and Protein for miRNAs, mRNAs and Protein Profiling
4.2.1. RNA-Seq Library Preparation
4.2.2. miRNA-Seq Library Preparation
4.2.3. Protein Extraction and MS/MS Sample Preparation
4.3. Downstream Analysis of miRNAs, mRNAs and Protein Profiles
4.3.1. Intron-RNA Processing Data
4.3.2. mRNA Processing Data
4.3.3. miRNA Processing Data
4.3.4. Protein Processing Data
4.4. Differential Expression Analysis
4.5. Correlation Analysis
4.6. Cell Culture and Transfection
4.7. Quantitative Real-Time PCR (RT-qPCR)
4.8. Migration Assay
4.9. Functional Pathways Enrichment
5. Conclusions
Supplementary Materials
Author Contributions
Funding
Institutional Review Board Statement
Informed Consent Statement
Data Availability Statement
Acknowledgments
Conflicts of Interest
Abbreviations
| lv3p | length variant in 3′ |
| lv5p | length variant in 5′ |
| nta#A | non-templated addition of base A |
| nta#T | non-templated addition of base T |
| nta#C | non-templated addition of base C |
| nta#G | non-templated addition of base G |
| exactNucVar | exact nucleotide variant |
| mv | multiple variant |
| mlv3p | multiple length variant in 3′ |
| mlv5p | multiple length variant in 5′ |
References
- McGuigan, A.; Kelly, P.; Turkington, R.C.; Jones, C.; Coleman, H.G.; McCain, R.S. Pancreatic cancer: A review of clinical diagnosis, epidemiology, treatment and outcomes. World J. Gastroenterol. 2018, 24, 4846–4861. [Google Scholar] [CrossRef]
- Ryan, D.P.; Hong, T.S.; Bardeesy, N. Pancreatic adenocarcinoma. N. Engl. J. Med. 2014, 371, 1039–1049. [Google Scholar] [CrossRef]
- Giovannetti, E.; van der Borden, C.L.; Frampton, A.E.; Ali, A.; Firuzi, O.; Peters, G.J. Never let it go: Stopping key mechanisms underlying metastasis to fight pancreatic cancer. Semin. Cancer Biol. 2017, 44, 43–59. [Google Scholar] [CrossRef]
- Rickles, F.R.; Falanga, A. Activation of clotting factors in cancer. In Coagulation in Cancer; Kwaan, H.C., Green, D., Eds.; Springer: Boston, MA, USA, 2009; Volume 148, pp. 31–41. ISBN 978-0-387-79961-2. [Google Scholar]
- Ho-Tin-Noe, B.; Goerge, T.; Wagner, D.D. Platelets: Guardians of tumor vasculature. Cancer Res. 2009, 69, 5623–5626. [Google Scholar] [CrossRef] [Green Version]
- Mandalà, M.; Reni, M.; Cascinu, S.; Barni, S.; Floriani, I.; Cereda, S.; Berardi, R.; Mosconi, S.; Torri, V.; Labianca, R. Venous thromboembolism predicts poor prognosis in irresectable pancreatic cancer patients. Ann. Oncol. 2007, 18, 1660–1665. [Google Scholar] [CrossRef]
- Ishigaki, K.; Nakai, Y.; Isayama, H.; Saito, K.; Hamada, T.; Takahara, N.; Mizuno, S.; Mohri, D.; Kogure, H.; Matsubara, S.; et al. Thromboembolisms in advanced pancreatic cancer: A retrospective analysis of 475 patients. Pancreas 2017, 46, 1069–1075. [Google Scholar] [CrossRef]
- Ansari, D.; Ansari, D.; Andersson, R.; Andrén-Sandberg, Å. Pancreatic cancer and thromboembolic disease, 150 years after trousseau. Hepatobiliary Surg. Nutr. 2015, 4, 325–335. [Google Scholar] [CrossRef]
- Sabrkhany, S.; Kuijpers, M.J.E.; Verheul, H.M.W.; Griffioen, A.W.; Egbrink, M.G.A.O. Platelets: An unexploited data source in biomarker research. Lancet Haematol. 2015, 2, e512–e513. [Google Scholar] [CrossRef]
- Plantureux, L.; Crescence, L.; Dignat-George, F.; Panicot-Dubois, L.; Dubois, C. Effects of platelets on cancer progression. Thromb. Res. 2018, 164, S40–S47. [Google Scholar] [CrossRef]
- Nilsson, R.J.A.; Balaj, L.; Hulleman, E.; van Rijn, S.; Pegtel, D.M.; Walraven, M.; Widmark, A.; Gerritsen, W.R.; Verheul, H.M.; Vandertop, W.P.; et al. Blood platelets contain tumor-derived RNA biomarkers. Blood 2011, 118, 3680–3683. [Google Scholar] [CrossRef]
- Best, M.G.; Vancura, A.; Wurdinger, T. Platelet RNA as a circulating biomarker trove for cancer diagnostics. J. Thromb. Haemost. 2017, 15, 1295–1306. [Google Scholar] [CrossRef] [PubMed] [Green Version]
- Franco, A.T.; Corken, A.; Ware, J. Platelets at the interface of thrombosis, inflammation, and cancer. Blood 2015, 126, 582–588. [Google Scholar] [CrossRef] [PubMed] [Green Version]
- Newman, P.J.; Gorski, J.; White, G.C.; Gidwitz, S.; Cretney, C.J.; Aster, R.H. Enzymatic amplification of platelet-specific messenger RNA using the polymerase chain reaction. J. Clin. Investig. 1988, 82, 739–743. [Google Scholar] [CrossRef] [PubMed]
- Gnatenko, D.V.; Dunn, J.J.; Schwedes, J.; Bahou, W.F. Transcript profiling of human platelets using microarray and serial analysis of gene expression (SAGE). In DNA and RNA Profiling in Human Blood; Bugert, P., Ed.; Humana Press: Totowa, NJ, USA, 2009; Volume 496, pp. 245–272. ISBN 978-1-934115-93-0. [Google Scholar]
- Nassa, G.; Giurato, G.; Cimmino, G.; Rizzo, F.; Ravo, M.; Salvati, A.; Nyman, T.A.; Zhu, Y.; Vesterlund, M.; Lehtiö, J.; et al. Splicing of platelet resident pre-MRNAs upon activation by physiological stimuli results in functionally relevant proteome modifications. Sci. Rep. 2018, 8. [Google Scholar] [CrossRef]
- Sabrkhany, S.; Griffioen, A.W.; oude Egbrink, M.G.A. The role of blood platelets in tumor angiogenesis. Biochim. Biophys. Acta BBA Rev. Cancer 2011, 1815, 189–196. [Google Scholar] [CrossRef] [Green Version]
- In ‘t Veld, S.G.J.G.; Wurdinger, T. Tumor-educated platelets. Blood 2019, 133, 2359–2364. [Google Scholar] [CrossRef]
- Best, M.G.; Sol, N.; Kooi, I.; Tannous, J.; Westerman, B.A.; Rustenburg, F.; Schellen, P.; Verschueren, H.; Post, E.; Koster, J.; et al. RNA-Seq of tumor-educated platelets enables blood-based pan-cancer, multiclass, and molecular pathway cancer diagnostics. Cancer Cell 2015, 28, 666–676. [Google Scholar] [CrossRef] [Green Version]
- Huang, G.; Yuan, M.; Chen, M.; Li, L.; You, W.; Li, H.; Cai, J.J.; Ji, G. Integrating multiple fitting regression and bayes decision for cancer diagnosis with transcriptomic data from tumor-educated blood platelets. Analyst 2017, 142, 3588–3597. [Google Scholar] [CrossRef]
- Large, T.Y.S.L.; Veld, S.G.I.; Sol, N.; Best, M.G.; Mantini, G.; van der Lelij, E.; Rustenburg, F.; Verschueren, H.; Funel, N.; Garajova, I.; et al. Abstract 2596: Spliced messenger RNA of tumor-educated platelets yields a new diagnostic prospective for pancreatic cancer. In Proceedings of the Clinical Research (Excluding Clinical Trials), American Association for Cancer Research, Chicago, IL, USA, 1 July 2018; p. 2596. [Google Scholar]
- Weyrich, A.S.; Lindemann, S.; Tolley, N.D.; Kraiss, L.W.; Dixon, D.A.; Mahoney, T.M.; Prescott, S.P.; McIntyre, T.M.; Zimmerman, G.A. Change in protein phenotype without a nucleus: Translational control in platelets. Semin. Thromb. Hemost. 2004, 30, 491–498. [Google Scholar] [CrossRef]
- Denis, M.M.; Tolley, N.D.; Bunting, M.; Schwertz, H.; Jiang, H.; Lindemann, S.; Yost, C.C.; Rubner, F.J.; Albertine, K.H.; Swoboda, K.J.; et al. Escaping the nuclear confines: Signal-dependent Pre-MRNA splicing in anucleate platelets. Cell 2005, 122, 379–391. [Google Scholar] [CrossRef] [Green Version]
- Braunschweig, U.; Barbosa-Morais, N.L.; Pan, Q.; Nachman, E.N.; Alipanahi, B.; Gonatopoulos-Pournatzis, T.; Frey, B.; Irimia, M.; Blencowe, B.J. Widespread intron retention in mammals functionally tunes transcriptomes. Genome Res. 2014, 24, 1774–1786. [Google Scholar] [CrossRef] [PubMed]
- Sunderland, N.; Skroblin, P.; Barwari, T.; Huntley, R.P.; Lu, R.; Joshi, A.; Lovering, R.C.; Mayr, M. MicroRNA biomarkers and platelet reactivity: The clot thickens. Circ. Res. 2017, 120, 418–435. [Google Scholar] [CrossRef] [PubMed] [Green Version]
- Plé, H.; Landry, P.; Benham, A.; Coarfa, C.; Gunaratne, P.H.; Provost, P. The repertoire and features of human platelet MicroRNAs. PLoS ONE 2012, 7, e50746. [Google Scholar] [CrossRef] [PubMed]
- Edelstein, L.C.; Bray, P.F. Noncoding RNAs in platelet biology. In Platelets in Thrombotic and Non-Thrombotic Disorders; Gresele, P., Kleiman, N.S., Lopez, J.A., Page, C.P., Eds.; Springer International Publishing: Cham, Swizerland, 2017; pp. 239–252. ISBN 978-3-319-47460-1. [Google Scholar]
- Koppers-Lalic, D.; Hackenberg, M.; Bijnsdorp, I.V.; van Eijndhoven, M.A.J.; Sadek, P.; Sie, D.; Zini, N.; Middeldorp, J.M.; Ylstra, B.; de Menezes, R.X.; et al. Nontemplated nucleotide additions distinguish the small RNA composition in cells from exosomes. Cell Rep. 2014, 8, 1649–1658. [Google Scholar] [CrossRef] [Green Version]
- Koppers-Lalic, D.; Hackenberg, M.; de Menezes, R.; Misovic, B.; Wachalska, M.; Geldof, A.; Zini, N.; de Reijke, T.; Wurdinger, T.; Vis, A.; et al. Non-invasive prostate cancer detection by measuring MiRNA variants (IsomiRs) in urine extracellular vesicles. Oncotarget 2016, 7. [Google Scholar] [CrossRef] [Green Version]
- Masud Karim, S.M.; Liu, L.; Le, T.D.; Li, J. Identification of MiRNA-MRNA regulatory modules by exploring collective group relationships. BMC Genom. 2016, 17. [Google Scholar] [CrossRef] [Green Version]
- Bartel, D.P. MicroRNAs: Target recognition and regulatory functions. Cell 2009, 136, 215–233. [Google Scholar] [CrossRef] [Green Version]
- Agarwal, V.; Bell, G.W.; Nam, J.-W.; Bartel, D.P. Predicting effective MicroRNA target sites in mammalian MRNAs. eLife 2015, 4. [Google Scholar] [CrossRef]
- Eulalio, A.; Huntzinger, E.; Izaurralde, E. Getting to the root of MiRNA-mediated gene silencing. Cell 2008, 132, 9–14. [Google Scholar] [CrossRef] [Green Version]
- Fabian, M.R.; Sonenberg, N. The mechanics of MiRNA-mediated gene silencing: A look under the hood of MiRISC. Nat. Struct. Mol. Biol. 2012, 19, 586–593. [Google Scholar] [CrossRef]
- Pellegrino, L.; Stebbing, J.; Braga, V.M.; Frampton, A.E.; Jacob, J.; Buluwela, L.; Jiao, L.R.; Periyasamy, M.; Madsen, C.D.; Caley, M.P.; et al. MiR-23b Regulates cytoskeletal remodeling, motility and metastasis by directly targeting multiple transcripts. Nucleic Acids Res. 2013, 41, 5400–5412. [Google Scholar] [CrossRef] [PubMed]
- Seo, J.; Jin, D.; Choi, C.-H.; Lee, H. Integration of MicroRNA, MRNA, and protein expression data for the identification of cancer-related MicroRNAs. PLOS ONE 2017, 12, e0168412. [Google Scholar] [CrossRef] [PubMed] [Green Version]
- Best, M.G.; Veld, S.G.J.G.I.; Sol, N.; Wurdinger, T. RNA sequencing and swarm intelligence–Enhanced classification algorithm development for blood-based disease diagnostics using spliced blood platelet RNA. Nat. Protoc. 2019, 14, 1206–1234. [Google Scholar] [CrossRef] [PubMed]
- Tian, C.; Clauser, K.R.; Öhlund, D.; Rickelt, S.; Huang, Y.; Gupta, M.; Mani, D.R.; Carr, S.A.; Tuveson, D.A.; Hynes, R.O. Proteomic analyses of ECM during pancreatic ductal adenocarcinoma progression reveal different contributions by tumor and stromal cells. Proc. Natl. Acad. Sci. USA 2019, 116, 19609–19618. [Google Scholar] [CrossRef] [Green Version]
- Iozzo, R.V.; Sanderson, R.D. Proteoglycans in cancer biology, tumour microenvironment and angiogenesis. J. Cell. Mol. Med. 2011, 15, 1013–1031. [Google Scholar] [CrossRef]
- Jiang, N.; Dai, Q.; Su, X.; Fu, J.; Feng, X.; Peng, J. Role of PI3K/AKT Pathway in cancer: The framework of malignant behavior. Mol. Biol. Rep. 2020, 47, 4587–4629. [Google Scholar] [CrossRef]
- Vara, J.Á.F.; Casado, E.; de Castro, J.; Cejas, P.; Belda-Iniesta, C.; González-Barón, M. PI3K/Akt Signalling pathway and cancer. Cancer Treat. Rev. 2004, 30, 193–204. [Google Scholar] [CrossRef]
- Ahmed, S.; Bradshaw, A.-D.; Gera, S.; Dewan, M.; Xu, R. The TGF-β/Smad4 signaling pathway in pancreatic carcinogenesis and Its clinical significance. J. Clin. Med. 2017, 6, 5. [Google Scholar] [CrossRef]
- Alvarez, M.A.; Freitas, J.P.; Mazher Hussain, S.; Glazer, E.S. TGF-β inhibitors in metastatic pancreatic ductal adenocarcinoma. J. Gastrointest. Cancer 2019, 50, 207–213. [Google Scholar] [CrossRef]
- Cimmino, G.; Tarallo, R.; Nassa, G.; Filippo, M.R.D.; Giurato, G.; Ravo, M.; Rizzo, F.; Conte, S.; Pellegrino, G.; Cirillo, P.; et al. Activating stimuli induce platelet MicroRNA Modulation and proteome reorganisation. Thromb. Haemost. 2015, 114, 96–108. [Google Scholar] [CrossRef]
- Meijer, L.L.; Puik, J.R.; Le Large, T.Y.S.; Heger, M.; Dijk, F.; Funel, N.; Wurdinger, T.; Garajová, I.; van Grieken, N.C.T.; van de Wiel, M.A.; et al. Unravelling the diagnostic dilemma: A MicroRNA panel of circulating MiR-16 and MiR-877 as a diagnostic classifier for distal bile duct tumors. Cancers 2019, 11, 1181. [Google Scholar] [CrossRef] [PubMed] [Green Version]
- Zhu, J.; Nie, S.; Wu, J.; Lubman, D.M. Target proteomic profiling of frozen pancreatic CD24+ adenocarcinoma tissues by immuno-laser capture microdissection and Nano-LC–MS/MS. J. Proteome Res. 2013, 12, 2791–2804. [Google Scholar] [CrossRef] [PubMed] [Green Version]
- Reduced expression of the membrane skeleton protein beta1-spectrin (SPTBN1) Is associated with worsened prognosis in pancreatic cancer. Histol. Histopathol. 2010, 1497–1506. [CrossRef]
- Mantini, G.; Vallés, A.M.; Le Large, T.Y.S.; Capula, M.; Funel, N.; Pham, T.V.; Piersma, S.R.; Kazemier, G.; Bijlsma, M.F.; Giovannetti, E.; et al. Co-expression analysis of pancreatic cancer proteome reveals biology and prognostic biomarkers. Cell. Oncol. 2020. [Google Scholar] [CrossRef] [PubMed]
- Sengupta, S.; den Boon, J.A.; Chen, I.-H.; Newton, M.A.; Stanhope, S.A.; Cheng, Y.-J.; Chen, C.-J.; Hildesheim, A.; Sugden, B.; Ahlquist, P. MicroRNA 29c is down-regulated in nasopharyngeal carcinomas, up-regulating MRNAs encoding extracellular matrix proteins. Proc. Natl. Acad. Sci. USA 2008, 105, 5874–5878. [Google Scholar] [CrossRef] [PubMed] [Green Version]
- Russ, A.C.; Sander, S.; Luck, S.C.; Lang, K.M.; Bauer, M.; Rucker, F.G.; Kestler, H.A.; Schlenk, R.F.; Dohner, H.; Holzmann, K.; et al. Integrative nucleophosmin mutation-associated MicroRNA and gene expression pattern analysis identifies novel micrornA—Target gene interactions in acute myeloid leukemia. Haematologica 2011, 96, 1783–1791. [Google Scholar] [CrossRef] [PubMed]
- Wang, C.; Gao, C.; Zhuang, J.-L.; Ding, C.; Wang, Y. A combined approach identifies three MRNAs that are down-regulated by MicroRNA-29b and promote invasion ability in the breast cancer cell line MCF-7. J. Cancer Res. Clin. Oncol. 2012, 138, 2127–2136. [Google Scholar] [CrossRef]
- Plaisier, C.L.; Pan, M.; Baliga, N.S. A MiRNA-regulatory network explains how dysregulated MiRNAs perturb oncogenic processes across diverse cancers. Genome Res. 2012, 22, 2302–2314. [Google Scholar] [CrossRef] [Green Version]
- Zhu, X.-C.; Dong, Q.-Z.; Zhang, X.-F.; Deng, B.; Jia, H.-L.; Ye, Q.-H.; Qin, L.-X.; Wu, X.-Z. MicroRNA-29a Suppresses cell proliferation by targeting SPARC in hepatocellular carcinoma. Int. J. Mol. Med. 2012, 30, 1321–1326. [Google Scholar] [CrossRef]
- Pham, T.V.; Henneman, A.A.; Jimenez, C.R. Iq: An R Package to estimate relative protein abundances from ion quantification in DIA-MS-Based Proteomics. Bioinformatics 2020, 36, 2611–2613. [Google Scholar] [CrossRef]
- Brown, P.O.; Botstein, D. Exploring the new world of the genome with DNA microarrays. Nat. Genet. 1999, 21, 33–37. [Google Scholar] [CrossRef] [PubMed]
- Koukourakis, M.I.; Giatromanolaki, A.; Brekken, R.A.; Sivridis, E.; Gatter, K.C.; Harris, A.L.; Sage, E.H. Enhanced expression of SPARC/Osteonectin in the tumor-associated stroma of non-small cell lung cancer is correlated with markers of hypoxia/acidity and with poor prognosis of patients. Cancer Res. 2003, 63, 5376. [Google Scholar] [PubMed]
- Sato, N.; Fukushima, N.; Maehara, N.; Matsubayashi, H.; Koopmann, J.; Su, G.H.; Hruban, R.H.; Goggins, M. SPARC/Osteonectin is a frequent target for aberrant methylation in pancreatic adenocarcinoma and a mediator of tumor–stromal interactions. Oncogene 2003, 22, 5021–5030. [Google Scholar] [CrossRef] [Green Version]
- Yunker, C.K.; Golembieski, W.; Lemke, N.; Schultz, C.R.; Cazacu, S.; Brodie, C.; Rempel, S.A. SPARC-induced increase in glioma matrix and decrease in vascularity are associated with reduced VEGF expression and secretion. Int. J. Cancer 2008, 122, 2735–2743. [Google Scholar] [CrossRef] [PubMed] [Green Version]
- Motamed, K. SPARC (Osteonectin/BM-40). Int. J. Biochem. Cell Biol. 1999, 31, 1363–1366. [Google Scholar] [CrossRef]
- Best, M.G.; Sol, N.; In ’t Veld, S.G.J.G.; Vancura, A.; Muller, M.; Niemeijer, A.-L.N.; Fejes, A.V.; Tjon Kon Fat, L.-A.; Huis In ’t Veld, A.E.; Leurs, C.; et al. Swarm intelligence-enhanced detection of non-small-cell lung cancer using tumor-educated platelets. Cancer Cell 2017, 32, 238–252.e9. [Google Scholar] [CrossRef] [PubMed]
- Gagliardi, D.; Dziembowski, A. 5′ and 3′ modifications controlling RNA degradation: From safeguards to executioners. Philos. Trans. R. Soc. B Biol. Sci. 2018, 373, 20180160. [Google Scholar] [CrossRef] [Green Version]
- Houseley, J.; Tollervey, D. The Many pathways of RNA degradation. Cell 2009, 136, 763–776. [Google Scholar] [CrossRef] [Green Version]
- Cohen, J.D.; Javed, A.A.; Thoburn, C.; Wong, F.; Tie, J.; Gibbs, P.; Schmidt, C.M.; Yip-Schneider, M.T.; Allen, P.J.; Schattner, M.; et al. Combined circulating tumor DNA and protein biomarker-based liquid biopsy for the earlier detection of pancreatic cancers. Proc. Natl. Acad. Sci. USA 2017, 114, 10202–10207. [Google Scholar] [CrossRef] [Green Version]
- Gall, T.M.H.; Belete, S.; Khanderia, E.; Frampton, A.E.; Jiao, L.R. Circulating tumor cells and cell-free DNA in pancreatic ductal adenocarcinoma. Am. J. Pathol. 2019, 189, 71–81. [Google Scholar] [CrossRef] [Green Version]
- Liu, X.-D.; Wu, H.; Li, Y.; Liu, X.; Zhang, Z.; Yu, L.; Qin, Z.; Su, Z.; Liu, R.; He, Q.; et al. Early detection of pancreatic ductal adenocarcinoma using methylation signatures in circulating tumour DNA. Ann. Oncol. 2019, 30, v261–v262. [Google Scholar] [CrossRef]
- Lehmann-Werman, R.; Neiman, D.; Zemmour, H.; Moss, J.; Magenheim, J.; Vaknin-Dembinsky, A.; Rubertsson, S.; Nellgård, B.; Blennow, K.; Zetterberg, H.; et al. Identification of tissue-specific cell death using methylation patterns of circulating DNA. Proc. Natl. Acad. Sci. USA 2016, 113, E1826–E1834. [Google Scholar] [CrossRef] [PubMed] [Green Version]
- Sun, K.; Jiang, P.; Chan, K.C.A.; Wong, J.; Cheng, Y.K.Y.; Liang, R.H.S.; Chan, W.; Ma, E.S.K.; Chan, S.L.; Cheng, S.H.; et al. Plasma DNA tissue mapping by genome-wide methylation sequencing for noninvasive prenatal, cancer, and transplantation assessments. Proc. Natl. Acad. Sci. USA 2015, 112, E5503–E5512. [Google Scholar] [CrossRef] [PubMed] [Green Version]
- Singh, N.; Gupta, S.; Rashid, S.; Rashid, S.; Dash, N.R.; Saraya, A. Tu2033—Quantitation of methylation load of tumor suppressor gene promoter methylation in pancreatic cancer. Gastroenterology 2019, 156, S-1176. [Google Scholar] [CrossRef]
- Park, J.W.; Baek, I.H.; Kim, Y.T. Preliminary study analyzing the methylated genes in the plasma of patients with pancreatic cancer. Scand. J. Surg. 2012, 101, 38–44. [Google Scholar] [CrossRef] [Green Version]
- Sol, N.; in ‘t Veld, S.G.J.G.; Vancura, A.; Tjerkstra, M.; Leurs, C.; Rustenburg, F.; Schellen, P.; Verschueren, H.; Post, E.; Zwaan, K.; et al. Tumor-educated platelet RNA for the detection and (Pseudo)progression monitoring of glioblastoma. Cell Rep. Med. 2020, 1, 100101. [Google Scholar] [CrossRef]
- Sol, N.; Leurs, C.E.; Veld, S.G.I.T.; Strijbis, E.M.; Vancura, A.; Schweiger, M.W.; Teunissen, C.E.; Mateen, F.J.; Tannous, B.A.; Best, M.G.; et al. Blood platelet RNA enables the detection of multiple sclerosis. Mult. Scler. J. Exp. Transl. Clin. 2020, 6. [Google Scholar] [CrossRef]
- Heinhuis, K.M.; In ’t Veld, S.G.J.G.; Dwarshuis, G.; van den Broek, D.; Sol, N.; Best, M.G.; van Coevorden, F.; Haas, R.L.; Beijnen, J.H.; van Houdt, W.J.; et al. RNA-sequencing of tumor-educated platelets, a novel biomarker for blood-based sarcoma diagnostics. Cancers 2020, 12, 1372. [Google Scholar] [CrossRef]
- Bolger, A.M.; Lohse, M.; Usadel, B. Trimmomatic: A flexible trimmer for illumina sequence data. Bioinformatics 2014, 30, 2114–2120. [Google Scholar] [CrossRef] [Green Version]
- Dobin, A.; Davis, C.A.; Zaleski, C.; Schlesinger, F.; Drenkow, J.; Chaisson, M.; Batut, P.; Jha, S.; Gingeras, T.R. STAR: Ultrafast universal RNA-Seq aligner. Bioinformatics 2012, 29, 15–21. [Google Scholar] [CrossRef]
- Anders, S.; Pyl, P.T.; Huber, W. HTSeq—A python framework to work with high-throughput sequencing data. Bioinformatics 2015, 31, 166–169. [Google Scholar] [CrossRef] [PubMed]
- Rueda, A.; Barturen, G.; Lebrón, R.; Gómez-Martín, C.; Alganza, Á.; Oliver, J.L.; Hackenberg, M. SRNAtoolbox: An integrated collection of small RNA research tools. Nucleic Acids Res. 2015, 43, W467–W473. [Google Scholar] [CrossRef] [PubMed] [Green Version]
- Pham, T.V.; Piersma, S.R.; Warmoes, M.; Jimenez, C.R. On the beta-binomial model for analysis of spectral count data in label-free tandem mass spectrometry-based proteomics. Bioinformatics 2010, 26, 363–369. [Google Scholar] [CrossRef] [PubMed]
- Giovannetti, E.; Funel, N.; Peters, G.J.; Del Chiaro, M.; Erozenci, L.A.; Vasile, E.; Leon, L.G.; Pollina, L.E.; Groen, A.; Falcone, A.; et al. MicroRNA-21 in pancreatic cancer: Correlation with clinical outcome and pharmacologic aspects underlying its role in the modulation of gemcitabine activity. Cancer Res. 2010, 70, 4528–4538. [Google Scholar] [CrossRef] [Green Version]
- Giovannetti, E.; van der Velde, A.; Funel, N.; Vasile, E.; Perrone, V.; Leon, L.G.; de Lio, N.; Avan, A.; Caponi, S.; Pollina, L.E.; et al. High-Throughput MicroRNA (MiRNAs) arrays unravel the prognostic role of MiR-211 in pancreatic cancer. PLoS ONE 2012, 7, e49145. [Google Scholar] [CrossRef]
- Giovannetti, E.; Wang, Q.; Avan, A.; Funel, N.; Lagerweij, T.; Lee, J.-H.; Caretti, V.; van der Velde, A.; Boggi, U.; Wang, Y.; et al. Role of CYB5A in pancreatic cancer prognosis and autophagy modulation. JNCI J. Natl. Cancer Inst. 2014, 106. [Google Scholar] [CrossRef] [Green Version]
- Subramanian, A.; Tamayo, P.; Mootha, V.K.; Mukherjee, S.; Ebert, B.L.; Gillette, M.A.; Paulovich, A.; Pomeroy, S.L.; Golub, T.R.; Lander, E.S.; et al. Gene Set enrichment analysis: A knowledge-based approach for interpreting genome-wide expression profiles. Proc. Natl. Acad. Sci. USA 2005, 102, 15545. [Google Scholar] [CrossRef] [Green Version]
- Backes, C.; Khaleeq, Q.T.; Meese, E.; Keller, A. MiEAA: MicroRNA enrichment analysis and annotation. Nucleic Acids Res. 2016, 44, W110–W116. [Google Scholar] [CrossRef] [Green Version]


Publisher’s Note: MDPI stays neutral with regard to jurisdictional claims in published maps and institutional affiliations. |
© 2020 by the authors. Licensee MDPI, Basel, Switzerland. This article is an open access article distributed under the terms and conditions of the Creative Commons Attribution (CC BY) license (http://creativecommons.org/licenses/by/4.0/).
Share and Cite
Mantini, G.; Meijer, L.L.; Glogovitis, I.; In ‘t Veld, S.G.J.G.; Paleckyte, R.; Capula, M.; Le Large, T.Y.S.; Morelli, L.; Pham, T.V.; Piersma, S.R.; et al. Omics Analysis of Educated Platelets in Cancer and Benign Disease of the Pancreas. Cancers 2021, 13, 66. https://doi.org/10.3390/cancers13010066
Mantini G, Meijer LL, Glogovitis I, In ‘t Veld SGJG, Paleckyte R, Capula M, Le Large TYS, Morelli L, Pham TV, Piersma SR, et al. Omics Analysis of Educated Platelets in Cancer and Benign Disease of the Pancreas. Cancers. 2021; 13(1):66. https://doi.org/10.3390/cancers13010066
Chicago/Turabian StyleMantini, Giulia, Laura L. Meijer, Ilias Glogovitis, Sjors G. J. G. In ‘t Veld, Rosita Paleckyte, Mjriam Capula, Tessa Y. S. Le Large, Luca Morelli, Thang V. Pham, Sander R. Piersma, and et al. 2021. "Omics Analysis of Educated Platelets in Cancer and Benign Disease of the Pancreas" Cancers 13, no. 1: 66. https://doi.org/10.3390/cancers13010066
APA StyleMantini, G., Meijer, L. L., Glogovitis, I., In ‘t Veld, S. G. J. G., Paleckyte, R., Capula, M., Le Large, T. Y. S., Morelli, L., Pham, T. V., Piersma, S. R., Frampton, A. E., Jimenez, C. R., Kazemier, G., Koppers-Lalic, D., Wurdinger, T., & Giovannetti, E. (2021). Omics Analysis of Educated Platelets in Cancer and Benign Disease of the Pancreas. Cancers, 13(1), 66. https://doi.org/10.3390/cancers13010066