Pathway-Based Integrative Analysis of Metabolome and Microbiome Data from Hepatocellular Carcinoma and Liver Cirrhosis Patients

 , , ,
, , , 
Simple Summary
Abstract
1. Introduction
2. Results
2.1. Baseline Characteristics
2.2. Pathway Analysis of HCC and LC Data
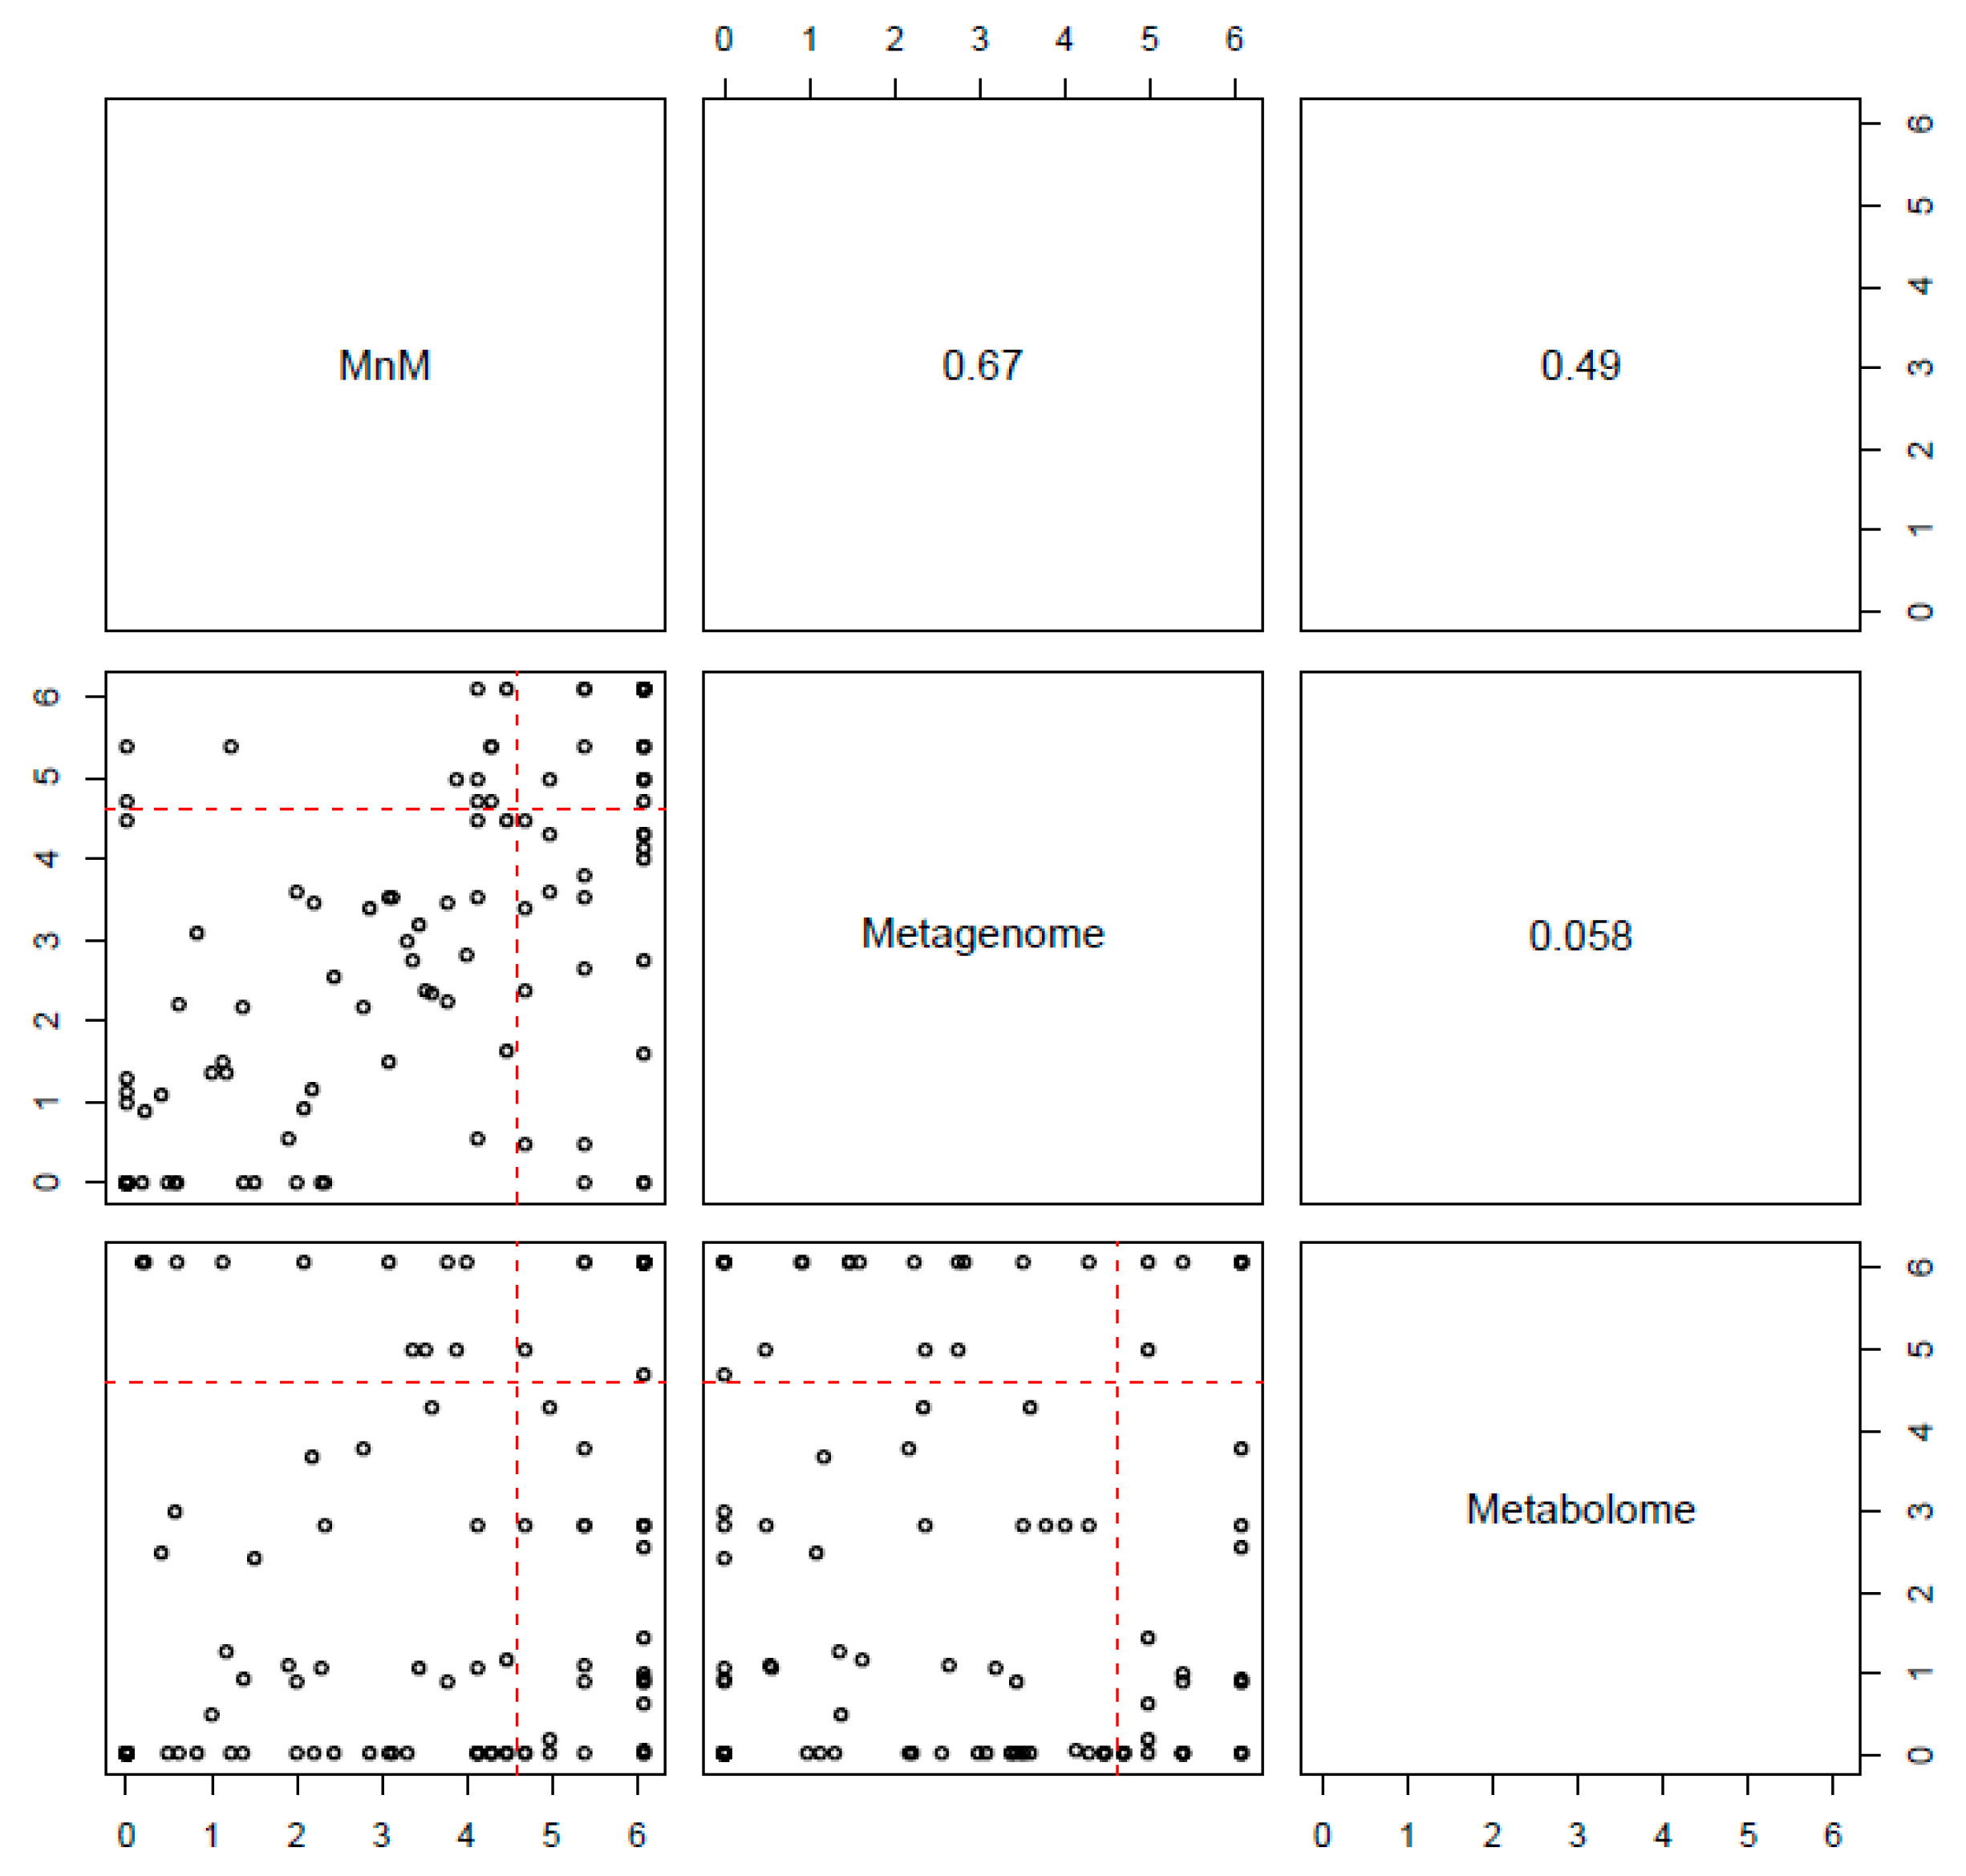
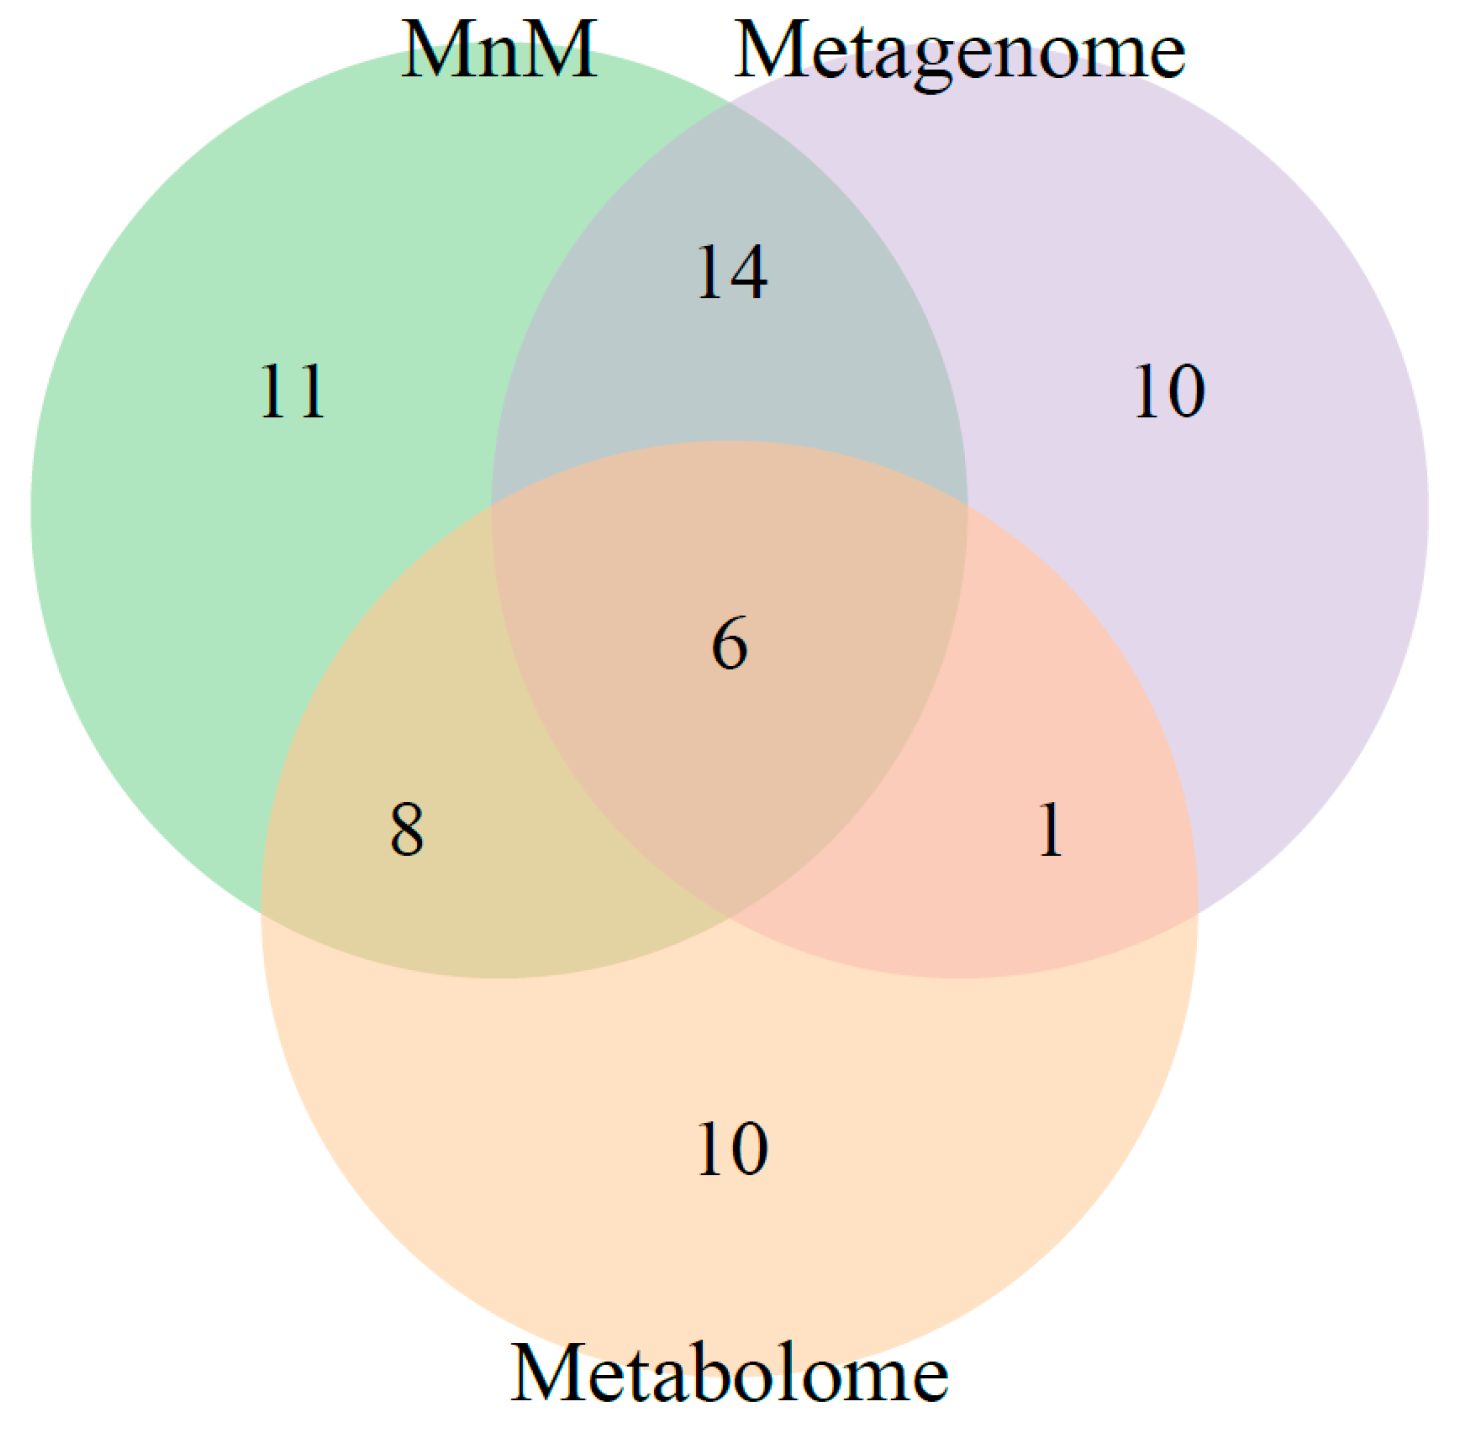
2.3. Comparison of HisCoM-MnM to HisCoM-Single Omics
3. Discussion
4. Materials and Methods
4.1. HCC and LC Data Sets
4.2. Microbiome Data
4.3. Metabolomic Data
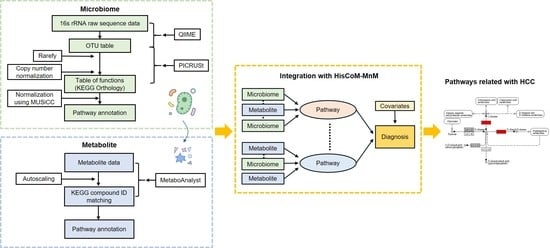
4.4. Merging Metagenomic and Metabolomic Data, Using Pathway Information
4.5. Hierarchical Structural Component Model for Pathway Analysis of Microbiome and Metabolome (HisCoM-MnM)
5. Conclusions
Author Contributions
Funding
Acknowledgments
Conflicts of Interest
Glossary
| Microbiota | microorganisms present in a defined environment [46] |
| Metagenome | the collection of genomes and genes sequenced from members of a microbiota [46] |
| Microbiome | the entire habitat, including the microorganisms, their genomes, and the surrounding environmental conditions [46] |
| Metabolome | collection of all metabolites present in the cell that are participants in general metabolic reactions [47] |
| Omics | large-scale study of data representing an entire set of molecules, such as proteins, lipids, or metabolites, in a cell, organ, or organism |
| Multiomics | an approach that examines multiple omics data sets such as genomics, proteomics, transcriptomics, metabolomics, and microbiomics |
References
- Hofer, U.; Speck, R.F. Disturbance of the gut-associated lymphoid tissue is associated with disease progression in chronic HIV infection. Semin. Immunopathol. 2009, 31, 257–266. [Google Scholar] [CrossRef]
- Sartor, R.B. Microbial influences in inflammatory bowel diseases. Gastroenterology 2008, 134, 577–594. [Google Scholar] [CrossRef]
- Ley, R.E.; Turnbaugh, P.J.; Klein, S.; Gordon, J.I. Human gut microbes associated with obesity. Nature 2006, 444, 1022–1023. [Google Scholar] [CrossRef]
- Qin, J.; Li, Y.; Cai, Z.; Li, S.; Zhu, J.; Zhang, F.; Liang, S.; Zhang, W.; Guan, Y.; Shen, D.; et al. A metagenome-wide association study of gut microbiota in type 2 diabetes. Nature 2012, 490, 55–60. [Google Scholar] [CrossRef] [PubMed]
- Noverr, M.C.; Noggle, R.M.; Toews, G.B.; Huffnagle, G.B. Role of antibiotics and fungal microbiota in driving pulmonary allergic responses. Infect. Immun. 2004, 72, 4996–5003. [Google Scholar] [CrossRef] [PubMed]
- Wen, L.; Ley, R.E.; Volchkov, P.Y.; Stranges, P.B.; Avanesyan, L.; Stonebraker, A.C.; Hu, C.; Wong, F.S.; Szot, G.L.; Bluestone, J.A.; et al. Innate immunity and intestinal microbiota in the development of Type 1 diabetes. Nature 2008, 455, 1109–1113. [Google Scholar] [CrossRef] [PubMed]
- Cryan, J.F.; Dinan, T.G. Mind-altering microorganisms: The impact of the gut microbiota on brain and behaviour. Nat. Rev. Neurosci. 2012, 13, 701–712. [Google Scholar] [CrossRef]
- Wang, L.; Christophersen, C.T.; Sorich, M.J.; Gerber, J.P.; Angley, M.T.; Conlon, M.A. Low relative abundances of the mucolytic bacterium akkermansia muciniphila and bifidobacterium spp. in feces of children with autism. Appl. Environ. Microbiol. 2011, 77, 6718–6721. [Google Scholar] [CrossRef]
- Packey, C.D.; Sartor, R.B. Commensal bacteria, traditional and opportunistic pathogens, dysbiosis and bacterial killing in inflammatory bowel diseases. Curr. Opin. Infect. Dis. 2009, 22, 292. [Google Scholar] [CrossRef]
- Cesaro, C.; Tiso, A.; Del Prete, A.; Cariello, R.; Tuccillo, C.; Cotticelli, G.; del Vecchio Blanco, C.; Loguercio, C.J.D.; Disease, L. Gut microbiota and probiotics in chronic liver diseases. Dig. Liver Dis. 2011, 43, 431–438. [Google Scholar] [CrossRef]
- Tripathi, A.; Debelius, J.; Brenner, D.A.; Karin, M.; Loomba, R.; Schnabl, B.; Knight, R. The gut-liver axis and the intersection with the microbiome. Nat. Rev. Gastroenterol. Hepatol. 2018, 15, 397–411. [Google Scholar] [CrossRef] [PubMed]
- Wang, B.; Jiang, X.; Cao, M.; Ge, J.; Bao, Q.; Tang, L.; Chen, Y.; Li, L. Altered fecal microbiota correlates with liver biochemistry in nonobese patients with non-alcoholic fatty liver disease. Sci. Rep. 2016, 6, 32002. [Google Scholar] [CrossRef] [PubMed]
- Wang, Q.; Wang, K.; Wu, W.; Giannoulatou, E.; Ho, J.W.; Li, L. Host and microbiome multi-omics integration: Applications and methodologies. Biophys. Rev. 2019, 11, 55–65. [Google Scholar] [CrossRef] [PubMed]
- Marcobal, A.; Kashyap, P.C.; Nelson, T.A.; Aronov, P.A.; Donia, M.S.; Spormann, A.; Fischbach, M.A.; Sonnenburg, J.L. A metabolomic view of how the human gut microbiota impacts the host metabolome using humanized and gnotobiotic mice. ISME J. 2013, 7, 1933–1943. [Google Scholar] [CrossRef]
- Shankar, V.; Homer, D.; Rigsbee, L.; Khamis, H.J.; Michail, S.; Raymer, M.; Reo, N.V.; Paliy, O. The networks of human gut microbe-metabolite associations are different between health and irritable bowel syndrome. ISME J. 2015, 9, 1899–1903. [Google Scholar] [CrossRef]
- Noecker, C.; Eng, A.; Srinivasan, S.; Theriot, C.M.; Young, V.B.; Jansson, J.K.; Fredricks, D.N.; Borenstein, E. Metabolic model-based integration of microbiome taxonomic and metabolomic profiles elucidates mechanistic links between ecological and metabolic variation. Msystems 2016, 1, e00013–e00015. [Google Scholar] [CrossRef] [PubMed]
- Lee, S.; Choi, S.; Kim, Y.J.; Kim, B.-J.; Consortium, T.d.-G.; Hwang, H.; Park, T. Pathway-based approach using hierarchical components of collapsed rare variants. Bioinformatics 2016, 32, i586–i594. [Google Scholar] [CrossRef]
- Choi, S.; Lee, S.; Kim, Y.; Hwang, H.; Park, T. HisCoM-GGI: Hierarchical structural component analysis of gene–gene interactions. J. Bioinf. Comput. Biol. 2018, 16, 1840026. [Google Scholar] [CrossRef] [PubMed]
- Jiang, N.; Lee, S.; Park, T. Hierarchical structural component model for pathway analysis of common variants. BMC Med. Genom. 2020, 13, 26. [Google Scholar] [CrossRef]
- Kim, Y.; Lee, S.; Choi, S.; Jang, J.-Y.; Park, T. Hierarchical structural component modeling of microRNA-mRNA integration analysis. BMC Bioinf. 2018, 19, 75. [Google Scholar] [CrossRef]
- Lee, S.; Kim, Y.; Choi, S.; Hwang, H.; Park, T. Pathway-based approach using hierarchical components of rare variants to analyze multiple phenotypes. BMC Bioinf. 2018, 19, 79. [Google Scholar] [CrossRef]
- Mok, L.; Kim, Y.; Lee, S.; Choi, S.; Lee, S.; Jang, J.-Y.; Park, T.J.G. HisCoM-PAGE: Hierarchical structural component models for pathway analysis of gene expression data. Genes 2019, 10, 931. [Google Scholar] [CrossRef]
- Cho, E.J.; Leem, S.; Kim, S.A.; Yang, J.; Lee, Y.B.; Kim, S.S.; Cheong, J.Y.; Cho, S.W.; Kim, J.W.; Kim, S.-M.; et al. Circulating microbiota-based metagenomic signature for detection of hepatocellular carcinoma. Sci. Rep. 2019, 9, 7536. [Google Scholar] [CrossRef] [PubMed]
- Kim, D.J.; Cho, E.J.; Yu, K.-S.; Jang, I.-J.; Yoon, J.-H.; Park, T.; Cho, J.-Y.J.C. Comprehensive metabolomic search for biomarkers to differentiate early stage hepatocellular carcinoma from cirrhosis. Cancers 2019, 11, 1497. [Google Scholar] [CrossRef] [PubMed]
- Galle, P.R.; Forner, A.; Llovet, J.M.; Mazzaferro, V.; Piscaglia, F.; Raoul, J.-L.; Schirmacher, P.; Vilgrain, V. EASL clinical practice guidelines: Management of hepatocellular carcinoma. J. Hepatol. 2018, 69, 182–236. [Google Scholar] [CrossRef] [PubMed]
- Edge, S.B.; Compton, C.C. The American joint committee on cancer: The 7th edition of the AJCC cancer staging manual and the future of TNM. Ann. Surg. Oncol. 2010, 17, 1471–1474. [Google Scholar] [CrossRef] [PubMed]
- Yang, Y.; Li, C.; Nie, X.; Feng, X.; Chen, W.; Yue, Y.; Tang, H.; Deng, F. Metabonomic studies of human hepatocellular carcinoma using high-resolution magic-angle spinning 1H NMR spectroscopy in conjunction with multivariate data analysis. J. Proteome Res. 2007, 6, 2605–2614. [Google Scholar] [CrossRef] [PubMed]
- Gao, R.; Cheng, J.; Fan, C.; Shi, X.; Cao, Y.; Sun, B.; Ding, H.; Hu, C.; Dong, F.; Yan, X. Serum metabolomics to identify the liver disease-specific biomarkers for the progression of hepatitis to hepatocellular carcinoma. Sci. Rep. 2015, 5, 18175. [Google Scholar] [CrossRef] [PubMed]
- Bartolini, D.; Sancineto, L.; de Bem, A.F.; Tew, K.D.; Santi, C.; Radi, R.; Toquato, P.; Galli, F. Selenocompounds in cancer therapy: An overview. Adv. Cancer Res. 2017, 136, 259–302. [Google Scholar] [CrossRef]
- Yamaguchi, F.; Hirata, Y.; Akram, H.; Kamitori, K.; Dong, Y.; Sui, L.; Tokuda, M. FOXO/TXNIP pathway is involved in the suppression of hepatocellular carcinoma growth by glutamate antagonist MK-801. BMC Cancer 2013, 13, 468. [Google Scholar] [CrossRef]
- Cairns, R.A.; Harris, I.S.; Mak, T.W. Regulation of cancer cell metabolism. Nat. Rev. Cancer 2011, 11, 85–95. [Google Scholar] [CrossRef] [PubMed]
- Iansante, V.; Choy, P.M.; Fung, S.W.; Liu, Y.; Chai, J.-G.; Dyson, J.; Del Rio, A.; D’Santos, C.; Williams, R.; Chokshi, S.; et al. PARP14 promotes the Warburg effect in hepatocellular carcinoma by inhibiting JNK1-dependent PKM2 phosphorylation and activation. Nat. Commun. 2015, 6, 7882. [Google Scholar] [CrossRef] [PubMed]
- DeBerardinis, R.J. Serine metabolism: Some tumors take the road less traveled. Cell Metab. 2011, 14, 285–286. [Google Scholar] [CrossRef] [PubMed]
- Amelio, I.; Cutruzzolá, F.; Antonov, A.; Agostini, M.; Melino, G. Serine and glycine metabolism in cancer. Trends Biochem. Sci. 2014, 39, 191–198. [Google Scholar] [CrossRef] [PubMed]
- Woo, C.C.; Chen, W.C.; Teo, X.Q.; Radda, G.K.; Lee, P.T.H. Downregulating serine hydroxymethyltransferase 2 (SHMT2) suppresses tumorigenesis in human hepatocellular carcinoma. Oncotarget 2016, 7, 53005. [Google Scholar] [CrossRef] [PubMed]
- Beyoğlu, D.; Imbeaud, S.; Maurhofer, O.; Bioulac-Sage, P.; Zucman-Rossi, J.; Dufour, J.F.; Idle, J.R. Tissue metabolomics of hepatocellular carcinoma: Tumor energy metabolism and the role of transcriptomic classification. Hepatology 2013, 58, 229–238. [Google Scholar] [CrossRef]
- Fitian, A.I.; Nelson, D.R.; Liu, C.; Xu, Y.; Ararat, M.; Cabrera, R. Integrated metabolomic profiling of hepatocellular carcinoma in hepatitis C cirrhosis through GC/MS and UPLC/MS-MS. Liver Int. 2014, 34, 1428–1444. [Google Scholar] [CrossRef]
- Nahon, P.; Amathieu, R.; Triba, M.N.; Bouchemal, N.; Nault, J.-C.; Ziol, M.; Seror, O.; Dhonneur, G.; Trinchet, J.-C.; Beaugrand, M.; et al. Identification of serum proton NMR metabolomic fingerprints associated with hepatocellular carcinoma in patients with alcoholic cirrhosis. Clin. Cancer Res. 2012, 18, 6714–6722. [Google Scholar] [CrossRef]
- Xiao, J.F.; Varghese, R.S.; Zhou, B.; Nezami Ranjbar, M.R.; Zhao, Y.; Tsai, T.-H.; Di Poto, C.; Wang, J.; Goerlitz, D.; Luo, Y. LC-MS based serum metabolomics for identification of hepatocellular carcinoma biomarkers in Egyptian cohort. J. Proteome Res. 2012, 11, 5914–5923. [Google Scholar] [CrossRef]
- Glunde, K.; Bhujwalla, Z.M.; Ronen, S.M. Choline metabolism in malignant transformation. Nat. Rev. Cancer 2011, 11, 835–848. [Google Scholar] [CrossRef]
- Caporaso, J.G.; Kuczynski, J.; Stombaugh, J.; Bittinger, K.; Bushman, F.D.; Costello, E.K.; Fierer, N.; Peña, A.G.; Goodrich, J.K.; Gordon, J.I.; et al. QIIME allows analysis of high-throughput community sequencing data. Nat. Methods 2010, 7, 335–336. [Google Scholar] [CrossRef] [PubMed]
- Langille, M.G.I.; Zaneveld, J.; Caporaso, J.G.; McDonald, D.; Knights, D.; Reyes, J.A.; Clemente, J.C.; Burkepile, D.E.; Vega Thurber, R.L.; Knight, R.; et al. Predictive functional profiling of microbial communities using 16S rRNA marker gene sequences. Nat. Biotechnol. 2013, 31, 814–821. [Google Scholar] [CrossRef] [PubMed]
- Manor, O.; Borenstein, E. MUSiCC: A marker genes based framework for metagenomic normalization and accurate profiling of gene abundances in the microbiome. Genome Biol. 2015, 16, 53. [Google Scholar] [CrossRef] [PubMed]
- Xia, J.; Psychogios, N.; Young, N.; Wishart, D.S. MetaboAnalyst: A web server for metabolomic data analysis and interpretation. Nucleic Acids Res. 2009, 37, W652–W660. [Google Scholar] [CrossRef] [PubMed]
- Kanehisa, M.; Goto, S. KEGG: Kyoto encyclopedia of genes and genomes. Nucleic Acids Res. 2000, 28, 27–30. [Google Scholar] [CrossRef]
- Marchesi, J.R.; Ravel, J. The vocabulary of microbiome research: A proposal. Microbiome 2015, 3, 31. [Google Scholar] [CrossRef]
- Mosleth, E.; McLeod, A.; Rud, I.; Axelsson, L.; Solberg, L.; Moen, B.; Gilman, K.; Færgestad, E.; Lysenko, A.; Rawlings, C. Comprehensive Chemometrics, 2nd ed.; Elsevier: Amsterdam, The Netherlands, 2020; pp. 515–567. [Google Scholar]


| Variable | HCC | LC | p-Value |
|---|---|---|---|
| (n = 103) | (n = 97) | ||
| Age, Years | 59 (52–64) | 57 (49–62) | 0.08 |
| Male | 77 (74.76%) | 68 (70.10%) | 0.53 |
| Etiology of Liver Disease | <0.001 | ||
| HBV | 103 (100.00%) | 83 (85.57%) | |
| HCV | 0 | 12 (12.37%) | |
| Non-Viral | 0 | 2 (2.06%) | |
| Liver Function | <0.001 | ||
| Compensated | 94 (91.26%) | 66 (68.04%) | |
| Decompensated | 9 (8.74%) | 31 (31.96%) | |
| α-Fetoprotein, ng/ml | 14.8 (4.2–216.8) | 3.1 (1.8–9.8) | <0.001 |
| AJCC TNM Stage | |||
| I | 52 (50.48%) | ||
| II | 30 (29.13%) | ||
| III | 13 (12.62%) | ||
| IV | 8 (7.77%) |
| Pathway Category | Subcategory | Number of Pathways | |
|---|---|---|---|
| Metabolism | Biosynthesis of other secondary metabolites | 7 | 24 |
| Metabolism of other amino acids | 7 | ||
| Amino acid metabolism | 4 | ||
| Carbohydrate metabolism | 2 | ||
| Energy metabolism | 1 | ||
| Global and overview maps | 1 | ||
| Lipid metabolism | 1 | ||
| Metabolism of cofactors and vitamins | 1 | ||
| Organismal Systems | Digestive system | 2 | 5 |
| Nervous system | 2 | ||
| Excretory system | 1 | ||
| Human Diseases | Cancer: overview | 1 | 4 |
| Drug resistance: antimicrobial | 1 | ||
| Neurodegenerative disease | 1 | ||
| Substance dependence | 1 | ||
| Environmental Information Processing | Signal transduction | 3 | 3 |
| Cellular Processes | Cell growth and death | 1 | 2 |
| Cell motility | 1 | ||
| Genetic Information Processing | Translation | 1 | 1 |
| Category | Pathway Category | Sub Category | Name | p-Value |
|---|---|---|---|---|
| Cancer | Human Diseases | Cancer: overview | Central carbon metabolism in cancer | 2.0 × 10⁻⁵ |
| Human Diseases | Cancer: overview | Choline metabolism in cancer | 2.54 × 10⁻³ | |
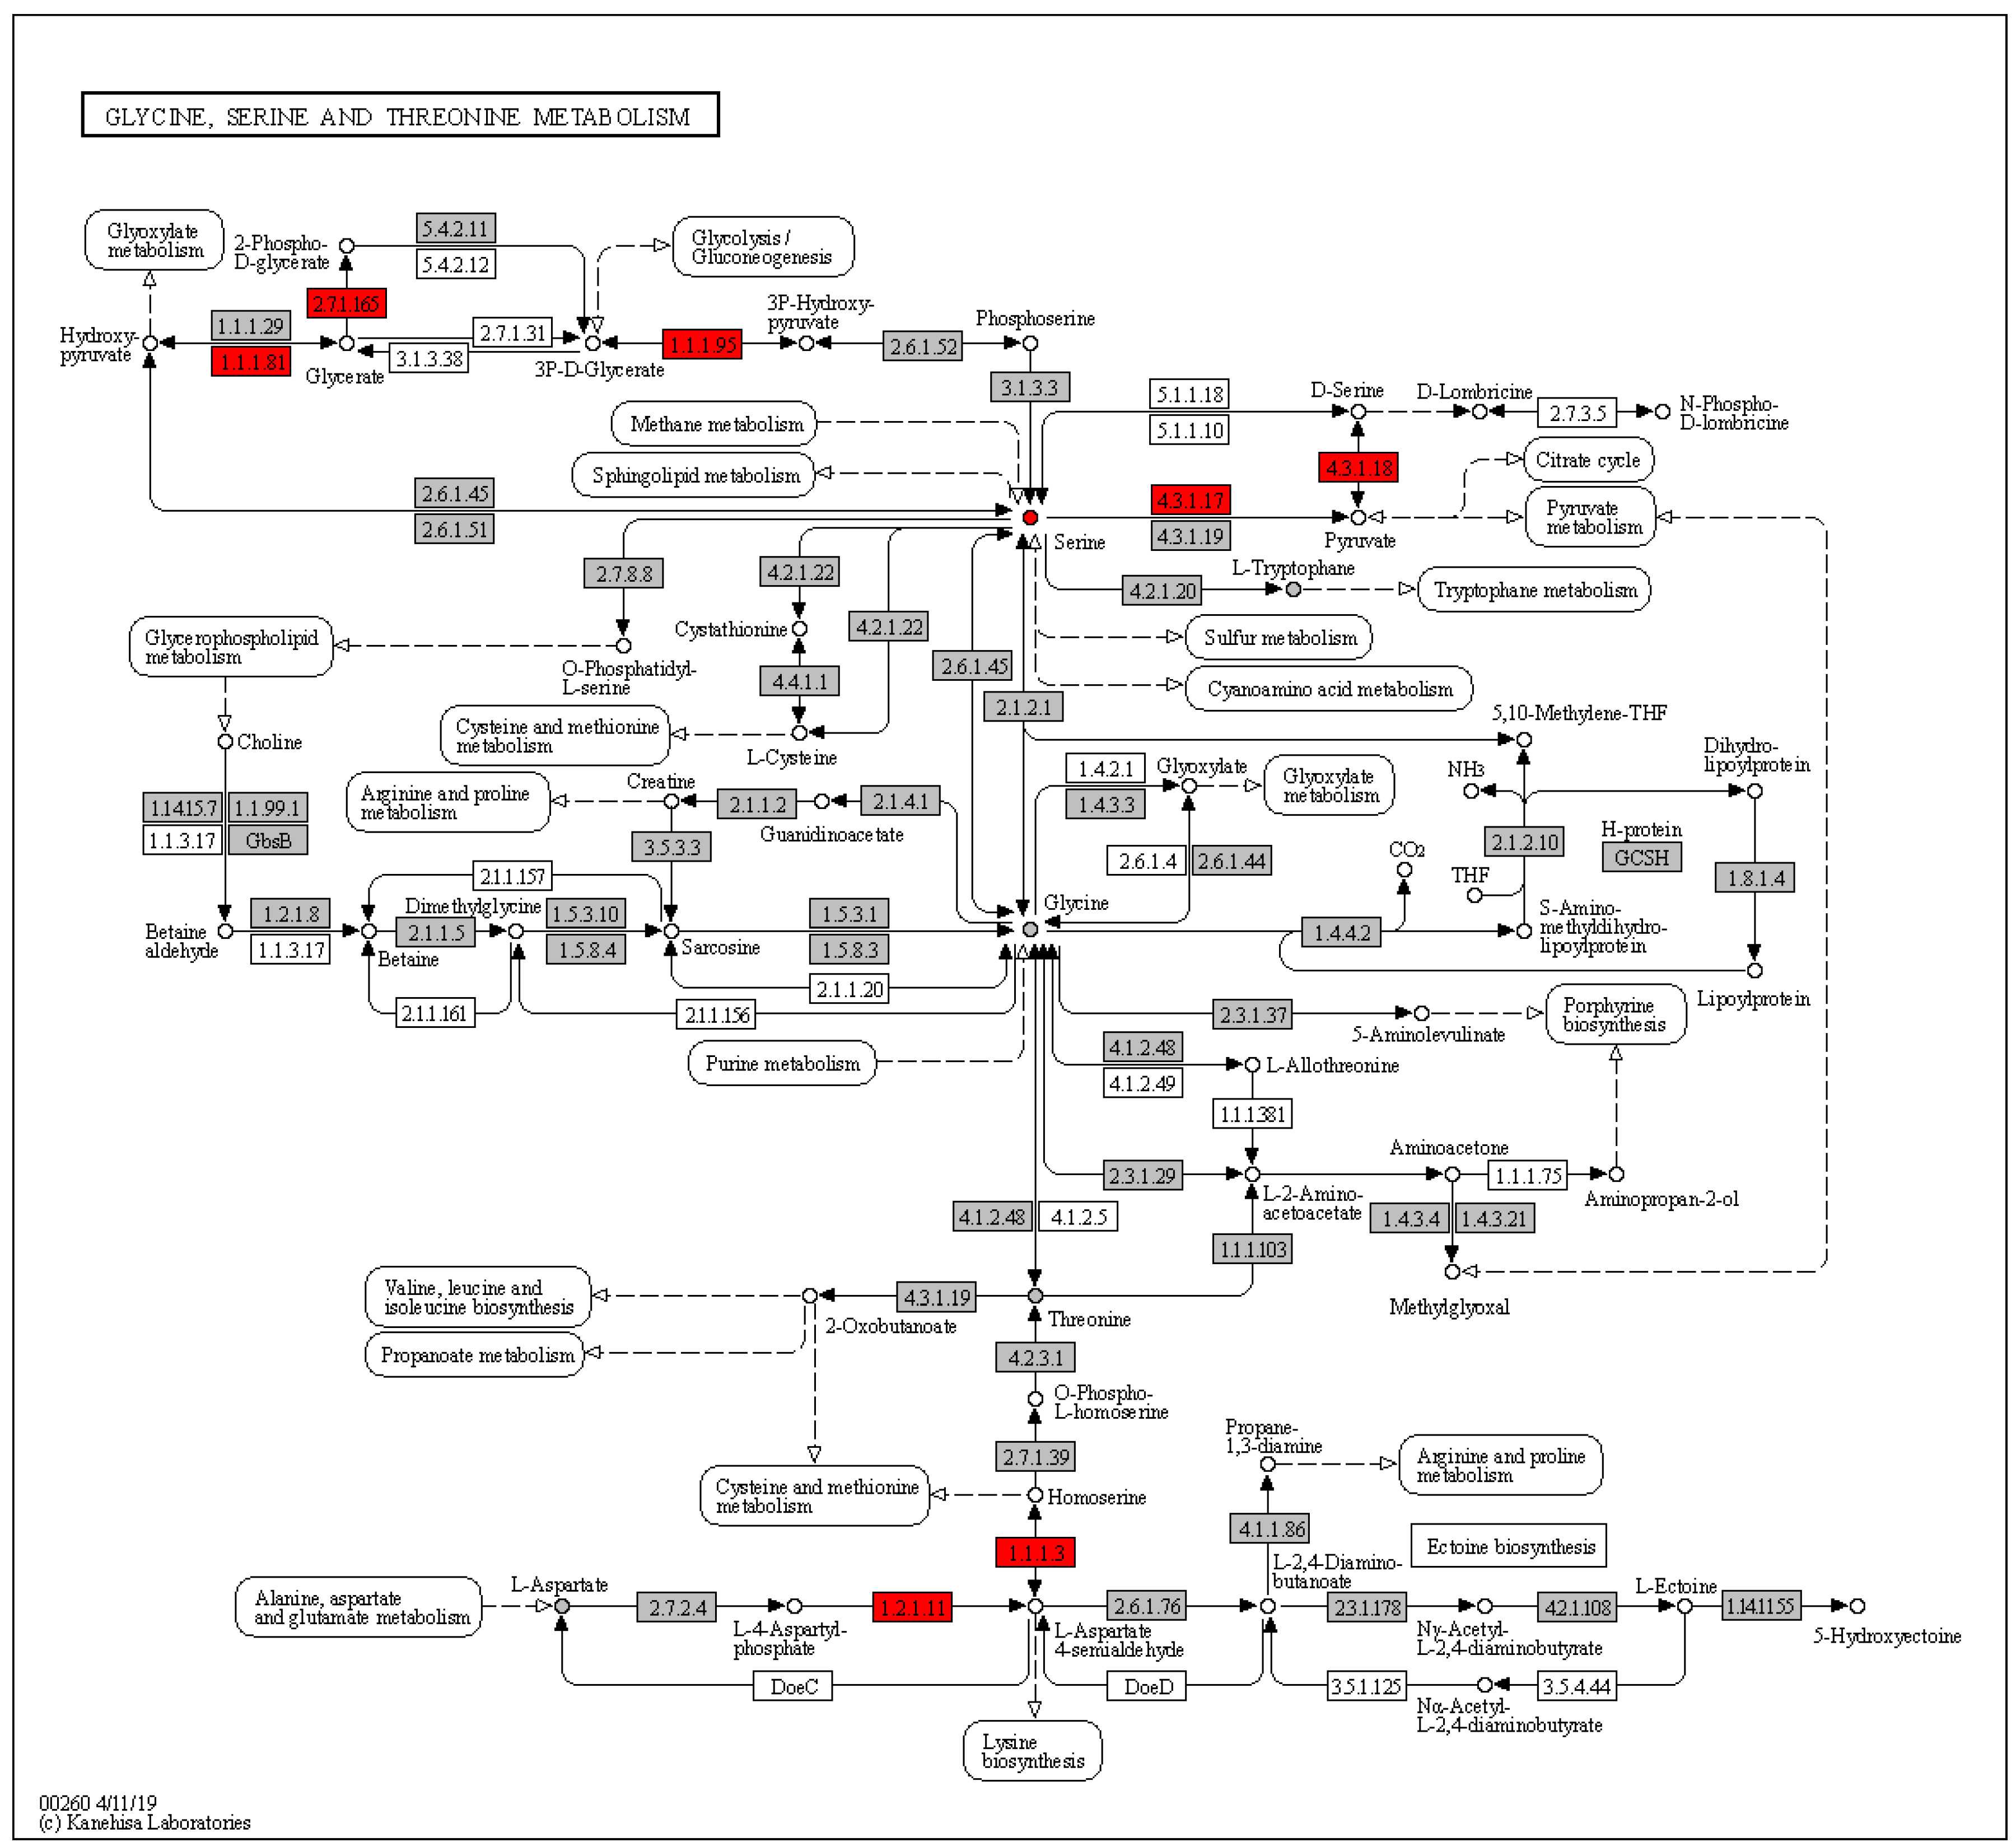
| Amino Acid Metabolism | Metabolism | Amino acid metabolism | Glycine, serine and threonine metabolism | 2.0 × 10⁻⁴ |
| Metabolism | Amino acid metabolism | Valine, leucine and isoleucine biosynthesis | 8.0 × 10⁻⁵ | |
| Metabolism | Amino acid metabolism | Alanine, aspartate and glutamate metabolism | 9.80 × 10⁻⁴ | |
| Metabolism | Amino acid metabolism | Valine, leucine and isoleucine degradation | 3.18 × 10⁻³ | |
| Metabolism | Metabolism of other amino acids | D-Glutamine and D-glutamate metabolism | 2.0 × 10⁻⁵ | |
| Metabolism | Metabolism of other amino acids | D-Alanine metabolism | 2.0 × 10⁻⁵ | |
| Metabolism | Metabolism of other amino acids | Glutathione metabolism | 1.40 × 10⁻⁴ | |
| Lipid Metabolism | Metabolism | Global and overview maps | Fatty acid metabolism | 6.0 × 10⁻⁵ |
| Metabolism | Lipid metabolism | Fatty acid degradation | 1.40 × 10⁻⁴ | |
| Metabolism | Lipid metabolism | Glycerophospholipid metabolism | 1.18 × 10⁻³ | |
| Metabolism | Lipid metabolism | Primary bile acid biosynthesis | 3.78 × 10⁻³ | |
| Metabolism | Lipid metabolism | Linoleic acid metabolism | 0.029 |
© 2020 by the authors. Licensee MDPI, Basel, Switzerland. This article is an open access article distributed under the terms and conditions of the Creative Commons Attribution (CC BY) license (http://creativecommons.org/licenses/by/4.0/).
Share and Cite
Kim, B.; Cho, E.J.; Yoon, J.-H.; Kim, S.S.; Cheong, J.Y.; Cho, S.W.; Park, T. Pathway-Based Integrative Analysis of Metabolome and Microbiome Data from Hepatocellular Carcinoma and Liver Cirrhosis Patients. Cancers 2020, 12, 2705. https://doi.org/10.3390/cancers12092705
Kim B, Cho EJ, Yoon J-H, Kim SS, Cheong JY, Cho SW, Park T. Pathway-Based Integrative Analysis of Metabolome and Microbiome Data from Hepatocellular Carcinoma and Liver Cirrhosis Patients. Cancers. 2020; 12(9):2705. https://doi.org/10.3390/cancers12092705
Chicago/Turabian StyleKim, Boram, Eun Ju Cho, Jung-Hwan Yoon, Soon Sun Kim, Jae Youn Cheong, Sung Won Cho, and Taesung Park. 2020. "Pathway-Based Integrative Analysis of Metabolome and Microbiome Data from Hepatocellular Carcinoma and Liver Cirrhosis Patients" Cancers 12, no. 9: 2705. https://doi.org/10.3390/cancers12092705
APA StyleKim, B., Cho, E. J., Yoon, J.-H., Kim, S. S., Cheong, J. Y., Cho, S. W., & Park, T. (2020). Pathway-Based Integrative Analysis of Metabolome and Microbiome Data from Hepatocellular Carcinoma and Liver Cirrhosis Patients. Cancers, 12(9), 2705. https://doi.org/10.3390/cancers12092705