Simple Summary
The proteasome inhibitor bortezomib is currently commonly used for the treatment of multiple myeloma (MM). MicroRNAs (miRNAs) are small non-coding RNAs that play a crucial role in messenger RNA silencing and post-transcriptional regulation of gene expression. In MM, the expression of several miRNAs is markedly dysregulated suggesting their role in MM pathogenesis and drug resistance. The aim of our study was to assess miRNA expression patterns in the serum of MM patients treated with bortezomib. We have identified 21 serum miRNAs differentially expressed in patients refractory to bortezomib-based chemotherapy. A miRNAs-based prediction model was developed to assess the probability of refractoriness to bortezomib. Our findings, indicating the differential expression of miRNAs between bortezomib-refractory and bortezomib-sensitive patients, suggest that these circulating miRNAs may play an important role in personalized treatment of MM patients.
Abstract
Bortezomib is the first-in-class proteasome inhibitor, commonly used in the treatment of multiple myeloma (MM). The mechanisms underlying acquired bortezomib resistance in MM are poorly understood. Several cell-free miRNAs have been found to be aberrantly regulated in MM patients. The aim of this pilot study was to identify a blood-based miRNA signature that predicts bortezomib-based therapy efficacy in MM patients. Thirty MM patients treated with bortezomib-based regimens were studied, including 19 with refractory disease and 11 who were bortezomib sensitive. Serum miRNA expression patterns were identified with miRCURY LNA miRNA miRNome PCR Panels I+II (Exiqon/Qiagen). Univariate analysis found a total of 21 miRNAs to be differentially expressed in patients with MM according to bortezomib sensitivity. Multivariate logistic regression was created and allowed us to discriminate refractory from sensitive patients with a very high AUC of 0.95 (95%CI: 0.84–1.00); sensitivity, specificity and accuracy were estimated as 0.95, 0.91, and 0.93. The model used expression of 3 miRNAs: miR-215-5p, miR-181a-5p and miR-376c-3p. This study is the first to demonstrate that serum expression of several miRNAs differs between patients who are bortezomib refractory and those who are sensitive which may prove useful in studies aimed at overcoming drug resistance in MM treatment.
Keywords:
bortezomib; efficacy; multiple myeloma; resistance; sensitivity; refractory; microRNA; miR-215-5p; miR-181a-5p; miR-376c-3p 1. Introduction
Multiple myeloma (MM) is a hematological malignancy characterized by the clonal proliferation of plasma cells in the bone marrow (BM) microenvironment [1,2]. It is the second most prevalent hematological malignancy, accounting for 1.3% of all malignancies and 15% of hematological neoplasms, with an annual incidence of 4.5–6 cases per 100,000 people [3].
Multiple myeloma often results in bone lesions, hypercalcemia, infections, anemia and production of monoclonal immunoglobulin. The interaction of MM cells with host factors, and the BM microenvironment plays a key role in the molecular evolution of the disease and the generation of treatment-resistant cells; it also influences disease progression with the development of relapsed or refractory disease [4,5]. The treatment of MM has changed in recent years, with the introduction of new drugs, most notably, proteasome inhibitors such as bortezomib, carfilzomib and ixazomib, immunomodulatory drugs (lenalidomide, pomalidomide), a histone deacetylase inhibitors (panobinostat) and monoclonal antibodies (elotuzumab and daratumumab) [6,7]. Bortezomib inhibits the proteasomal degradation of several regulatory ubiquitinated proteins and exerts substantial anti-myeloma activity in previously untreated and relapsed/refractory MM patients. The drug can be used as a single agent but is more frequently administered in combination with other anti-myeloma drugs [8]. However, the therapeutic resistance of these agents, which emerges soon after the onset of therapy in some cases, limits the efficacy of the treatment in most patients, even if they initially responded to therapy [9].
MicroRNAs (miRNAs) are small, non-coding RNAs only 19 to 25 bases in length that are secreted into the circulation and influence the regulation of gene expression in physiological or pathological conditions [10,11,12]. Many studies have shown that miRNAs influence on several biological processes associated with cancers, such as cancer proliferation, apoptosis, migration and invasion [13]. MiRNAs can regulate the expression of tumor suppressor genes or oncogenes and play a functional role in cancer progression. The profile of cell-free miRNAs or circulating miRNAs could be used as a signature of disease status, including MM. Some studies indicate lowered expression of several miRNAs, including miR-125b, miR-133a, miR-1, miR-124a, miR-15, and miR-16 in cell samples from patients with MM than in normal individuals [14,15]. In contrast, higher expression of miR-21 has been observed in MM plasma cells compared to plasma cells from individuals without MM [16]. Gupta al. found miR-203 to demonstrate high sensitivity (83%) and specificity (83%) in the diagnosis of MM [17].
In patients with MM, miRNAs seem to be involved in drug resistance [15,18,19,20,21]. For example, miR-21, miR-221/222, miR-125a and miR-125b, and miR-451 are upregulated in MM cells resistant to antimyeloma drugs [21,22,23,24]. MiRNAs play an important role in regulating drug resistance by directly targeting oncogenes and tumor suppressor genes in neoplastic diseases [23]. However, very little data exists about the types of circulating miRNA in MM patients who are sensitive, or refractory, to bortezomib. Identifying the miRNAs which mediate resistance of MM cells to targeted therapy may improve proper treatment selection, overall response (OR) and survival. The present study analyzes serum miRNA expression patterns in the serum of MM patients subsequently treated with bortezomib-based regimens.
2. Results
In Table 1 we present the demographic, clinical and laboratory characteristics of the 30 MM patients enrolled for the study. A total number of 18 men and 12 women were studied and the mean age of study population was 64.0 ± 9.9 years (range 39–81). The predominant paraprotein detected was IgG type (60.0%) followed by light chain myeloma (23.3%). Most of the patients received a bortezomib, cyclophosphamide and dexamethasone (VCD) regimen; however, two patients received VMP (bortezomib, melphalan and prednisone), and one received VTD (bortezomib, thalidomide, dexamethasone). Nineteen patients were refractory and 11 sensitive to bortezomib-based therapies. Overall, no statistically significant differences were observed between the refractory and sensitive group regarding the studied clinical variables (Table 1).

Table 1.
The characteristics of the MM patients treated with Bortezomib-based therapy.
MiRNAs were filtered for those present in 100% of both groups, leaving 155 miRNAs for further analysis. PCA was performed to increase the general understanding of the whole miRNA signature (Figure 1a). Twenty-one miRNAs were found to demonstrate significant differences in expression between the refractory and the sensitive group (Table 2, Figure 1b). Overexpression of miR-215-5p, miR-143-3p, miR-19b-3p, miR-16-2-3p, miR-122-5p, miR-148a-3p, miR-22-5p, miR-30e-5p and miR-29b-3p was seen in the bortezomib-refractory patients compared to the bortezomib-sensitive patients (Table 2).
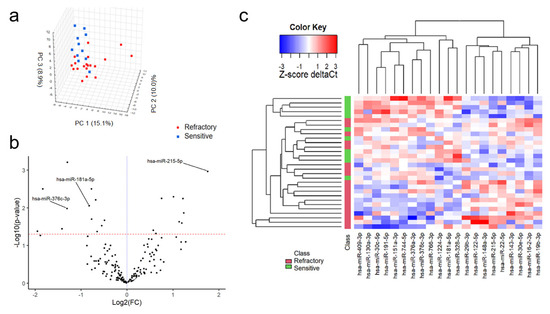
Figure 1.
Comparision of miRNA expression between MM patients sensitive and refractory to bortezomib-based treatment. 3D plot of principal comptonent analysis (PCA) score performed on all 155 miRNAs (a). Volcano plot of filtered miRNAs. miRNAs included in the logistic regression model are indicated by their labels (b). Heatmap of significantly differently expressed miRNAs between study subgroups (c).
Table 2.
List of miRNAs with significantly different expression between groups in univariate analysis.
In contrast, reduced expression of miR-744-5p, miR-151a-3p, miR-376a-3p, miR-191-5p, miR-181a-5p, miR-766-3p, miR-30c-5p, miR-130a-3p, miR-409-3p, miR-1224-3p and miR-328-3p was observed among the bortezomib-refractory patients compared to the bortezomib-sensitive patients (Table 2 and Figure 1c). To select a panel of miRNAs discriminating between refractory and sensitive group, a multivariate logistic regression model was generated. Univariate logistic regression analysis found 10 miRNAs to be significantly associated with refractoriness (Table 3).
Table 3.
Univariate logistic regression analysis for predicting refractoriness to bortezomib-based treatment in MM patients.
A forward stepwise and backward stepwise selection approach were used to restrict the model to the most predictive miRNAs. Forward stepwise selection yielded a final model with the lowest AIC value. In the final multivariate logistic regression model, only miR-215-5p (odds ratio [OR] = 3.87; 95%CI 1.21–12.39; p = 0.02), miR-376c-3p (OR = 0.18; 95%CI 0.04–0.81; p = 0.03) and miR-181a-5p (OR = 0.07; 95%CI 0.01–0.97; p = 0.05) were associated with refractoriness to bortezomib treatment (Table 4). The combination of miR-215-5p, miR-376c-3p and miR-181a-5p could discriminate refractory from sensitive patients with a very high area under the ROC curve (AUC) of 0.95 (95% CI: 0.84–1.00); sensitivity, specificity and accuracy were estimated as 0.95, 0.91, and 0.93 (Figure 2a).
Table 4.
Final multivariate regression model for predicting refractoriness to bortezomib-based treatment in MM patients.
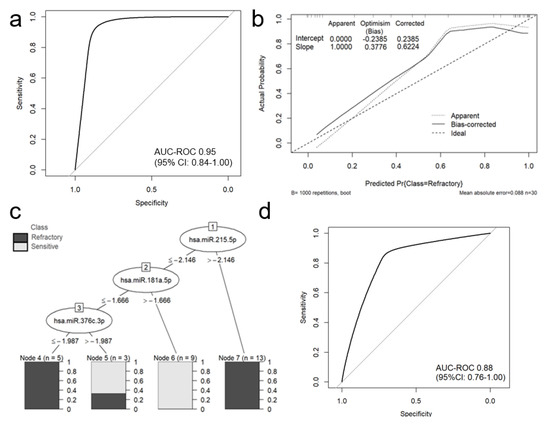
Figure 2.
The performance of a classification miRNA-based model in predicting refractoriness to bortezomib-based treatment in MM patients. The area under the ROC curve for logistic regression model was estimated as 0.9474 (95% CI: 0.8421-1.000) (a). Calibration plot of the mi-RNA-based logistic regression model, including the apparent and bias-corrected measures by bootstrapping (b). In the calibration plot, the predicted probability of the model is represented on the x-axis and the observed proportion of refractoriness to bortezomib-based treatment is represented on the y axis. The 45° line indicates perfect congruity between the predicted probability and the observed proportion of bortezomib refractoriness. J48 decision tree with completely accurate (100%) model, separating refractory to bortezomib and sensitive MM patients (c). ROC analysis for 10-fold cross-validation (d).
The Hosmer-Lemeshow test for goodness of fit indicated good fit of the model (p = 0.10). Internal validation of the selected panel model using bootstrap optimism corrected AUC suggests that the panel offers high discriminatory power when applied to independent samples (optimism-corrected AUC of 0.93, which was within the 95% CI for AUC on whole dataset).
We examined mi-RNAs expression between treatment-naive and previously treated patients- the results are given in Table S1. Briefly, among 21 differentially expressed miRNAs in bortezomib resistant-patients, only 2 miRNAs- hsa-miR-328-3p and hsa-miR-30e-5p were differentially expressed between treatment-naive and previously treated patients. These miRNAs were not statistically significant in univariate logistic regression models and were not included into building process of the final model.
The calibration plot of predicted and actual probability showed good correlation in low and in the intermediate probability area. The calibration plot, including the bias-corrected measures is given in Figure 2b. However, it appeared to have poor correlation in high probability areas. Additionally, a J48 (C4.5 classifier) decision tree was generated using miR-215-5p, miR-376c-3p and miR-181a-5p; this tree accurately separated refractory and sensitive patients in a training set (Figure 2c). ROC analysis for 10-fold cross-validation demonstrated preserved good discriminative ability of the model with AUC 0.88 (95%CI: 0.76–1.00) (Figure 2d).
Moreover, the resultant differentially expressed miRNAs were analyzed through the use of Ingenuity Pathway Analysis. MiRNA targets were found using IPA’s miRNA target filter for experimentally validated (Table S2) and putative predicted targets (high confidence level- Table S3)—in silico analyses. We have also generated gene networks based on miRNAs exhibiting significant changes in patients refractory to bortezomib-based treatment (Figure 3).
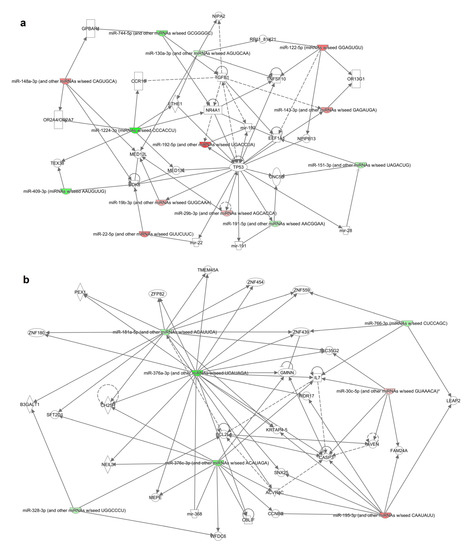
Figure 3.
Gene networks (a,b) identified from the differentially expressed miRNA’s target genes list generated by IPA. Solid and dotted lines indicate direct and indirect relationships, respectively. Color intensity indicates upregulation (red) and downregulation (green).
3. Discussion
Serum miRNAs, with their noticeable stability and unique expression pattern are robust novel non-invasive biomarkers that can be used for cancer detection and identifying disease characteristics [25]. To our knowledge, this is the first study to demonstrate that the serum expression of several miRNAs differs between patients refractory to bortezomib and those who are sensitive. The present study identifies 21 serum miRNAs differentially expressed in patients with MM according to the bortezomib sensitivity based on univariate analysis. The serum levels of nine miRNAs were lowered, and another 12 were elevated, in bortezomib-refractory patients compared to the bortezomib-sensitive patients. Few studies have demonstrated the significance of miRNAs in MM patients, especially in the context of drug resistance. However, some of them have been previously reported as important in the biology and clinical implications of MM [18,26,27,28,29,30,31].
In the present study, higher serum levels of miR-215-5p, miR-143-3p, miR-19b-3p, miR-16-2-3p, miR-122-5p, miR-148a-3p, miR-22-5p, miR-30e-5p and miR-29b-3p were seen in bortezomib-refractory patients compared to bortezomib-sensitive patients (Table 2). MiR-215-5p, miR-30e-5p and miR-29b-3p have been found to play important roles in the biology of MM. In a previous study, miR-215-5p was negatively correlated with runt-related transcription factor 1 (RUNX1) expression in MM clinical bone marrow samples [32]. In addition, miR-215-5p overexpression increased cell proliferation and inhibited MM cell apoptosis by targeting RUNX1 and suppressing the activation of the PI3K/AKT/mTOR pathway. These findings indicate that overexpression of miR-215-5p inhibits the proliferation of MM cells and promotes their apoptosis, while also inducing the cell cycle progression from G1/S phase of MM cells; hence, miR-215-5p appears to be an anti-oncogene of MM. MiR-30e-5p was differentially expressed in MM patients with and without extramedullary relapse [33].
In another study in which fluorescence in situ hybridization was used, miR-30e-5p was found to be a biomarker for distinguishing MM with 1q21 gains from MM [33]. In vitro and in vivo studies both suggest that miR-29b plays a tumor suppressor function. MiR-29b-3p is involved in bortezomib resistance in MM patients. Pan et al. reported recently that LncRNA H19 induces bortezomib resistance by targeting MCL-1 via miR-29b-3p [26]. It is suggested, that H19/miR-29b-3p/MCL-1 may be a novel and promising therapeutic target for coping with drug resistance in MM treatment [34,35]. An earlier study performed in MM showed that miR-143-3p expression is regulated by long non-coding RNA Sox2 overlapping transcript (SOX2OT) [35].
To the best of our knowledge, six of the miRNAs overexpressed in bortezomib refractory patients (miR -143-3p, miR-19b-3p, miR-16-2-3p, miR-122-5p, miR-148a-3p and miR-22-5p) have not been investigated in MM patients yet. However, the results of several studies indicate the involvement of these molecules in the biology of other neoplasms. MiR-143-3p was identified as the key specific mediator of KIAA1429 expression in osteosarcoma cells [36]. In addition, it is also involved in the regulation of cell proliferation in cervical cancer, esophageal cancer, breast cancer, lung cancer and other neoplasms [37,38,39,40]. MiR19b-3p has also been implicated in the pathogenesis of several cancers in humans [41,42]. Jiang et al. found miR-19b-3p to promote cell proliferation and induce resistance to oxaliplatin-based chemotherapy in colon cancer in vitro, and promote tumorigenesis in vivo [43]; these findings are similar to our present observations regarding higher expression of this miRNA in bortezomib-refractory MM patients. MiR-19b-3p is highly expressed in colon cancer tissues, and although its downregulation has been associated with decreased cell proliferation, it has not been found to have any effect on tumor invasion [43]. Elsewhere, overexpression of miR-19b-3p was observed to decrease the sensitivity of nasopharyngeal carcinoma cells to radiotherapy, whereas down-regulation resulted in the opposite results [44]. In addition, in patients with colon cancer miR-19b-3p is an independent prognostic factor associated with disease-free survival and overall survival. These results suggest a role of miR-19b-3p as potential therapeutic target against chemotherapy resistance, including MM.
MiR-16-2-3p demonstrates strong tumor suppressive and antimetastatic properties in osteosarcoma and other neoplasms [45]. Several studies suggest that miR-122-5p may be a potential prognostic factor and therapeutic target for patients with pancreatic ductal adenocarcinoma, hepatocellular carcinoma and other neoplasms [46,47]. In addition miR-122-5p acts as a tumor suppressor in gastric cancer progression and inhibits the proliferation, migration, and invasion of gastric cancer cells [48,49]. Biologically, miR-148a-3p influences cellular differentiation and the cellular development of several tumors; it also promotes the differentiation of activated B cells to plasma cells and increases survival of plasma cells by inhibiting the transcription factors BACH2 and MITF [50]. MiR-148a-3p was upregulated in some cancers and downregulated in others [51]. In particular, increased miR-148a-3p serum level is observed in prostate cancer, glioma and osteosarcoma [52]. Upregulation of miR-22-5p was has also been recorded in cholangiocarcinoma cell lines [53]. In addition, miR-22 acts as a novel biomarker for non-small cell lung cancer and inhibits tumor growth and metastasis [54,55]. miR-22 has also been found to be significantly associated with osteosarcoma grade, impaired osteosarcoma cell proliferation and epithelial-mesenchymal transition progression [56].
The serum levels of miR-744-5p, miR-151a-3p, miR-376a-3p, miR-191-5p, miR-181a-5p, miR-766-3p, miR-30c-5p, miR-130a-3p, miR-409-3p, miR-1224-3p and miR-328-3p, which were lower in the refractory group than the sensitive patients (Table 2). MiR-181a-5p is a direct target of colon cancer associated transcript-1 (CCAT1), and its repression could rescue the inhibition of CCAT1 knockdown on MM progression [57]. MiR-181a-5p has previously been found to be a target of LncRNA MALAT1, whose interference decreased the expression of miR-181a-5p and inhibited the proliferation and adhesion of myeloma cells [58].
Although no previous studies have confirmed that other miRNAs are down-regulated in bortezomib refractory MM, they are known to be involved in the development of various cancers, and some of them play an important role in cancer progression. Overexpression of miR-744-5p was found to inhibit the proliferation, migration, and invasion of cancer cells in epithelial ovarian cancer, non-small cell lung cancer and in nasopharyngeal carcinoma [59,60]. MiR-376a is silenced in several types of cancer, suggesting its role as tumor suppressor for the development and progression of cancer [61,62]. MiR-191-5p is believed to act as a tumor promoter: elevated miR-191-5p levels have been correlated with the advanced stages, metastasis, and high pathological grade of hepatocellular carcinoma [63]. Serum exosomal miR-766-3p is also thought to be a prognostic marker for esophageal squamous cell carcinoma with its serum expression being associated with poor prognosis and a significantly worse survival [64]. In addition, miR-766 acts as an oncogene in the development of colorectal cancer and its overexpression promotes cell proliferation in this disease [65]. In addition, higher expression of miR-766-3p was found in the plasma of patients with colorectal cancer compared to healthy controls [66]. MiR-30c-5p is involved in many biological events, including cell apoptosis, growth, and differentiation. In a recent study, decreased expression of miR-30c-5p was associated with an unfavorable course of the renal cell carcinoma [67]. MiR-130a-3p, a member of the miR-130 family, is an important regulator of tumor progression and metastasis [68]. While the members of the miR-130 family are upregulated in several cancers and promote cell proliferation, they have also been found to be downregulated and inhibit cell proliferation in a number of studies [25,69,70,71,72,73].
Some of the miRNAs identified in our study as being differentially expressed in bortezomib refractory and sensitive MM patients are known to be potentially important for prediction of response to treatment in other cancers. MiR-151a-3p could predict the response to azacitidine treatment in myelodysplastic syndromes when tested in combination with miR-423-5p, miR-126-3p miR-125a-5p, and miR-199a-3p [74]. Using Cox regression and risk-score analysis, Ji et al. identified miR-328-3p and three additional miRNA signature (miR-652-3p, miR-342-3p and miR-501-3p) that can be used for the prediction of treatment outcome including tumor relapse and the OS of patients with colorectal cancer [75]. In the present study, these miRNAs were found to be less useful for the prediction of bortezomib refractoriness in MM patients; however, the final version of the multivariate logistic regression model constructed to predict refractoriness to bortezomib-based treatment in MM patients found only miR-215-5p, miR-376c-3p and miR-181a-5p to be associated with refractoriness to bortezomib treatment (Table 4, Figure 2a). Our findings, indicating the differential expression of miRNAs between bortezomib-refractory and bortezomib-sensitive patients, suggest that these circulating miRNAs may play an important role in the correct treatment selection in MM patients.
Finally, combining miRNAs with anti-MM drugs may improve treatment efficacy and prevent drug resistance among patients with MM [18,76,77,78]. Theoretically, it is possible that inhibition of miRNAs overexpressed in bortezomib-refractory MM can improve drug sensitivity. The possible synergistic effect between miRNA inhibition and anti-MM drugs has been investigated in preclinical studies. Inhibition of miR-221/222 reduced the drug resistance of MM1R MM cells to dexamethasone via upregulation of the pro-apoptotic PUMA in vitro and improved mouse survival in vivo [77].
Elsewhere, miR-221/222 overcame melphalan resistance and triggered apoptosis of MM cells in vitro: Gulla et al. demonstrated that inhibition of miR-221/222 via LNA-i-miR-221 triggers cell apoptosis in vitro and restores drug sensitivity in melphalan-refractory MM cells [22]. In vivo treatment of SCID/NOD mice bearing human melphalan-refractory MM xenografts with systemic locked nucleic acid (LNA) inhibitors of miR-221 (LNA-i-miR-221) combined with melphalan increased the antitumor effects seen in tumors retrieved from treated mice [22]. In another study, miR-29b replacement disrupted the autophagy pathway and synergistically enhanced the antimyeloma effect of bortezomib in bortezomib-resistant MM cells, increasing the antimyeloma effect of bortezomib [79]. In addition, MiR-21 inhibition combined with the cytotoxic drugs dexamethasone, doxorubicin, or bortezomib inhibited myeloma cell survival more effectively than either treatment alone [80]. These results suggest that influencing miRNA expression may be an effective strategy for improving anti-myeloma therapy.
Our findings demonstrated that serum expression of several miRNAs differs between patients who are refractory to bortezomib and those who are sensitive. However, it is important to examine the roles of these miRNAs in the regulation of recently-identified genes associated with bortezomib resistance, such as PSMB5, CDK5 and CYP1A1, in MM cells [81,82,83]. It has been reported previously that miRNAs can modulate the expression of genes responsible for bortezomib refractoriness in MM cells; for example, CDK5 expression may be related to miR-27a-5p activity [84]. However, to determine the degree of this modulation, further studies are needed of the miRNAs identified as being associated with bortezomib refractoriness.
4. Materials and Methods
4.1. Patients
A total of 30 MM patients who were admitted to the Department of Hematology, Copernicus Memorial Hospital, Lodz, Poland were included in the study. The group of patients included 18 men and 12 women with a mean age of 64 years (range, 39–81 years). Their demographic, clinical and laboratory details are shown in Table 1. All of the patients received bortezomib treatment as the first line treatment or in progression after previous therapy. No patients had received bortezomib-based therapy prior to the study. The participants were classified according to their response to bortezomib-based therapy as either bortezomib sensitive or bortezomib refractory [5].
Response to treatment and relapse/progression events were classified according to the International Myeloma Working Group (IMWG) [85,86]. Sensitive patients had CR or PR after bortezomib-based therapies longer than six months after treatment discontinuation [86,87,88].
The study was conducted according to good clinical and laboratory practice rules and the principles of the Declaration of Helsinki. All procedures were approved by the local ethical committee (The Ethical Committee of the Medical University of Lodz, No RNN/103/16/KE). Each patient signed the informed consent for all examinations and procedures.
4.2. Serum Collection
Venous blood samples were collected from MM patients before treatment with bortezomib based regimens. Peripheral blood was collected in serum separating tubes and processed within 2 h of collection by centrifugation at 2400× g for 10 min. Serum samples were stored at −80 °C. for further use.
4.3. miRNA Isolation
Isolation of total RNA including miRNA was performed from serum using the miRNeasy Serum/Plasma Advanced Kit (Qiagen, Germantown, MD, USA) according to the manufacturer’s protocol. Samples of 2 μL of the final eluate was used as the sample input. To allow for normalization of sample-to-sample variation in RNA isolation, prior to purification, each serum sample was spiked with UniSp2 (2 fmol), UniSp4 (0.02 fmol), UniSp5 (0.00002 fmol), each at a different concentration in 100-fold increments and UniSp6 (0.075 fmol) and cel-miR-39-3p (0.001 fmol) as a positive control for cDNA synthesis. RNA quality was determined with Agilent High Sensitivity RNA ScreenTape using 2200 TapeStation (Agilent Technologies, Santa Clara, CA, USA). Directly after isolation RNA was subjected to the reverse transcription process.
4.4. Determination of MicroRNA Profile
MmiRNA profiling was performed by miRCURY LNA RT Kit (Qiagen) and used to prepare the reverse transcription reaction according to the manufacturer’s recommendations. Real-time PCR was performed on a LightCycler480 Real Time PCR System (Roche, Pleasanton, CA, USA) using and miRCURY LNA miRNA miRNome PCR Panel I and II. This array enables accurate quantitation of 752 human microRNAs.
4.5. Reverse Transcriptase Reaction
Mature miRNAs were polyadenylated by poly(A) polymerase and reverse transcribed into cDNA using oligo-dT primers. Polyadenylation and reverse transcription were performed in parallel in the same tube. The oligo-dT primers have a 3′ degenerate anchor that allows amplification of mature miRNA in the real-time PCR step. MiRCURY LNA Reverse Transcription Kit was purchased from Qiagen and used to synthesize cDNA according to the guidelines provided by the manufacturer. Two µL of isolate was added to the reaction tube to make up a final volume of 10 μL reaction mix. The reaction took place at 42 °C for 60 min and were then inactivated at 95 °C for 5 min in thermal cycler.
4.6. Real Time PCR (qPCR)
The expression of 752 miRNAs were determined in all patients using miRCURY LNA miRNome Human PCR Panel I and II (Qiagen). Real-time PCR was performed on LightCycler480 II (Roche) instrument. Three µL of cDNA template (diluted 1:60) was used in each PCR reaction. The reaction was performed at 95 °C for 2 min, followed by 45 amplification cycles at 95 °C for 10 s and 56 °C for 1 min. Fluorescence was measured after each cycle. Relative quantification of mRNA was determined by a comparative Ct method.
4.7. Statistical Analysis
4.7.1. Data Preparation
miRNAs were filtered for miRNAs present in 100% of both groups, leaving 155 miRNAs to further analysis. After miRNA selection, batch correction was performed using ComBat [89]. The stability of miRNAs was measured by NormiRazor [90,91]. This is an integrative tool which implements existing normalization algorithms (geNorm, NormFinder and BestKeeper) in a parallel manner. The data was normalized by using used the mean expression value of three miRNAs in a given sample (miR-23b-3p, miR-151a-5p and miR-152-3p), which proved to be the most stable normalization factor (according to NormiRazor). The formula used to calculate the normalized Ct values was:
Normalized ΔCt = mean Ct of miR-23b-3p, miR-151a-5p and miR-152-3p—Ct miRNA.
This approach results in higher values for higher miRNA expression enabling easy biomarker interpretation. Normalized ΔCt for all samples and with class assignments were provided as Table S4.
4.7.2. Analysis
Nominal variables were expressed as percentages and analyzed using the Chi-square test with appropriate corrections if needed: the Yates correction for continuity or Fisher’s exact test. The normality of the distribution of continuous variables was verified with the Shapiro-Wilk test. For continuous variables, the difference between two groups was evaluated using a two-sided independent Student’s t test when the data was normally distributed, and with the Mann-Whitney U test when the assumption of normality was not met or if the variable was ordinal. Continuous variables were presented as mean ± standard deviation (SD) or medians with 25% to 75% values according to the data distribution. For visual representation of multidimensional data, principal component analysis (PCA) and unsupervised hierarchical clustering were performed.
For a more comprehensive analysis, a logistic regression model was generated that used the refractoriness to a bortezomib-based regimen as outcome and miRNAs as predictors. The variables were preselected for the development of the classification model using Student’s t-test. All miRNA with FDR < 0.2 were chosen as candidate variables in this step. We estimated both a univariate model for each of the selected miRNA and a multivariate model that included all selected predictors. Forward stepwise and backward stepwise selection approaches were used to restrict the model to the most predictive miRNAs. The model with the lowest AIC (The Akaike information criterion) value was chosen as the final model. The predictive power of the final model was evaluated by receiver operating characteristics (ROC) and area under the curve (AUC) analysis to determine the ability of the biomarker panel to accurately predict refractoriness to the bortezomib-based treatment regimen. The goodness of fit of the model was tested with the Hosmer-Lemeshow statistic, where high p values indicate a good fit.
4.7.3. Internal Validation
Bootstrap samples were used to test for possible overfitting by determining optimism values on calibration measures. The bootstrap analysis was performed on 1000 different samples of the same sample size drawn with replacements from the original sample. Optimism, which is a measurement of internal model validation that refers to the absolute magnitude of bias, equals the difference between respective statistics of the bootstrap sample (bootstrap performance) and the bootstrap model in the original sample (test performance) [92]. Bias-corrected (bc) AUC was calculated as the mean of AUC metrics derived from 1000 bootstrap samples. Additionally, J48 (C4.5 classifier) decision tree was generated and tested in 10 times repeated 10-fold cross-validation manner to reduce the bias and variance of the estimations. Lastly, to find further biological insights, the resultant differentially expressed miRNAs were analyzed through the use of IPA (Ingenuity Pathway Analysis, Qiagen Inc.).
All statistical analyses were conducted using Statistica Version 13.1 (TIBCO, Palo Alto, CA, USA) and R programming language (version 4.0.2). Most of the analysis utilized our miRNAselector R package [93] P values lower than 0.05 were considered statistically significant. Benjamini and Hochberg multiple comparisons correction was used to adjust individual raw p values.
5. Conclusions
In conclusion, our data demonstrate differential serum miRNA expression between patients with MM who are sensitive to bortezomib-based therapies and those who are not. To our knowledge, this is the first study to demonstrate such differences between these two groups of patients. These results indicate a promising therapeutic target for coping with drug resistance in MM treatment. In addition, we describe the development of a multivariate regression model for predicting refractoriness to bortezomib-based treatment in MM patients. Our findings provide evidence that combined expression levels of miR-215-5p, miR-376c-3p and miR-181a-5p can be used to predict the response to bortezomib treatment. Internal validation of the selected panel suggests that the discriminatory power of the panel will be high when applied to independent samples. In addition, miRNAs are promising therapeutic target for coping with drug resistance in MM treatment. However, the clinical and biological importance of these findings need further investigation.
Supplementary Materials
The following are available online at https://www.mdpi.com/2072-6694/12/9/2569/s1, Table S1: differentially expressed mi-RNAs between treatment-naive and previously treated patients- among 21 differentially expressed miRNAs in bortezomib resistant-patients, only 2 miRNAs- hsa-miR-328-3p and hsa-miR-30e-5p were differentially expressed between treatment-naive and previously treated patients, Table S2: Putative miRNA targets found using Ingenuity miRNA target filter for experimentally validated targets, Table S3: Putative miRNA targets found using Ingenuity miRNA target filter for experimentally validated targets and putative predicted targets (high confidence level), Table S4: Normalized ΔCt for all samples and with class assignments.
Author Contributions
P.R., I.D. and D.J. performed the experiments; D.M., K.S. and W.F. performed statistical analyses; P.R., I.D., D.M. and T.R. designed the study and wrote the paper. P.R., I.D., D.J., D.M., E.W., M.S.-R., M.M., K.S., W.F., J.S., P.S. and T.R. examined the available material, reviewed and revised the manuscript and provided their approval of the final version of the manuscript. All authors agree to be accountable for all aspects of the work. All authors have read and agreed to the published version of the manuscript.
Funding
This work was supported by a grant from the NCN (2016/23/B/NZ5/02529).
Acknowledgments
We thank Edward Lowczowski from the Medical University of Lodz for editorial assistance.
Conflicts of Interest
The authors declare no conflict of interest. The funders had no role in the design of the study; in the collection, analyses, or interpretation of data; in the writing of the manuscript, or in the decision to publish the results.
Abbreviations
| BM | bone marrow |
| Bcl-2 | B-Cell Leukemia/Lymphoma 2 |
| FISH | fluorescent in situ hybridization |
| MM | Multiple myeloma |
| MiRNAs | MicroRNAs |
| MeV | Multi Experiment Viewer |
| Mcl-1 | myeloid cell leukemia sequence 1 |
| MGUS | monoclonal gammopathy of unknown significance |
| qRT-PCR | quantitative real-time polymerase chain reaction |
| CLL | lymphocytic leukemia |
| CR | complete response |
| VGPR | very good partial response |
| OS | overall survival |
| PCR | polymerase chain reaction |
| PFS | progression free survival |
| PR | partial response |
| ROC | receiver operating characteristics |
| RUNX1 | runt-related transcription factor 1 |
| AUC | area under the curve |
References
- Palumbo, A.; Anderson, K. Multiple myeloma. N. Engl. J. Med. 2011, 364, 1046–1060. [Google Scholar] [CrossRef] [PubMed]
- Hideshima, T.; Mitsiades, C.; Tonon, G.; Richardson, P.G.; Anderson, K.C. Understanding multiple myeloma pathogenesis in the bone marrow to identify new therapeutic targets. Nat. Rev. Cancer 2007, 7, 585–598. [Google Scholar] [CrossRef] [PubMed]
- Becker, N. Epidemiology of multiple myeloma. Methods Mol. Biol. 2011, 183, 25–35. [Google Scholar]
- Morgan, G.; Walker, B.A.; Davies, F.E. The genetic architecture of multiple myeloma. Nat. Rev. Cancer 2012, 12, 335–348. [Google Scholar] [CrossRef] [PubMed]
- Robak, P.; Węgłowska, E.; Dróżdż, I.; Mikulski, D.; Jarych, D.; Ferlińska, M.; Wawrzyniak, E.; Misiewicz, M.; Smolewski, P.; Fendler, W.; et al. Cytokine and chemokine profile in patients with multiple myeloma treated with bortezomib. Mediat. Inflamm. 2020, 2020, 1835836. [Google Scholar] [CrossRef]
- Dimopoulos, M.A.; Richardson, P.G.; Moreau, P.; Anderson, K.C. Current treatment landscape for relapsed and/or refractory multiple myeloma. Nat. Rev. Clin. Oncol. 2014, 12, 42–54. [Google Scholar] [CrossRef]
- Robak, P.; Robak, T. Bortezomib for the treatment of hematologic malignancies: 15 years later. Drugs RD 2019, 19, 73–92. [Google Scholar] [CrossRef]
- Mohan, M.; Matin, A.; Davies, F. Update on the optimal use of bortezomib in the treatment of multiple myeloma. Cancer Manag. Res. 2017, 9, 51–63. [Google Scholar] [CrossRef]
- Robak, P.; Drozdz, I.; Szemraj, J.; Robak, T. Drug resistance in multiple myeloma. Cancer Treat. Rev. 2018, 70, 199–208. [Google Scholar] [CrossRef]
- Bartel, B. MicroRNAs: Genomics, biogenesis, mechanism, and function. Cell 2004, 116, 281–297. [Google Scholar] [CrossRef]
- Handa, H.; Murakami, Y.; Ishihara, R.; Kimura-Masuda, K.; Masuda, Y. The role and function of microrna in the pathogenesis of multiple myeloma. Cancers 2019, 11, 1738. [Google Scholar] [CrossRef] [PubMed]
- Pourhanifeh, M.H.; Mahjoubin-Tehran, M.; Shafiee, A.; Hajighadimi, S.; Moradizarmehri, S.; Mirzaei, H.; Asemi, Z. MicroRNAs and exosomes: Small molecules with big actions in multiple myeloma pathogenesis. IUBMB Life 2019, 72, 314–333. [Google Scholar] [CrossRef] [PubMed]
- Liu, M.; Huang, F.; Zhang, D.; Ju, J.; Wu, X.B.; Wang, Y.; Wang, Y.; Wu, Y.; Nie, M.; Li, Z.; et al. Heterochromatin protein HP1gamma promotes colorectal cancer progression and is regulated by miR-30a. Cancer Res. 2015, 75, 4593–4604. [Google Scholar] [CrossRef] [PubMed]
- Al Masri, A.; Price-Troska, T.; Chesi, M.; Chung, T.-H.; Kim, S.; Carpten, J.; Bergsagel, P.L.; Fonseca, R. MicroRNA expression analysis in multiple myeloma. Blood 2005, 106, 1554. [Google Scholar] [CrossRef]
- Roccaro, A.M.; Sacco, A.; Thompson, B.; Leleu, X.; Azab, A.K.; Azab, F.; Runnels, J.; Jia, X.; Ngo, H.T.; Melhem, M.R.; et al. MicroRNAs 15a and 16 regulate tumor proliferation in multiple myeloma. Blood 2009, 113, 6669–6680. [Google Scholar] [CrossRef]
- Löffler, D.; Brocke-Heidrich, K.; Pfeifer, G.; Stocsits, C.; Hackermüller, J.; Kretzschmar, A.K.; Burger, R.; Gramatzki, M.; Blumert, C.; Bauer, K.; et al. Interleukin-6–dependent survival of multiple myeloma cells involves the Stat3-mediated induction of microRNA-21 through a highly conserved enhancer. Blood 2007, 110, 1330–1333. [Google Scholar] [CrossRef]
- Gupta, N.; Kumar, R.; Seth, T.; Garg, B.; Sati, H.C.; Sharma, A. Clinical significance of circulatory microRNA-203 in serum as novel potential diagnostic marker for multiple myeloma. J. Cancer Res. Clin. Oncol. 2019, 145, 1601–1611. [Google Scholar] [CrossRef]
- DeSantis, V.; Saltarella, I.; Lamanuzzi, A.; Melaccio, A.; Solimando, A.G.; Mariggiò, M.A.; Racanelli, V.; Paradiso, A.; Vacca, A.; Frassanito, M.A. MicroRNAs-based nano-strategies as new therapeutic approach in multiple myeloma to overcome disease progression and drug resistance. Int. J. Mol. Sci. 2020, 21, 3084. [Google Scholar] [CrossRef]
- Abdi, J.; Jian, H.; Chang, H. Role of micro-RNAs in drug resistance of multiple myeloma. Oncotarget 2016, 7, 60723–60735. [Google Scholar] [CrossRef]
- Hao, M.; Zhang, L.; An, G.; Sui, W.; Yu, Z.; Zou, D.; Xu, Y.; Chang, H.; Qiu, L. Suppressing miRNA-15a/-16 expression by interleukin-6 enhances drug-resistance in myeloma cells. J. Hematol. Oncol. 2011, 4, 37. [Google Scholar] [CrossRef]
- Di Martino, M.T.; Gullà, A.; Cantafio, M.E.; Lionetti, M.; Leone, E.; Amodio, N.; Guzzi, P.H.; Foresta, U.; Conforti, F.; Cannataro, M.; et al. In vitro and in vivo anti-tumor activity of miR-221/222 inhibitors in multiple myeloma. Oncotarget 2013, 4, 242–255. [Google Scholar] [CrossRef] [PubMed]
- Gullà, A.; Di Martino, M.T.; Cantafio, M.E.G.; Morelli, E.; Amodio, N.; Botta, C.; Pitari, M.R.; Lio, S.G.; Britti, D.; Stamato, M.A.; et al. A 13 mer LNA-i-miR-221 inhibitor restores drug sensitivity in melphalan-refractory multiple myeloma cells. Clin. Cancer Res. 2015, 22, 1222–1233. [Google Scholar] [CrossRef] [PubMed]
- Yu, X.; Zheng, H.; Chan, M.T.; Wu, W.K. Modulation of chemoresponsiveness to platinum-based agents by microRNAs in cancer. Am. J. Cancer Res. 2017, 7, 1769–1778. [Google Scholar]
- Liu, P.; Wu, X.; Dai, L.; Ge, Z.; Gao, C.; Zhang, H.; Wang, F.; Zhang, X.; Chen, B. Gambogenic acid exerts antitumor activity in hypoxic multiple myeloma cells by regulation of miR-21. J. Cancer 2017, 8, 3278–3286. [Google Scholar] [CrossRef] [PubMed]
- Wang, J.; Zhang, C.; Peng, X.; Liu, K.; Zhao, L.; Chen, X.; Yu, H.; Lai, Y. A combination of four serum miRNAs for screening of lung adenocarcinoma. Hum. Cell 2020, 1–9. [Google Scholar] [CrossRef]
- Pan, Y.; Zhang, Y.; Liu, W.; Huang, Y.; Shen, X.; Jing, R.; Pu, J.; Wang, X.; Ju, S.; Cong, H.; et al. LncRNA H19 overexpression induces bortezomib resistance in multiple myeloma by targeting MCL-1 via miR-29b-3p. Cell Death Dis. 2019, 10, 1–14. [Google Scholar] [CrossRef]
- Rastgoo, N.; Wu, J.; Liu, M.; Pourabdollah, M.; Atenafu, E.G.; Reece, D.; Chen, W.; Chang, H. Targeting CD47/TNFAIP8 by miR-155 overcomes drug resistance and inhibits tumor growth through induction of phagocytosis and apoptosis in multiple myeloma. Haematologica 2019, 227579. [Google Scholar] [CrossRef]
- Abdi, J.; Rastgoo, N.; Chen, Y.; Chen, G.A.; Chang, H. Ectopic expression of BIRC5-targeting miR-101-3p overcomes bone marrow stroma-mediated drug resistance in multiple myeloma cells. BMC Cancer 2019, 19, 975. [Google Scholar] [CrossRef]
- Wu, Y.; Zhu, X.; Shen, R.; Huang, J.; Xu, X.; He, S. miR-182 contributes to cell adhesion-mediated drug resistance in multiple myeloma via targeting PDCD4. Pathol. Res. Pr. 2019, 215, 152603. [Google Scholar] [CrossRef]
- Amodio, N.; Cantafio, M.E.G.; Botta, C.; Agosti, V.; Federico, C.; Caracciolo, D.; Ronchetti, D.; Rossi, M.; Driessen, C.; Neri, A.; et al. Replacement of miR-155 elicits tumor suppressive activity and antagonizes bortezomib resistance in multiple myeloma. Cancers 2019, 11, 236. [Google Scholar] [CrossRef]
- Tian, F.; Zhan, Y.; Zhu, W.; Li, J.; Tang, M.; Chen, X.; Jiang, J. MicroRNA-497 inhibits multiple myeloma growth and increases susceptibility to bortezomib by targeting Bcl-2. Int. J. Mol. Med. 2018. [Google Scholar] [CrossRef]
- Liu, S.; Zhang, Y.; Huang, C.; Lin, S. miR-215-5p is an anticancer gene in multiple myeloma by targeting RUNX1 and deactivating the PI3K/AKT/mTOR pathway. J. Cell. Biochem. 2019, 121, 1475–1490. [Google Scholar] [CrossRef] [PubMed]
- Gregorová, J.; Vrábel, D.; Radová, L.A.; Gablo, N.; Almaši, M.; Štork, M.; Slabý, O.; Pour, L.; Minařík, J.; Ševčíková, S. [MicroRNA analysis for extramedullary multiple myeloma relapse]. Klin. Onkol. 2018, 31, 148–150. [Google Scholar] [PubMed]
- Liu, D.; Wang, J.; Liu, M. Long noncoding RNA TUG1 promotes proliferation and inhibits apoptosis in multiple myeloma by inhibiting miR-29b-3p. Biosci Rep. 2019, 39, BSR20182489. [Google Scholar] [CrossRef] [PubMed]
- Tianhua, Y.; Dianqiu, L.; Xuanhe, Z.; Zhe, Z.; Dongmei, G. Long non-coding RNA Sox2 overlapping transcript (SOX2OT) promotes multiple myeloma progression via microRNA-143-3p/c-MET axis. J. Cell. Mol. Med. 2020, 24, 5185–5194. [Google Scholar] [CrossRef]
- Han, Q.; Yang, J.; Yang, H.; Li, C.; Li, J.; Cao, Y. KIAA1429 promotes osteosarcoma progression by promoting stem cell properties and is regulated by miR-143-3p. Cell Cycle 2020, 19, 1172–1185. [Google Scholar] [CrossRef]
- Song, L.; Wang, L.; Pan, X.; Yang, C. lncRNA OIP5-AS1 targets ROCK1 to promote cell proliferation and inhibit cell apoptosis through a mechanism involving miR-143-3p in cervical cancer. Braz. J. Med. Boil. Res. 2020, 53. [Google Scholar] [CrossRef]
- Liu, H.; Zheng, M.; Zhao, Y.; Zhang, S. miR-143 inhibits migration and invasion through regulating LASP1 in human esophageal cancer. Int. J. Clin. Exp. Pathol. 2019, 12, 466–476. [Google Scholar]
- Li, G.-H.; Yu, J.-H.; Yang, B.; Gong, F.-C.; Zhang, K.-W. LncRNA LOXL1-AS1 inhibited cell proliferation, migration and invasion as well as induced apoptosis in breast cancer via regulating miR-143-3p. Eur. Rev. Med. Pharmacol. Sci. 2019, 23, 10400–10409. [Google Scholar] [CrossRef]
- Wang, H.; Deng, Q.; Lv, Z.; Ling, Y.; Hou, X.; Chen, Z.; Dinglin, X.; Ma, S.; Li, D.; Wu, Y.; et al. N6-methyladenosine induced miR-143-3p promotes the brain metastasis of lung cancer via regulation of VASH1. Mol. Cancer 2019, 18, 1–17. [Google Scholar] [CrossRef]
- Fang, L.-L.; Wang, X.-H.; Sun, B.-F.; Zhang, X.-D.; Zhu, X.-H.; Yu, Z.-J.; Luo, H. Expression, regulation and mechanism of action of the miR-17-92 cluster in tumor cells (Review). Int. J. Mol. Med. 2017, 40, 1624–1630. [Google Scholar] [CrossRef] [PubMed]
- Huhn, D.; Kousholt, A.N.; Sorensen, C.S.; Sartori, A.A. miR-19, a component of the oncogenic miR-17 approximately 92 cluster, targets the DNA-end resection factor CtIP. Oncogene 2015, 34, 3977–3984. [Google Scholar] [CrossRef] [PubMed]
- Jiang, T.; Ye, L.; Han, Z.; Liu, Y.; Yang, Y.; Peng, Z.; Fan, J. miR-19b-3p promotes colon cancer proliferation and oxaliplatin-based chemoresistance by targeting SMAD4: Validation by bioinformatics and experimental analyses. J. Exp. Clin. Cancer Res. 2017, 36, 131. [Google Scholar] [CrossRef] [PubMed]
- Huang, T.; Yin, L.; Wu, J.; Gu, J.J.; Wu, J.Z.; Chen, D.; Yu, H.L.; Ding, K.; Zhang, N.; Du, M.Y.; et al. Microrna-19b-3p regulates nasopharyngeal carcinoma radiosensitivity by targeting tnfaip3/nf-kappab axis. J. Exp. Clin. Cancer Res. 2016, 35, 188. [Google Scholar] [CrossRef] [PubMed]
- Maximov, V.V.; Akkawi, R.; Khawaled, S.; Salah, Z.; Jaber, L.; Barhoum, A.; Or, O.; Galasso, M.; Kurek, K.C.; Yavin, E.; et al. MiR-16-1-3p and miR-16-2-3p possess strong tumor suppressive and antimetastatic properties in osteosarcoma. Int. J. Cancer. 2019, 145, 3052–3063. [Google Scholar] [CrossRef]
- Jin, Y.; Wong, Y.S.; Goh, B.K.P.; Chan, C.Y.; Cheow, P.C.; Chow, P.K.; Lim, T.K.H.; Goh, G.B.B.; Krishnamoorthy, T.L.; Kumar, R.; et al. Circulating microRNAs as Potential Diagnostic and Prognostic Biomarkers in Hepatocellular Carcinoma. Sci. Rep. 2019, 9, 10464. [Google Scholar] [CrossRef]
- Liu, Y.-H.; Liu, J.-L.; Wang, Z.; Zhu, X.-H.; Chen, X.-B.; Wang, M.-Q. MiR-122-5p suppresses cell proliferation, migration and invasion by targeting SATB1 in nasopharyngeal carcinoma. Eur. Rev. Med. Pharmacol. Sci. 2019, 23, 622–629. [Google Scholar] [CrossRef]
- Liu, Q.; Jiang, J.; Fu, Y.; Liu, T.; Yu, Y.; Zhang, X. MiR-129-5p functions as a tumor suppressor in gastric cancer progression through targeting ADAM9. Biomed. Pharmacother. 2018, 105, 420–427. [Google Scholar] [CrossRef]
- Meng, L.; Chen, Z.; Jiang, Z.; Huang, T.; Hu, J.; Luo, P.; Zhang, H.; Huang, M.; Huang, L.; Chen, Y.; et al. MiR-122-5p suppresses the proliferation, migration, and invasion of gastric cancer cells by targeting LYN. Acta Biochim. Biophys. Sin. 2019, 52, 49–57. [Google Scholar] [CrossRef]
- Murata, T.; Takayama, K.; Katayama, S.; Urano, T.; Horie-Inoue, K.; Ikeda, K.; Takahashi, S.; Kawazu, C.; Hasegawa, A.; Ouchi, Y. miR-148a is an andro-gen-responsive microRNA that promotes LNCaPprostate cell growth by repressing its target CAND1expression. Prostate Cancer Prostatic Dis. 2010, 13, 356–361. [Google Scholar] [CrossRef]
- Li, Y.; Deng, X.; Zeng, X.; Peng, X. The Role of Mir-148a in Cancer. J. Cancer 2016, 7, 1233–1241. [Google Scholar] [CrossRef] [PubMed]
- Dybos, S.A.; Flatberg, A.; Halgunset, J.; Viset, T.; Rolfseng, T.; Kvam, S.; Skogseth, H. Increased levels of serum miR-148a-3p are associated with prostate cancer. APMIS 2018, 126, 722–731. [Google Scholar] [CrossRef] [PubMed]
- Jung, D.E.; Park, S.B.; Kim, K.; Kim, C.; Song, S.Y. CG200745, an HDAC inhibitor, induces anti-tumour effects in cholangiocarcinoma cell lines via miRNAs targeting the Hippo pathway. Sci. Rep. 2017, 7, 10921. [Google Scholar] [CrossRef] [PubMed]
- Xu, C.; Zheng, Y.; Lian, D.; Ye, S.; Yang, J.; Zeng, Z. Analysis of microRNA expression profile identifies novel biomarkers for non-small cell lung cancer. Tumori J. 2015, 101, 104–110. [Google Scholar] [CrossRef]
- Xin, M.; Qiao, Z.; Li, J.; Liu, J.; Song, S.; Zhao, X.; Miao, P.; Tang, T.; Wang, L.; Liu, W.; et al. miR-22 inhibits tumor growth and metastasis by targeting ATP citrate lyase: Evidence in osteosarcoma, prostate cancer, cervical cancer and lung cancer. Oncotarget 2016, 7, 44252–44265. [Google Scholar] [CrossRef]
- Zhu, S.-T.; Wang, X.; Wang, J.-Y.; Xi, G.-H.; Liu, Y. Downregulation of miR-22 contributes to epithelial-mesenchymal transition in osteosarcoma by targeting Twist1. Front. Oncol. 2020, 10. [Google Scholar] [CrossRef]
- Sun, Y.; Jiang, T.; Jia, Y.; Zou, J.; Wang, X.; Gu, W. LncRNA MALAT1/miR-181a-5p affects the proliferation and adhesion of myeloma cells via regulation of Hippo-YAP signaling pathway. Cell Cycle 2019, 18, 2509–2523. [Google Scholar] [CrossRef]
- Chen, S.; Shi, F.; Zhang, W.; Zhou, Y.; Huang, J. miR-744-5p inhibits non-small cell lung cancer proliferation and invasion by directly targeting PAX2. Technol. Cancer Res. Treat. 2019, 18, 1533033819876913. [Google Scholar] [CrossRef]
- Zhao, L.-G.; Wang, J.; Li, J.; Li, Q.-F. miR -744-5p inhibits cellular proliferation and invasion via targeting ARF1 in epithelial ovarian cancer. Kaohsiung J. Med. Sci. 2020, 12253. [Google Scholar] [CrossRef]
- Liu, H.; Cheng, Y.; Xu, Y.; Xu, H.; Lin, Z.; Fan, J.; Lang, J. The inhibition of tumor protein p53 by microRNA-151a-3p induced cell proliferation, migration and invasion in nasopharyngeal carcinoma. Biosci. Rep. 2019, 39. [Google Scholar] [CrossRef]
- Wang, Y.; Cong, W.; Wu, G.; Ju, X.; Li, Z.; Duan, X.; Wang, X.; Gao, H. MiR-376a suppresses the proliferation and invasion of non-small-cell lung cancer by targeting c-Myc. Cell Boil. Int. 2017, 42, 25–33. [Google Scholar] [CrossRef] [PubMed]
- Yao, S.; Liu, Y.; Yao, Z.; Zhao, Y.; Wang, H.; Xu, Y.; Zhang, J.; Li, J.; Yang, S. MicroRNA-376a regulates cell proliferation and apoptosis by targeting forkhead box protein P2 in lymphoma. Oncol. Lett. 2018, 16, 3169–3176. [Google Scholar] [CrossRef] [PubMed]
- Wu, H.Y.; Li, M.W.; Li, Q.Q.; Pang, Y.-Y.; Chen, G.; Lu, H.-P.; Pan, S.-L. Elevation of miR-191-5p level and its potential signaling pathways in hepatocellular carcinoma: A study validated by microarray and in-house qRT-PCR with 1,291 clinical samples. Int. J. Clin. Exp. Pathol. 2019, 12, 1439–1456. [Google Scholar] [PubMed]
- Liu, S.; Lin, Z.; Zheng, Z.; Rao, W.; Lin, Y.; Chen, H.; Xie, Q.; Chen, Y.; Hu, Z. Serum exsomal miR-766-3p expression is associated with poor prognosis of esophageal squamous cell carcinoma. Cancer Sci. 2020, 10. [Google Scholar] [CrossRef]
- Li, C.-F.; Li, Y.-C.; Chen, L.-B.; Li, D.-D.; Yang, L.; Jin, J.-P.; Zhang, B. MicroRNA-766 targeting regulation of SOX6 expression promoted cell proliferation of human colorectal cancer. OncoTargets Ther. 2015, 8, 2981–2988. [Google Scholar] [CrossRef] [PubMed]
- Ferracin, M.; Lupini, L.; Salamon, I.; Saccenti, E.; Zanzi, M.V.; Rocchi, A.; Da Ros, L.; Zagatti, B.; Musa, G.; Bassi, C.; et al. Absolute quantification of cell-free microRNAs in cancer patients. Oncotarget 2015, 6, 14545–14555. [Google Scholar] [CrossRef] [PubMed]
- Onyshchenko, K.V.; Voitsitskyi, T.V.; Grygorenko, V.M.O.; Saidakova, N.; Pereta, L.V.; Onyschuk, A.P.; Skrypkina, I.Y. Expression of micro-RNA hsa-miR-30c-5p and hsa-miR-138-1 in renal cell carcinoma. Exp. Oncol. 2020, 42. [Google Scholar] [CrossRef]
- Wang, Z.; Li, Z.; Fu, Y.; Han, L.; Tian, Y. MiRNA-130a-3p inhibits cell proliferation, migration, and TMZ resistance in glioblastoma by targeting Sp1. Am. J. Transl. Res. 2019, 11, 7272–7285. [Google Scholar]
- Jiang, H.; Yu, W.-W.; Wang, L.-L.; Peng, Y. miR-130a acts as a potential diagnostic biomarker and promotes gastric cancer migration, invasion and proliferation by targeting RUNX3. Oncol. Rep. 2015, 34, 1153–1161. [Google Scholar] [CrossRef]
- Li, B.; Huang, P.; Qiu, J.; Liao, Y.; Hong, J.; Yuan, Y. MicroRNA-130a is down-regulated in hepatocellular carcinoma and associates with poor prognosis. Med. Oncol. 2014, 31. [Google Scholar] [CrossRef]
- Zhu, X.; Zhao, H.; Lin, Z.; Zhang, G. Functional studies of miR-130a on the inhibitory pathways of apoptosis in patients with chronic myeloid leukemia. Cancer Gene Ther. 2015, 22, 573–580. [Google Scholar] [CrossRef] [PubMed]
- Pan, Y.; Wang, R.; Zhang, F.; Chen, Y.; Lv, Q.; Long, G.; Yang, K. MicroRNA-130a inhibits cell proliferation, invasion and migration in human breast cancer by targeting the RAB5A. Int. J. Clin. Exp. Pathol. 2015, 8, 384–393. [Google Scholar] [PubMed]
- An, Z.; Wang, D.; Yang, G.; Zhang, W.Q.; Ren, J.; Fu, J.L. Role of microRNA-130a in the pathogeneses of obstructive sleep apnea hypopnea syndrome-associated pulmonary hypertension by targeting the GAX gene. Medicine 2017, 96, e6746. [Google Scholar] [CrossRef] [PubMed]
- Hrustincova, A.; Krejcik, Z.; Kundrat, D.; Szikszai, K.; Belickova, M.; Pecherkova, P.; Klema, J.; Vesela, J.; Hruba, M.; Cermak, J.; et al. Circulating small noncoding RNAs have specific expression patterns in plasma and extracellular vesicles in myelodysplastic syndromes and are predictive of patient outcome. Cells 2020, 9, 794. [Google Scholar] [CrossRef]
- Ji, D.; Qiao, M.; Yao, Y.; Li, M.; Chen, H.; Dong, Q.; Jia, J.; Cui, X.; Li, Z.; Xia, J.; et al. Serum-based microRNA signature predicts relapse and therapeutic outcome of adjuvant chemotherapy in colorectal cancer patients. EBioMedicine 2018, 35, 189–197. [Google Scholar] [CrossRef]
- Zhu, B.; Ju, S.; Chu, H.; Shen, X.; Zhang, Y.; Luo, X.; Cong, H. The potential function of microRNAs asbiomarkers and therapeutic targets in multiple myeloma. Oncol. Lett. 2018, 15, 6094–6106. [Google Scholar] [CrossRef]
- Zhao, J.J.; Chu, Z.B.; Hu, Y.; Lin, J.; Wang, Z.; Jiang, M.; Chen, M.; Wang, X.; Kang, Y.; Zhou, Y.; et al. Targeting the miR-221-222/PUMA/BAK/BAX pathway abrogates dexamethasone resistance in multiple myeloma. Cancer Res. 2015, 75, 4384–4397. [Google Scholar] [CrossRef]
- Rastgoo, N.; Abdi, J.; Hou, J.; Chang, H. Role of epigenetics-microRNA axis in drug resistance of multiple myeloma. J. Hematol. Oncol. 2017, 10, 121. [Google Scholar] [CrossRef]
- Jagannathan, S.; Vad, N.; Vallabhapurapu, S.; Anderson, K.C.; Driscoll, J.J. MiR-29breplacement inhibits proteasomes and disrupts aggresome+autophagosome formation to enhance theantimyeloma benefit of bortezomib. Leukemia 2015, 29, 727–738. [Google Scholar] [CrossRef]
- Wang, X.; Li, C.; Ju, S.; Wang, Y.; Wang, H.; Zhong, R. Myeloma cell adhesion to bone marrow stromal cellsconfers drug resistance by microRNA-21 up-regulation. Leuk. Lymphoma 2011, 52, 1991–1998. [Google Scholar] [CrossRef]
- Barrio, S.; Stühmer, T.; Da Vià, M.C.; Barrio-Garcia, C.; Lehners, N.; Besse, A.; Cuenca, I.; Garitano-Trojaola, A.; Fink, S.; Leich, E.; et al. Spectrum and functional validation of PSMB5 mutations in multiple myeloma. Leukemy 2018, 33, 447–456. [Google Scholar] [CrossRef] [PubMed]
- Tang, H.; Xu, L.; Cen, X.; Yang, L.; Feng, J.; Li, G.; Zhu, H.; Gao, S.; Yu, Y.; Zhao, Y.; et al. CDK5 inhibition in vitro and in vivo induces cell death in myeloma and overcomes the obstacle of bortezomib resistance. Int. J. Mol. Med. 2020, 45, 1661–1672. [Google Scholar] [CrossRef] [PubMed]
- Xu, D.; Hu, J.; De Bruyne, E.; Menu, E.; Schots, R.; Vanderkerken, K.; Van Valckenborgh, E. Dll1/Notch activation contributes to bortezomib resistance by upregulating CYP1A1 in multiple myeloma. Biochem Biophys. Res. Commun. 2012, 428, 518–524. [Google Scholar] [CrossRef] [PubMed]
- Zhu, Y.X.; Tiedemann, R.; Shi, C.X.; Yin, H.; Schmidt, J.E.; Bruins, L.A.; Keats, J.J.; Braggio, E.; Sereduk, C.; Mousses, S.; et al. RNAi screen of the druggable genome identifies modulators of proteasome inhibitor sensitivity in myeloma including CDK5. Blood 2011, 117, 3847–3857. [Google Scholar] [CrossRef] [PubMed]
- Durie, B.G.M.; on behalf of the International Myeloma Working Group; Harousseau, J.-L.; Miguel, J.S.; Blade, J.; Barlogie, B.; Anderson, K.; Gertz, M.; Dimopoulos, M.; Westin, J.; et al. International uniform response criteria for multiple myeloma. Leukemia 2006, 20, 1467–1473. [Google Scholar] [CrossRef] [PubMed]
- Kyle, R.A.; Rajkumar, S.V. Criteria for diagnosis, staging, risk stratification and response assessment of multiple myeloma. Leukemia 2008, 23, 3–9. [Google Scholar] [CrossRef]
- Anderson, K.C.; Kyle, R.A.; Rajkumar, S.V.; Stewart, A.K.; Weber, D.; Richardson, P. ASH/FDA Panel on Clinical Endpoints in Multiple Myeloma. Clinically relevant end points and new drug approvals for myeloma. Leukemia 2008, 22, 231–239. [Google Scholar] [CrossRef]
- Laubach, J.P.; Mitsiades, C.S.; Mahindra, A.; Luskin, M.R.; Rosenblatt, J.; Ghobrial, I.; Schlossman, R.L.; Avigan, D.; Raje, N.; Munshi, N.C.; et al. Management of relapsed and relapsed/refractory multiple myeloma. J. Natl. Compr. Cancer Netw. 2011, 9, 1209–1216. [Google Scholar] [CrossRef]
- Johnson, W.E.; Li, C.; Rabinovic, A. Adjusting batch effects in microarray expression data using empirical Bayes methods. Biostatistic 2006, 8, 118–127. [Google Scholar] [CrossRef]
- Grabia, S.; Smyczynska, U.; Pagacz, K.; Fendler, W. NormiRazor—Tool Applying GPU-accelerated Computing for Determination of Internal References in MicroRNA Transcription Studies. BioRxiv 2020. [Google Scholar] [CrossRef]
- Pagacz, K.; Kucharski, P.; Smyczynska, U.; Grabia, S.; Chowdhury, D.; Fendler, W. A systemic approach to screening high-throughput RT-qPCR data for a suitable set of reference circulating miRNAs. BMC Genom. 2020, 21, 1–15. [Google Scholar] [CrossRef] [PubMed]
- Steyerberg, E.W.E.; Harrell, F.; Borsboom, G.J.; Eijkemans, M.J.; Vergouwe, Y.; Habbema, J.D. Internal validation of predictive models: Efficiency of some procedures for logistic regression analysis. J. Clin. Epidemiol. 2001, 54, 774–781. [Google Scholar] [CrossRef]
- miRNAselector—Environment, Docker-Based Application and R Package for Biomarker Signiture Selection from High-Throughput Experiments. Available online: https://kstawiski.github.io/miRNAselector/ (accessed on 5 July 2020).
© 2020 by the authors. Licensee MDPI, Basel, Switzerland. This article is an open access article distributed under the terms and conditions of the Creative Commons Attribution (CC BY) license (http://creativecommons.org/licenses/by/4.0/).