Article

Study of the Female Sex Survival Advantage in Melanoma—A Focus on X-Linked Epigenetic Regulators and Immune Responses in Two Cohorts

by
Abdullah Al Emran
1,2,
Jérémie Nsengimana
3,4,
Gaya Punnia-Moorthy
1,2,
Ulf Schmitz
5,6,7,
Stuart J. Gallagher
1,2,
Julia Newton-Bishop
3,†,
Jessamy C. Tiffen
1,2,† and
Peter Hersey
1,2,*,†
1
Melanoma Oncology and Immunology Program, The Centenary Institute, The University of Sydney, Royal Prince Alfred Hospital, Missenden Road, Camperdown NSW 2050, Australia
2
Melanoma Institute Australia, The University of Sydney, Sydney NSW 2006, Australia
3
Leeds Institute of Medical Research at St James’s, University of Leeds, Leeds LS2 9JT, UK
4
Biostatistics Research Group, Population Health Sciences Institute, Faculty of Medical Sciences, Newcastle University, Newcastle upon Tyne NE1 7RU, UK
5
Computational Biomedicine Lab Centenary Institute, The University of Sydney, Camperdown NSW 2050, Australia
6
Gene & Stem Cell Therapy Program Centenary Institute, The University of Sydney, Camperdown NSW 2050, Australia
7
Faculty of Medicine and Health, The University of Sydney, Camperdown NSW 2050, Australia
*
Author to whom correspondence should be addressed.
Equal contribution.
Cancers 2020, 12(8), 2082; https://doi.org/10.3390/cancers12082082
Submission received: 26 June 2020 / Revised: 15 July 2020 / Accepted: 23 July 2020 / Published: 28 July 2020
(This article belongs to the Section Cancer Biomarkers)

Abstract

:
Background: Survival from melanoma is strongly related to patient sex, with females having a survival rate almost twice that of males. Many explanations have been proposed but have not withstood critical scrutiny. Prior analysis of different cancers with a sex bias has identified six X-linked genes that escape X chromosome inactivation in females and are, therefore, potentially involved in sex differences in survival. Four of the genes are well-known epigenetic regulators that are known to influence the expression of hundreds of other genes and signaling pathways in cancer. Methods: Survival and interaction analysis were performed on the skin cutaneous melanoma (SKCM) cohort in The Cancer Genome Atlas (TCGA), comparing high vs. low expression of KDM6A, ATRX, KDM5C, and DDX3X. The Leeds melanoma cohort (LMC) on 678 patients with primary melanoma was used as a validation cohort. Results: Analysis of TCGA data revealed that two of these genes—KDM6A and ATRX—were associated with improved survival from melanoma. Tumoral KDM6A was expressed at higher levels in females and was associated with inferred lymphoid infiltration into melanoma. Gene set analysis of high KDM6A showed strong associations with immune responses and downregulation of genes associated with Myc and other oncogenic pathways. The LMC analysis confirmed the prognostic significance of KDM6A and its interaction with EZH2 but also revealed the expression of KDM5C and DDX3X to be prognostically significant. The analysis also confirmed a partial correlation of KDM6A with immune tumor infiltrates. Conclusion: When considered together, the results from these two series are consistent with the involvement of X-linked epigenetic regulators in the improved survival of females from melanoma. The identification of gene signatures associated with their expression presents insights into the development of new treatment initiatives but provides a basis for exploration in future studies.

1. Introduction

Melanoma is an aggressive form of skin cancer and is the most common type of cancer in young Australian adults. In Australia and most western countries, females have much better survival than male patients [1,2,3]. As an example, in 2012, the Australian age-adjusted death rate for females was approximately 2 per 100,000 of the population compared to 5 per 100,000 in males (www.aihw.gov.au). A number of reasons for the female survival advantage have been proposed, such as behavioral differences in sun exposure, leading to differences in incidence and stage at diagnosis [4], presentation of males with more advanced thicker melanoma [5,6], higher mutation rates in melanoma from males [7], and inhibition by estrogens in females (reviewed in [8]). Nevertheless, multivariate analyses in a number of studies have confirmed that the female sex is an independent prognostic indicator in survival from melanoma [1,9,10].
Improved survival of female patients has been noted in other malignancies and has prompted an examination of the role of X-linked genes that escape X chromosome inactivation. One such study from The Cancer Genome Atlas (TCGA) identified six X-linked genes that harbored loss of function mutations in cancers from males that, therefore, might play protective roles in females [11]. Three of these genes—KDM5C, KDM6A, and ATRX—are well-known epigenetic regulators with known tumor-suppressive functions in melanoma. KDM5C and KDM6A have been previously shown to be preferentially expressed in primary melanoma in female patients [12] and that the low levels of tumoral ATRX are associated with the progression of melanoma [13].
The identification of KDM6A (lysine(k) demethylase 6A) in this context is of particular interest as it is involved in the demethylation of Histone H3 Lysine 27 tri-methylation (H3K27me3) associated with gene activation. It is also known as UTX (ubiquitously transcribed X chromosome tetratricopeptide repeat protein) and is a member of the KDM6 family that includes UTY (Ubiquitously Transcribed Tetratricopeptide Repeat containing Y-linked) and KDM6B (also known as JMJD3, encoded by an autosomal gene) [14]. H3K27me3 is generated by the methylase EZH2(Enhancer of Zesta Homolog-2), which is the catalytic subunit of the polycomb-repressive complex 2 (PRC2) that represses transcription of genes involved in differentiation and tumor suppression in many cancers, including melanoma [15,16,17]. KDM6B also catalyzes the demethylation of H3K27me3, whereas UTY lacks demethylase activity due to the substitution of critical amino acids within the JmjC domain [18]. KDM6A is, therefore, a possible antagonist of PRC2 repression of these genes, initiating transcriptional activation. KDM5C is also a demethylase but demethylates histone H3K4. Methylation of H3K4 is considered to have a role in the activation of gene expression rather than repression [19].
ATRX (alpha thalassemia mental retardation X-linked) is a member of the SWI/SNF(SWItch/Sucrose Non-Fermentable) family of chromatin regulators, and its loss of function was first recognized as a cause of the ATRX syndrome. It has domains that can bind DNA methyltransferases, heterochromatin 1 alpha (HP1alpha), and EZH2 [20] and appears to have a role in suppression of repetitive regions of the genome like endogenous retroviral elements (ERV) and pericentric chromosome regions [20]. Its loss has also been associated with the maintenance of telomeres by the alternate lengthening of telomeres (ALT) pathways [20,21]. Most importantly, it is believed to be responsible for targeting the PRC2 complex to facilitate X chromosome inactivation and in targeting PRC2 to its target genes in the genome [22].
To identify X-linked genes that might be involved in the improved survival of females in melanoma, we selected genes that were associated with improved survival in females compared to males in the TCGA melanoma data. The expression of these genes was further examined for their association with immune infiltrates in primary and metastatic melanoma and for their association with particular gene sets associated with oncogenesis or immune-related pathways. The results provided strong evidence for the importance of KDM6A and EZH2 in the improved survival of females from melanoma. An independent data set derived from 687 patients with primary melanoma in the Leeds melanoma cohort (LMC) [23] was used as the validation set.

2. Results

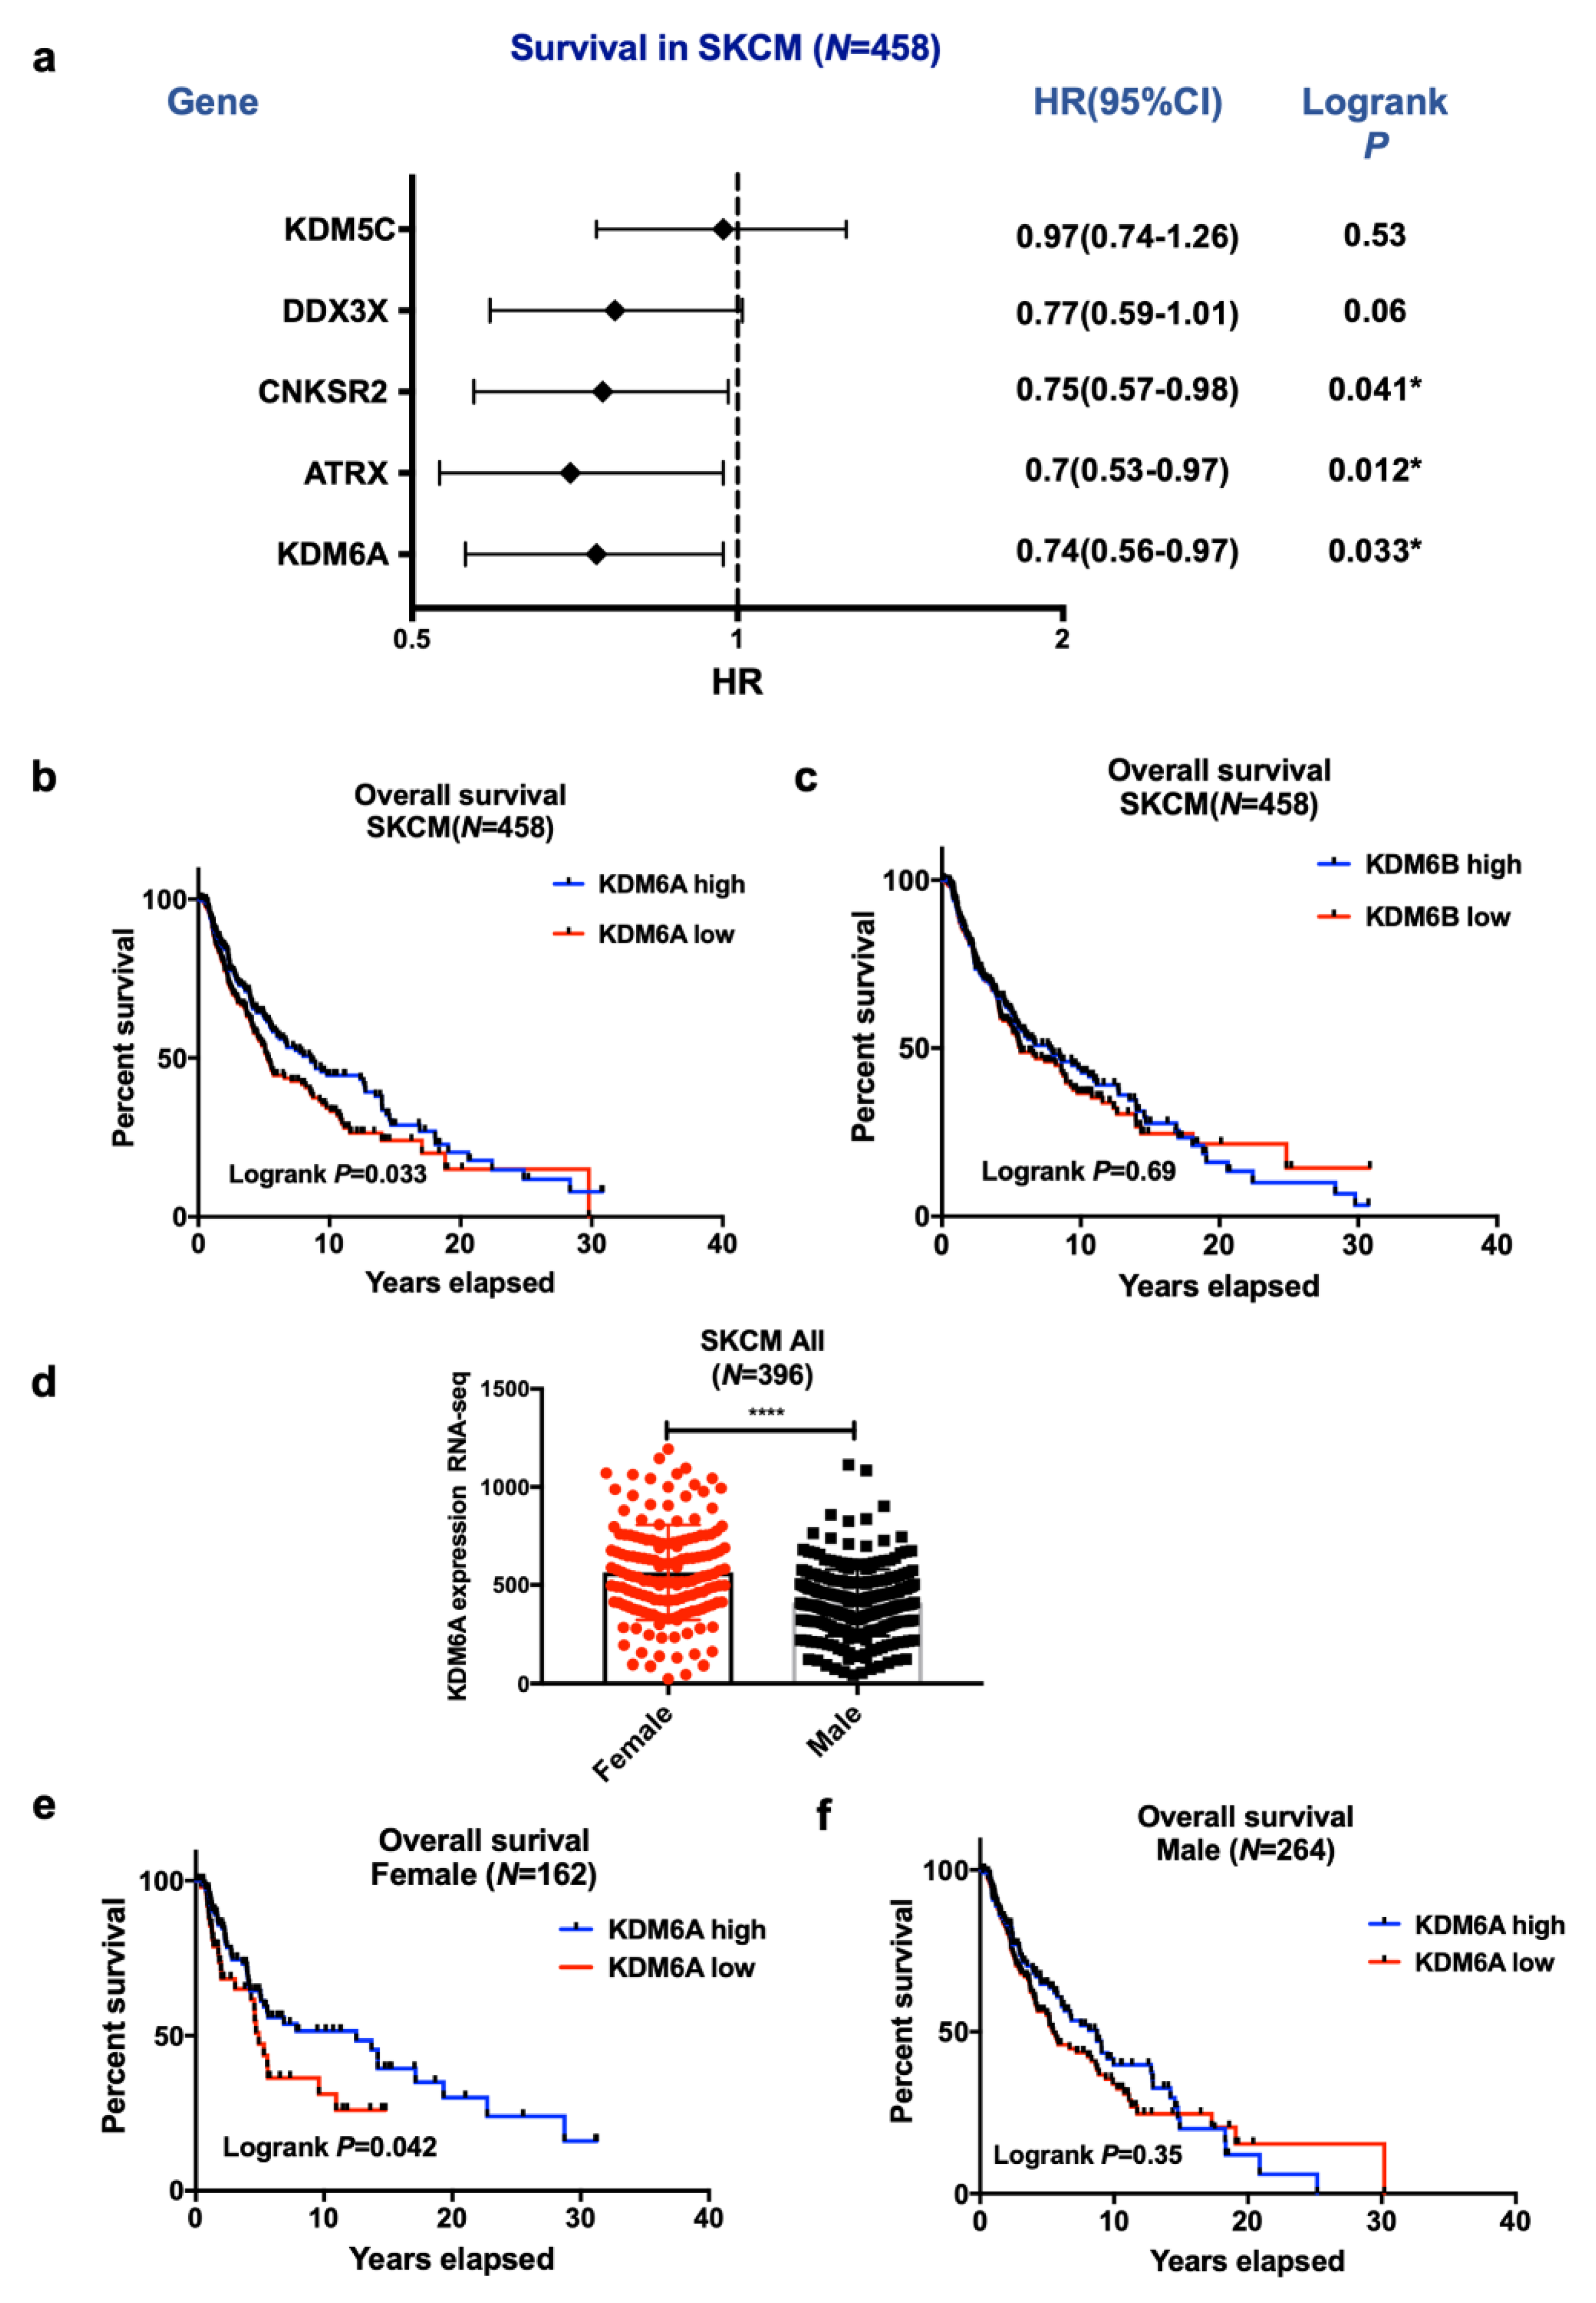
2.1. High KDM6A and ATRX Expression Are Associated with Improved Survival in Female Compared to Male Patients with Melanoma in the TCGA Data Set

The six pan-cancer X-linked genes (ATRX, CNKSR2, DDX3X, KDM5C, KDM6A, and MAGEC3) [11] were examined for their association with melanoma survival by comparing the survival of all patients with the expression of genes above (high) or below (low) median expression levels. Only KDM6A and ATRX were associated with improved survival. KDM5C, DDX3X, and MAGEC3 were not associated with survival, and CNKSR2 appeared to be associated with improved survival of males but not females (Figure 1a).
Kaplan–Meier analysis showed that the high KDM6A mRNA expression was associated with better overall survival in the skin cutaneous melanoma (SKCM) melanoma cohorts (p < 0.05, Figure 1b). As a control, we examined the expression of the paralog KDM6B, but it was not related to survival (Figure 1c). Women had higher mRNA expression of KDM6A than men (Figure 1d). The improvement in survival was confined to female patients if dichotomized above or below the median expression, as shown in Figure 1e,f. Interaction analysis did not reveal interactions of KDM6A with sex (p = 0.96) (Table 1a), so the improved survival in females is likely due to their higher levels of KDM6A. Only EZH2 significantly interacted with sex (p = 0.02) (Table 1a), while KDM6A had a statistically significant interaction with EZH2 (p = 0.03). Survival analysis was further segregated in primary and metastatic disease and sex in the SKCM cohort. We did not observe any significant association of KDM6A, ATRX, and EZH2 in primary or metastatic cohorts, suggesting that the survival advantage applied to both disease states (Table S1).
High expression of ATRX was also associated with improved survival in melanoma patients. (Figure 2a). To assess whether high expression of two X-linked genes—KDM6A and ATRX—have a survival advantage, we stratified melanoma patients based on the median expression of KDM6A and ATRX. High ATRX was associated with improved survival regardless of KDM6A expression level and vice versa (Figure 2b), showing that ATRX is an independent predictor of survival, which was confirmed by univariate and multivariate cox regression analysis (Figure 2c). ATRX levels, however, were not significantly different between males and females (Figure 2d). There was also no significant interaction with sex (p = 0.14), KDM6A levels (p = 0.98), and EZH2 levels (p = 0.31) (Table 1a).

LMC Analysis (Validation Cohort)

Many of these observations were replicated in the LMC primaries. Notably, higher expression of DDX3X and KDM6A was associated with better melanoma-specific survival in all patients (only when analyzed on a continuous scale for the former, Figure S1a). KDM6A was expressed more highly in females, but its prognostic effect was similar in both sexes (interaction p = 0.41, Figure S1b,c). Additionally, KDM5C expression was associated with improved survival in this cohort, unlike in TCGA, but the effect of KDM6B was flat in both cohorts. The expression of ATRX was not prognostic in the full data nor in any sex subset (interaction p = 0.47, Figure S2a,b).
The melanoma-specific survival (MSS) in the LMC data also showed a weak increase in survival in patients with high KDM6A and low ATRX levels compared to that in patients with low levels of both KDM6A and ATRX (Figure S2).

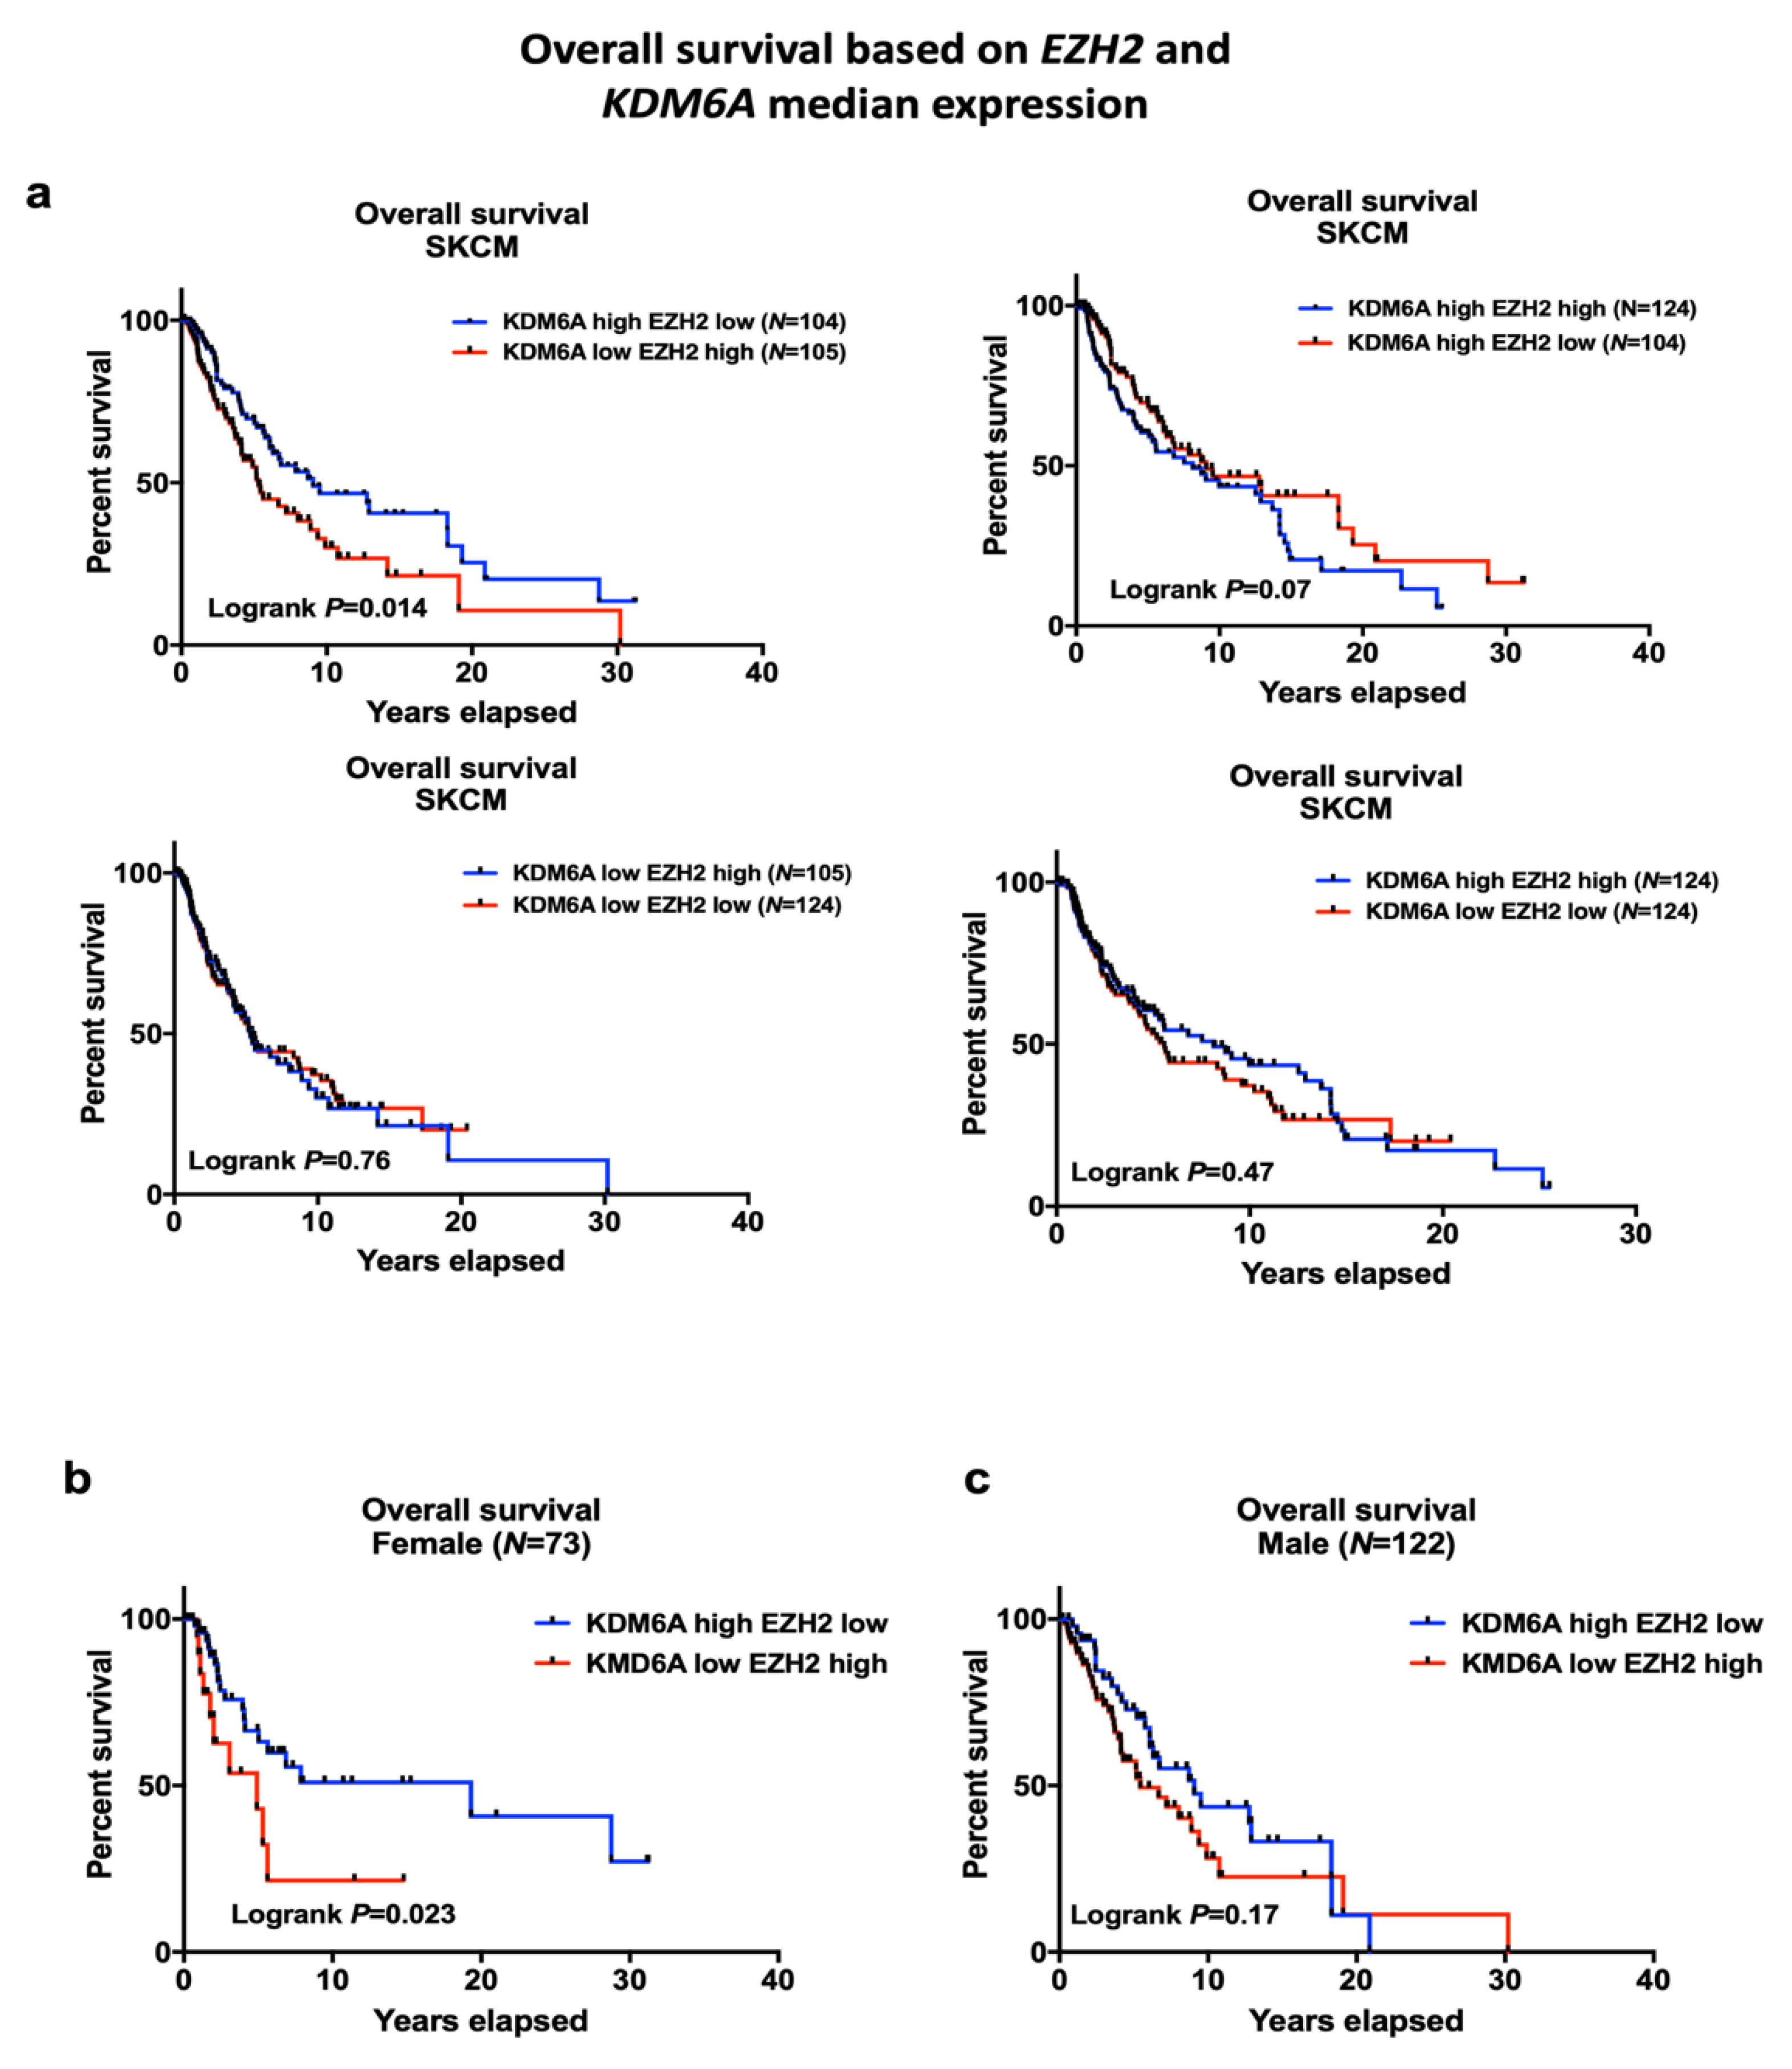
2.2. EZH2 Levels Impact Survival in High KDM6A Patients and Have Significant Associations with Sex-Biased Overall Survival (OS)

The histone methyltransferase EZH2 and demethylase KDM6A enzymes have opposing effects on the H3K27 mark, so we examined whether EZH2 levels in the TCGA data set would be associated with survival. The survival of patients with high KDM6A and either high or low expression of EZH2 is shown in Figure 3a. Patients with high KDM6A and low EZH2 levels had improved overall survival compared to low KDM6A and high EZH2 patients (log-rank p = 0.014). High expression of KDM6A with low expression of EZH2 was significantly associated with better survival, especially in females (log-rank p = 0.023) but not male SKCM patients (Figure 3b,c). Additionally, gene interaction analysis of EZH2 and KDM6A on the OS suggested that EZH2 interacted with KDM6A and impacted on overall survival in the total SKCM cohort, as well as in patients with metastases, but not in the primary cohort (interaction p = 0.033, 0.042, and 0.32 respectively, Table 1a). Moreover, EZH2 also interacted with sex and had a significant association with survival in patients with primary or metastatic melanoma and overall SKCM cohort (interaction p = 0.045, 0.049, 0.02 respectively, Table 1a). However, no significant statistical interaction was observed between EZH2 and ATRX on OS (interaction p = 0.313). EZH2 expression was relatively higher in male compared to female patients; however, this was not significant (Figure S3a). EZH2 partially correlated with KDM6A in SKCM; however, paired analysis suggested that a subset of patients with high KDM6A level had a significantly low level of EZH2 and vice versa (Figure S3b,c). We also examined the association of age with the high KDM6A and low EZH2 group since it has been reported that the improved survival of female melanoma patients only applies to those below 60 years of age [10]. However, multivariate cox regression analysis of our data did not find a relation between age and survival in the high KDM6A and low EZH2 group (Table S2).

LMC Analysis (Validation Cohort)

These results were similar to those from the LMC cohort, in that patients with high KDM6A levels and low EZH2 levels had significantly better survival than patients with low KDM6A and EZH2 levels. It was also of interest that female patients with low EZH2 levels had better MSS than male patients with low EZH2 levels (Figure S4a,b). See also Table 1b, which confirms significant interactions between KDM6A and EZH2 and EZH2 and sex, respectively, on MSS and supports the results of the SKCM cohort.

2.3. The Tissue Distribution of KDM6A and ATRX Is Different to that of KDM6B

The improved survival of women from melanoma has been reported to be confined to women below the age of 60 [10], which prompted us to examine whether hormonal influences are at play. Tissue-specific mRNA expression data were retrieved from the GTEx portal [24]. KDM6A expression was higher in several female organs, including ovary, uterus compared to other tissues. KDM6A expression was higher in lymphocytes from female compared to male patients (Figure S5a). Similarly, ATRX expression was relatively higher in several female organs (Figure S5b). In contrast, KDM6B had a basal level of expression in the female organs (Figure S5c).

2.4. Gene Set Expression Analysis (GSEA) Has Revealed Immune Pathways to Be Positively Associated with KDM6A

To get a better understanding of how KDM6A may be influencing survival, a differential gene expression analysis of the KDM6A high vs. low group was carried out on the TCGA data set. In the KDM6A high group, HALLMARK ALLOGRAFT REJECTION, INFLAMMATORY RESPONSE, and INTERFERON-GAMMA RESPONSE were the top three positively enriched pathways (normalized enrichment score > 1.9, p = 0) (Figure 4a). The most negatively enriched gene sets were HALLMARK OXIDATIVE PHOSPHORYLATION, MYC TARGET V2, DNA REPAIR (normalized enrichment score < −2.2, p = 0) (Figure 4b). Additionally, other immune-related pathways like HALLMARK IL6 JAK STAT3 SIGNALING and INTERFERON ALPHA RESPONSE were positively enriched amongst the top 10 pathways (Figure 4c). Several metabolic and oncogenic pathways were negatively enriched, including HALLMARK OF REACTIVE OXYGEN SPECIES, GLYCOLYSIS, MTORC1 SIGNALING, CHOLESTEROL HOMEOSTASIS (Figure 4c).
Next, we asked whether the positive enrichment of immune-related pathways in the KDM6A group is associated with sex. Hence, we performed GSEA analysis of female KDM6A high vs. low group and male KDM6A high vs. low group. This analysis revealed a significant positive enrichment of HALLMARK INTERFERON-GAMMA RESPONSE in female patients with high KDM6A but not in male patients (Figure 5a). Immune-related pathways were absent in male patients. These results were consistent with KDM6A-related immune enrichment as the basis for survival advantage in females (Figure 5b). Both male and female patients shared some negative enriched pathways like HALLMARK OXIDATIVE PHOSPHORYLATION, DNA REPAIR, and GLYCOLYSIS, but EPITHELIAL MESENCHYMAL and MTORC1 SIGNALING were confined to female patients (Figure 5a,b).

2.5. GSEA Analysis Shows that ATRX Acts on Similar Gene Sets to KDM6A Except for Immune Regulatory Pathways

Next, we examined the TCGA data by GSEA to see which gene sets were associated with ATRX. As shown in Figure 6a–c, ATRX was associated with the upregulation of similar pathways to KDM6A, except for the immune pathways shown in Figure 4c. HALLMARK OXIDATIVE PHOSPHORYLATION, MYC TARGET V2, and DNA REPAIR pathways were identified as the top three negatively enriched pathways (normalized enrichment score < −2.2, p = 0) similar to the KDM6A analysis (Figure 6b,c).

2.6. GSEA Analysis Identifies a Positive Enrichment of Immune Pathways in KDM6A High EZH2 Low Group Similar to KDM6A High Group

As EZH2 and KDM6A act in an opposing fashion on H3K27 methylation, we compared tumors with high EZH2 and low KDM6A levels to those with low EZH2 and high KDM6A levels. These groups were stratified based on the median gene expression of KDM6A and EZH2 in SKCM cohorts. GSEA revealed several immune-related pathways like HALLMARK INFLAMMATORY RESPONSE, INTERFERON-GAMMA RESPONSE, COMPLEMENT, and INTERFERON ALPHA RESPONSE amongst the top 10 positively enriched pathways in KDM6A high-EZH2 low group (normalized enrichment score > 1.9, p = 0) (Figure 7a,b). On the other hand, HALLMARK E2F TARGETS, G2M CHECKPOINT, MYC TARGETS, OXIDATIVE PHOSPHORYLATION, DNA REPAIR, MTORC1 SIGNALING identified as one of the top 10 negatively enriched pathways (normalized enrichment score < −2, p = 0) (Figure 7b,c). These results were consistent with the improved survival due to KDM6A driven activation of immune-related pathways and modulation of the metabolic, cell cycle, and oncogenic pathways.

2.7. Association of KDM6A and ATRX on Immune Responses in Melanoma Patients

The original report on the genomic classification of cutaneous melanoma drew attention to the strong influence of lymphocytic infiltration on survival outcomes [25]. In view of this and the GSEA analysis showing that immune-related pathways were positively enriched in the patients with high KDM6A, we examined whether there was a correlation between KDM6A expression and immune infiltration scores, as reported previously [26]. This showed that KDM6A expression had significant positive correlations with several immune cell infiltrates, including dendritic cells (DCs) (r = 0.16), macrophages (r = 0.12), neutrophils (r = 0.31), B cells (r = 0.18), CD4+ (r = 0.22), and CD8+ cells (r = 0.32) (Table 2). Importantly, this association was more prominent in female patients compared to males.
ATRX expression showed less positive correlations with dendritic cells (r = 0.11), macrophages (r = 0.17), neutrophils (r = 0.29), B cells (r = 0.12), CD4+ (r = 0.12), and CD8+ cells (r = 0.18). ATRX expression like that of KDM6A also showed a higher positive correlation with immune cell subsets in female patients compared to male. KDM6B showed only a positive correlation with CD4+ T cells (r = 0.15) and a negative correlation with CD8+ T cells (r = −0.18). There were no correlations with other subsets. EZH2 expression showed a significant positive correlation only with CD8+ T cells (r = 0.18) and neutrophils (r = 0.18) (Table 2). Similar results were observed in the metastases cohort, and the correlation was stronger, particularly in female patients. These results inferred that KDM6A, more so than ATRX, plays an important role in immune infiltration in melanoma patients, especially in females.

LMC Analysis (Validation Cohort)

Comparisons of tumor-infiltrating lymphocytes (TILs) between the two series is difficult because of different scoring systems, but nevertheless, as shown in Table S2, a similar analysis on the LMC data showed weak associations of KDM6A with cytotoxic cells, B cells, DCs, neutrophils, and macrophages. These associations were only evident in females, consistent with the TCGA data analysis. ATRX levels did not appear to correlate with any immune infiltrates (Table S2a).

2.8. Exploration of the Basis for Increased TILs in Females Compared to Males

To determine if particular immune subsets are associated with KDM6A in melanoma, we compared the expression of the markers in females versus males in the TCGA data. As shown in Table 3, there did not appear to be major differences in the presence of CD141 DCs [27], BATF3(Basic Leucine Zipper ATF-Like Transcription Factor 3) and CD103 DCs [28], Regulatory T cells (Tregs, CD25), T resident memory T cells (Trem, CD69) [29], or CXCR3 (C-X-C Motif Chemokine Receptor 3) CD4 T cells between the sexes, but there were significantly higher levels of IFN(Interferon) gamma and the chemokine receptor CCR5(C-C Motif Chemokine Receptor 5) in female patients.
In the LMC cohort, a weak correlation was observed with CD141, CD69, and CXCR3 in females compared to males. Whereas, CCR5 was significantly correlated with KDM6A in males compared to females (Table S2b).

3. Discussion

Studies in a number of western countries have shown major differences in survival from melanoma between the sexes that even surpass the improvement in survival from new treatments with targeted therapies and immunotherapy [30]. Although X-linked genes have attracted attention in studies on autoimmune diseases [31], they have received little attention in studies on sex differences in cancer. The basis of the present study was the report of X-linked genes in the improved survival of females with a range of cancers [11]. Our application of these findings to melanoma patients in the TCGA database appears to make a strong case for the involvement of two of these X-linked epigenetic regulators (KDM6A and ATRX) in this improved survival. Not only KDM6A and ATRX were significantly associated with better overall survival, but KDM6A was also particularly higher in female compared to male melanoma patients. KDM6A is located on the X-chromosome, but both alleles can be transcribed in females, giving higher expression levels [19]. This was reflected in higher levels in melanoma from female patients. These differences in survival were not seen in the autosomal KDM6B paralog of KDM6A.
In looking for an explanation for these findings, we first examined whether KDM6A might be related to immune responses to melanoma, particularly as the initial analysis of the TCGA data had shown that TILs were the main factor related to the survival [25]. It was of great interest to find that there was a much stronger association of KDM6A expression with TILs in melanoma in female compared to male patients. The validity of these findings was strengthened by the lack of association of immune infiltrates with KDM6A in male patients, and those similar associations did not apply to the expression of KDM6B—the autosomal paralog of KDM6A. Further strong support for an immune basis for these findings came from GSEA, comparing high with low levels of KDM6A that showed strong upregulation of genes in the interferon (IFN) and inflammatory pathways. Most importantly, GSEA analysis of KDM6A based on sex revealed that the IFN gamma pathway expression was confined to female patients and completely absent in male patients. This was consistent with the preferential survival advantage in female melanoma patients with high KDM6A levels. Effects on oncogenic pathways might have also been involved as there was a strong downregulation of Myc. As reviewed elsewhere, Myc has been implicated in the inhibition of T cell activation and infiltration [32], and its downregulation may have contributed to the increase in TILs seen in the KDM6A high female patients.
As strong as these results from the TCGA analysis appear, the comparison with results from the LMC with primary melanoma raises several questions. In particular, why there was not a strong relation of KDM6A expression to MSS in females compared to males, even though KDM6A levels were much higher in females. There was only a weak association between KDM6A levels and TILs, but this was consistent with TCGA results, being seen only in females. Multivariate analysis also did not support that KDM6A or ATRX was independent of other known prognostic variables. The main difference between these cohorts is that the TCGA data is heavily weighted towards metastases from skin and lymph nodes. The primary melanoma in the TCGA is also considered to be weighted to more advanced melanoma as tissue from early melanoma is likely to be in short supply. Other differences may exist in the proportion of male/female patients at different ages, as this does vary by country of origin [33]. For example, as expected, there were more females with melanoma at a younger age and a site on their legs in the LMC rather than at head and neck sites as in older males in the US and Australia and seen also in the TCGA data (Table S1).
Several of these X-linked epigenetic regulators have been implicated in immune responses. KDM6A has been reported to have roles in the function of Treg cells [34,35] and CD4 T cells in autoimmune disease [35] and maintenance of Th17 (T-helper cell 17) CD4 T cell responses [36]. Considering the known association of autoimmunity to allograft rejection [37], this may explain the positive enrichment of ALLOGRAFT REJECTION in the KDM6A high group. It is implicated in T follicular helper cell-dependent clearance of viral infections [38] and in the development of inflammatory responses to respiratory syncytial virus infections [39]. At a molecular level, KDM6A is known to have an opposing role to EZH2 in methylation of H3K27 histones. This role may explain some of the effects of KDM6A on the immune system in that we previously reported that EZH2 was associated with the repression of several genes associated with antigen presentation and chemokines involved in T cell responses [40]. The opposing effect of KDM6A on EZH2 might explain the positive enrichment of immune-related genes in the KDM6A high and low EZH2 group in the GSEA analyses. Along this line, our recent study identified immune-suppressive gene signatures in a subset of melanoma cell lines resistant to EZH2 inhibitors. Sensitivity to the EZH2 inhibitor is strongly associated with interferon-gamma and alpha gene signatures [40]. Consistently, we also observed a positive enrichment of INTERFERON-GAMMA and ALPHA RESPONSE in the KDM6A high group as well as KDM6A high-EZH2 low group. This suggested that the level of EZH2 and its demethylase KDM6A may play a pivotal role in regulating genes associated with immune evasion in melanoma. It was noticeable that immune-regulated genes were absent in melanoma with high ATRX levels, which may indicate retargeting of EZH2 to immune gene sets.
The LMC analysis also showed a strong relation of KDM5C expression to survival from melanoma. Its expression in melanoma has been shown in previous studies to be sex-related [12]. The relation to survival is somewhat surprising as KDM5C demethylase acts on H3K4 methylated histone marks, which are viewed as activating marks in euchromatin. KDM5C has also been described as inhibiting the endogenous IFN pathway needed to generate immune responses [41]. It would be plausible if KDM5C downregulation occurred as a response to metastases as the LMC analyses were on primaries. DDX3X was weakly associated with survival in both series when examined as a dichotomous variable but strongly associated with survival in the LMC when analyzed as a continuous variable. DDX3X is an x-linked RNA helicase, which has been linked to post-translational regulation of MITF (Microphthalmia-associated Transcription Factor) expression and development of melanoma metastasis and therapy resistance [42]. It is possible that the female advantage in relation to DDX3X may result from the adverse effect of mutation or loss of DDX3X in male patients rather than effects on immune responses. These differences in the expression between the two-patient series require further study, particularly in relation to the stage of the disease.
Given that the TCGA analysis suggested a strong role for ATRX in the survival of patients, it is surprising that it seems of little significance in the survival of patients in the LMC. Low levels have been previously reported to be associated with melanoma progression [13]. It is a member of the SWI/SNF chromatin remodeling family and is believed to have a role in the maintenance of heterochromatin and repression of genes, as well as in telomere maintenance [20]. It is of particular interest for targeting the PRC2/EZH2 complex to facilitate X chromosome inactivation and for genome-wide directing the PRC2/EZH2 to target genes [22]. This role for ATRX could presumably account for the upregulation of EZH2 target genes in melanoma and the increased expression of the X chromosome-related genes, such as KDM6A.
Another unanswered question is whether the effects of female hormones on the immune system may play some role in the improved survival [43], particularly as some series reported less sex-related effects in women over 60 years of age. It is also notable that KDM6A expression (but not KDM6B) is higher in female endocrine tissues and lymphoid tissue [8,43,44]. It is generally recognized that females have higher CD4 T cell levels and lower Treg cells [45]. Treatment initiatives based on hormone administration might be one development if confirmed. The present results also suggested that EZH2 inhibitors might have a role in the treatment of melanoma that expresses high EZH2 and low KDM6A as loss of KDM6A sensitizes bladder and lung cancer cells to treatment with EZH2 inhibitors [19]. The involvement of ATRX in directing EZH2 to its targets also points to further exploration of EZH2 inhibitors in the treatment.

4. Materials and Methods

4.1. Data from Skin Cutaneous Melanoma (SKCM) Cohort

The SKCM patient cohort was obtained from TCGA and fetched through the Oncolnc website (www.oncolnc.org), consisting of 458 patients who all had cutaneous melanoma [46,47]. The clinical information, RNA-seq expression profile, and immune infiltration score of the SKCM cohort were obtained from TCGA. The overall survival was defined as time to death. Written informed consent of all participants was obtained by the TCGA Research Network. All research activities were conducted in accordance with the Helsinki Declaration of 1975 by the TCGA Research Network [47]. The description of the patients in the TCGA and LMC are summarized in Table S3.

4.2. RNA-seq Analysis

RNA expression profiles (RNA Seq V2 RSEM) and clinical data of 472 melanoma patient samples from the TCGA Firehose Legacy cohort were retrieved using the Cancer Genomics Data Server R package (cgdsr, v.1.2.10; github.com/cBioPortal/cgdsr). For pairwise comparisons of gene expression profiles, the patient samples were grouped into four cohorts based on the median expression of KDM6A, KDM6A within female and male, ATRX, and EZH2. The four cohorts are represented as (a) KDM6A high vs. KDM6A low, (b) KDM6A high vs. KDM6A low in females and KDM6A high vs. KDM6A low in males, (c) ATRX high vs. ATRX low, (d) KDM6A high and EZH 2 low vs. KDM6A low and EZH2 high.
Differentially expressed genes were determined using the Wald test, followed by multiple testing correction (Benjamini Hochberg) within the DESeq2 R package [48]. Genes with an absolute log2 fold change ≥ 2 and adjusted p-value ≤ 0.05 were considered significantly differentially expressed and used for further analyses.

4.3. Gene Set Enrichment Analysis (GSEA)

RNA-seq analysis of the SKCM cohort revealed differentially expressed genes in (a) KDM6A high vs. low group, (b) KDM6A high vs. low in female and male groups, (c) ATRX high vs. low group, and (d) KDM6A high-EZH2 low vs. KDM6A low-groups. The differentially expressed genes from each ‘high’ vs. ‘low’ expression group were further analyzed for enriched pathways by GSEA tools of the Broad Institute [49]. Briefly, a pre-ranked differential gene expression list from each group was uploaded in GSEA tools and run for Hallmark gene sets. The positive and negative enriched pathways with a cut off false discovery rate (FDR) p < 0.05 were considered for significant pathways. The top ten positively and negatively enriched pathways for each group were then represented as a forest plot based on their normalized enrichment score.

4.4. Statistical Methods

TCGA statistical analysis was performed using SPSS Statistical software of IBM (ibm.com/au-en/analytics/spss-statistics-software) and Graphpad Prism 7 (graphpad.com/scientific-software/prism/). Univariate and multivariate cox proportional hazard analysis was performed using SPSS software. The correlation between gene expression and individual immune cell subset infiltration was assessed by Pearson r and two-tailed t-tests. Survival analysis was performed in Prism using Log-rank (Mantel–Cox) to assess the significance between the groups. Models were considered for testing the effect of the expression of each gene on the overall survival in the whole dataset as well as in stratified subsets by sex or by the level of another gene.
To ascertain differential prognostic effects of one gene by levels of another or by sex while avoiding spurious association that may arise from subsetting the data, a statistical interaction term was added to multivariable Cox-proportional hazards regression, and Kaplan–Meier curves were plotted jointly for both factors after dichotomizing gene expressions by the median.

4.5. Data from the Leeds Melanoma Cohort (LMC)

This population ascertained that the primary melanoma cohort was comprised of data and samples collected in the UK. The 0.6 mm cores were obtained from FFPE (Formalin Fixed Paraffin Embedded) specimens, where it was possible to obtain a sample using a tissue microarray needle, without destroying the block. LMC tumor transcriptome processing has been described previously (accession no. EGAS00001002922) [23,50]. RNA was extracted to generate whole-genome gene expression data (Illumina DASL HT12.4 array). Background correction and quantile normalization were applied; singular value decomposition was used to assess the confounding factors that were subsequently adjusted out. Participants in the LMC gave written informed consent; the study was conducted in accordance with international ethical guidelines (Declaration of Helsinki) and was approved by the national ethics committee (MREC 1/03/57 and PIAG3-09(d)/2003). This dataset (n = 697) was used to replicate the observations made in the TCGA cohort. Genes were tested for association with melanoma-specific survival (MSS) in univariate and multivariate Cox-proportional hazard models with and without statistical interactions. Kaplan–Meier curves were used to plot the results. Spearman correlation was calculated between key genes and immune cell scores inferred using the immunome approach, as previously reported [51]. These analyses were conducted within STATA v14 (StataCorp, College Station, TX, USA).

5. Conclusions

In conclusion, our analysis of melanoma data in TCGA and LMC cohorts is consistent with a role for these four X-linked epigenetic regulators in the improved survival of females compared to male patients with melanoma. Differences between the two series may reflect different stages of melanoma and sites of occurrence. Comparisons with other cohorts are needed, as well as mechanistic studies in vitro, to better understand the biology of these genes in melanoma. Further analysis is also needed to see whether female hormones influence their effects on the immune system and account for the reduced sex differences in older female patients. Given the huge differences in survival from melanoma according to sex, further studies on relation to immune responses and oncogenic pathways appear warranted.

Supplementary Materials

The following are available online at https://www.mdpi.com/2072-6694/12/8/2082/s1, Figure S1: The analysis of survival of the selected X-linked genes in the LMC cohort. Figure S2: KDM6A expression improves patient survival only when ATRX is low. Figure S3: Differential expression of EZH2 and correlation with KDM6A and age. Figure S4: KDM6A expression improves patient survival only when EZH2 is low. Figure S5: (a) KDM6A (b) ATRX, and (c) KDM6B gene expression in different human tissues. Table S1: Overall survival analysis of KDM6A, ATRX, and EZH2 in the SKCM primary and metastases cohort. Table S2: Correlation of the selected genes with (a) immune cell subset and (b) immune cell markers in the LMC cohort. Table S3: Clinical characterization of the SKCM and LMC cohort.

Author Contributions

Conceptualization, A.A.E., J.C.T., and P.H.; methodology: A.A.E., J.N., and U.S.; investigation, A.A.E., J.N., G.P.-M., U.S., and S.J.G.; data curation, A.A.E., J.N., and U.S.; writing—original draft preparation, A.A.E., J.C.T., and P.H.; writing—review and editing, A.A.E., J.N., J.N.-B., J.C.T., S.J.G., and P.H.; supervision, P.H., J.C.T., and J.N.-B.; funding acquisition, P.H. and J.C.T. All authors have read and agree to the published version of the manuscript.

Funding

This work is supported by the Australian National Health and Medical Research Council (NHMRC) program grant 633004 and Cancer Council New South Wales (CCNSW) research grant RG 18-05. U.S. holds a Fellowship from the Cancer Institute of New South Wales.

Acknowledgments

We thank the many people involved in making the TCGA and LMC data available for study.

Conflicts of Interest

The authors declare no conflict of interest.

References

  1. Joosse, A.; Collette, S.; Suciu, S.; Nijsten, T.; Patel, P.M.; Keilholz, U.; Eggermont, A.M.; Coebergh, J.W.; de Vries, E. Sex is an independent prognostic indicator for survival and relapse/progression-free survival in metastasized stage III to IV melanoma: A pooled analysis of five European organisation for research and treatment of cancer randomized controlled trials. J. Clin. Oncol. 2013, 31, 2337–2346. [Google Scholar] [CrossRef]
  2. Joosse, A.; Collette, S.; Suciu, S.; Nijsten, T.; Lejeune, F.; Kleeberg, U.R.; Coebergh, J.W.; Eggermont, A.M.; de Vries, E. Superior outcome of women with stage I/II cutaneous melanoma: Pooled analysis of four European Organisation for Research and Treatment of Cancer phase III trials. J. Clin. Oncol. 2012, 30, 2240–2247. [Google Scholar] [CrossRef]
  3. Enninga, E.A.L.; Moser, J.C.; Weaver, A.L.; Markovic, S.N.; Brewer, J.D.; Leontovich, A.A.; Hieken, T.J.; Shuster, L.; Kottschade, L.A.; Olariu, A.; et al. Survival of cutaneous melanoma based on sex, age, and stage in the United States, 1992–2011. Cancer Med. 2017, 6, 2203–2212. [Google Scholar] [CrossRef] [PubMed] [Green Version]
  4. Chen, J.; Shih, J.; Tran, A.; Mullane, A.; Thomas, C.; Aydin, N.; Misra, S. Gender-Based Differences and Barriers in Skin Protection Behaviors in Melanoma Survivors. J. Ski. Cancer 2016, 2016, 3874572. [Google Scholar] [CrossRef] [PubMed] [Green Version]
  5. Hersey, P.; Sillar, R.W.; Howe, C.G.; Burton, R.C.; Darbar, S.V.; Foster, H.M.; Collins, S.M.; Bradley, D.E.; Owens, D. Factors related to the presentation of patients with thick primary melanomas. Med. J. Aust. 1991, 154, 583–587. [Google Scholar] [CrossRef] [PubMed]
  6. Courtenay, W.H.; Keeling, R.P. Men, gender, and health: Toward an interdisciplinary approach. J. Am. Coll. Health 2000, 48, 243–246. [Google Scholar] [CrossRef]
  7. Gupta, S.; Artomov, M.; Goggins, W.; Daly, M.; Tsao, H. Gender Disparity and Mutation Burden in Metastatic Melanoma. J. Natl. Cancer Inst. 2015, 107. [Google Scholar] [CrossRef]
  8. Dika, E.; Patrizi, A.; Lambertini, M.; Manuelpillai, N.; Fiorentino, M.; Altimari, A.; Ferracin, M.; Lauriola, M.; Fabbri, E.; Campione, E.; et al. Estrogen Receptors and Melanoma: A Review. Cells 2019, 8, 1463. [Google Scholar] [CrossRef] [Green Version]
  9. Morgese, F.; Berardi, R.; Sampaolesi, C.; Torniai, M.; Marcantognini, G.; Giacchetti, A.; Serresi, S.; Onofri, A.; Bittoni, A.; Pilone, A.; et al. Gender differences and outcome of melanoma patients. J. Transl. Med. 2015, 13, P13. [Google Scholar] [CrossRef] [Green Version]
  10. Lasithiotakis, K.; Leiter, U.; Meier, F.; Eigentler, T.; Metzler, G.; Moehrle, M.; Breuninger, H.; Garbe, C. Age and gender are significant independent predictors of survival in primary cutaneous melanoma. Cancer 2008, 112, 1795–1804. [Google Scholar] [CrossRef]
  11. Dunford, A.; Weinstock, D.M.; Savova, V.; Schumacher, S.E.; Cleary, J.P.; Yoda, A.; Sullivan, T.J.; Hess, J.M.; Gimelbrant, A.A.; Beroukhim, R.; et al. Tumor-suppressor genes that escape from X-inactivation contribute to cancer sex bias. Nat. Genet. 2017, 49, 10–16. [Google Scholar] [CrossRef] [PubMed] [Green Version]
  12. Gorlov, I.; Orlow, I.; Ringelberg, C.; Hernando, E.; Ernstoff, M.S.; Cheng, C.; Her, S.; Parker, J.S.; Thompson, C.L.; Gerstenblith, M.R.; et al. Identification of gene expression levels in primary melanoma associated with clinically meaningful characteristics. Melanoma Res. 2018, 28, 380–389. [Google Scholar] [CrossRef]
  13. Qadeer, Z.A.; Harcharik, S.; Valle-Garcia, D.; Chen, C.; Birge, M.B.; Vardabasso, C.; Duarte, L.F.; Bernstein, E. Decreased expression of the chromatin remodeler ATRX associates with melanoma progression. J. Investig. Dermatol. 2014, 134, 1768–1772. [Google Scholar] [CrossRef] [PubMed] [Green Version]
  14. Hong, S.; Cho, Y.W.; Yu, L.R.; Yu, H.; Veenstra, T.D.; Ge, K. Identification of JmjC domain-containing UTX and JMJD3 as histone H3 lysine 27 demethylases. Proc. Natl. Acad. Sci. USA 2007, 104, 18439–18444. [Google Scholar] [CrossRef] [PubMed] [Green Version]
  15. Tiffen, J.; Gallagher, S.J.; Hersey, P. EZH2: An emerging role in melanoma biology and strategies for targeted therapy. Pigment Cell Melanoma Res. 2014, 28, 21–30. [Google Scholar] [CrossRef]
  16. Tiffen, J.C.; Gallagher, S.J.; Tseng, H.Y.; Filipp, F.V.; Fazekas de St. Groth, B.; Hersey, P. EZH2 as a mediator of treatment resistance in melanoma. Pigment Cell Melanoma Res. 2016, 29, 500–507. [Google Scholar] [CrossRef] [Green Version]
  17. Comet, I.; Riising, E.M.; Leblanc, B.; Helin, K. Maintaining cell identity: PRC2-mediated regulation of transcription and cancer. Nat. Rev. Cancer 2016, 16, 803–810. [Google Scholar] [CrossRef]
  18. Walport, L.J.; Hopkinson, R.J.; Vollmar, M.; Madden, S.K.; Gileadi, C.; Oppermann, U.; Schofield, C.J.; Johansson, C. Human UTY(KDM6C) is a male-specific N-methyl lysyl demethylase. J. Biol. Chem. 2014, 289, 18302–18313. [Google Scholar] [CrossRef] [Green Version]
  19. Schulz, W.A.; Lang, A.; Koch, J.; Greife, A. The histone demethylase UTX/KDM6A in cancer: Progress and puzzles. Int. J. Cancer 2019, 145, 614–620. [Google Scholar] [CrossRef]
  20. Dyer, M.A.; Qadeer, Z.A.; Valle-Garcia, D.; Bernstein, E. ATRX and DAXX: Mechanisms and Mutations. Cold Spring Harb. Perspect. Med. 2017, 7. [Google Scholar] [CrossRef]
  21. Voon, H.P.; Wong, L.H. New players in heterochromatin silencing: Histone variant H3.3 and the ATRX/DAXX chaperone. Nucleic Acids Res. 2016, 44, 1496–1501. [Google Scholar] [CrossRef] [PubMed] [Green Version]
  22. Sarma, K.; Cifuentes-Rojas, C.; Ergun, A.; Del Rosario, A.; Jeon, Y.; White, F.; Sadreyev, R.; Lee, J.T. ATRX directs binding of PRC2 to Xist RNA and Polycomb targets. Cell 2014, 159, 869–883. [Google Scholar] [CrossRef] [Green Version]
  23. Thakur, R.; Laye, J.P.; Lauss, M.; Diaz, J.M.S.; O’Shea, S.J.; Poźniak, J.; Filia, A.; Harland, M.; Gascoyne, J.; Randerson-Moor, J.A.; et al. Transcriptomic Analysis Reveals Prognostic Molecular Signatures of Stage I Melanoma. Clin. Cancer Res. 2019, 25, 7424–7435. [Google Scholar] [CrossRef] [Green Version]
  24. Lonsdale, J.; Thomas, J.; Salvatore, M.; Phillips, R.; Lo, E.; Shad, S.; Hasz, R.; Walters, G.; Garcia, F.; Young, N.; et al. The Genotype-Tissue Expression (GTEx) project. Nat. Genet. 2013, 45, 580–585. [Google Scholar] [CrossRef] [PubMed]
  25. Akbani, R.; Akdemi, K.C.; Aksoy, B.A.; Albert, M.; Ally, A.; Amin, S.B.; Arachchi, H.; Arora, A.; Auman, T.J.; Ayala, B.A.; et al. Genomic Classification of Cutaneous Melanoma. Cell 2015, 161, 1681–1696. [Google Scholar] [CrossRef]
  26. Li, B.; Severson, E.; Pignon, J.C.; Zhao, H.; Li, T.; Novak, J.; Jiang, P.; Shen, H.; Aster, J.C.; Rodig, S.; et al. Comprehensive analyses of tumor immunity: Implications for cancer immunotherapy. Genome Biol. 2016, 17, 174. [Google Scholar] [CrossRef] [PubMed] [Green Version]
  27. Roberts, E.W.; Broz, M.L.; Binnewies, M.; Headley, M.B.; Nelson, A.E.; Wolf, D.M.; Kaisho, T.; Bogunovic, D.; Bhardwaj, N.; Krummel, M.F. Critical Role for CD103(+)/CD141(+) Dendritic Cells Bearing CCR7 for Tumor Antigen Trafficking and Priming of T Cell Immunity in Melanoma. Cancer Cell 2016, 30, 324–336. [Google Scholar] [CrossRef] [PubMed] [Green Version]
  28. Spranger, S.; Dai, D.; Horton, B.; Gajewski, T.F. Tumor-Residing Batf3 Dendritic Cells Are Required for Effector T Cell Trafficking and Adoptive T Cell Therapy. Cancer Cell 2017, 31, 711–723. [Google Scholar] [CrossRef] [Green Version]
  29. Edwards, J.; Wilmott, J.S.; Madore, J.; Gide, T.N.; Quek, C.; Tasker, A.; Ferguson, A.L.; Chen, J.; Hewavisenti, R.; Hersey, P.; et al. CD103+ tumor-resident CD8+ T cells are associated with improved survival in immunotherapy naive melanoma patients and expand significantly during anti-PD1 treatment. Clin. Cancer Res. 2018, 24, 3036–3045. [Google Scholar] [CrossRef] [Green Version]
  30. Luke, J.J.; Flaherty, K.T.; Ribas, A.; Long, G.V. Targeted agents and immunotherapies: Optimizing outcomes in melanoma. Nat. Rev. Clin. Oncol. 2017, 14, 463–482. [Google Scholar] [CrossRef] [Green Version]
  31. Libert, C.; Dejager, L.; Pinheiro, I. The X chromosome in immune functions: When a chromosome makes the difference. Nat. Rev. Immunol. 2010, 10, 594–604. [Google Scholar] [CrossRef] [PubMed]
  32. Spranger, S.; Gajewski, T.F. Impact of oncogenic pathways on evasion of antitumour immune responses. Nat. Rev. Cancer 2018, 18, 139. [Google Scholar] [CrossRef] [PubMed]
  33. Olsen, C.M.; Thompson, J.F.; Pandeya, N.; Whiteman, D.C. Evaluation of Sex-Specific Incidence of Melanoma. JAMA Derm. 2020, 156, 1–8. [Google Scholar] [CrossRef]
  34. Gao, J.; Gu, J.; Pan, X.; Gan, X.; Ju, Z.; Zhang, S.; Xia, Y.; Lu, L.; Wang, X. Blockade of miR-142-3p promotes anti-apoptotic and suppressive function by inducing KDM6A-mediated H3K27me3 demethylation in induced regulatory T cells. Cell Death Dis. 2019, 10, 332. [Google Scholar] [CrossRef] [Green Version]
  35. Itoh, Y.; Golden, L.C.; Itoh, N.; Matsukawa, M.A.; Ren, E.; Tse, V.; Arnold, A.P.; Voskuhl, R.R. The X-linked histone demethylase Kdm6a in CD4+ T lymphocytes modulates autoimmunity. J. Clin. Investig. 2019, 129, 3852–3863. [Google Scholar] [CrossRef] [PubMed] [Green Version]
  36. Cribbs, A.P.; Terlecki-Zaniewicz, S.; Philpott, M.; Baardman, J.; Ahern, D.; Lindow, M.; Obad, S.; Oerum, H.; Sampey, B.; Mander, P.K.; et al. Histone H3K27me3 demethylases regulate human Th17 cell development and effector functions by impacting on metabolism. Proc. Natl. Acad. Sci. USA 2020, 117, 6056–6066. [Google Scholar] [CrossRef] [PubMed] [Green Version]
  37. Banan, B.; Xu, Z.; Gunasekaran, M.; Mohanakumar, T. Role of alloimmunity and autoimmunity in allograft rejection. Clin. Transpl. 2013, 39, 325–332. [Google Scholar]
  38. Cook, K.D.; Shpargel, K.B.; Starmer, J.; Whitfield-Larry, F.; Conley, B.; Allard, D.E.; Rager, J.E.; Fry, R.C.; Davenport, M.L.; Magnuson, T.; et al. T Follicular Helper Cell-Dependent Clearance of a Persistent Virus Infection Requires T Cell Expression of the Histone Demethylase UTX. Immunity 2015, 43, 703–714. [Google Scholar] [CrossRef] [Green Version]
  39. Malinczak, C.A.; Rasky, A.J.; Fonseca, W.; Schaller, M.A.; Allen, R.M.; Ptaschinski, C.; Morris, S.; Lukacs, N.W. Upregulation of H3K27 Demethylase KDM6 During Respiratory Syncytial Virus Infection Enhances Proinflammatory Responses and Immunopathology. J. Immunol. 2020, 204, 159–168. [Google Scholar] [CrossRef]
  40. Tiffen, J.; Gallagher, S.; Filipp, F.; Gunatilake, D.; Al Emran, A.; Cullinane, C.; Dutton-Register, K.; Aoude, L.; Hayward, N.; Chatterjee, A.; et al. EZH2 cooperates with DNA methylation to downregulate key tumour suppressors and interferon gene signatures in melanoma. J. Investig. Dermatol. 2020. [Google Scholar] [CrossRef]
  41. Wu, L.; Cao, J.; Cai, W.L.; Lang, S.M.; Horton, J.R.; Jansen, D.J.; Liu, Z.Z.; Chen, J.F.; Zhang, M.; Mott, B.T.; et al. KDM5 histone demethylases repress immune response via suppression of STING. PLoS Biology 2018, 16, e2006134. [Google Scholar] [CrossRef] [PubMed] [Green Version]
  42. Phung, B.; Ciesla, M.; Sanna, A.; Guzzi, N.; Beneventi, G.; Cao Thi Ngoc, P.; Lauss, M.; Cabrita, R.; Cordero, E.; Bosch, A.; et al. The X-Linked DDX3X RNA Helicase Dictates Translation Reprogramming and Metastasis in Melanoma. Cell Rep. 2019, 27, 3573–3586. [Google Scholar] [CrossRef] [PubMed] [Green Version]
  43. Khan, D.; Ansar Ahmed, S. The Immune System Is a Natural Target for Estrogen Action: Opposing Effects of Estrogen in Two Prototypical Autoimmune Diseases. Front. Immunol. 2016, 6, 635. [Google Scholar] [CrossRef] [PubMed] [Green Version]
  44. Pierdominici, M.; Maselli, A.; Colasanti, T.; Giammarioli, A.M.; Delunardo, F.; Vacirca, D.; Sanchez, M.; Giovannetti, A.; Malorni, W.; Ortona, E. Estrogen receptor profiles in human peripheral blood lymphocytes. Immunol. Lett. 2010, 132, 79–85. [Google Scholar] [CrossRef]
  45. Ahnstedt, H.; McCullough, L.D. The impact of sex and age on T cell immunity and ischemic stroke outcomes. Cell. Immunol. 2019, 345, 103960. [Google Scholar] [CrossRef]
  46. Anaya, J. OncoLnc: Linking TCGA survival data to mRNAs, miRNAs, and lncRNAs. PeerJ Comput. Sci. 2016, 2, e67. [Google Scholar] [CrossRef] [Green Version]
  47. Weinstein, J.N.; Collisson, E.A.; Mills, G.B.; Shaw, K.R.; Ozenberger, B.A.; Ellrott, K.; Shmulevich, I.; Sander, C.; Stuart, J.M. The Cancer Genome Atlas Pan-Cancer analysis project. Nat. Genet. 2013, 45, 1113–1120. [Google Scholar] [CrossRef]
  48. Love, M.I.; Huber, W.; Anders, S. Moderated estimation of fold change and dispersion for RNA-seq data with DESeq2. Genome Biol. 2014, 15, 550. [Google Scholar] [CrossRef] [Green Version]
  49. Subramanian, A.; Tamayo, P.; Mootha, V.K.; Mukherjee, S.; Ebert, B.L.; Gillette, M.A.; Paulovich, A.; Pomeroy, S.L.; Golub, T.R.; Lander, E.S.; et al. Gene set enrichment analysis: A knowledge-based approach for interpreting genome-wide expression profiles. Proc. Natl. Acad. Sci. USA 2005, 102, 15545–15550. [Google Scholar] [CrossRef] [PubMed] [Green Version]
  50. Nsengimana, J.; Laye, J.; Filia, A.; O’Shea, S.; Muralidhar, S.; Poźniak, J.; Droop, A.; Chan, M.; Walker, C.; Parkinson, L.; et al. β-Catenin-mediated immune evasion pathway frequently operates in primary cutaneous melanomas. J. Clin. Investig. 2018, 128, 2048–2063. [Google Scholar] [CrossRef] [PubMed] [Green Version]
  51. Poźniak, J.; Nsengimana, J.; Laye, J.P.; O’Shea, S.J.; Diaz, J.M.S.; Droop, A.P.; Filia, A.; Harland, M.; Davies, J.R.; Mell, T.; et al. Genetic and Environmental Determinants of Immune Response to Cutaneous Melanoma. Cancer Res. 2019, 79, 2684–2696. [Google Scholar] [CrossRef] [PubMed] [Green Version]
Figure 1. Influence of X-linked genes on skin cutaneous melanoma (SKCM) patient survival. (a) Forrest plot of hazard ratios for median survival according to high or low levels of the 5 X-linked genes. Low groups used as a baseline. The majority of the SKCM patients had no MAGEC3 expression and were, therefore, excluded from the analysis. (b) A Kaplan–Meier (KM) plot showing overall survival of KDM6A high vs. low group and (c) KDM6B high vs. low group in SKCM patients. RNA-seq data were retrieved from The Cancer Genome Atlas (TCGA) and stratified based on the median expression of KDM6A and KDM6B. Log-rank p-value < 0.05 refers to a significant association between gene expression and survival. Differential gene expression and survival of KDM6A based on sex: (d) KDM6A mRNA expression data were plotted based on sex. An unpaired t-test was done to assess the significance between the two sexes, and the p-value is represented as (*), where **** p < 0.0001. (e) The overall curve was plotted in GraphPad Prism for female and (f) male SKCM patients. Log-rank p < 0.05 refers to significance. Gene expression was dichotomized based on sex and corresponding median expression.
Cancers 12 02082 g001
Figure 2. The analysis of patient survival according to the levels of ATRX and KDM6A. (a) A KM plot of overall survival was generated based on the median expression of alpha thalassemia mental retardation X-linked (ATRX). (b) SKCM mRNA expression data were stratified based on the median expression of KDM6A (lysine demethylase 6A) and ATRX, and the KM plot developed on KDM6A-ATRX high vs. KDM6A-ATRX low group, KDM6A high ATRX high vs. KDM6A high ATRX low group, KDM6A low ATRX high vs. KDM6A low ATRX high group, and KDM6A high ATRX low vs. KDM6A low ATRX high group. Log-rank p < 0.05 refers to a significant association. (c) Univariate and multivariate cox regression analyses were performed based on KDM6A and ATRX expression. p < 0.05 refers to significance. (d) ATRX expression based on sex in the SKCM cohort. Statistical analysis was performed by an unpaired t-test.
Cancers 12 02082 g002
Figure 3. Overall survival of KDM6A high-EZH2 low vs. KDM6A low-EZH2 group. (a) A KM plot, showing overall survival of KDM6A high EZH2 low vs. KDM6A low EZH2 group, KDM6A high EZH2 high vs. KDM6A high EZH2 low group, KDM6A low EZH2 high vs. KDM6A low EZH2 low group, and KDM6A high EZH2 high vs. KDM6A low E2H2 low. SKCM patients were stratified based on the median expression of KDM6A and EZH2. (b,c) Overall survival based on sex and EZH2-KDM6A median expression. p < 0.05 indicates the significance of survival.
Cancers 12 02082 g003
Figure 4. Gene set enrichment analysis (GSEA) of KDM6A high vs. low group. (a) Top 3 enrichment plots showing the pathways positively enriched in KDM6A high vs. low group. (b) Similarly, the top 3 enrichment plots, showing the pathways negatively enriched in KDM6A high vs. low group. (c) A forest plot was generated, showing overall GSEA pathways that are positively or negatively enriched according to the normalized enrichment score (NES). NOM, normalized p-value.
Cancers 12 02082 g004
Figure 5. Gene set enrichment analysis of KDM6A high vs. low group based on sex. A forest plot represents the top 5 pathways that are positively enriched and 10 negatively enriched pathways using the NES score in (a) female and (b) male KDM6A high vs. low group. Pathways with normalized p-value < 0.05 refer to the significance and are shown in the plot.
Cancers 12 02082 g005
Figure 6. Gene set enrichment analysis of ATRX high vs. low group. (a) Top 3 enrichment plots showing the pathways positively and (b) negatively enriched in ATRX high vs. low group. (c) A forest plot represents the top 10 pathways that are positively and negatively enriched pathways using the NES score. NOM, normalized p-value.
Cancers 12 02082 g006
Figure 7. Gene set enrichment analysis of KDM6A high-EZH2 low and KDM6A low-EZH2 high group. (a) Top 3 enrichment plots showing the positively and (b) negatively enriched pathways in KDM6A high-EZH2 low vs. KDM6A low-EZH2 high group. (c) A forest plot represents the top 10 pathways that are positively and negatively enriched pathways using the NES score. NOM, normalized p-value.
Cancers 12 02082 g007
Table 1. (a) Effect of gene-gene and gene-sex interaction on overall survival (OS) in SKCM cohort. Numbers representing the p-value where p < 0.05 refers to significant interaction on OS. (b) Effect of interaction on MSS in LMC (Validation cohort).
(a) Effect of gene-gene and gene-sex interaction on OS in SKCM cohort
OverallKDM6AATRXEZH2Sex
KDM6A-0.9830.0330.96
ATRX -0.3130.14
EZH2 -0.02
Sex -
Primary
KDM6A-0.680.320.734
ATRX -0.8780.971
EZH2 -0.045
Sex -
Metastases
KDM6A-0.9910.0420.898
ATRX -0.250.115
EZH2 -0.049
Sex -
(b) Effect of interaction on MSS in LMC (Validation cohort).
PrimaryKDM6AATRXEZH2Sex
KDM6A-0.050.030.41
ATRX -0.100.09
EZH2 -0.02
Sex -
Bold p-value refers to significance where, p < 0.05. Gene names are represented as italic.
Table 2. Correlation between immune cell subsets and KDM6A, ATRX based on gender.
GenesCD4+ T CellsCD8+ T CellsB CellsDCNeutrophilMacrophage
PearsonpPearsonpPearsonpPearsonpPearsonpPearsonp
rrrrrr
KDM6A
Overall
(N = 458)
0.229<0.00010.32<0.00010.180.00010.160.00050.31<0.00010.120.008
KDM6A
Female
(N = 162)
0.240.00020.37<0.00010.31<0.00010.280.00020.47<0.00010.240.002
KDM6A
Male
(N = 274)
0.070.20.120.030.070.240.030.570.20.0080.10.08
KDM6A
Metastases
(N = 355)
0.1380.00960.24<0.00010.180.00060.1520.0040.3<0.00010.080.12
KDM6A
Female
(N = 127)
0.20.0190.4<0.00010.330.00010.280.00140.45<0.00010.2380.0074
KDM6A
Male
(N = 218)
0.060.320.150.0220.050.430.030.560.230.00050.080.2
ATRX
Overall
(N = 458)
0.120.0060.18<0.00010.120.00070.110.010.29<0.00010.170.0002
ATRX
Female
(N = 162)
0.160.030.240.00020.190.010.20.00950.38<0.00010.230.0002
ATRX
Male
(N = 274)
0.070.190.130.030.060.30.030.560.210.00040.140.01
ATRX
Metastases
(N = 355)
0.16690.0020.06430.26650.10270.060.05860.28080.2315<0.00010.08520.2218
ATRX
Female
(N = 127)
0.22170.04-0.01970.92160.16570.13440.029260.79290.22680.040.17040.1235
ATRX
Male
(N = 218)
0.12390.070.061610.38140.05240.45210.026070.71130.21150.00240.065460.4357
KMD6B
Overall
(N = 458)
0.150.0007−0.18<0.0001−0.0140.17-0.0510.28−0.110.0190.0710.12
EZH2
Overall
(N = 458)
−0.060.190.1830.00130.0840.070.0690.140.18<0.0001−0.010.71
Bold Pearson r value refers to significance correlation where p < 0.05. Gene names are represented as italic.
Table 3. Correlation between immune markers and KDM6A based on gender.
GeneCD141BATF3CD103CD25CD69CCR5CXCR3IFNG
(DC)(DC)(DC)(Treg)TremCD8CD4
SpearmanpSpearmanpSpearmanpSpearmanpSpearmanpSpearmanpSpearmanpSpearmanp
rrrrrrrr
KDM6A
Overall
(N = 458)
−0.030.51−0.080.070.010.730.3<0.00010.32<0.00010.180.00010.010.730.150.0008
KDM6A
Female
(N = 162)
−0.030.66−0.020.740.050.470.41<0.00010.46<0.00010.33<0.00010.170.020.280.0003
KDM6A
Male
(N = 274)
−0.060.26−0.140.018−0.040.430.160.00070.210.00060.040.49−0.130.030.050.41
Bold Pearson r value refers to significance correlation where p < 0.05. Gene names are represented as italic.

