Pre-Treatment T2-WI Based Radiomics Features for Prediction of Locally Advanced Rectal Cancer Non-Response to Neoadjuvant Chemoradiotherapy: A Preliminary Study

 ,
, 
Abstract
1. Introduction
2. Results
2.1. Patients Characteristics
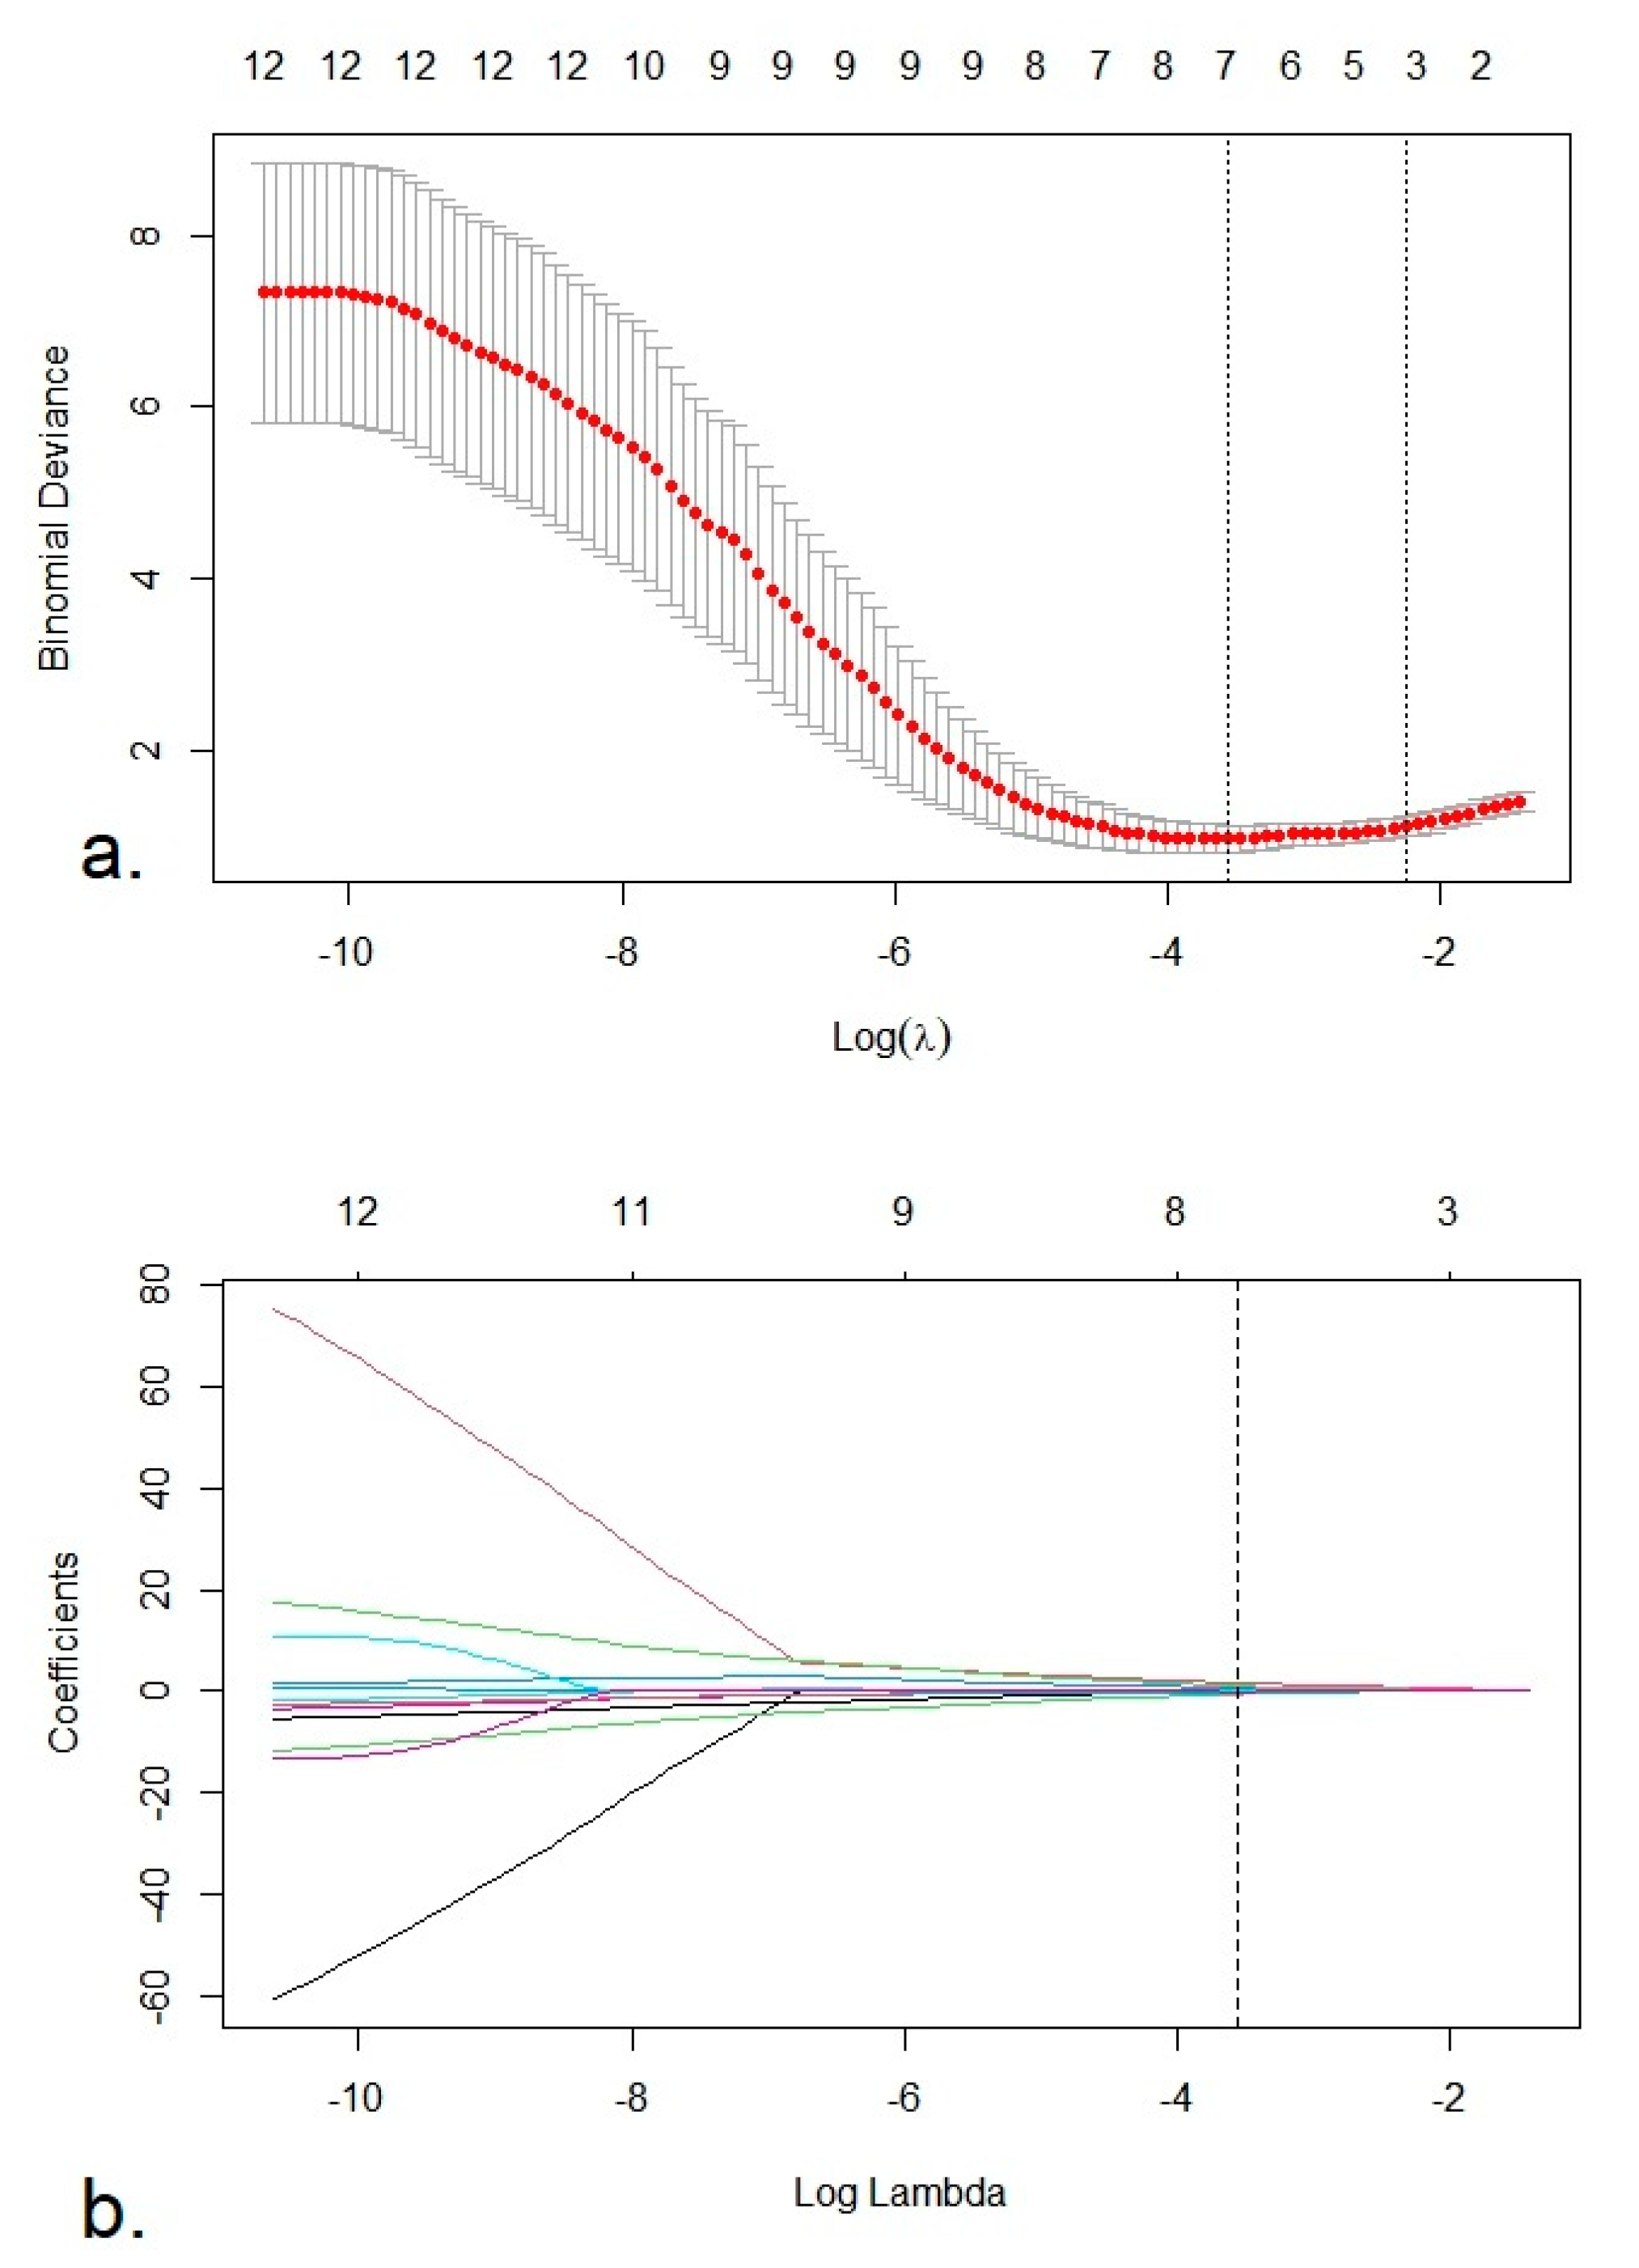
2.2. Feature Selection and Radiomics Score Construction—Training Set
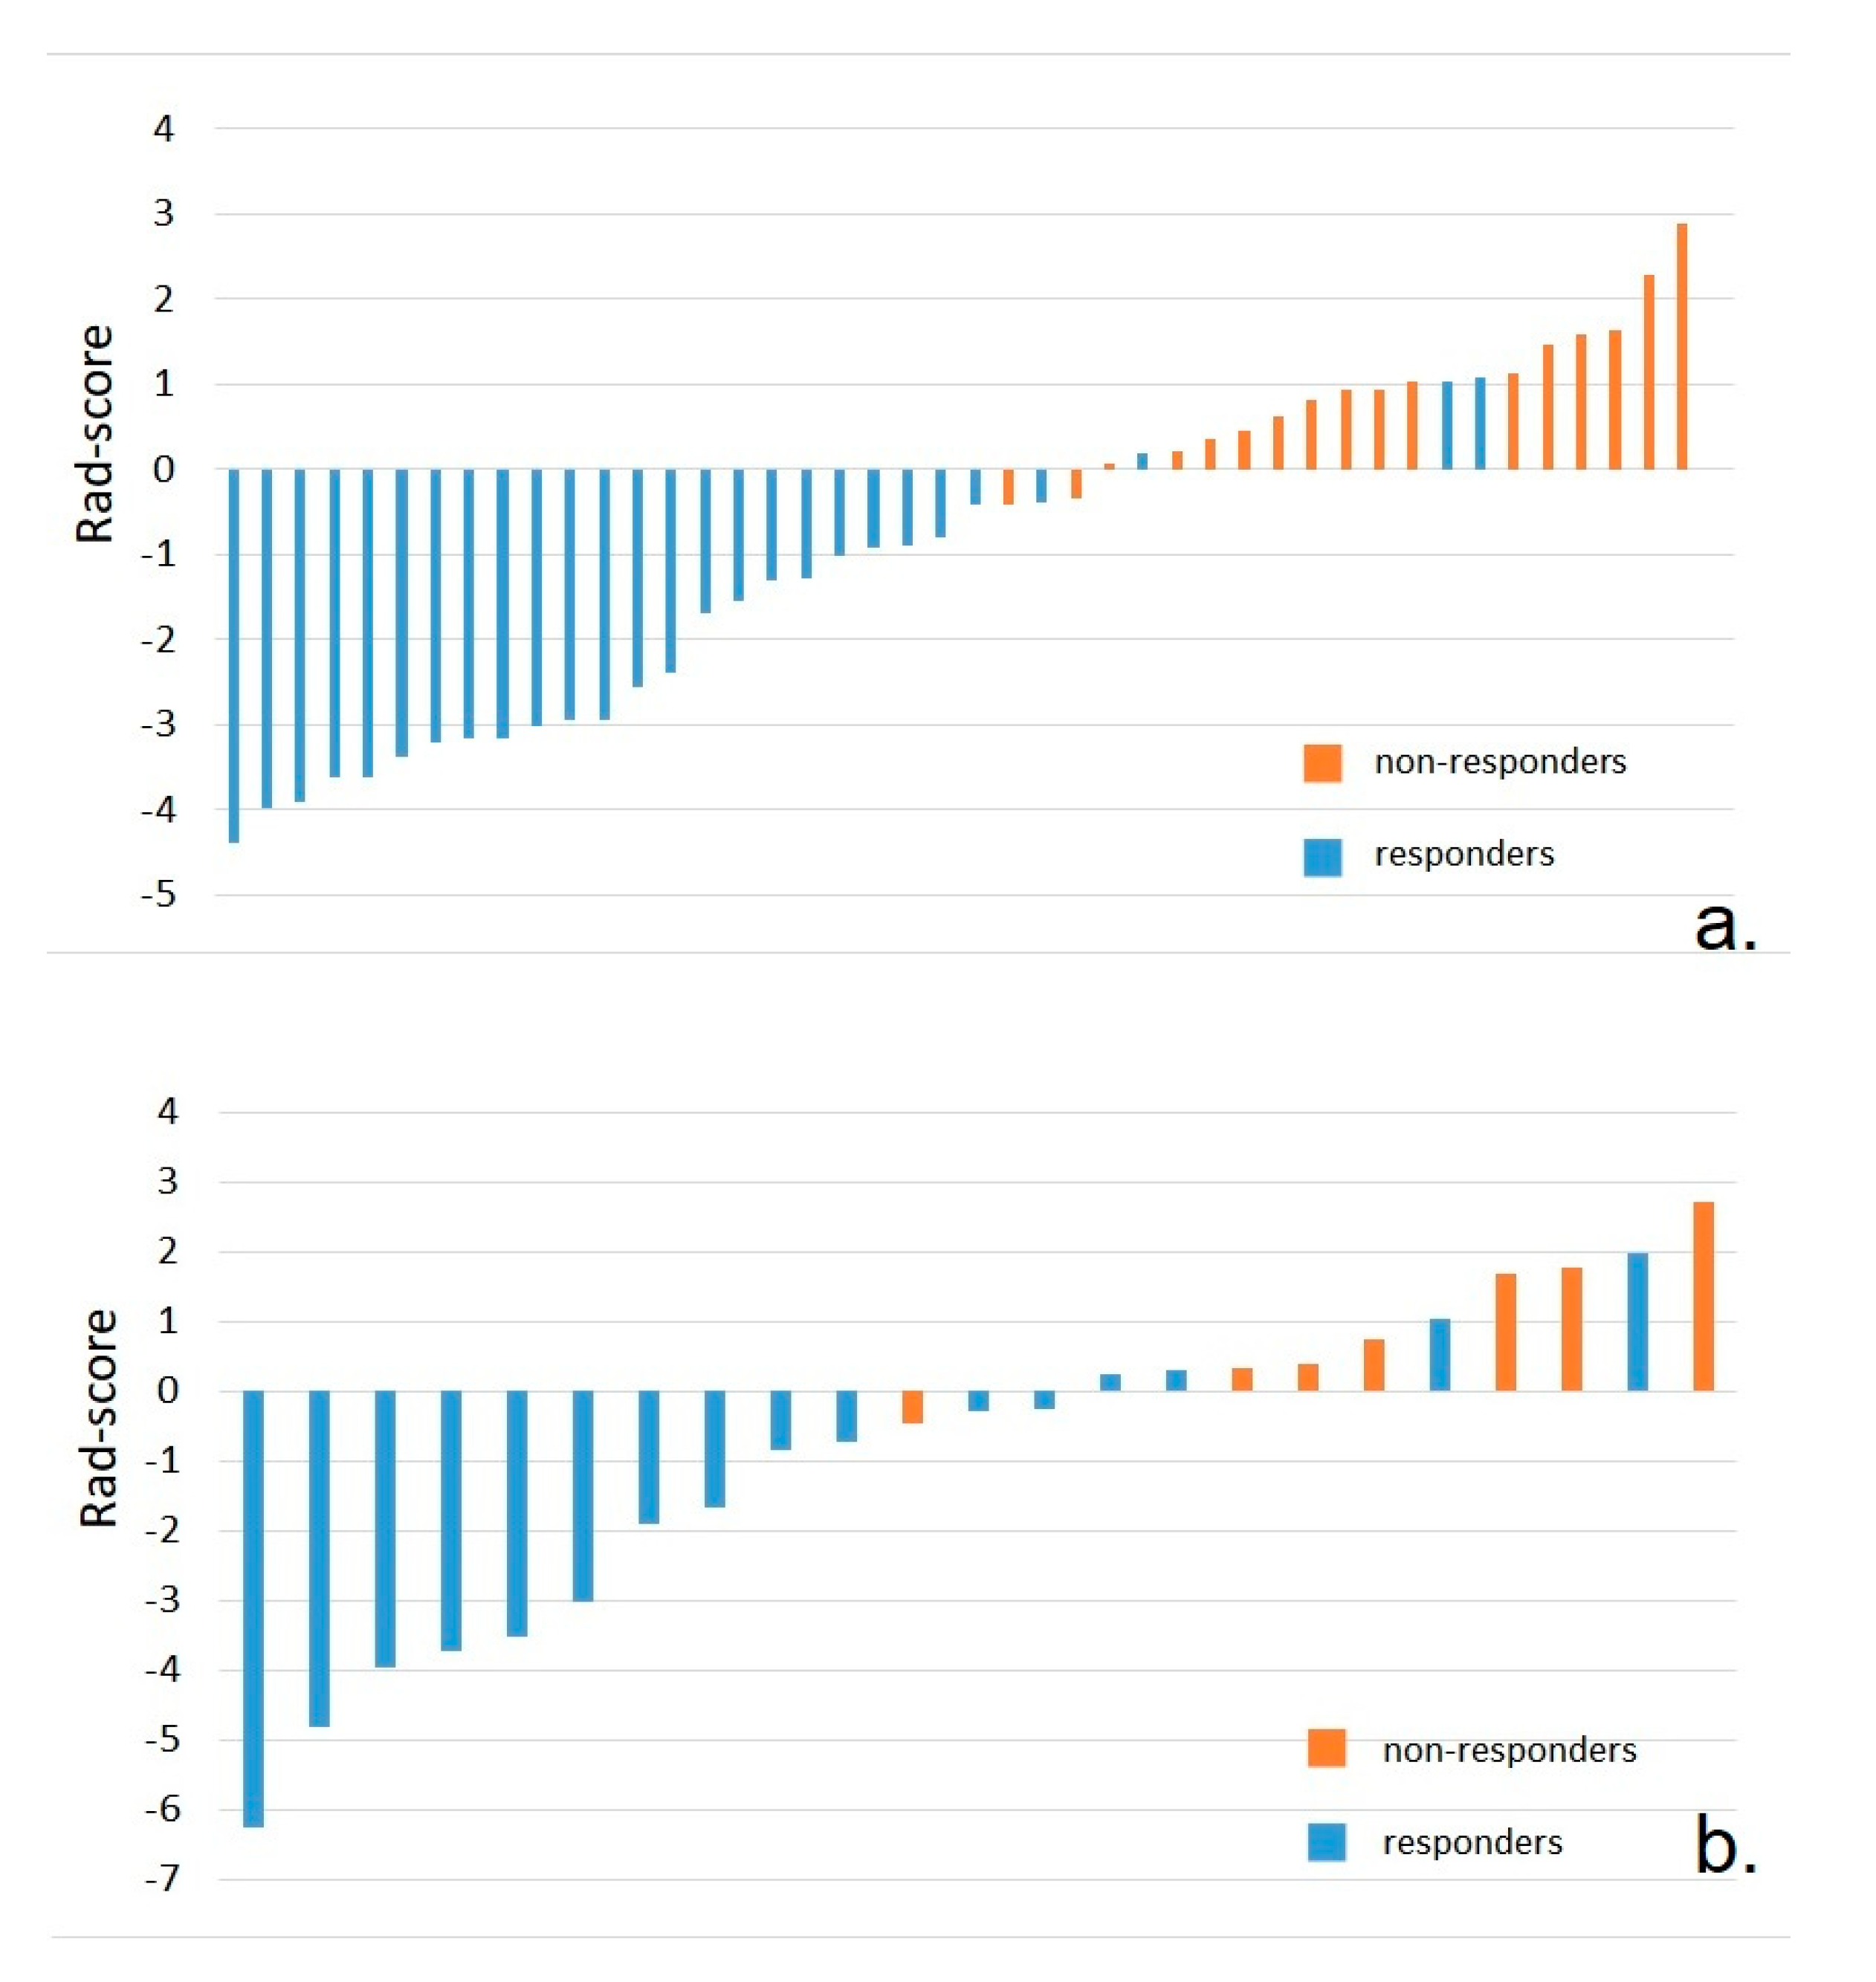
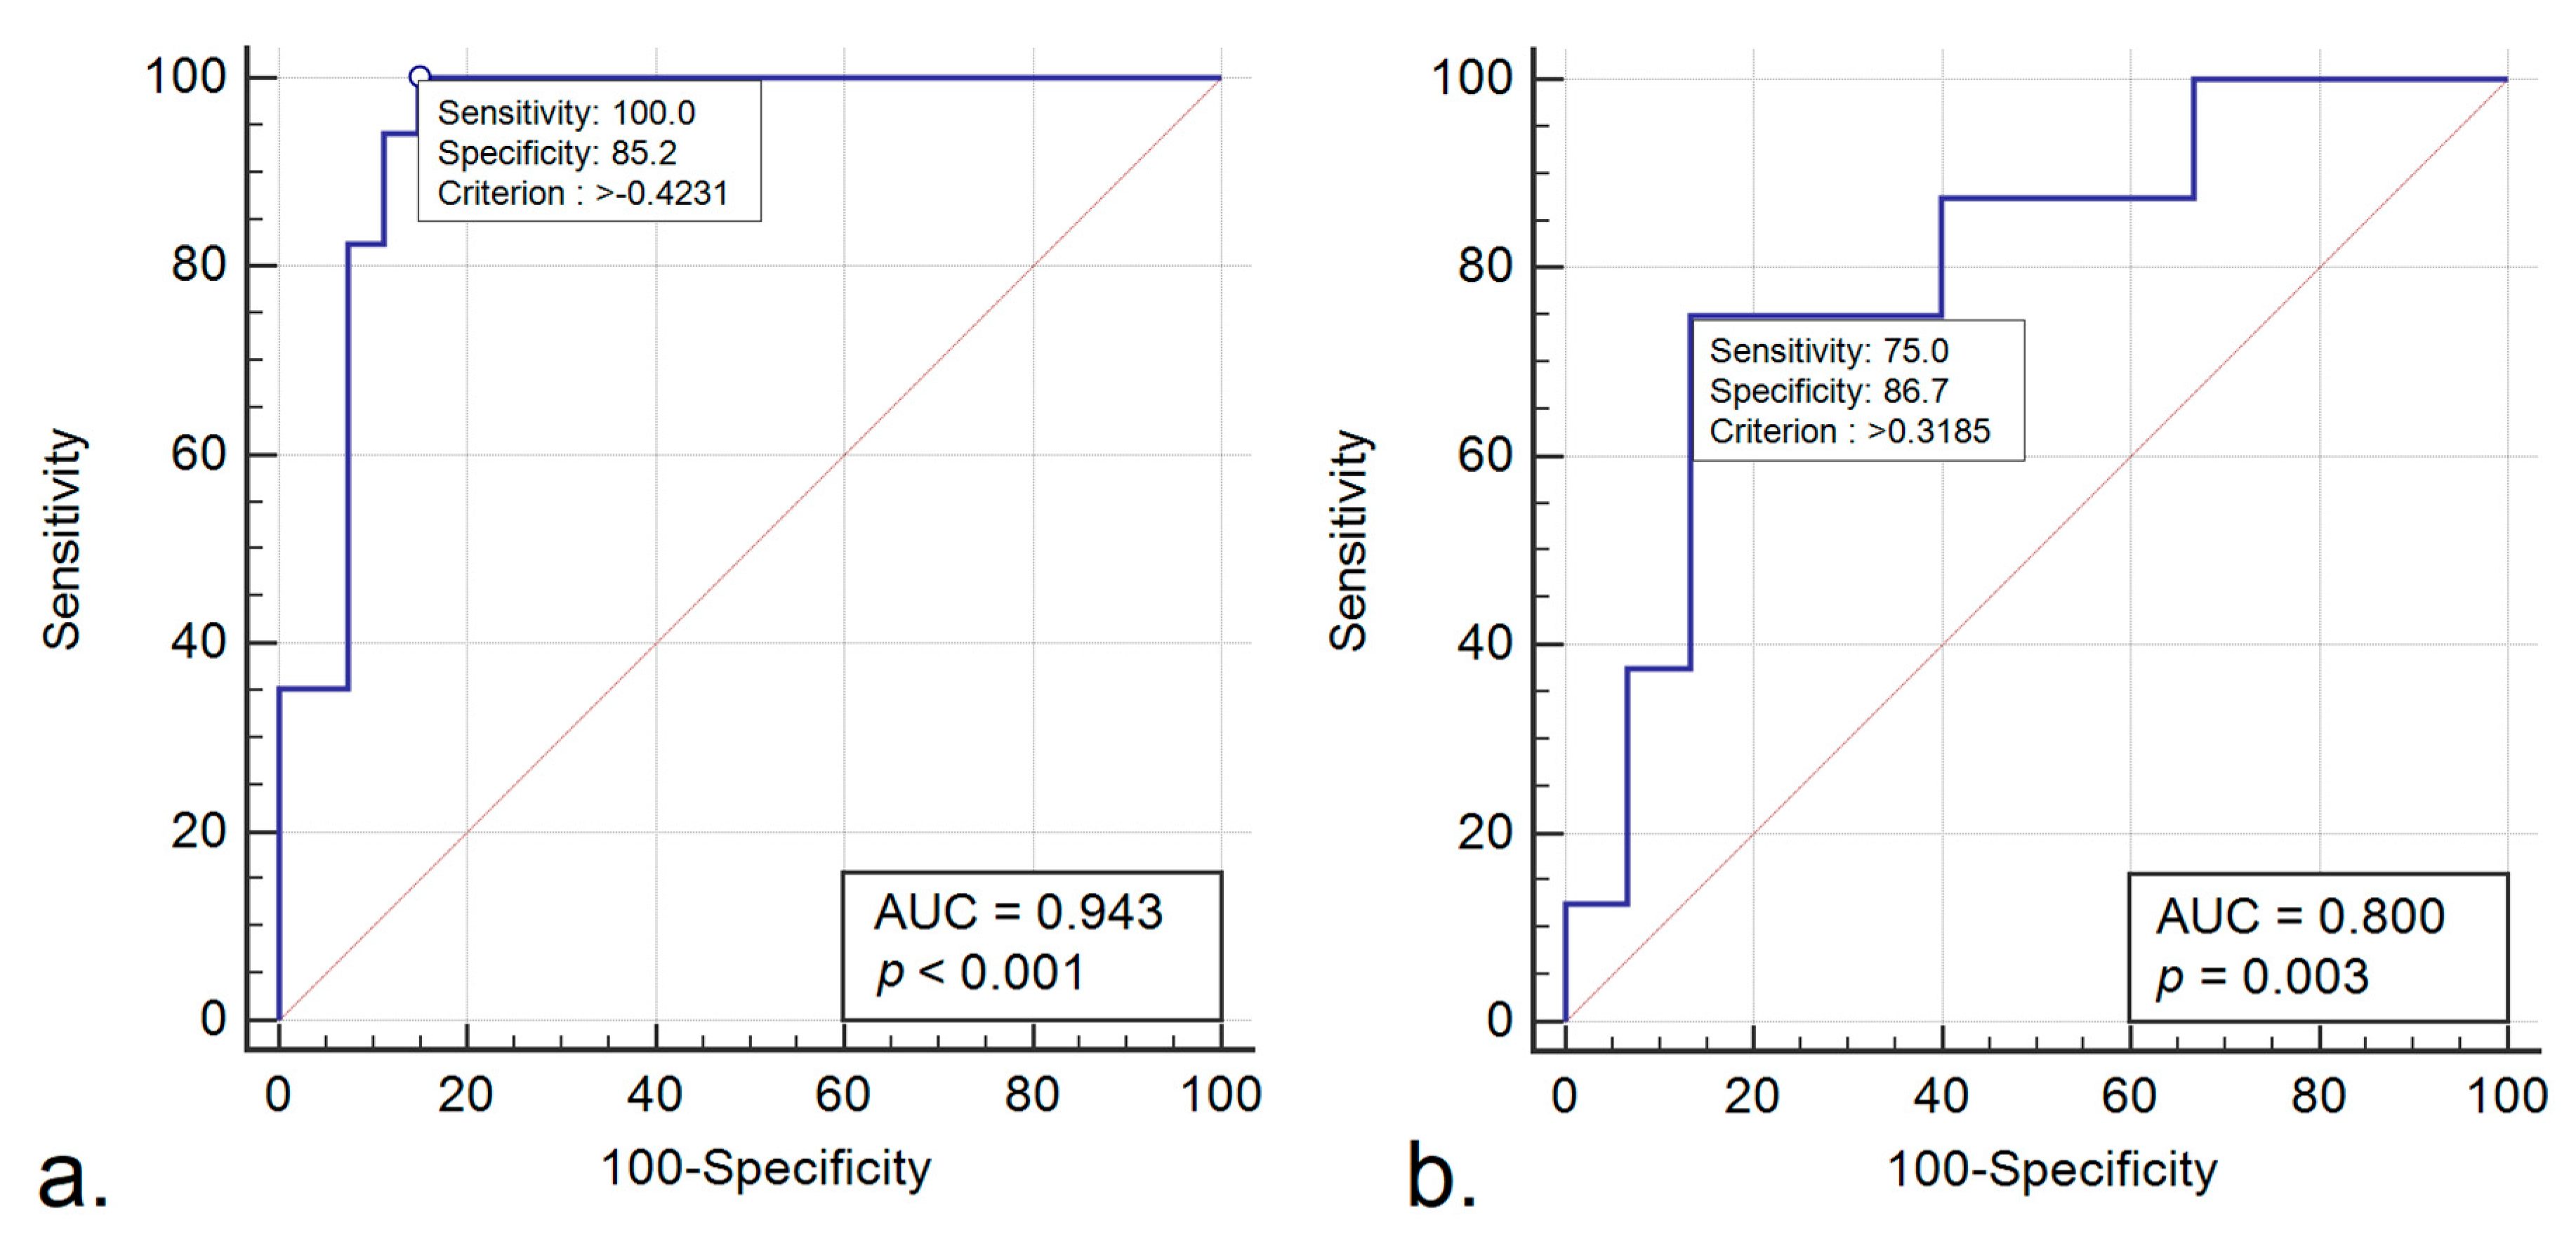
2.3. Performance of the Radiomics Score—Training Set
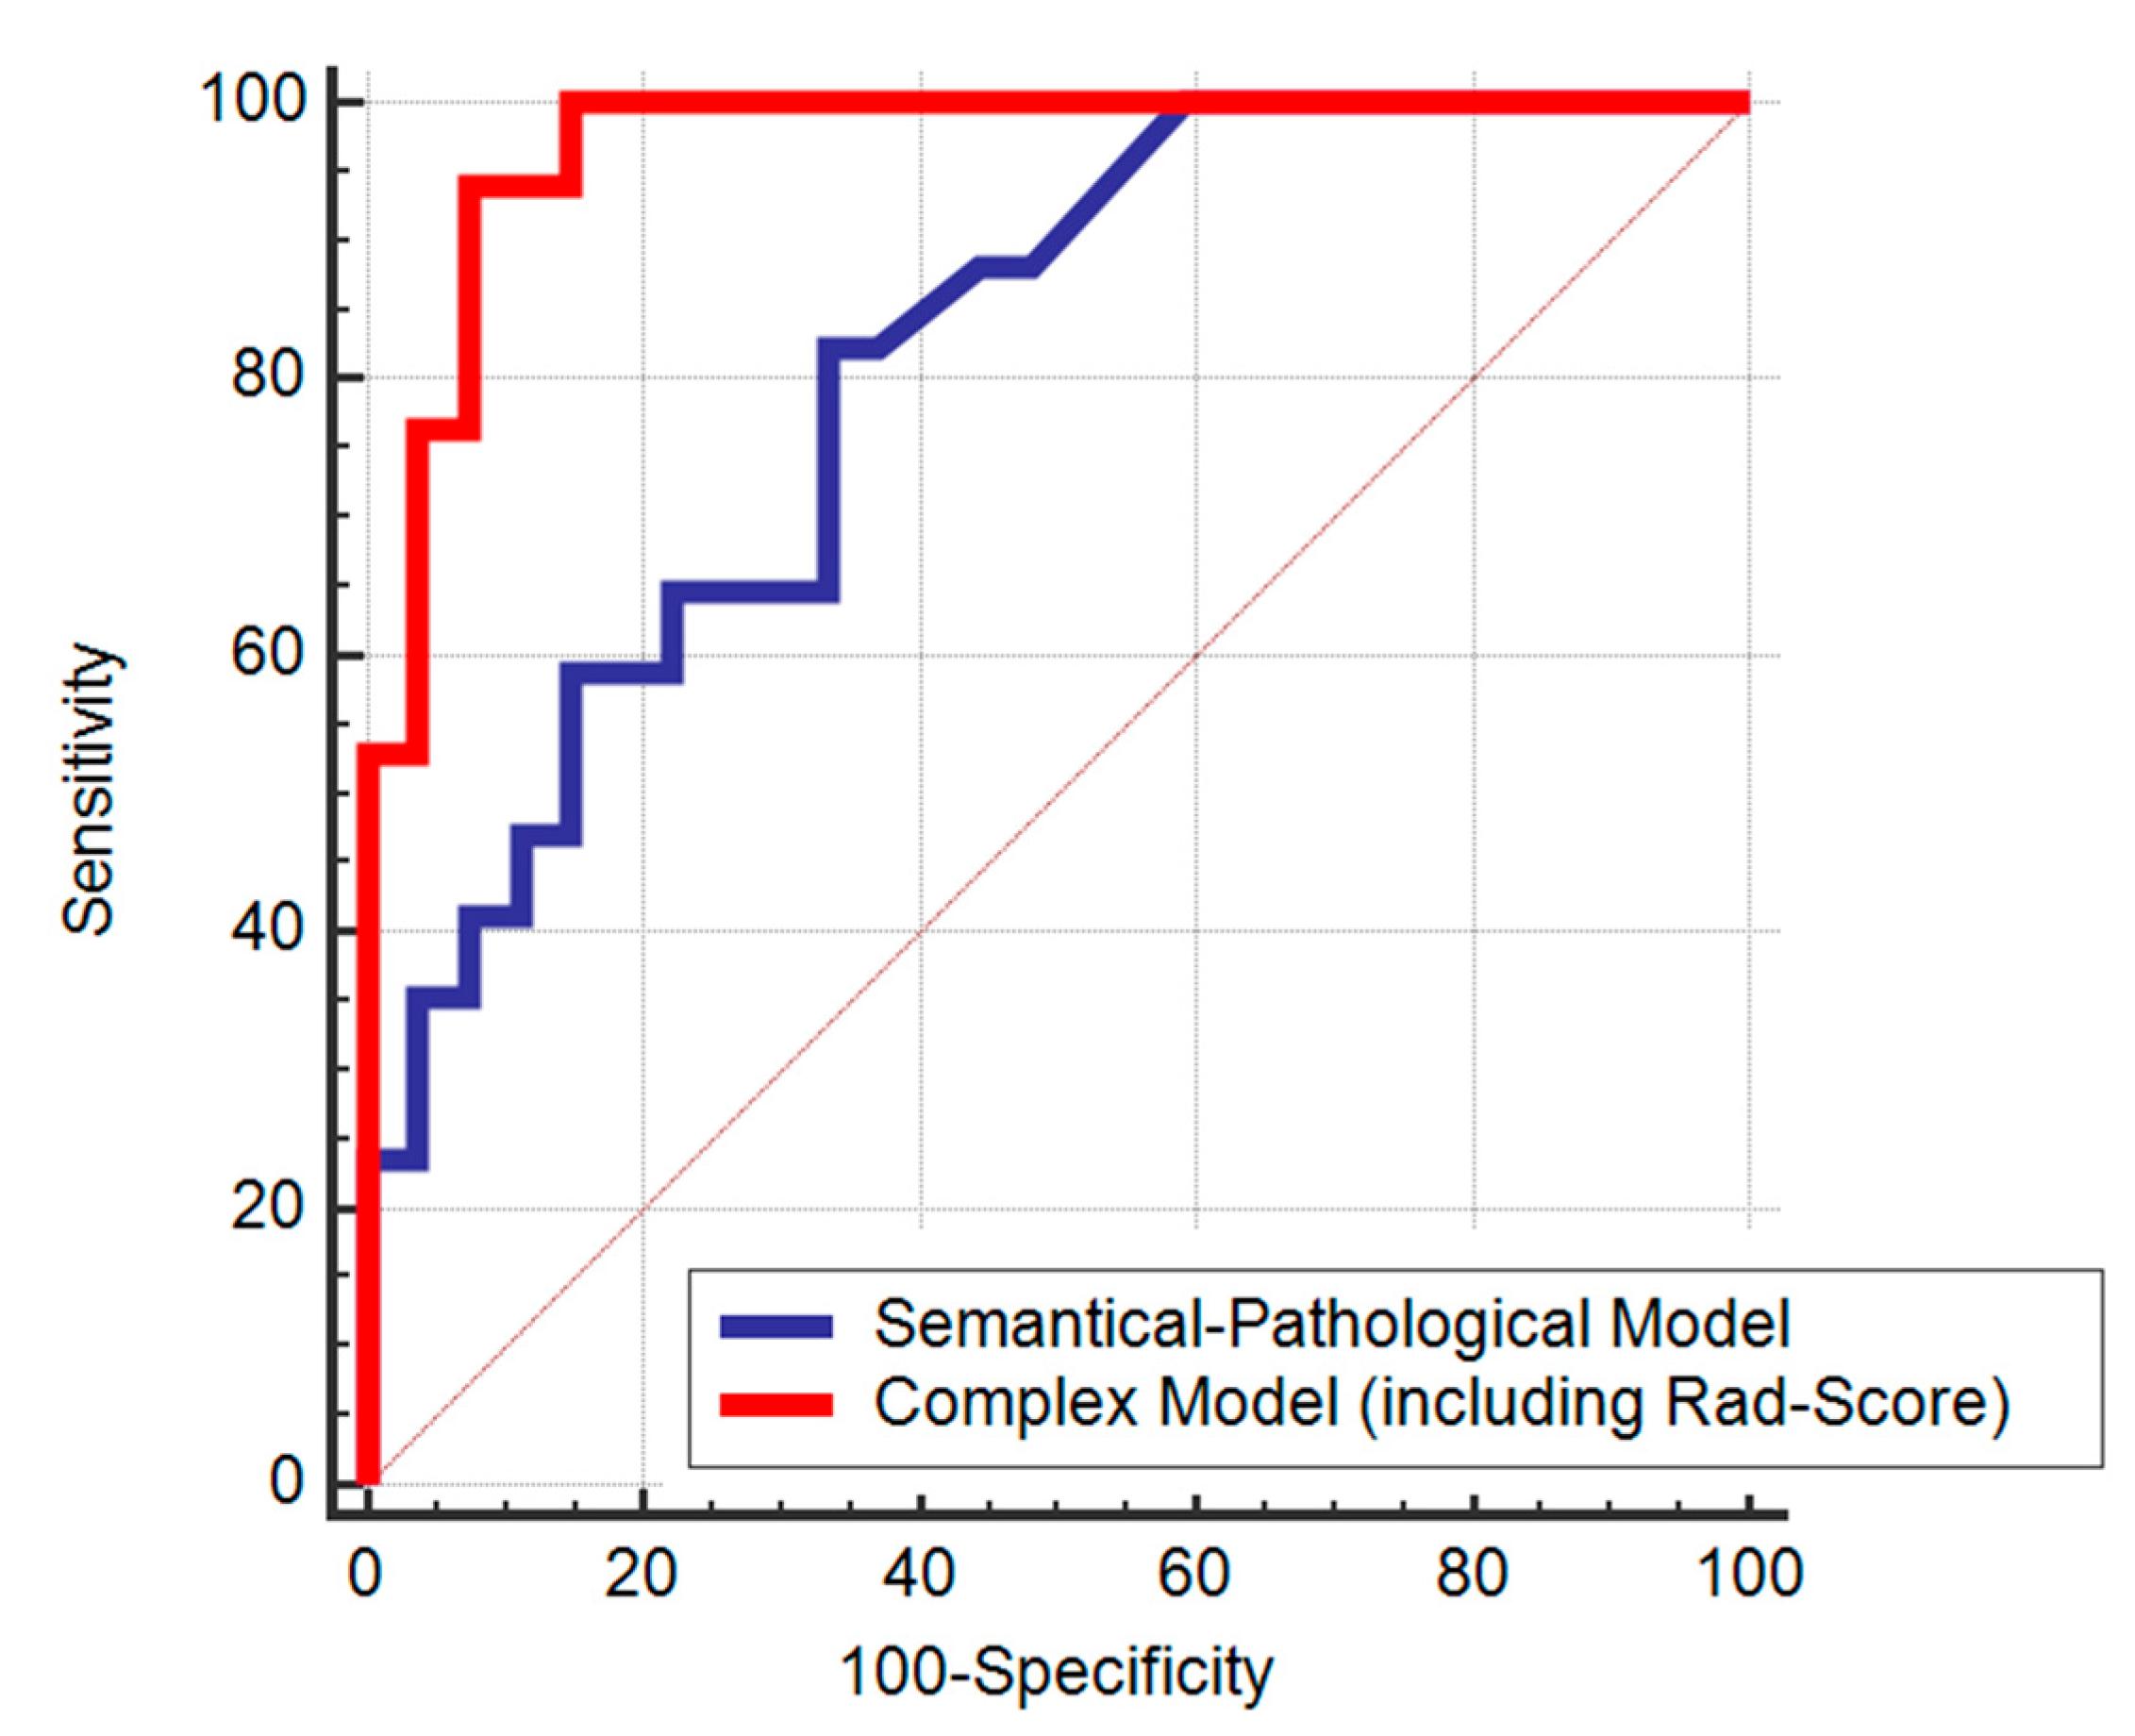
2.4. Validation of the Radiomics Score
3. Discussion
4. Materials and Methods
4.1. Study Population
4.2. Image Acquisition
4.3. Reference Standard
4.4. Preprocessing, Segmentation and Feature Extraction
4.5. Feature Selection and Statistical Analysis
5. Conclusions
Supplementary Materials
Author Contributions
Funding
Conflicts of Interest
Appendix A

| Feature | p Value * |
|---|---|
| log-sigma-5-0-mm-3DglszmSizeZoneNonUniformityNormalized | 0.001 |
| log-sigma-5-0-mm-3Dglszm_SizeZoneNonUniformity | 0.013 |
| log-sigma-5-0-mm-3DglszmGrayLevelNonUniformity | 0.044 |
| log-sigma-5-0-mm-3Dglszm_SmallAreaEmphasis | 0.001 |
| wavelet-LHL_glcm_Contrast | 0.035 |
| wavelet-LHLglcmDifferenceEntropy | 0.033 |
| wavelet-LHLglcmInverseVariance | 0.044 |
| wavelet-LHLglcmIdm | 0.044 |
| wavelet-LHLglcmCorrelation | 0.009 |
| wavelet-LHLglcmSumEntropy | 0.049 |
| wavelet-LHLglcmImc2 | 0.033 |
| wavelet-LHLglcmImc1 | 0.020 |
| wavelet-LHLglcmDifferenceAverage | 0.031 |
| wavelet-LHLglcmId | 0.042 |
| wavelet-LHLgldmDependenceEntropy | 0.033 |
| wavelet-LHLgldmSmallDependenceEmphasis | 0.042 |
| wavelet-LHLgldmDependenceNonUniformityNormalized | 0.044 |
| wavelet-LHLfirstorderInterquartileRange | 0.037 |
| wavelet-LHLfirstorderUniformity | 0.037 |
| wavelet-LHLfirstorderRobustMeanAbsoluteDeviation | 0.042 |
| wavelet-LHLfirstorderEntropy | 0.047 |
| wavelet-LHLfirstorder10Percentile | 0.020 |
| wavelet-LHLglrlmGrayLevelNonUniformityNormalized | 0.042 |
| wavelet-LHLglrlmRunVariance | 0.044 |
| wavelet-LHLglrlmRunEntropy | 0.047 |
| wavelet-LHLglszmGrayLevelVariance | 0.047 |
| wavelet-LHLglszmGrayLevelNonUniformityNormalized | 0.031 |
| wavelet-LHLglszmZonePercentage | 0.047 |
| wavelet-LLHgldmDependenceEntropy | 0.014 |
| wavelet-LLHglszmGrayLevelNonUniformityNormalized | 0.031 |
| wavelet-LLHglszmSizeZoneNonUniformity | 0.049 |
| wavelet-HHLglcmJointAverage | 0.039 |
| wavelet-HHLglcmSumAverage | 0.039 |
| wavelet-HHLglcmContrast | 0.042 |
| wavelet-HHLglcmDifferenceEntropy | 0.047 |
| wavelet-HHLglcmDifferenceVariance | 0.037 |
| wavelet-HHLglcmAutocorrelation | 0.037 |
| wavelet-HHLglcmSumEntropy | 0.049 |
| wavelet-HHLglcmMCC | 0.037 |
| wavelet-HHLglcmSumSquares | 0.039 |
| wavelet-HHLglcmClusterProminence | 0.021 |
| wavelet-HHLglcmImc2 | 0.010 |
| wavelet-HHLglcmImc1 | 0.005 |
| wavelet-HHLglcmDifferenceAverage | 0.047 |
| wavelet-HHLglcmClusterTendency | 0.033 |
| wavelet-HHLgldmGrayLevelVariance | 0.031 |
| wavelet-HHLgldmHighGrayLevelEmphasis | 0.023 |
| wavelet-HHLgldmSmallDependenceHighGrayLevelEmphasis | 0.029 |
| wavelet-HHLgldmDependenceNonUniformityNormalized | 0.047 |
| wavelet-HHLgldmLargeDependenceEmphasis | 0.042 |
| wavelet-HHLgldmLargeDependenceLowGrayLevelEmphasis | 0.039 |
| wavelet-HHLgldmDependenceVariance | 0.039 |
| wavelet-HHLfirstorderMeanAbsoluteDeviation | 0.049 |
| wavelet-HHLfirstorderMaximum | 0.049 |
| wavelet-HHLfirstorderRootMeanSquared | 0.035 |
| wavelet-HHLfirstorderMinimum | 0.029 |
| wavelet-HHLfirstorderRange | 0.033 |
| wavelet-HHLfirstorderVariance | 0.031 |
| wavelet-HHLfirstorderKurtosis | 0.039 |
| wavelet-HHLglrlmGrayLevelVariance | 0.031 |
| wavelet-HHLglrlmGrayLevelNonUniformityNormalized | 0.044 |
| wavelet-HHLglrlmRunVariance | 0.047 |
| wavelet-HHLglrlmLongRunEmphasis | 0.047 |
| wavelet-HHLglrlmShortRunHighGrayLevelEmphasis | 0.027 |
| wavelet-HHLglrlmShortRunEmphasis | 0.047 |
| wavelet-HHLglrlmLongRunHighGrayLevelEmphasis | 0.031 |
| wavelet-HHLglrlmRunPercentage | 0.047 |
| wavelet-HHLglrlmRunEntropy | 0.042 |
| wavelet-HHLglrlmHighGrayLevelRunEmphasis | 0.021 |
| wavelet-HHLglrlmRunLengthNonUniformityNormalized | 0.047 |
| wavelet-HHLglszmGrayLevelVariance | 0.026 |
| wavelet-HHLglszmSmallAreaHighGrayLevelEmphasis | 0.019 |
| wavelet-HHLglszmZonePercentage | 0.049 |
| wavelet-HHLglszmHighGrayLevelZoneEmphasis | 0.023 |

References
- Bray, F.; Ferlay, J.; Soerjomataram, I.; Siegel, R.L.; Torre, L.A.; Jemal, A. Global Cancer Statistics 2018: GLOBOCAN Estimates of Incidence and Mortality Worldwide for 36 Cancers in 185 Countries. CA Cancer J. Clin. 2018, 68, 394–424. [Google Scholar] [CrossRef]
- Siegel, R.L.; Miller, K.D.; Fedewa, S.A.; Ahnen, D.J.; Meester, R.G.S.; Barzi, A.; Jemal, A. Colorectal Cancer Statistics, 2017. CA Cancer J. Clin. 2017, 67, 177–193. [Google Scholar] [CrossRef]
- van Gijn, W.; Marijnen, C.A.M.; Nagtegaal, I.D.; Kranenbarg, E.M.K.; Putter, H.; Wiggers, T.; Rutten, H.J.T.; Påhlman, L.; Glimelius, B.; van de Velde, C.J.H. Preoperative Radiotherapy Combined with Total Mesorectal Excision for Resectable Rectal Cancer: 12-Year Follow-up of the Multicentre, Randomised Controlled TME Trial. Lancet Oncol. 2011, 12, 575–582. [Google Scholar] [CrossRef]
- Benson, A.B.; Venook, A.P.; Al-Hawary, M.M.; Cederquist, L.; Chen, Y.J.; Ciombor, K.K.; Cohen, S.; Cooper, H.S.; Deming, D.; Engstrom, P.F.; et al. Rectal Cancer, Version 2.2018, NCCN clinical practice guidelines in oncology. J. Natl. Compr. Cancer Netw. 2018, 16, 874–901. [Google Scholar] [CrossRef] [PubMed]
- van de Velde, C.J.H.; Boelens, P.G.; Borras, J.M.; Coebergh, J.W.; Cervantes, A.; Blomqvist, L.; Beets-Tan, R.G.H.; van den Broek, C.B.M.; Brown, G.; van Cutsem, E.; et al. EURECCA Colorectal: Multidisciplinary Management: European Consensus Conference Colon & Rectum. Eur. J. Cancer 2014, 50, 1.e1–1.e34. [Google Scholar] [CrossRef]
- Kong, J.C.; Guerra, G.R.; Warrier, S.K.; Lynch, A.C.; Michael, M.; Ngan, S.Y.; Phillips, W.; Ramsay, G.; Heriot, A.G. Prognostic value of tumour regression grade in locally advanced rectal cancer: A systematic review and meta-analysis. Colorectal Dis. 2018, 20, 574–585. [Google Scholar] [CrossRef] [PubMed]
- Vironen, J.; Juhola, M.; Kairaluoma, M.; Jantunen, I.; Kellokumpu, I. Tumour Regression Grading in the Evaluation of Tumour Response after Different Preoperative Radiotherapy Treatments for Rectal Carcinoma. Int. J. Colorectal Dis. 2005, 20, 440–445. [Google Scholar] [CrossRef]
- Bujko, K.; Kolodziejczyk, M.; Nasierowska-Guttmejer, A.; Michalski, W.; Kepka, L.; Chmielik, E.; Wojnar, A.; Chwalinski, M. Tumour Regression Grading in Patients with Residual Rectal Cancer after Preoperative Chemoradiation. Radiother. Oncol. 2010, 95, 298–302. [Google Scholar] [CrossRef]
- Ryan, J.E.; Warrier, S.K.; Lynch, A.C.; Heriot, A.G. Assessing Pathological Complete Response to Neoadjuvant Chemoradiotherapy in Locally Advanced Rectal Cancer: A Systematic Review. Colorectal Dis. 2015, 17, 849–861. [Google Scholar] [CrossRef]
- Park, I.J.; You, Y.N.; Agarwal, A.; Skibber, J.M.; Rodriguez-Bigas, M.A.; Eng, C.; Feig, B.W.; Das, P.; Krishnan, S.; Crane, C.H.; et al. Neoadjuvant Treatment Response as an Early Response Indicator for Patients with Rectal Cancer. J. Clin. Oncol. 2012, 30, 1770–1776. [Google Scholar] [CrossRef]
- O’Connell, M.J.; Colangelo, L.H.; Beart, R.W.; Petrelli, N.J.; Allegra, C.J.; Sharif, S.; Pitot, H.C.; Shields, A.F.; Landry, J.C.; Ryan, D.P.; et al. Capecitabine and Oxaliplatin in the Preoperative Multimodality Treatment of Rectal Cancer: Surgical End Points from National Surgical Adjuvant Breast and Bowel Project Trial R-04. J. Clin. Oncol. 2014, 32, 1927–1934. [Google Scholar] [CrossRef] [PubMed]
- Fokas, E.; Liersch, T.; Fietkau, R.; Hohenberger, W.; Beissbarth, T.; Hess, C.; Becker, H.; Ghadimi, M.; Mrak, K.; Merkel, S.; et al. Tumor Regression Grading after Preoperative Chemoradiotherapy for Locally Advanced Rectal Carcinoma Revisited: Updated Results of the CAO/ARO/AIO-94 Trial. J. Clin. Oncol. 2014, 32, 1554–1562. [Google Scholar] [CrossRef] [PubMed]
- Gérard, J.P.; Azria, D.; Gourgou-Bourgade, S.; Martel-Lafay, I.; Hennequin, C.; Etienne, P.L.; Vendrely, V.; François, E.; de La Roche, G.; Bouché, O.; et al. Clinical Outcome of the ACCORD 12/0405 PRODIGE 2 Randomized Trial in Rectal Cancer. J. Clin. Oncol. 2012, 30, 4558–4565. [Google Scholar] [CrossRef] [PubMed]
- Fokas, E.; Strobel, P.; Fietkau, R.; Ghadimi, M.; Liersch, T.; Grabenbauer, G.G.; Hartmann, A.; Kaufmann, M.; Sauer, R.; Graeven, U.; et al. Tumor regression grading after preoperative chemoradiotherapy as a prognostic factor and individual-level surrogate for disease-free survival in rectal cancer. J. Natl. Cancer Inst. 2017, 109, 109. [Google Scholar] [CrossRef] [PubMed]
- Carlomagno, C.; Farella, A.; Bucci, L.; D’Armiento, F.P.; Pesce, G.; Pepe, S.; Cannella, L.; Pacelli, R.; de Stefano, A.; Solla, R.; et al. Neo-adjuvant treatment of rectal cancer with capecitabine and oxaliplatin in combination with radiotherapy: A phase II study. Ann. Oncol. 2009, 20, 906–912. [Google Scholar] [CrossRef] [PubMed]
- Fokas, E.; Allgäuer, M.; Polat, B.; Klautke, G.; Grabenbauer, G.G.; Fietkau, R.; Kuhnt, T.; Staib, L.; Brunner, T.; Grosu, A.L.; et al. Randomized Phase II Trial of Chemoradiotherapy plus Induction or Consolidation Chemotherapy as Total Neoadjuvant Therapy for Locally Advanced Rectal Cancer: CAO/ARO/AIO-12. J. Clin. Oncol. 2019, 37, 3212–3222. [Google Scholar] [CrossRef] [PubMed]
- Wolff, H.A.; Conradi, L.C.; Beissbarth, T.; Leha, A.; Hohenberger, W.; Merkel, S.; Fietkau, R.; Raab, H.R.; Tschmelitsch, J.; Hess, C.F.; et al. Gender Affects Acute Organ Toxicity during Radiochemotherapy for Rectal Cancer: Long-Term Results of the German CAO/ARO/AIO-94 Phase III Trial. Radiother. Oncol. 2013, 108, 48–54. [Google Scholar] [CrossRef]
- Herman, J.M.; Narang, A.K.; Griffith, K.A.; Zalupski, M.M.; Reese, J.B.; Gearhart, S.L.; Azad, N.S.; Chan, J.; Olsen, L.; Efron, J.E.; et al. The quality-of-life effects of neoadjuvant chemoradiation in locally advanced rectal cancer. Int. J. Radiat. Oncol. Biol. Phys. 2013, 85, e15–e19. [Google Scholar] [CrossRef]
- Loos, M.; Quentmeier, P.; Schuster, T.; Nitsche, U.; Gertler, R.; Keerl, A.; Kocher, T.; Friess, H.; Rosenberg, R. Effect of Preoperative Radio(Chemo)Therapy on Long-Term Functional Outcome in Rectal Cancer Patients: A Systematic Review and Meta-Analysis. Ann. Surg. Oncol. 2013, 20, 1816–1828. [Google Scholar] [CrossRef]
- Sauer, R.; Becker, H.; Hohenberger, W.; Rödel, C.; Wittekind, C.; Fietkau, R.; Martus, P.; Tschmelitsch, J.; Hager, E.; Hess, C.F.; et al. Preoperative versus Postoperative Chemoradiotherapy for Rectal Cancer. N. Engl. J. Med. 2004, 351, 1731–1740. [Google Scholar] [CrossRef]
- Rödel, C.; Martus, P.; Papadoupolos, T.; Füzesi, L.; Klimpfinger, M.; Fietkau, R.; Liersch, T.; Hohenberger, W.; Raab, R.; Sauer, R.; et al. Prognostic Significance of Tumor Regression after Preoperative Chemoradiotherapy for Rectal Cancer. J. Clin. Oncol. 2005, 23, 8688–8696. [Google Scholar] [CrossRef] [PubMed]
- Huh, J.W.; Kim, H.C.; Kim, S.H.; Park, Y.A.; Cho, Y.B.; Yun, S.H.; Lee, W.Y.; Park, H.C.; Choi, D.H.; Park, J.O.; et al. Tumor Regression Grade as a Clinically Useful Outcome Predictor in Patients with Rectal Cancer after Preoperative Chemoradiotherapy. Surgery 2019, 165, 579–585. [Google Scholar] [CrossRef] [PubMed]
- Lee, Y.C.; Hsieh, C.C.; Chuang, J.P. Prognostic Significance of Partial Tumor Regression after Preoperative Chemoradiotherapy for Rectal Cancer: A Meta-Analysis. Dis. Colon Rectum 2013, 56, 1093–1101. [Google Scholar] [CrossRef] [PubMed]
- Gersak, M.M.; Badea, R.; Graur, F.; al Hajjar, N.; Furcea, L.; Dudea, S.M. Endoscopic Ultrasound for the Characterization and Staging of Rectal Cancer. Current State of the Method. Technological Advances and Perspectives. Med. Ultrason. 2015, 227–234. [Google Scholar] [CrossRef]
- Kalisz, K.R.; Enzerra, M.D.; Paspulati, R.M. MRI Evaluation of the Response of Rectal Cancer to Neoadjuvant Chemoradiation Therapy. Radiographics 2019, 39, 538–556. [Google Scholar] [CrossRef]
- Garcia-Aguilar, J.; Chen, Z.; Smith, D.D.; Li, W.; Madoff, R.D.; Cataldo, P.; Marcet, J.; Pastor, C. Identification of a Biomarker Profile Associated with Resistance to Neoadjuvant Chemoradiation Therapy in Rectal Cancer. Ann. Surg. 2011, 254, 486–493. [Google Scholar] [CrossRef]
- Jia, H.; Shen, X.; Guan, Y.; Xu, M.; Tu, J.; Mo, M.; Xie, L.; Yuan, J.; Zhang, Z.; Cai, S.; et al. Predicting the Pathological Response to Neoadjuvant Chemoradiation Using Untargeted Metabolomics in Locally Advanced Rectal Cancer. Radiother. Oncol. 2018, 128, 548–556. [Google Scholar] [CrossRef]
- Huh, J.W.; Lee, J.H.; Kim, H.R. Pretreatment Expression of 13 Molecular Markers as a Predictor of Tumor Responses after Neoadjuvant Chemoradiation in Rectal Cancer. Ann. Surg. 2014, 259, 508–515. [Google Scholar] [CrossRef]
- Park, I.J.; Yu, Y.S.; Mustafa, B.; Park, J.Y.; Seo, Y.B.; Kim, G.-D.; Kim, J.; Kim, C.M.; Noh, H.D.; Hong, S.-M.; et al. A Nine-Gene Signature for Predicting the Response to Preoperative Chemoradiotherapy in Patients with Locally Advanced Rectal Cancer. Cancers 2020, 12, 800. [Google Scholar] [CrossRef]
- Dayde, D.; Tanaka, I.; Jain, R.; Tai, M.C.; Taguchi, A. Predictive and Prognostic Molecular Biomarkers for Response to Neoadjuvant Chemoradiation in Rectal Cancer. Int. J. Mol. Sci. 2017, 18, 573. [Google Scholar] [CrossRef]
- Gillies, R.J.; Kinahan, P.E.; Hricak, H. Radiomics: Images Are More than Pictures, They Are Data. Radiology 2016, 278, 563–577. [Google Scholar] [CrossRef] [PubMed]
- Lambin, P.; Leijenaar, R.T.H.; Deist, T.M.; Peerlings, J.; de Jong, E.E.C.; van Timmeren, J.; Sanduleanu, S.; Larue, R.T.H.M.; Even, A.J.G.; Jochems, A.; et al. Radiomics: The Bridge between Medical Imaging and Personalized Medicine. Nat. Rev. Clin. Oncol. 2017, 14, 749–762. [Google Scholar] [CrossRef] [PubMed]
- Mayerhoefer, M.E.; Materka, A.; Langs, G.; Häggström, I.; Szczypiński, P.; Gibbs, P.; Cook, G. Introduction to Radiomics. J. Nucl. Med. 2020, 61, 488–495. [Google Scholar] [CrossRef] [PubMed]
- Lubner, M.G.; Smith, A.D.; Sandrasegaran, K.; Sahani, D.V.; Pickhardt, P.J. CT Texture Analysis: Definitions, Applications, Biologic Correlates, and Challenges. Radiographics 2017, 37, 1483–1503. [Google Scholar] [CrossRef] [PubMed]
- Rogers, W.; Thulasi Seetha, S.; Refaee, T.A.G.; Lieverse, R.I.Y.; Granzier, R.W.Y.; Ibrahim, A.; Keek, S.A.; Sanduleanu, S.; Primakov, S.P.; Beuque, M.P.L.; et al. Radiomics: From Qualitative to Quantitative Imaging. Br. J. Radiol. 2020, 93, 20190948. [Google Scholar] [CrossRef] [PubMed]
- Capobianco, E.; Dominietto, M. From Medical Imaging to Radiomics: Role of Data Science for Advancing Precision Health. J. Pers. Med. 2020, 10, 15. [Google Scholar] [CrossRef]
- Dagogo-Jack, I.; Shaw, A.T. Tumour Heterogeneity and Resistance to Cancer Therapies. Nat. Rev. Clin. Oncol. 2018, 15, 81–94. [Google Scholar] [CrossRef]
- McGranahan, N.; Swanton, C. Biological and Therapeutic Impact of Intratumor Heterogeneity in Cancer Evolution. Cancer Cell 2015, 27, 15–26. [Google Scholar] [CrossRef]
- Hardiman, K.M.; Ulintz, P.J.; Kuick, R.D.; Hovelson, D.H.; Gates, C.M.; Bhasi, A.; Rodrigues Grant, A.; Liu, J.; Cani, A.K.; Greenson, J.K.; et al. Intra-Tumor Genetic Heterogeneity in Rectal Cancer. Lab. Investig. 2016, 96, 4–15. [Google Scholar] [CrossRef]
- Wei, L.; Osman, S.; Hatt, M.; el Naqa, I. Machine Learning for Radiomics-Based Multimodality and Multiparametric Modeling. Q. J. Nucl. Med. Mol. Imaging 2019, 63, 323–338. [Google Scholar] [CrossRef]
- Cuocolo, R.; Caruso, M.; Perillo, T.; Ugga, L.; Petretta, M. Machine Learning in Oncology: A Clinical Appraisal. Cancer Lett. 2020, 481, 55–62. [Google Scholar] [CrossRef] [PubMed]
- Koenigkam Santos, M.; Raniery Ferreira Júnior, J.; Tadao Wada, D.; Priscilla Magalhães Tenório, A.; Henrique Nogueira Barbosa, M.; Mazzoncini De Azevedo Marques, P. Artificial Intelligence, Machine Learning, Computer-Aided Diagnosis, and Radiomics: Advances in Imaging towards to Precision Medicine. Radiologia Brasileira 2019, 52, 387–396. [Google Scholar] [CrossRef] [PubMed]
- Papanikolaou, N.; Matos, C.; Koh, D.M. How to Develop a Meaningful Radiomic Signature for Clinical Use in Oncologic Patients. Cancer Imaging 2020, 20. [Google Scholar] [CrossRef] [PubMed]
- Schick, U.; Lucia, F.; Dissaux, G.; Visvikis, D.; Badic, B.; Masson, I.; Pradier, O.; Bourbonne, V.; Hatt, M. MRI-derived radiomics: Methodology and clinical applications in the field of pelvic oncology. Br. J. Radiol. 2019, 92, 20190105. [Google Scholar] [CrossRef]
- Liu, Z.; Wang, S.; Dong, D.; Wei, J.; Fang, C.; Zhou, X.; Sun, K.; Li, L.; Li, B.; Wang, M.; et al. The Applications of Radiomics in Precision Diagnosis and Treatment of Oncology: Opportunities and Challenges. Theranostics 2019, 9, 1303–1322. [Google Scholar] [CrossRef] [PubMed]
- Nougaret, S.; Tibermacine, H.; Tardieu, M.; Sala, E. Radiomics: An Introductory Guide to What It May Foretell. Curr. Oncol. Rep. 2019, 21, 70. [Google Scholar] [CrossRef]
- Bi, W.L.; Hosny, A.; Schabath, M.B.; Giger, M.L.; Birkbak, N.J.; Mehrtash, A.; Allison, T.; Arnaout, O.; Abbosh, C.; Dunn, I.F.; et al. Artificial Intelligence in Cancer Imaging: Clinical Challenges and Applications. CA Cancer J. Clin. 2019, 69, 127–157. [Google Scholar] [CrossRef]
- Horvat, N.; Bates, D.D.B.; Petkovska, I. Novel Imaging Techniques of Rectal Cancer: What Do Radiomics and Radiogenomics Have to Offer? A Literature Review. Abdom. Radiol. 2019, 44, 3764–3774. [Google Scholar] [CrossRef]
- Liu, Z.; Zhang, X.Y.; Shi, Y.J.; Wang, L.; Zhu, H.T.; Tang, Z.; Wang, S.; Li, X.T.; Tian, J.; Sun, Y.S. Radiomics Analysis for Evaluation of Pathological Complete Response to Neoadjuvant Chemoradiotherapy in Locally Advanced Rectal Cancer. Clin. Cancer Res. 2017, 23, 7253–7262. [Google Scholar] [CrossRef]
- Cui, Y.; Yang, X.; Shi, Z.; Yang, Z.; Du, X.; Zhao, Z.; Cheng, X. Radiomics Analysis of Multiparametric MRI for Prediction of Pathological Complete Response to Neoadjuvant Chemoradiotherapy in Locally Advanced Rectal Cancer. Eur. Radiol. 2019, 29, 1211–1220. [Google Scholar] [CrossRef]
- Horvat, N.; Veeraraghavan, H.; Khan, M.; Blazic, I.; Zheng, J.; Capanu, M.; Sala, E.; Garcia-Aguilar, J.; Gollub, M.J.; Petkovska, I. MR Imaging of Rectal Cancer: Radiomics Analysis to Assess Treatment Response after Neoadjuvant Therapy. Radiology 2018, 287, 833–843. [Google Scholar] [CrossRef] [PubMed]
- Li, Y.; Liu, W.; Pei, Q.; Zhao, L.; Güngör, C.; Zhu, H.; Song, X.; Li, C.; Zhou, Z.; Xu, Y.; et al. Predicting Pathological Complete Response by Comparing MRI-Based Radiomics Pre- and Postneoadjuvant Radiotherapy for Locally Advanced Rectal Cancer. Cancer Med. 2019, 8, 7244–7252. [Google Scholar] [CrossRef] [PubMed]
- Yang, L.; Qiu, M.; Xia, C.; Li, Z.; Wang, Z.; Zhou, X.; Wu, B. Value of High-Resolution DWI in Combination with Texture Analysis for the Evaluation of Tumor Response after Preoperative Chemoradiotherapy for Locally Advanced Rectal Cancer. Am. J. Roentgenol. 2019, 212, 1279–1286. [Google Scholar] [CrossRef] [PubMed]
- Shu, Z.; Fang, S.; Ye, Q.; Mao, D.; Cao, H.; Pang, P.; Gong, X. Prediction of Efficacy of Neoadjuvant Chemoradiotherapy for Rectal Cancer: The Value of Texture Analysis of Magnetic Resonance Images. Abdom. Radiol. 2019, 44, 3775–3784. [Google Scholar] [CrossRef]
- Aker, M.; Ganeshan, B.; Afaq, A.; Wan, S.; Groves, A.M.; Arulampalam, T. Magnetic Resonance Texture Analysis in Identifying Complete Pathological Response to Neoadjuvant Treatment in Locally Advanced Rectal Cancer. Dis. Colon Rectum 2019, 62, 163–170. [Google Scholar] [CrossRef]
- Nie, K.; Shi, L.; Chen, Q.; Hu, X.; Jabbour, S.K.; Yue, N.; Niu, T.; Sun, X. Rectal Cancer: Assessment of Neoadjuvant Chemoradiation Outcome Based on Radiomics of Multiparametric MRI. Clin. Cancer Res. 2016, 22, 5256–5264. [Google Scholar] [CrossRef]
- Yi, X.; Pei, Q.; Zhang, Y.; Zhu, H.; Wang, Z.; Chen, C.; Li, Q.; Long, X.; Tan, F.; Zhou, Z.; et al. MRI-Based Radiomics Predicts Tumor Response to Neoadjuvant Chemoradiotherapy in Locally Advanced Rectal Cancer. Front. Oncol. 2019, 9, 552. [Google Scholar] [CrossRef]
- Shi, L.; Zhang, Y.; Nie, K.; Sun, X.; Niu, T.; Yue, N.; Kwong, T.; Chang, P.; Chow, D.; Chen, J.H.; et al. Machine learning for prediction of chemoradiation therapy response in rectal cancer using pre-treatment and mid-radiation multi-parametric MRI. Magn. Reson. Imaging 2019, 61, 33–40. [Google Scholar] [CrossRef]
- Meng, Y.; Zhang, C.; Zou, S.; Zhao, X.; Xu, K.; Zhang, H.; Zhou, C. MRI Texture Analysis in Predicting Treatment Response to Neoadjuvant Chemoradiotherapy in Rectal Cancer. Oncotarget 2018, 9, 11999–12008. [Google Scholar] [CrossRef]
- Shayesteh, S.P.; Alikhassi, A.; Fard Esfahani, A.; Miraie, M.; Geramifar, P.; Bitarafan-rajabi, A.; Haddad, P. Neo-Adjuvant Chemoradiotherapy Response Prediction Using MRI Based Ensemble Learning Method in Rectal Cancer Patients. Phys. Med. 2019, 62, 111–119. [Google Scholar] [CrossRef]
- Kim, S.H.; Chang, H.J.; Kim, D.Y.; Park, J.W.; Baek, J.Y.; Kim, S.Y.; Park, S.C.; Oh, J.H.; Yu, A.; Nam, B.H. What Is the Ideal Tumor Regression Grading System in Rectal Cancer Patients after Preoperative Chemoradiotherapy? Cancer Res. Treat. 2016, 48, 998–1009. [Google Scholar] [CrossRef]
- Liu, M.; Lv, H.; Liu, L.H.; Yang, Z.H.; Jin, E.H.; Wang, Z.C. Locally Advanced Rectal Cancer: Predicting Non-Responders to Neoadjuvant Chemoradiotherapy Using Apparent Diffusion Coefficient Textures. Int. J. Colorectal Dis. 2017, 32, 1009–1012. [Google Scholar] [CrossRef] [PubMed]
- Yang, C.; Jiang, Z.K.; Liu, L.H.; Zeng, M.S. Pre-Treatment ADC Image-Based Random Forest Classifier for Identifying Resistant Rectal Adenocarcinoma to Neoadjuvant Chemoradiotherapy. Int. J. Colorectal Dis. 2020, 35, 101–107. [Google Scholar] [CrossRef] [PubMed]
- Zhou, X.; Yi, Y.; Liu, Z.; Cao, W.; Lai, B.; Sun, K.; Li, L.; Zhou, Z.; Feng, Y.; Tian, J. Radiomics-Based Pretherapeutic Prediction of Non-Response to Neoadjuvant Therapy in Locally Advanced Rectal Cancer. Ann. Surg. Oncol. 2019, 26, 1676–1684. [Google Scholar] [CrossRef] [PubMed]
- Gourtsoyianni, S.; Papanikolaou, N. Role of Magnetic Resonance Imaging in Primary Rectal Cancer-Standard Protocol and Beyond. Semin. Ultrasound CT MRI 2016, 37, 323–330. [Google Scholar] [CrossRef] [PubMed]
- Horvat, N.; Rocha, C.C.T.; Oliveira, B.C.; Petkovska, I.; Gollub, M.J. MRI of Rectal Cancer: Tumor Staging, Imaging Techniques, and Management. Radiographics 2019, 39, 367–387. [Google Scholar] [CrossRef]
- Treiber, J.M.; White, N.S.; Steed, T.C.; Bartsch, H.; Holland, D.; Farid, N.; McDonald, C.R.; Carter, B.S.; Dale, A.M.; Chen, C.C. Characterization and Correction of Geometric Distortions in 814 Diffusion Weighted Images. PLoS ONE 2016, 11, e0152472. [Google Scholar] [CrossRef]
- Tao, R.; Fletcher, P.T.; Gerber, S.; Whitaker, R.T. A Variational Image-Based Approach to the Correction of Susceptibility Artifacts in the Alignment of Diffusion Weighted and Structural MRI. In Proceedings of the 21st International Conference, IPMI 2009, Williamsburg, VA, USA, 5–10 July 2009; Volume 21, pp. 664–675. [Google Scholar] [CrossRef]
- Antunes, J.T.; Ofshteyn, A.; Bera, K.; Wang, E.Y.; Brady, J.T.; Willis, J.E.; Friedman, K.A.; Marderstein, E.L.; Kalady, M.F.; Stein, S.L.; et al. Radiomic Features of Primary Rectal Cancers on Baseline T2-Weighted MRI Are Associated With Pathologic Complete Response to Neoadjuvant Chemoradiation: A Multisite Study. J. Magn. Reson. Imaging 2020. [Google Scholar] [CrossRef]
- Cusumano, D.; Dinapoli, N.; Boldrini, L.; Chiloiro, G.; Gatta, R.; Masciocchi, C.; Lenkowicz, J.; Casà, C.; Damiani, A.; Azario, L.; et al. Fractal-Based Radiomic Approach to Predict Complete Pathological Response after Chemo-Radiotherapy in Rectal Cancer. Radiol. Med. 2018, 123, 286–295. [Google Scholar] [CrossRef]
- Shaish, H.; Aukerman, A.; Vanguri, R.; Spinelli, A.; Armenta, P.; Jambawalikar, S.; Makkar, J.; Bentley-Hibbert, S.; del Portillo, A.; Kiran, R.; et al. Radiomics of MRI for Pretreatment Prediction of Pathologic Complete Response, Tumor Regression Grade, and Neoadjuvant Rectal Score in Patients with Locally Advanced Rectal Cancer Undergoing Neoadjuvant Chemoradiation: An International Multicenter Study. Eur. Radiol. 2020. [Google Scholar] [CrossRef]
- Hamerla, G.; Meyer, H.-J.; Hambsch, P.; Wolf, U.; Kuhnt, T.; Hoffmann, K.-T.; Surov, A. Radiomics Model Based on Non-Contrast CT Shows No Predictive Power for Complete Pathological Response in Locally Advanced Rectal Cancer. Cancers 2019, 11, 1680. [Google Scholar] [CrossRef] [PubMed]
- Li, Z.Y.; Wang, X.D.; Li, M.; Liu, X.J.; Ye, Z.; Song, B.; Yuan, F.; Yuan, Y.; Xia, C.C.; Zhang, X.; et al. Multi-Modal Radiomics Model to Predict Treatment Response to Neoadjuvant Chemotherapy for Locally Advanced Rectal Cancer. World J Gastroenterol. 2020, 26, 2388–2402. [Google Scholar] [CrossRef]
- Moradmand, H.; Aghamiri, S.M.R.; Ghaderi, R. Impact of Image Preprocessing Methods on Reproducibility of Radiomic Features in Multimodal Magnetic Resonance Imaging in Glioblastoma. J. Appl. Clin. Med Phys. 2020, 21, 179–190. [Google Scholar] [CrossRef] [PubMed]
- Stanzione, A.; Cuocolo, R.; Cocozza, S.; Romeo, V.; Persico, F.; Fusco, F.; Longo, N.; Brunetti, A.; Imbriaco, M. Detection of Extraprostatic Extension of Cancer on Biparametric MRI Combining Texture Analysis and Machine Learning: Preliminary Results. Acad. Radiol. 2019, 26, 1338–1344. [Google Scholar] [CrossRef] [PubMed]
- Tan, X.; Ma, Z.; Yan, L.; Ye, W.; Liu, Z.; Liang, C. Radiomics Nomogram Outperforms Size Criteria in Discriminating Lymph Node Metastasis in Resectable Esophageal Squamous Cell Carcinoma. Eur. Radiol. 2019, 29, 392–400. [Google Scholar] [CrossRef]
- He, B.; Ji, T.; Zhang, H.; Zhu, Y.; Shu, R.; Zhao, W.; Wang, K. MRI-Based Radiomics Signature for Tumor Grading of Rectal Carcinoma Using Random Forest Model. J. Cell. Physiol. 2019, 234, 20501–20509. [Google Scholar] [CrossRef]
- Liang, M.; Cai, Z.; Zhang, H.; Huang, C.; Meng, Y.; Zhao, L.; Li, D.; Ma, X.; Zhao, X. Machine Learning-Based Analysis of Rectal Cancer MRI Radiomics for Prediction of Metachronous Liver Metastasis. Acad. Radiol. 2019, 26, 1495–1504. [Google Scholar] [CrossRef]
- Haralick, R.M.; Shanmugam, K. Textural features for image classification. IEEE Trans. Syst. Man Cybern. 1973, 3, 610–621. [Google Scholar] [CrossRef]
- Ryan, R.; Gibbons, D.; Hyland, J.M.P.; Treanor, D.; White, A.; Mulcahy, H.E.; O’Donoghue, D.P.; Moriarty, M.; Fennelly, D.; Sheahan, K. Pathological Response Following Long-Course Neoadjuvant Chemoradiotherapy for Locally Advanced Rectal Cancer. Histopathology 2005, 47, 141–146. [Google Scholar] [CrossRef]
- van Griethuysen, J.J.M.; Lambregts, D.M.J.; Trebeschi, S.; Lahaye, M.J.; Bakers, F.C.H.; Vliegen, R.F.A.; Beets, G.L.; Aerts, H.J.W.L.; Beets-Tan, R.G.H. Radiomics Performs Comparable to Morphologic Assessment by Expert Radiologists for Prediction of Response to Neoadjuvant Chemoradiotherapy on Baseline Staging MRI in Rectal Cancer. Abdom. Radiol. 2020, 45, 632–643. [Google Scholar] [CrossRef]
- van Griethuysen, J.J.M.; Fedorov, A.; Parmar, C.; Hosny, A.; Aucoin, N.; Narayan, V.; Beets-Tan, R.G.H.; Fillion-Robin, J.C.; Pieper, S.; Aerts, H.J.W.L. Computational Radiomics System to Decode the Radiographic Phenotype. Cancer Res. 2017, 77, e104–e107. [Google Scholar] [CrossRef] [PubMed]


| Variable | Training | p Value | Validation | p Value | ||
|---|---|---|---|---|---|---|
| Responders (n = 27) | Non-Responders (n = 17) | Responders (n = 15) | Non-Responders (n = 8) | |||
| Age (years) | 58.33 ± 1.38 | 56.47 ± 2.94 | 0.572 | 66.40 ± 9.60 | 64.12 ± 16.10 | 0.722 |
| Gender | 0.185 | 0.057 | ||||
| Male | 22 (66.7%) | 11 (33.3%) | 5 (45.5%) | 6 (54.5%) | ||
| Female | 5 (45.5%) | 6 (54.5%) | 10 (83.3%) | 2 (16.7%) | ||
| Tumor length (cm) | 58.81 ± 17.99 | 68.88 ± 11.60 | 0.04 * | 62.06 ± 15.01 | 61.50 ± 13.89 | 0.929 |
| Tumor differentiation grade | 0.01 * | 0.149 | ||||
| Well differentiated | 15 (83.3%) | 3 (16.7%) | 5 (83.3%) | 1 (16.7%) | ||
| Moderately differentiated | 11 (55.0%) | 9 (45.0%) | 9 (69.2%) | 4 (30.8%) | ||
| Poor differentiated | 1 (16.7%) | 5 (83.3%) | 1 (25.0%) | 3 (75.0%) | ||
| Clinical tumor stage (cT) | 0.907 | 0.779 | ||||
| T2 | 4 (66.7%) | 2 (33.3%) | 2 (50%) | 2 (50%) | ||
| T3 | 19 (59.4%) | 13 (40.6%) | 11 (68.8%) | 5 (31.2%) | ||
| T4 | 4 (66.7%) | 2 (33.3%) | 2 (66.7%) | 1 (33.3%) | ||
| Clinical nodal stage (cN) | 0.3 | 0.757 | ||||
| N1 | 8 (72.7%) | 3 (27.3%) | 8 (66.7%) | 4 (33.3%) | ||
| N2 | 19 (57.6%) | 14 (42.4%) | 7 (63.6%) | 4 (36.4%) | ||
| MRF | 0.024 * | 0.679 | ||||
| Positive | 4 (33.3%) | 8 (66.7%) | 10 (62.5%) | 6 (37.5%) | ||
| Negative | 23 (71.9%) | 9 (28.1%) | 5 (71.4%) | 2 (28.6%) | ||
| Variable | Coefficient | 95% CI | |
|---|---|---|---|
| Upper | Lower | ||
| Intercept | −0.875 | ||
| log-sigma-5-0-mm-3D_glszm_SmallAreaEmphasis | 1.621 | −0.460 | 4.428 |
| wavelet-LHL_glcm_Correlation | −0.581 | −3.954 | 3.322 |
| wavelet-LHL_firstorder_10Percentile | 0.660 | −1.536 | 16.268 |
| wavelet-HHL_glcm_MCC | −0.074 | −4.724 | 20.345 |
| wavelet-HHL_glcm_Imc1 | 0.984 | −0.232 | 8.356 |
| wavelet-HHL_firstorder_Kurtosis | −0.144 | −7.629 | 7.938 |
| wavelet-HHL_glszm_SmallAreaHighGrayLevelEmphasis | −0.070 | −4.027 | 24.241 |
| Variable | Cut-Off Value | AUC | Accuracy (%) | Se (%) | Sp (%) | PPV (%) | NPV (%) |
|---|---|---|---|---|---|---|---|
| logsigma5_0mm_3D_glszm_SmallAreaEmphasis | −0.24 | 0.80 | 72.7 | 94.1 | 59.3 | 59.3 | 94.1 |
| wavelet-LHL_glcm_Correlation | −0.58 | 0.74 | 65.6 | 100 | 44.4 | 53.1 | 100.0 |
| wavelet_LHL_firstorder_10Percentile | −0.28 | 0.71 | 75.0 | 94.1 | 62.9 | 61.5 | 94.4 |
| wavelet-HHL_glcm_MCC | 0.34 | 0.69 | 63.6 | 88.2 | 48.1 | 51.7 | 86.7 |
| wavelet_HHL_glcm_Imc1 | 0.01 | 0.75 | 75.0 | 88.2 | 66.7 | 62.5 | 90.0 |
| wavelet_HHL_firstorder_Kurtosis | 0.33 | 0.69 | 68.2 | 70.6 | 66.7 | 57.1 | 78.3 |
| wavelet_HHL_glszm_SmallAreaHighGrayLevel Emphasis | 0.13 | 0.71 | 68.2 | 82.3 | 59.3 | 56.0 | 84.2 |
| Variable | Coefficient | Std. Error | p Value | Odds Ratio (OR) | 95% CI | |
|---|---|---|---|---|---|---|
| Upper | Lower | |||||
| Tumor length | 0.03 | 0.02 | 0.23 | 1.03 | 0.98 | 1.08 |
| Tumor differentiation grade—poorly differentiated | −2.67 | 1.23 | 0.10 | 0.07 | 0.05 | 1.30 |
| MRF status—positive | −1.38 | 0.84 | 0.30 | 0.25 | 0.06 | 0.77 |
| Constant | 0.906 | 2.14 | 0.67 | 2.47 | ||
| Variable | Coefficient | Std. Error | p Value | Odds Ratio (OR) | 95% CI | |
|---|---|---|---|---|---|---|
| Upper | Lower | |||||
| Tumor length | 0.008 | 0.06 | 0.889 | 1.0008 | 0.90 | 1.13 |
| Tumor differentiation grade—poorly differentiated | −4.561 | 3.30 | 0.167 | 0.10 | 0.00 | 7.92 |
| MRF status—positive | −0.904 | 1.52 | 0.551 | 0.40 | 0.02 | 7.92 |
| Rad-Score | 1.876 | 0.64 | 0.003 * | 6.52 | 1.87 | 22.72 |
| Constant | 4.11 | 5.14 | 0.42 | 61.17 | ||
| MRI Parameter | TSE T2-Weighted Image | DWI | ||
|---|---|---|---|---|
| Sagittal | HR Coronal Oblique | HR Axial Oblique | ||
| TR (ms) | 3500 | 3500 | 4000 | 5800 |
| TE (ms) | 91 | 91 | 80 | 96 |
| Slice no | 28 | 25 | 25 | 30 |
| Bandwidth (Hz/pixel) | 391 | 391 | 391 | 1132 |
| FOV (mm) | 220 | 220 | 200 | 250 |
| Slice thickness (mm) | 3 | 4 | 3 | 4 |
| Matrix | 256 × 256 | 256 × 256 | 256 × 256 | 136 × 160 |
| Acquisition time (min) | 4 | 5.5 | 6 | 4.5 |
© 2020 by the authors. Licensee MDPI, Basel, Switzerland. This article is an open access article distributed under the terms and conditions of the Creative Commons Attribution (CC BY) license (http://creativecommons.org/licenses/by/4.0/).
Share and Cite
Petresc, B.; Lebovici, A.; Caraiani, C.; Feier, D.S.; Graur, F.; Buruian, M.M. Pre-Treatment T2-WI Based Radiomics Features for Prediction of Locally Advanced Rectal Cancer Non-Response to Neoadjuvant Chemoradiotherapy: A Preliminary Study. Cancers 2020, 12, 1894. https://doi.org/10.3390/cancers12071894
Petresc B, Lebovici A, Caraiani C, Feier DS, Graur F, Buruian MM. Pre-Treatment T2-WI Based Radiomics Features for Prediction of Locally Advanced Rectal Cancer Non-Response to Neoadjuvant Chemoradiotherapy: A Preliminary Study. Cancers. 2020; 12(7):1894. https://doi.org/10.3390/cancers12071894
Chicago/Turabian StylePetresc, Bianca, Andrei Lebovici, Cosmin Caraiani, Diana Sorina Feier, Florin Graur, and Mircea Marian Buruian. 2020. "Pre-Treatment T2-WI Based Radiomics Features for Prediction of Locally Advanced Rectal Cancer Non-Response to Neoadjuvant Chemoradiotherapy: A Preliminary Study" Cancers 12, no. 7: 1894. https://doi.org/10.3390/cancers12071894
APA StylePetresc, B., Lebovici, A., Caraiani, C., Feier, D. S., Graur, F., & Buruian, M. M. (2020). Pre-Treatment T2-WI Based Radiomics Features for Prediction of Locally Advanced Rectal Cancer Non-Response to Neoadjuvant Chemoradiotherapy: A Preliminary Study. Cancers, 12(7), 1894. https://doi.org/10.3390/cancers12071894