Identification of GSN and LAMC2 as Key Prognostic Genes of Bladder Cancer by Integrated Bioinformatics Analysis

 , , ,
, , , 
Abstract
1. Introduction
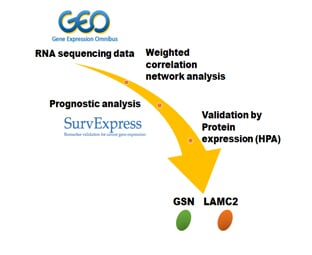
2. Results
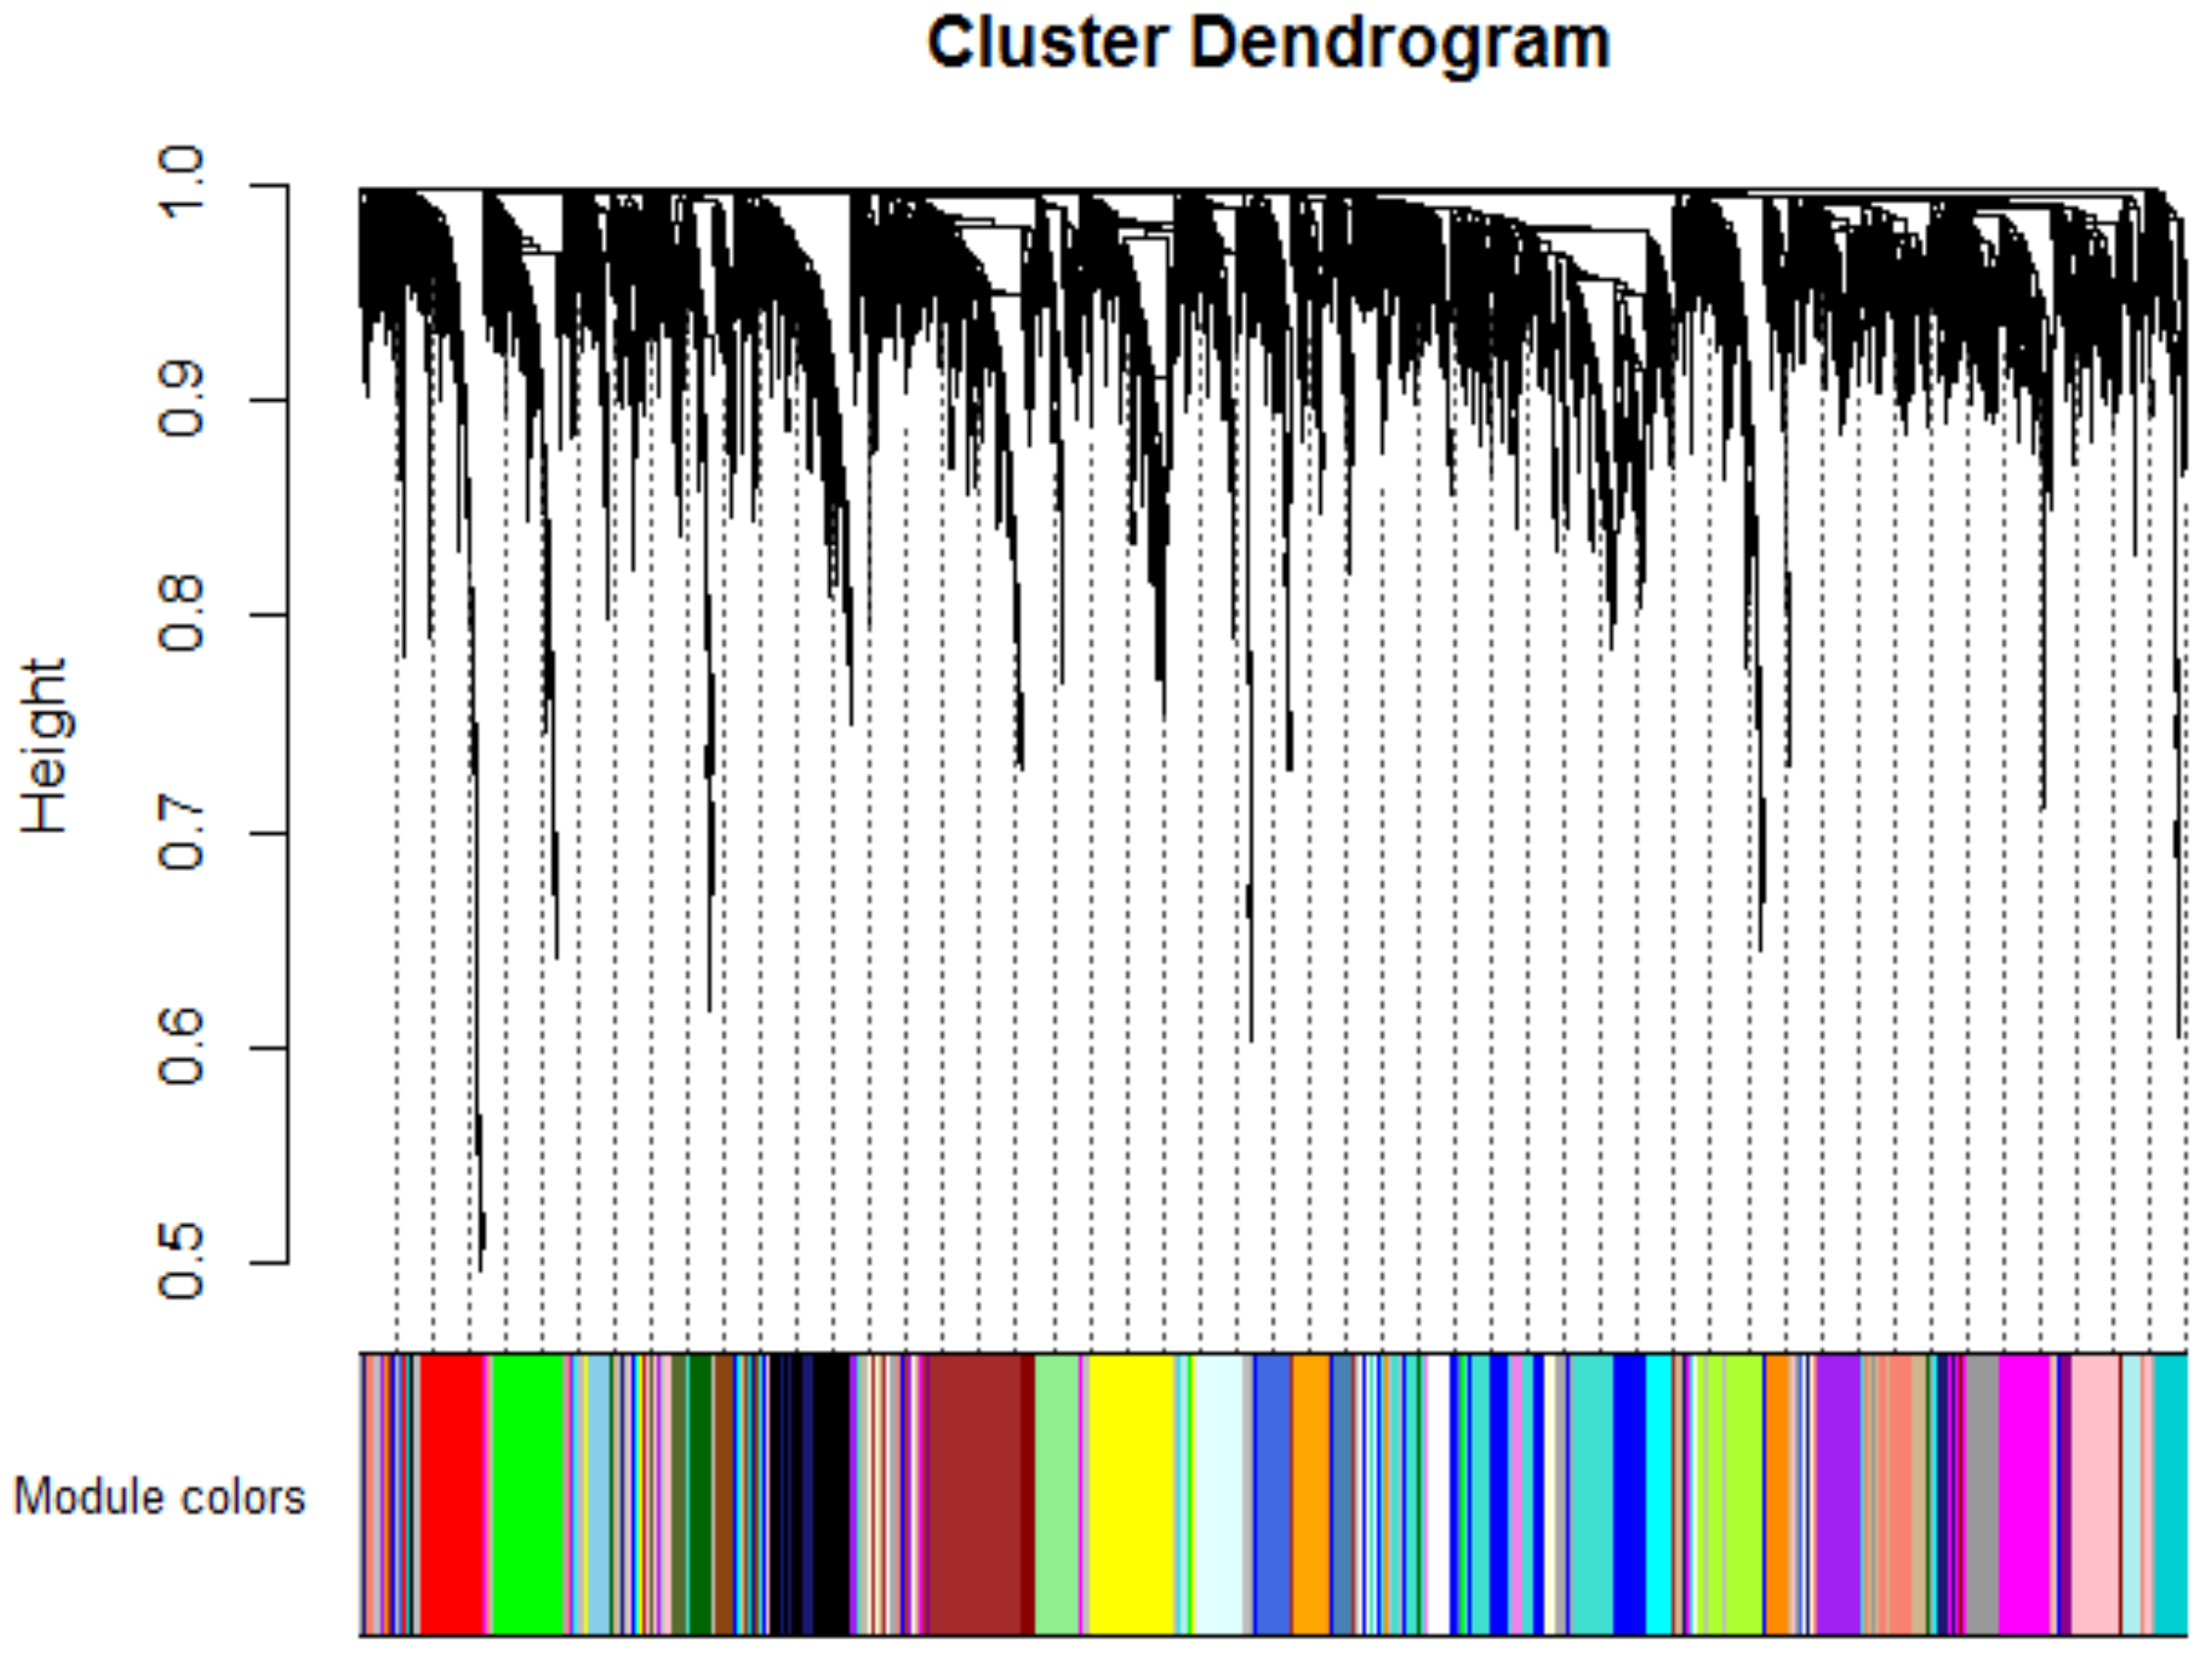
2.1. Weighted Co-Expression Network Construction and Key Modules Identification
2.2. Functional and Pathway Enrichment Analysis
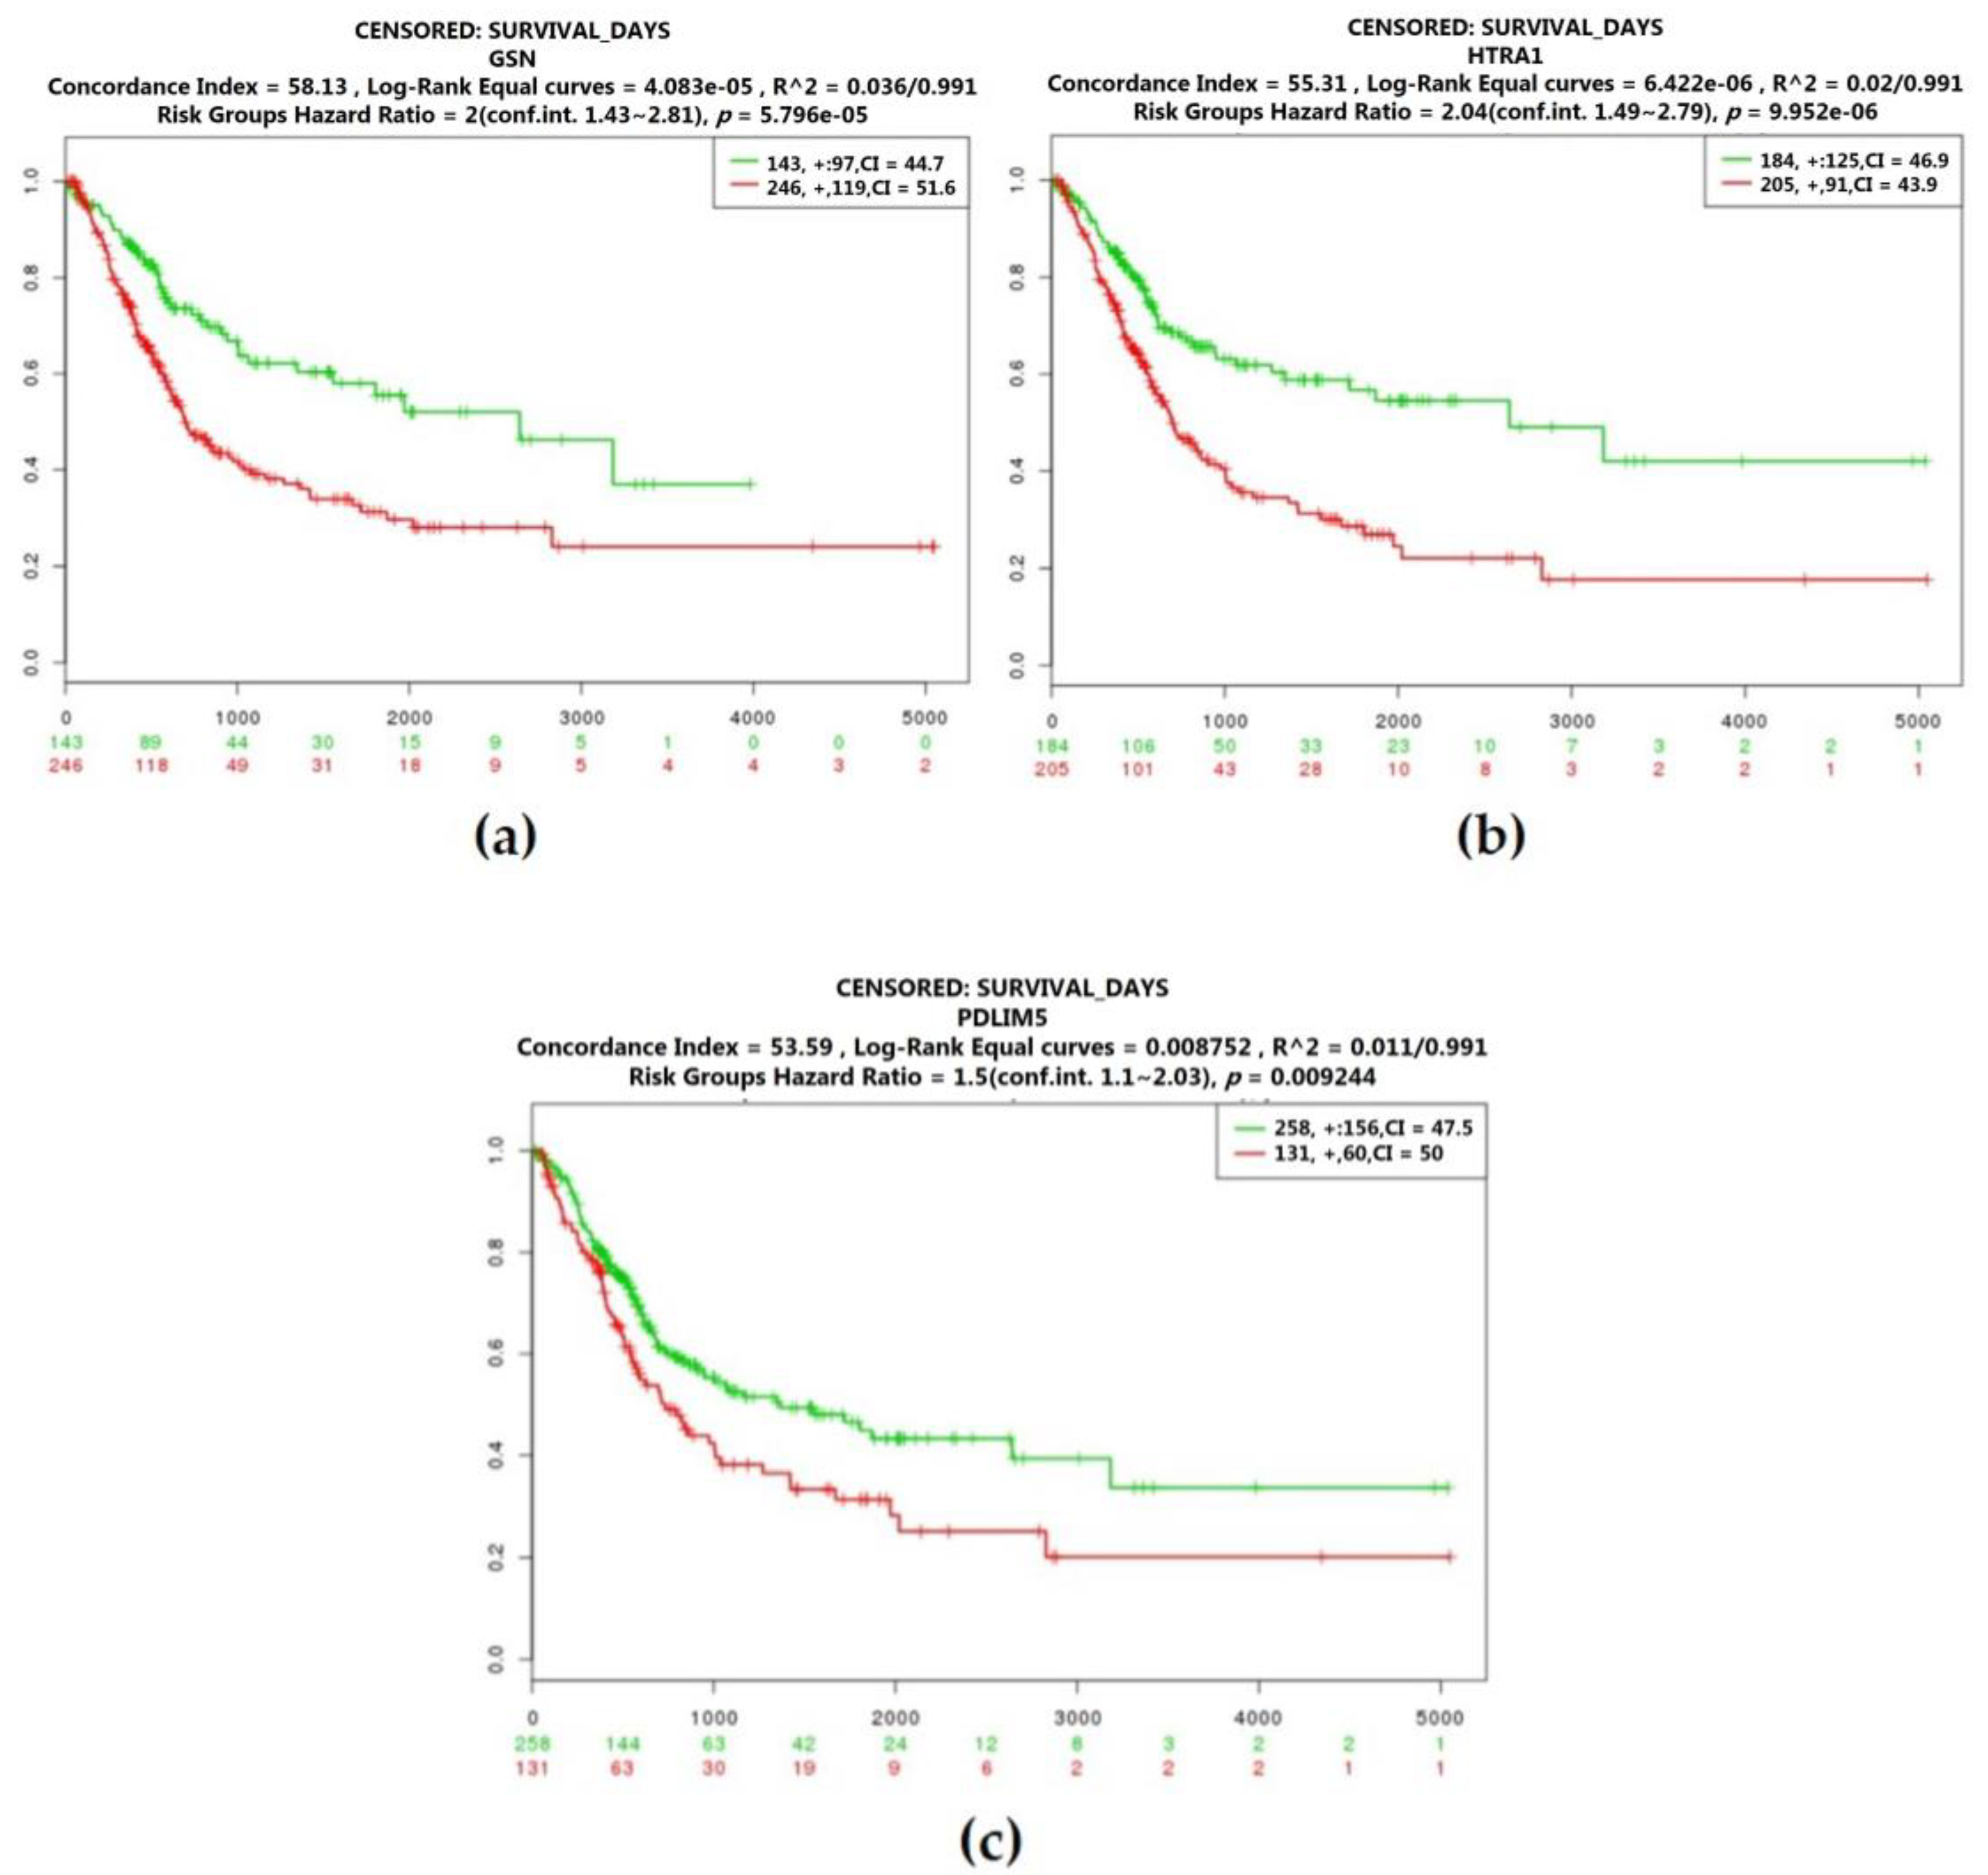
2.3. Real Hub Genes Identification and Validation
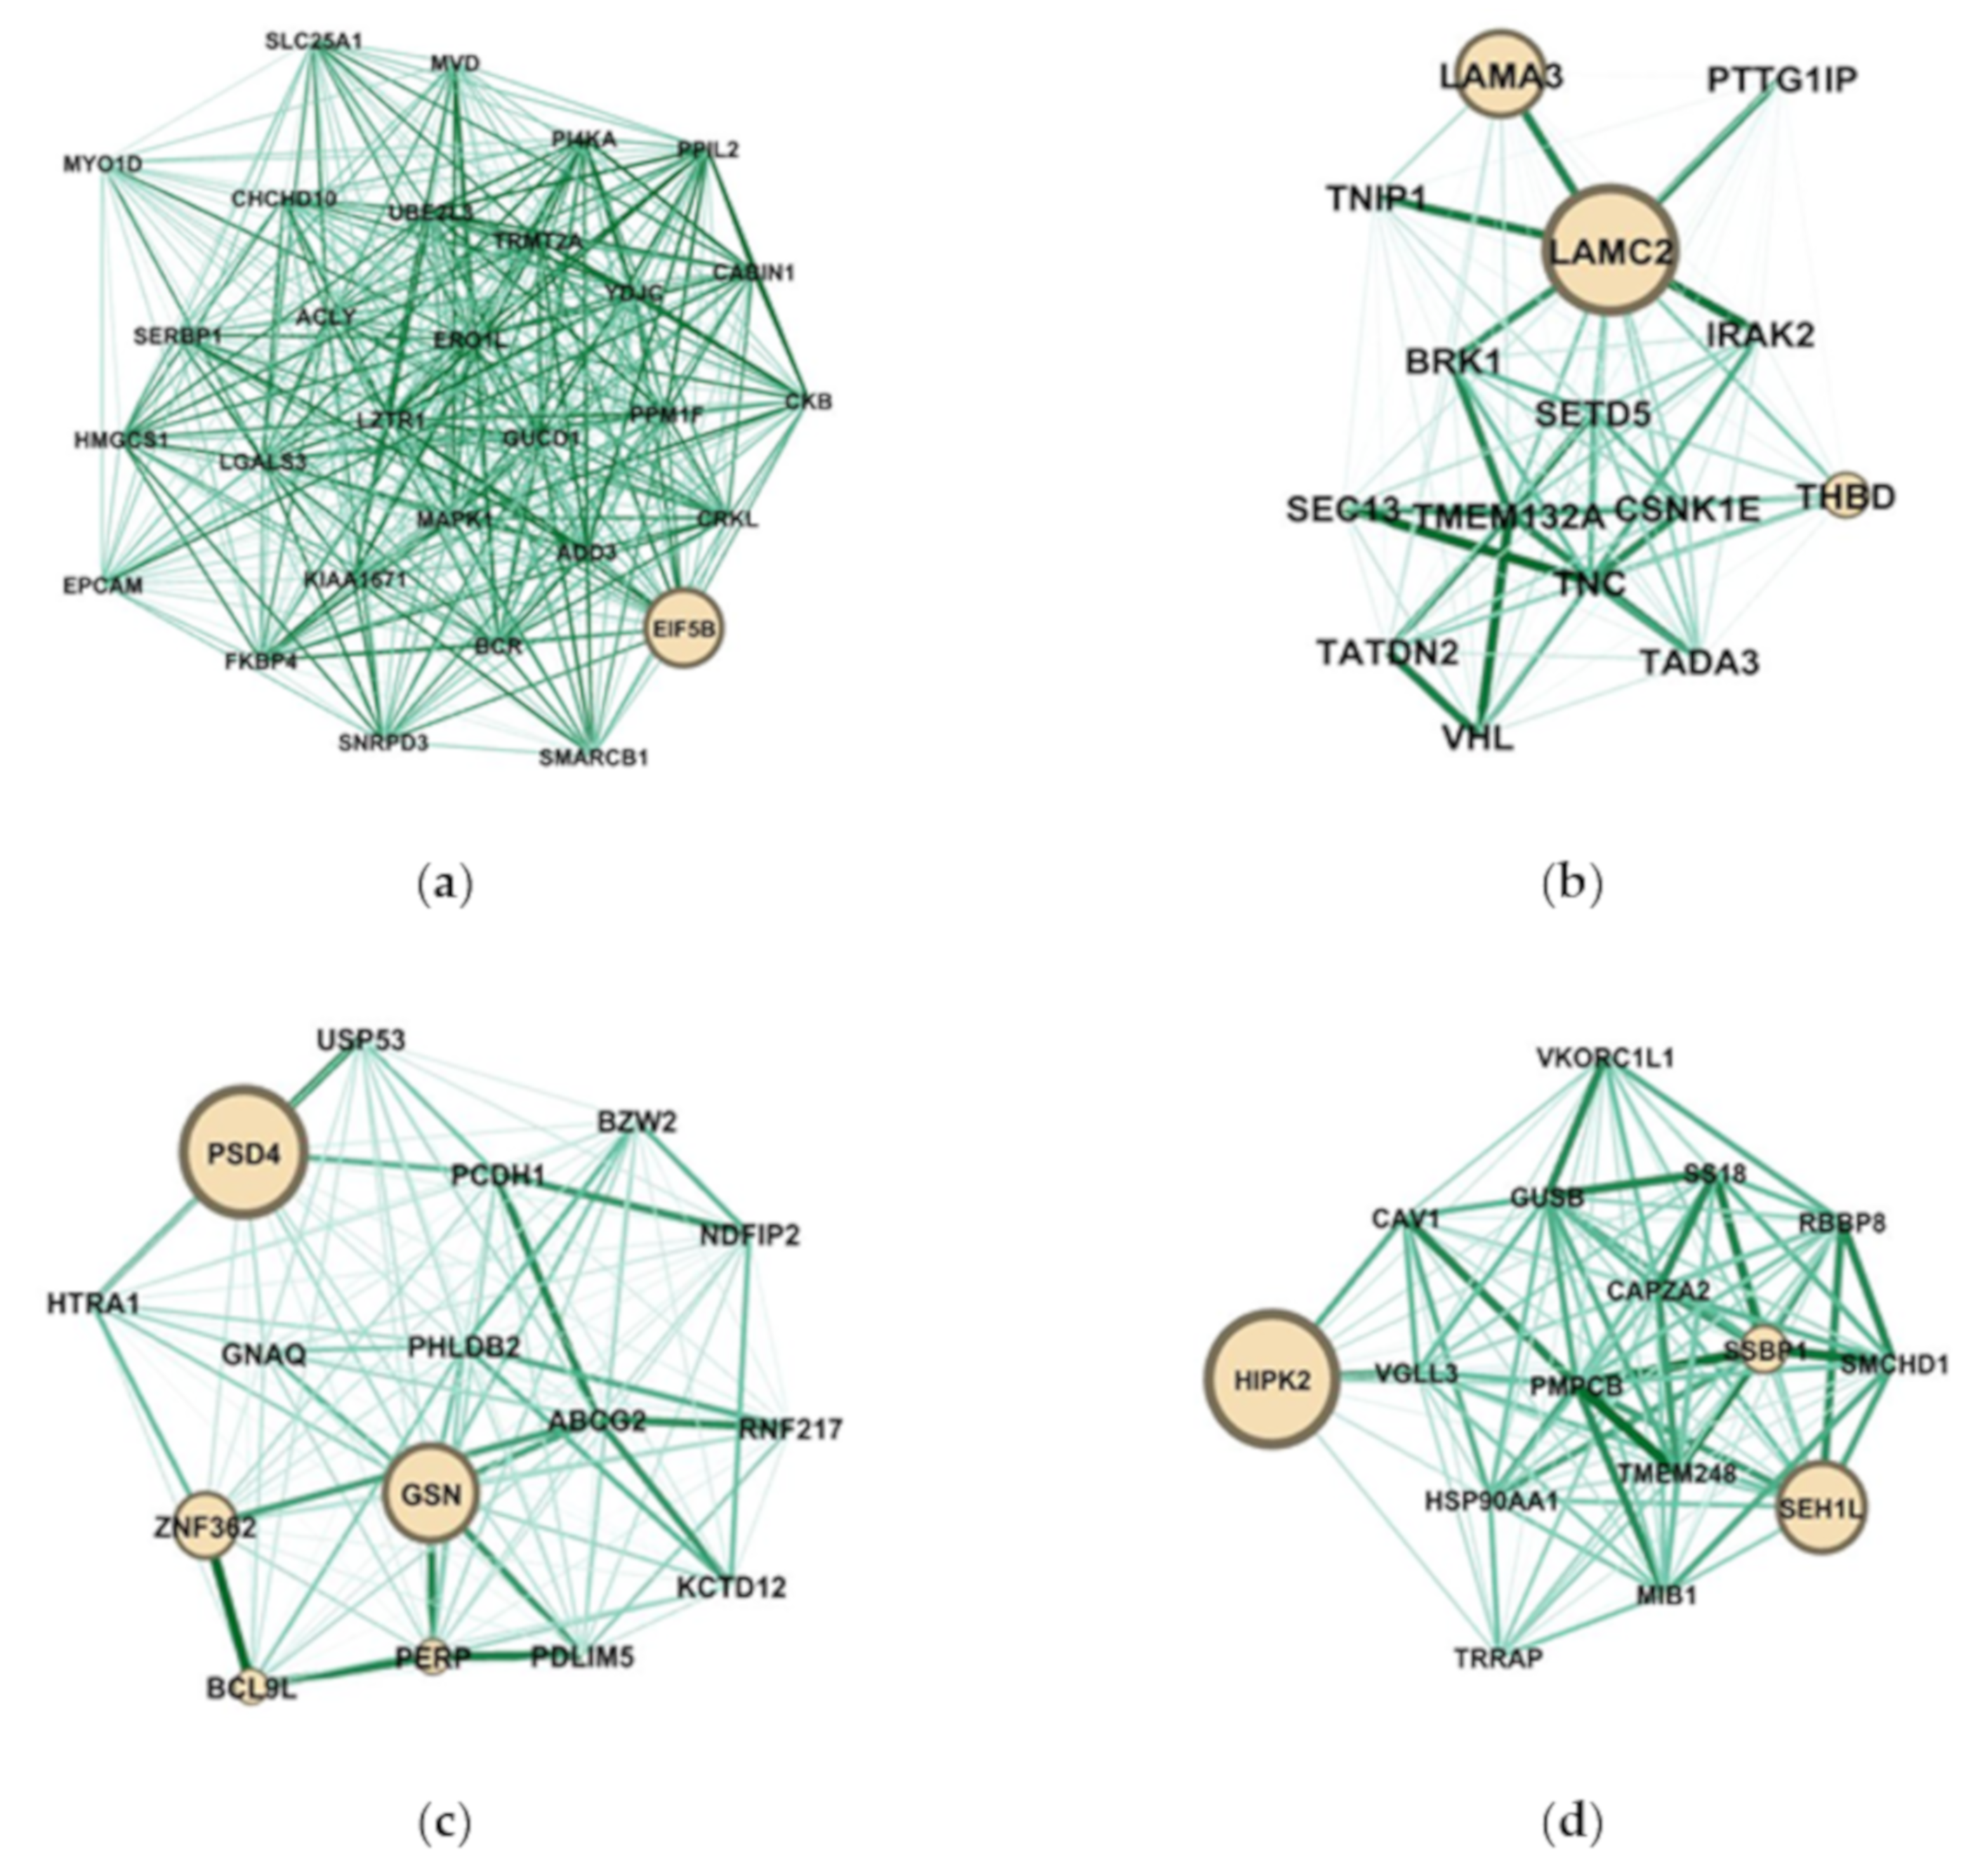
2.4. Identification of Candidate Genes with High Weighted Degree Score
2.5. The Protein Expression of Hub Genes
3. Discussion
4. Materials and Methods
4.1. Dataset Collection
4.2. Weighted Gene Co-Expression Network Construction
4.3. Finding of Clinical Significant Modules
4.4. Candidate Hub Genes Identification
4.5. Functional and Pathway Enrichment Analysis
4.6. Network Analysis and Visualization
4.7. The Relationship of Hub Genes and Prognosis
4.8. The Protein Expressions of Prognostic Hub Genes
5. Conclusions
Supplementary Materials
Author Contributions
Funding
Conflicts of Interest
References
- Ferlay, J.; Soerjomataram, I.; Dikshit, R.; Eser, S.; Mathers, C.; Rebelo, M.; Parkin, D.M.; Forman, D.; Bray, F. Cancer incidence and mortality worldwide: Sources, methods and major patterns in GLOBOCAN 2012. Int. J. Cancer 2015, 136, E359–E386. [Google Scholar] [CrossRef] [PubMed]
- Sanli, O.; Dobruch, J.; Knowles, M.A.; Burger, M.; Alemozaffar, M.; Nielsen, M.E.; Lotan, Y. Bladder cancer. Nat. Rev. Dis. Primers 2017, 3, 1–19. [Google Scholar] [CrossRef] [PubMed]
- Chang, S.S.; Bochner, B.H.; Chou, R.; Dreicer, R.; Kamat, A.M.; Lerner, S.P.; Lotan, Y.; Meeks, J.J.; Michalski, J.M.; Morgan, T.M.; et al. Treatment of Non-Metastatic Muscle-Invasive Bladder Cancer: AUA/ASCO/ASTRO/SUO Guideline. J. Urol. 2017, 198, 552–559. [Google Scholar] [CrossRef]
- Milowsky, M.I.; Rumble, R.B.; Booth, C.M.; Gilligan, T.; Eapen, L.J.; Hauke, R.J.; Boumansour, P.; Lee, C.T. Guideline on Muscle-Invasive and Metastatic Bladder Cancer (European Association of Urology Guideline): American Society of Clinical Oncology Clinical Practice Guideline Endorsement. J. Clin. Oncol. 2016, 34, 1945–1952. [Google Scholar] [CrossRef] [PubMed]
- Bellmunt, J.; Orsola, A.; Leow, J.J.; Wiegel, T.; De Santis, M.; Horwich, A.; Group, E.G.W. Bladder cancer: ESMO Practice Guidelines for diagnosis, treatment and follow-up. Ann. Oncol. 2014, 25, iii40–iii48. [Google Scholar] [CrossRef] [PubMed]
- Tan, W.S.; Tan, W.P.; Tan, M.Y.; Khetrapal, P.; Dong, L.; deWinter, P.; Feber, A.; Kelly, J.D. Novel urinary biomarkers for the detection of bladder cancer: A systematic review. Cancer Treat. Rev. 2018, 69, 39–52. [Google Scholar] [CrossRef]
- Montazeri, K.; Bellmunt, J. Erdafitinib for the treatment of metastatic bladder cancer. Expert Rev. Clin. Pharmacol. 2020, 13, 1–6. [Google Scholar] [CrossRef]
- Sotiriou, C.; Wirapati, P.; Loi, S.; Harris, A.; Fox, S.; Smeds, J.; Nordgren, H.; Farmer, P.; Praz, V.; Haibe-Kains, B.; et al. Gene expression profiling in breast cancer: Understanding the molecular basis of histologic grade to improve prognosis. J. Natl. Cancer Inst. 2006, 98, 262–272. [Google Scholar] [CrossRef]
- Bullinger, L.; Dohner, K.; Bair, E.; Frohling, S.; Schlenk, R.F.; Tibshirani, R.; Dohner, H.; Pollack, J.R. Use of gene-expression profiling to identify prognostic subclasses in adult acute myeloid leukemia. N. Engl. J. Med. 2004, 350, 1605–1616. [Google Scholar] [CrossRef]
- Spentzos, D.; Levine, D.A.; Ramoni, M.F.; Joseph, M.; Gu, X.; Boyd, J.; Libermann, T.A.; Cannistra, S.A. Gene expression signature with independent prognostic significance in epithelial ovarian cancer. J. Clin. Oncol. 2004, 22, 4700–4710. [Google Scholar] [CrossRef]
- Zhao, H.; Ljungberg, B.; Grankvist, K.; Rasmuson, T.; Tibshirani, R.; Brooks, J.D. Gene expression profiling predicts survival in conventional renal cell carcinoma. PLoS Med. 2006, 3, e13. [Google Scholar] [CrossRef] [PubMed]
- Adler, A.S.; Chang, H.Y. From description to causality: Mechanisms of gene expression signatures in cancer. Cell Cycle 2006, 5, 1148–1151. [Google Scholar] [CrossRef]
- Zhao, W.; Langfelder, P.; Fuller, T.; Dong, J.; Li, A.; Hovarth, S. Weighted gene coexpression network analysis: State of the art. J. Biopharm. Stat. 2010, 20, 281–300. [Google Scholar] [CrossRef] [PubMed]
- Stratton, M.R.; Campbell, P.J.; Futreal, P.A. The cancer genome. Nature 2009, 458, 719–724. [Google Scholar] [CrossRef] [PubMed]
- Langfelder, P.; Horvath, S. WGCNA: An R package for weighted correlation network analysis. BMC Bioinform. 2008, 9, 559. [Google Scholar] [CrossRef]
- Horvath, S.; Zhang, B.; Carlson, M.; Lu, K.V.; Zhu, S.; Felciano, R.M.; Laurance, M.F.; Zhao, W.; Qi, S.; Chen, Z.; et al. Analysis of oncogenic signaling networks in glioblastoma identifies ASPM as a molecular target. Proc. Natl Acad Sci USA 2006, 103, 17402–17407. [Google Scholar] [CrossRef]
- Chang, X.; Shi, L.; Gao, F.; Russin, J.; Zeng, L.; He, S.; Chen, T.C.; Giannotta, S.L.; Weisenberger, D.J.; Zada, G.; et al. Genomic and transcriptome analysis revealing an oncogenic functional module in meningiomas. Neurosurg. Focus 2013, 35, E3. [Google Scholar] [CrossRef]
- Yang, L.; Li, Y.; Wei, Z.; Chang, X. Coexpression network analysis identifies transcriptional modules associated with genomic alterations in neuroblastoma. Biochim. Biophys. Acta Mol. Basis Dis. 2018, 1864, 2341–2348. [Google Scholar] [CrossRef]
- Yang, Y.; Han, L.; Yuan, Y.; Li, J.; Hei, N.; Liang, H. Gene co-expression network analysis reveals common system-level properties of prognostic genes across cancer types. Nat. Commun. 2014, 5, 3231. [Google Scholar] [CrossRef]
- Robertson, A.G.; Kim, J.; Al-Ahmadie, H.; Bellmunt, J.; Guo, G.; Cherniack, A.D.; Hinoue, T.; Laird, P.W.; Hoadley, K.A.; Akbani, R.; et al. Comprehensive Molecular Characterization of Muscle-Invasive Bladder Cancer. Cell 2017, 171, 540–556e525. [Google Scholar] [CrossRef]
- Cheng, C.; Geng, F.; Cheng, X.; Guo, D. Lipid metabolism reprogramming and its potential targets in cancer. Cancer Commun. (Lond.) 2018, 38, 27. [Google Scholar] [CrossRef] [PubMed]
- Boroughs, L.K.; DeBerardinis, R.J. Metabolic pathways promoting cancer cell survival and growth. Nat. Cell Biol. 2015, 17, 351–359. [Google Scholar] [CrossRef] [PubMed]
- Schug, Z.T.; Vande Voorde, J.; Gottlieb, E. The metabolic fate of acetate in cancer. Nat. Rev. Cancer 2016, 16, 708–717. [Google Scholar] [CrossRef] [PubMed]
- Nirschl, C.J.; Drake, C.G. Molecular pathways: Coexpression of immune checkpoint molecules: Signaling pathways and implications for cancer immunotherapy. Clin. Cancer Res. 2013, 19, 4917–4924. [Google Scholar] [CrossRef] [PubMed]
- Teicher, B.A.; Fricker, S.P. CXCL12 (SDF-1)/CXCR4 Pathway in Cancer. Clin. Cancer Res. 2010, 16, 2927–2931. [Google Scholar] [CrossRef] [PubMed]
- Desgrosellier, J.S.; Cheresh, D.A. Integrins in cancer: Biological implications and therapeutic opportunities. Nat. Rev. Cancer 2010, 10, 9–22. [Google Scholar] [CrossRef]
- Dominguez-Brauer, C.; Thu, K.L.; Mason, J.M.; Blaser, H.; Bray, M.R.; Mak, T.W. Targeting Mitosis in Cancer: Emerging Strategies. Mol. Cell 2015, 60, 524–536. [Google Scholar] [CrossRef]
- Witsch, E.; Sela, M.; Yarden, Y. Roles for growth factors in cancer progression. Physiology (Bethesda) 2010, 25, 85–101. [Google Scholar] [CrossRef]
- Johnstone, R.W.; Frew, A.J.; Smyth, M.J. The TRAIL apoptotic pathway in cancer onset, progression and therapy. Nat. Rev. Cancer 2008, 8, 782–798. [Google Scholar] [CrossRef]
- Weber, A.M.; Ryan, A.J. ATM and ATR as therapeutic targets in cancer. Pharmacol. Ther. 2015, 149, 124–138. [Google Scholar] [CrossRef]
- Ying, L.; Hofseth, L.J. An emerging role for endothelial nitric oxide synthase in chronic inflammation and cancer. Cancer Res. 2007, 67, 1407–1410. [Google Scholar] [CrossRef]
- Lee, S.; Truesdell, S.S.; Bukhari, S.I.; Lee, J.H.; LeTonqueze, O.; Vasudevan, S. Upregulation of eIF5B controls cell-cycle arrest and specific developmental stages. Proc. Natl. Acad. Sci. USA 2014, 111, E4315–E4322. [Google Scholar] [CrossRef] [PubMed]
- Smith, S.C.; Nicholson, B.; Nitz, M.; Frierson, H.F., Jr.; Smolkin, M.; Hampton, G.; El-Rifai, W.; Theodorescu, D. Profiling bladder cancer organ site-specific metastasis identifies LAMC2 as a novel biomarker of hematogenous dissemination. Am. J. Pathol. 2009, 174, 371–379. [Google Scholar] [CrossRef]
- Kandimalla, R.; van Tilborg, A.A.; Zwarthoff, E.C. DNA methylation-based biomarkers in bladder cancer. Nat. Rev. Urol. 2013, 10, 327–335. [Google Scholar] [CrossRef] [PubMed]
- Sathyanarayana, U.G.; Maruyama, R.; Padar, A.; Suzuki, M.; Bondaruk, J.; Sagalowsky, A.; Minna, J.D.; Frenkel, E.P.; Grossman, H.B.; Czerniak, B.; et al. Molecular detection of noninvasive and invasive bladder tumor tissues and exfoliated cells by aberrant promoter methylation of laminin-5 encoding genes. Cancer Res. 2004, 64, 1425–1430. [Google Scholar] [CrossRef] [PubMed]
- Yuan, X.; Yu, L.; Li, J.; Xie, G.; Rong, T.; Zhang, L.; Chen, J.; Meng, Q.; Irving, A.T.; Wang, D.; et al. ATF3 suppresses metastasis of bladder cancer by regulating gelsolin-mediated remodeling of the actin cytoskeleton. Cancer Res. 2013, 73, 3625–3637. [Google Scholar] [CrossRef]
- Milanini, J.; Fayad, R.; Partisani, M.; Lecine, P.; Borg, J.-P.; Franco, M.; Luton, F.J.J.C.S. EFA6 proteins regulate lumen formation through α-actinin 1. J. Cell Sci 2018, 131, jcs209361. [Google Scholar] [CrossRef]
- Zangari, J.; Partisani, M.; Bertucci, F.; Milanini, J.; Bidaut, G.; Berruyer-Pouyet, C.; Finetti, P.; Long, E.; Brau, F.; Cabaud, O.; et al. EFA6B antagonizes breast cancer. Cancer Res. 2014, 74, 5493–5506. [Google Scholar] [CrossRef]
- Loftus, S.K.; Baxter, L.L.; Cronin, J.C.; Fufa, T.D.; Program, N.C.S.; Pavan, W.J.; Barnabas, B.B.; Bouffard, G.G.; Brooks, S.Y.; Coleman, H.J.P.C.; et al. Hypoxia-induced HIF 1α targets in melanocytes reveal a molecular profile associated with poor melanoma prognosis. Pigment. Cell Melanoma Res. 2017, 30, 339–352. [Google Scholar] [CrossRef]
- Bar-Peled, L.; Chantranupong, L.; Cherniack, A.D.; Chen, W.W.; Ottina, K.A.; Grabiner, B.C.; Spear, E.D.; Carter, S.L.; Meyerson, M.; Sabatini, D.M.J.S. A Tumor suppressor complex with GAP activity for the Rag GTPases that signal amino acid sufficiency to mTORC1. Science 2013, 340, 1100–1106. [Google Scholar] [CrossRef]
- Saidi, S.; Popov, Z.; Stavridis, S.; Panov, S. Alterations of microsatellite loci GSN and D18S51 in urinary bladder cancer. Hippokratia 2015, 19, 200–204. [Google Scholar] [PubMed]
- Kojima, T.; Kawai, K.; Miyazaki, J.; Nishiyama, H. Biomarkers for precision medicine in bladder cancer. Int. J. Clin. Oncol. 2017, 22, 207–213. [Google Scholar] [CrossRef] [PubMed]
- Miyamoto, D.T.; Mouw, K.W.; Feng, F.Y.; Shipley, W.U.; Efstathiou, J.A. Molecular biomarkers in bladder preservation therapy for muscle-invasive bladder cancer. Lancet Oncol. 2018, 19, e683–e695. [Google Scholar] [CrossRef]
- Granchi, C. ATP citrate lyase (ACLY) inhibitors: An anti-cancer strategy at the crossroads of glucose and lipid metabolism. Eur. J. Med. Chem. 2018, 157, 1276–1291. [Google Scholar] [CrossRef] [PubMed]
- Presler, M.; Wojtczyk-Miaskowska, A.; Schlichtholz, B.; Kaluzny, A.; Matuszewski, M.; Mika, A.; Sledzinski, T.; Swierczynski, J. Increased expression of the gene encoding stearoyl-CoA desaturase 1 in human bladder cancer. Mol. Cell Biochem. 2018, 447, 217–224. [Google Scholar] [CrossRef]
- Brunner, A.; Prelog, M.; Verdorfer, I.; Tzankov, A.; Mikuz, G.; Ensinger, C. EpCAM is predominantly expressed in high grade and advanced stage urothelial carcinoma of the bladder. J. Clin. Pathol. 2008, 61, 307–310. [Google Scholar] [CrossRef]
- Bryan, R.T.; Shimwell, N.J.; Wei, W.; Devall, A.J.; Pirrie, S.J.; James, N.D.; Zeegers, M.P.; Cheng, K.K.; Martin, A.; Ward, D.G. Urinary EpCAM in urothelial bladder cancer patients: Characterisation and evaluation of biomarker potential. Br. J. Cancer 2014, 110, 679–685. [Google Scholar] [CrossRef]
- Oka, C.; Tsujimoto, R.; Kajikawa, M.; Koshiba-Takeuchi, K.; Ina, J.; Yano, M.; Tsuchiya, A.; Ueta, Y.; Soma, A.; Kanda, H.; et al. HtrA1 serine protease inhibits signaling mediated by Tgfbeta family proteins. Development 2004, 131, 1041–1053. [Google Scholar] [CrossRef]
- Lorenzi, T.; Lorenzi, M.; Altobelli, E.; Marzioni, D.; Mensa, E.; Quaranta, A.; Paolinelli, F.; Morroni, M.; Mazzucchelli, R.; De Luca, A.; et al. HtrA1 in human urothelial bladder cancer: A secreted protein and a potential novel biomarker. Int J. Cancer 2013, 133, 2650–2661. [Google Scholar] [CrossRef]
- Lowy, C.M.; Oskarsson, T. Tenascin C in metastasis: A view from the invasive front. Cell Adhes. Migr. 2015, 9, 112–124. [Google Scholar] [CrossRef]
- Yoshida, T.; Akatsuka, T.; Imanaka-Yoshida, K. Tenascin-C and integrins in cancer. Cell Adhes. Migr. 2015, 9, 96–104. [Google Scholar] [CrossRef] [PubMed]
- Cunha, I.W.; Carvalho, K.C.; Martins, W.K.; Marques, S.M.; Muto, N.H.; Falzoni, R.; Rocha, R.M.; Aguiar, S.; Simoes, A.C.; Fahham, L.; et al. Identification of genes associated with local aggressiveness and metastatic behavior in soft tissue tumors. Transl. Oncol. 2010, 3, 23–32. [Google Scholar] [CrossRef] [PubMed]
- Read, M.L.; Seed, R.I.; Fong, J.C.; Modasia, B.; Ryan, G.A.; Watkins, R.J.; Gagliano, T.; Smith, V.E.; Stratford, A.L.; Kwan, P.K.; et al. The PTTG1-binding factor (PBF/PTTG1IP) regulates p53 activity in thyroid cells. Endocrinology 2014, 155, 1222–1234. [Google Scholar] [CrossRef] [PubMed]
- Repo, H.; Gurvits, N.; Loyttyniemi, E.; Nykanen, M.; Lintunen, M.; Karra, H.; Kurki, S.; Kuopio, T.; Talvinen, K.; Soderstrom, M.; et al. PTTG1-interacting protein (PTTG1IP/PBF) predicts breast cancer survival. BMC Cancer 2017, 17, 705. [Google Scholar] [CrossRef] [PubMed]
- Di, Y.; Chen, D.; Yu, W.; Yan, L. Bladder cancer stage-associated hub genes revealed by WGCNA co-expression network analysis. Hereditas 2019, 156, 7. [Google Scholar] [CrossRef] [PubMed]
- Chen, Z.; Liu, G.; Hossain, A.; Danilova, I.G.; Bolkov, M.A.; Liu, G.; Tuzankina, I.A.; Tan, W. A co-expression network for differentially expressed genes in bladder cancer and a risk score model for predicting survival. Hereditas 2019, 156, 24. [Google Scholar] [CrossRef]
- Yan, X.; Fu, X.; Guo, Z.X.; Liu, X.P.; Liu, T.Z.; Li, S. Construction and validation of an eight-gene signature with great prognostic value in bladder cancer. J. Cancer 2020, 11, 1768–1779. [Google Scholar] [CrossRef]
- Ding, Y.; Cao, Q.; Wang, C.; Duan, H.; Shen, H. LGALS4 as a Prognostic Factor in Urothelial Carcinoma of Bladder Affects Cell Functions. Technol. Cancer Res. Treat. 2019, 18, 1533033819876601. [Google Scholar] [CrossRef]
- Artimo, P.; Jonnalagedda, M.; Arnold, K.; Baratin, D.; Csardi, G.; de Castro, E.; Duvaud, S.; Flegel, V.; Fortier, A.; Gasteiger, E.; et al. ExPASy: SIB bioinformatics resource portal. Nucleic Acids Res. 2012, 40, W597–W603. [Google Scholar] [CrossRef]
- Langfelder, P.; Horvath, S. Fast R Functions for Robust Correlations and Hierarchical Clustering. J. Stat. Softw. 2012, 46, i11. [Google Scholar] [CrossRef]
- Zhang, B.; Horvath, S. A general framework for weighted gene co-expression network analysis. Stat. Appl. Genet. Mol. Biol. 2005, 4, 17. [Google Scholar] [CrossRef] [PubMed]
- Pathan, M.; Keerthikumar, S.; Ang, C.S.; Gangoda, L.; Quek, C.Y.; Williamson, N.A.; Mouradov, D.; Sieber, O.M.; Simpson, R.J.; Salim, A.; et al. FunRich: An open access standalone functional enrichment and interaction network analysis tool. Proteomics 2015, 15, 2597–2601. [Google Scholar] [CrossRef] [PubMed]
- Pathan, M.; Keerthikumar, S.; Chisanga, D.; Alessandro, R.; Ang, C.S.; Askenase, P.; Batagov, A.O.; Benito-Martin, A.; Camussi, G.; Clayton, A.; et al. A novel community driven software for functional enrichment analysis of extracellular vesicles data. J. Extracell Vesicles 2017, 6, 1321455. [Google Scholar] [CrossRef] [PubMed]
- Pedersen, T.L. Tidygraph: A Tidy API for Graph Manipulation. Available online: https://tidygraph.data-imaginist.com/ (accessed on 5 May 2019).
- Freeman, L.C. Centrality in social networks conceptual clarification. Soc. Netw. 1978, 1, 215–239. [Google Scholar] [CrossRef]
- Aguirre-Gamboa, R.; Gomez-Rueda, H.; Martinez-Ledesma, E.; Martinez-Torteya, A.; Chacolla-Huaringa, R.; Rodriguez-Barrientos, A.; Tamez-Pena, J.G.; Trevino, V. SurvExpress: An online biomarker validation tool and database for cancer gene expression data using survival analysis. PloS ONE 2013, 8, e74250. [Google Scholar] [CrossRef] [PubMed]
- Cerami, E.; Gao, J.; Dogrusoz, U.; Gross, B.E.; Sumer, S.O.; Aksoy, B.A.; Jacobsen, A.; Byrne, C.J.; Heuer, M.L.; Larsson, E.; et al. The cBio cancer genomics portal: An open platform for exploring multidimensional cancer genomics data. Cancer Discov. 2012, 2, 401–404. [Google Scholar] [CrossRef] [PubMed]
- Gao, J.; Aksoy, B.A.; Dogrusoz, U.; Dresdner, G.; Gross, B.; Sumer, S.O.; Sun, Y.; Jacobsen, A.; Sinha, R.; Larsson, E.; et al. Integrative analysis of complex cancer genomics and clinical profiles using the cBioPortal. Sci. Signal. 2013, 6, pl1. [Google Scholar] [CrossRef]
- Uhlen, M.; Zhang, C.; Lee, S.; Sjostedt, E.; Fagerberg, L.; Bidkhori, G.; Benfeitas, R.; Arif, M.; Liu, Z.; Edfors, F.; et al. A pathology atlas of the human cancer transcriptome. Science 2017, 357, eaan2507. [Google Scholar] [CrossRef]


© 2020 by the authors. Licensee MDPI, Basel, Switzerland. This article is an open access article distributed under the terms and conditions of the Creative Commons Attribution (CC BY) license (http://creativecommons.org/licenses/by/4.0/).
Share and Cite
Yang, J.-L.; Wang, C.C.N.; Cai, J.-H.; Chou, C.-Y.; Lin, Y.-C.; Hung, C.-C. Identification of GSN and LAMC2 as Key Prognostic Genes of Bladder Cancer by Integrated Bioinformatics Analysis. Cancers 2020, 12, 1809. https://doi.org/10.3390/cancers12071809
Yang J-L, Wang CCN, Cai J-H, Chou C-Y, Lin Y-C, Hung C-C. Identification of GSN and LAMC2 as Key Prognostic Genes of Bladder Cancer by Integrated Bioinformatics Analysis. Cancers. 2020; 12(7):1809. https://doi.org/10.3390/cancers12071809
Chicago/Turabian StyleYang, Jia-Lian, Charles C. N. Wang, Jia-Hua Cai, Che-Yi Chou, Yu-Chao Lin, and Chin-Chuan Hung. 2020. "Identification of GSN and LAMC2 as Key Prognostic Genes of Bladder Cancer by Integrated Bioinformatics Analysis" Cancers 12, no. 7: 1809. https://doi.org/10.3390/cancers12071809
APA StyleYang, J.-L., Wang, C. C. N., Cai, J.-H., Chou, C.-Y., Lin, Y.-C., & Hung, C.-C. (2020). Identification of GSN and LAMC2 as Key Prognostic Genes of Bladder Cancer by Integrated Bioinformatics Analysis. Cancers, 12(7), 1809. https://doi.org/10.3390/cancers12071809