Expression Patterns of Immune Genes Reveal Heterogeneous Subtypes of High-Risk Neuroblastoma

 ,
,  and
and 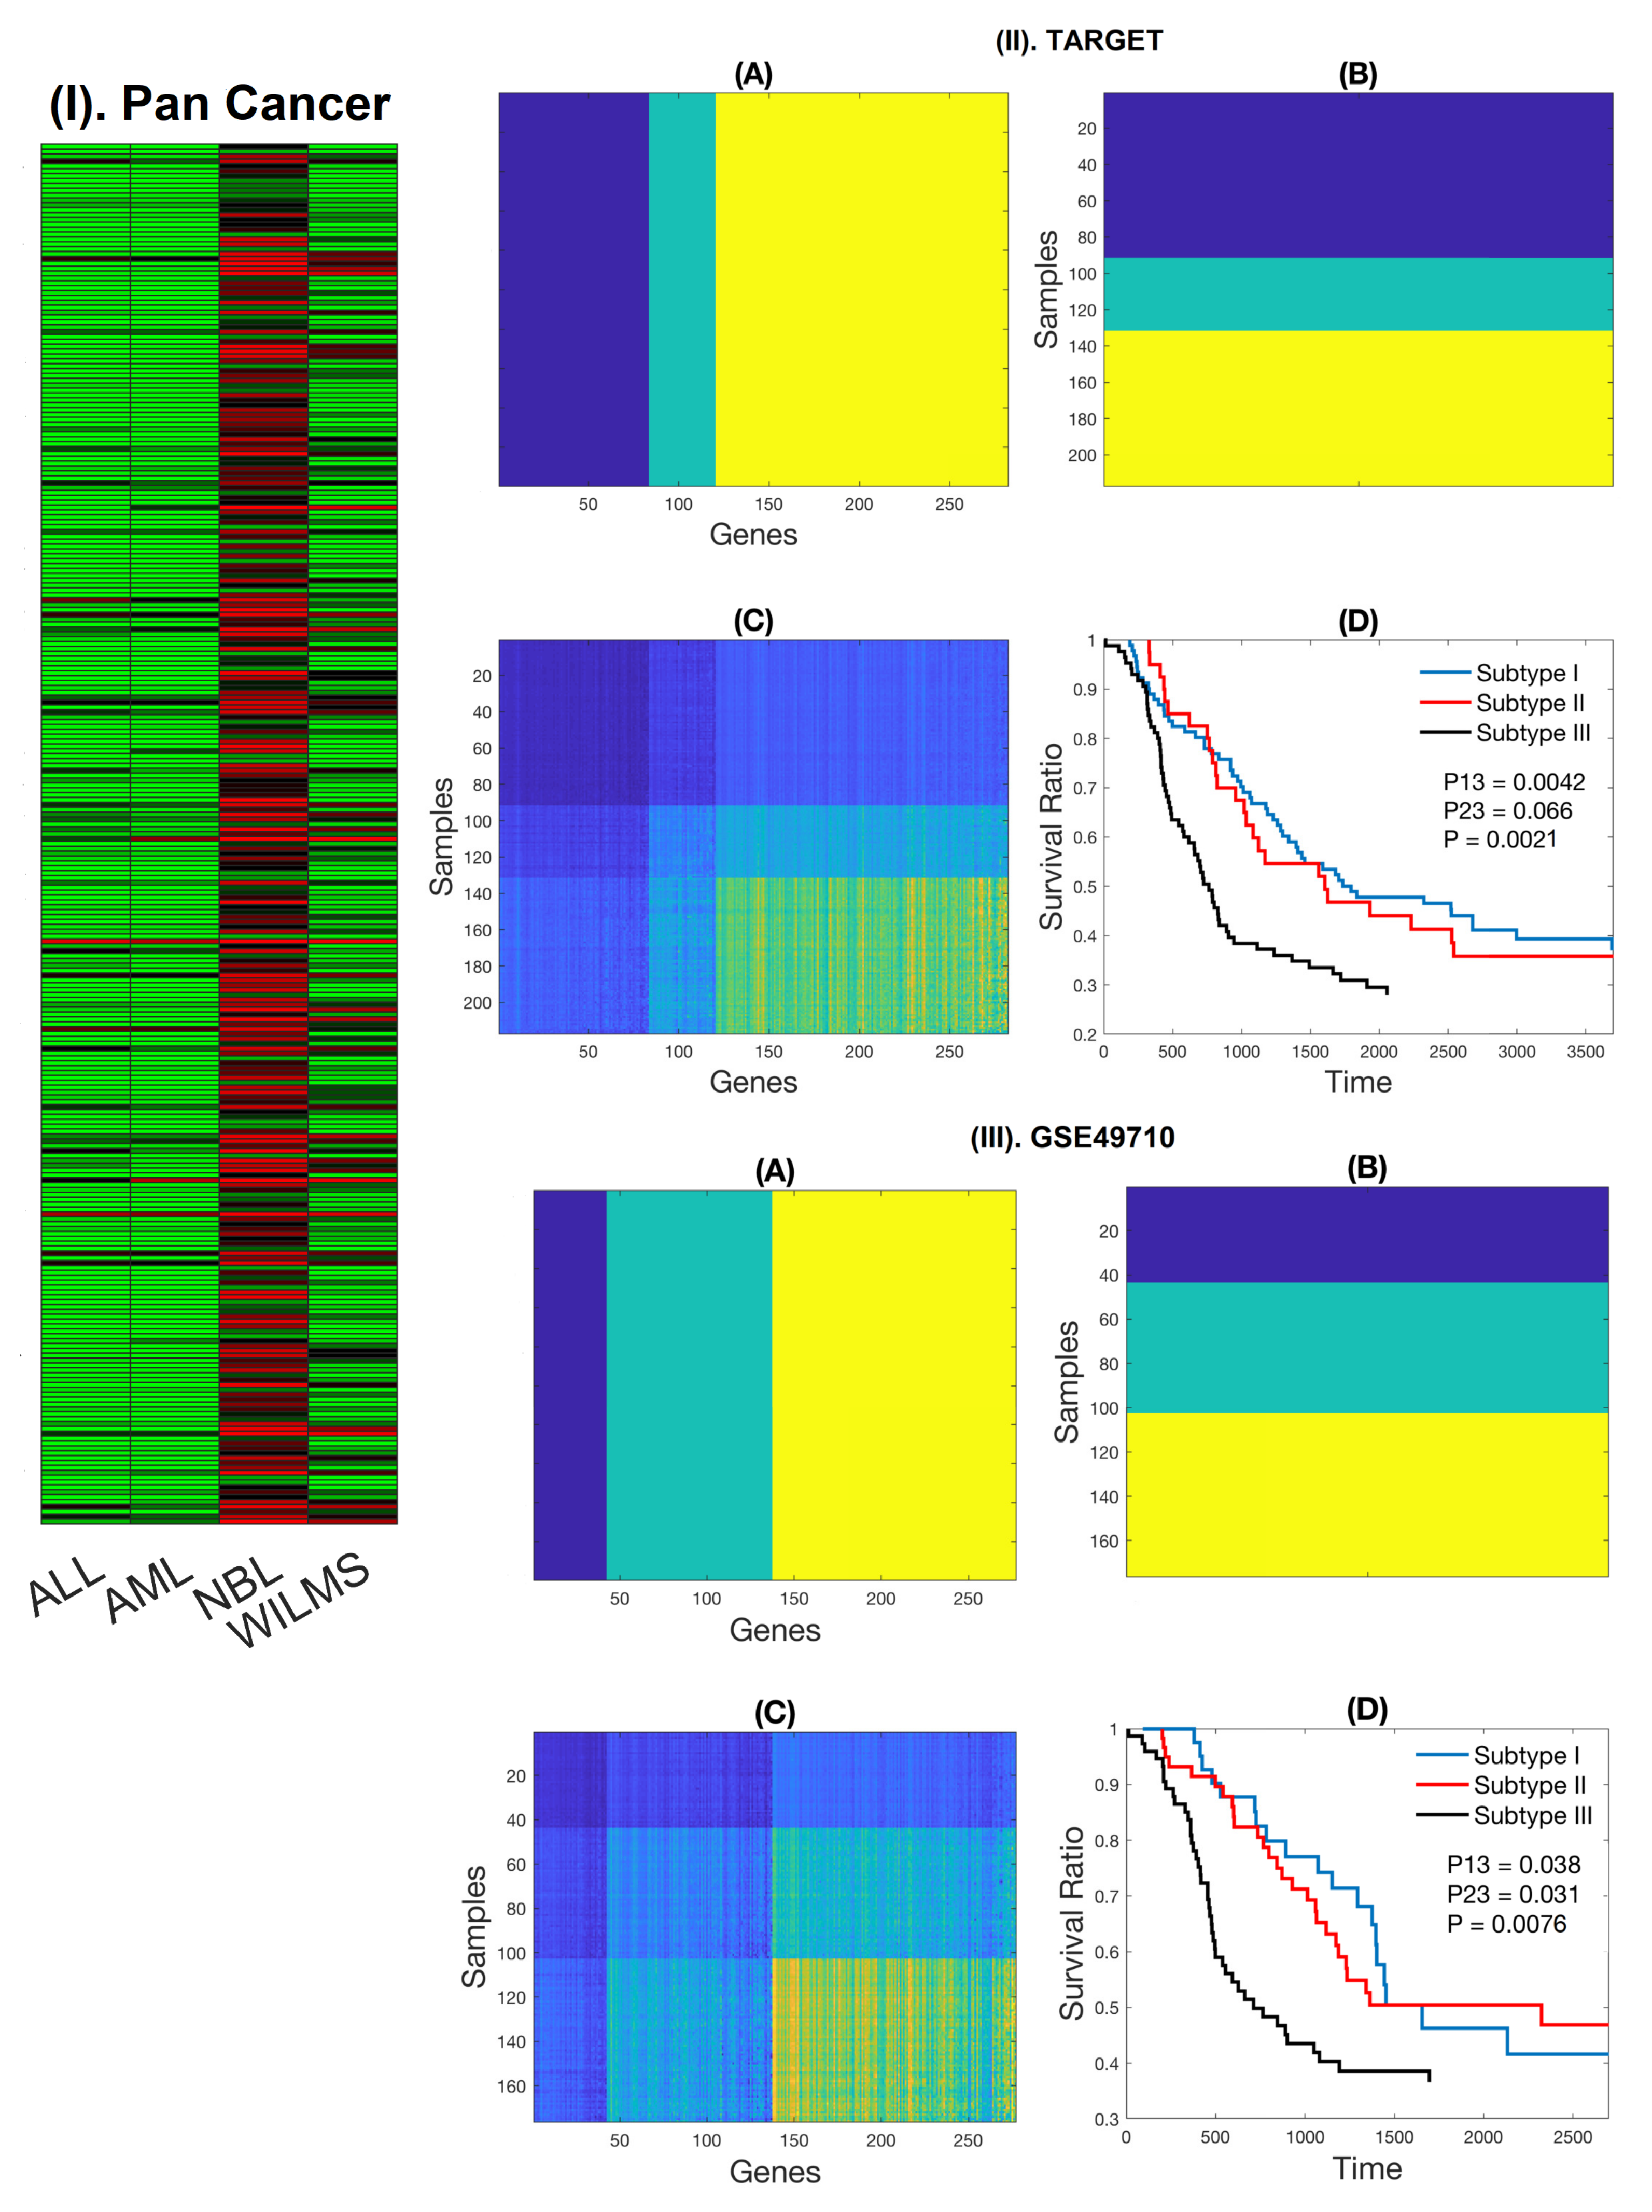
Abstract
1. Introduction
2. Results
2.1. Expression Patterns of NB-Specific Immune-Related Genes Stratify HR-NB Patients into Clinically Significant Subtypes
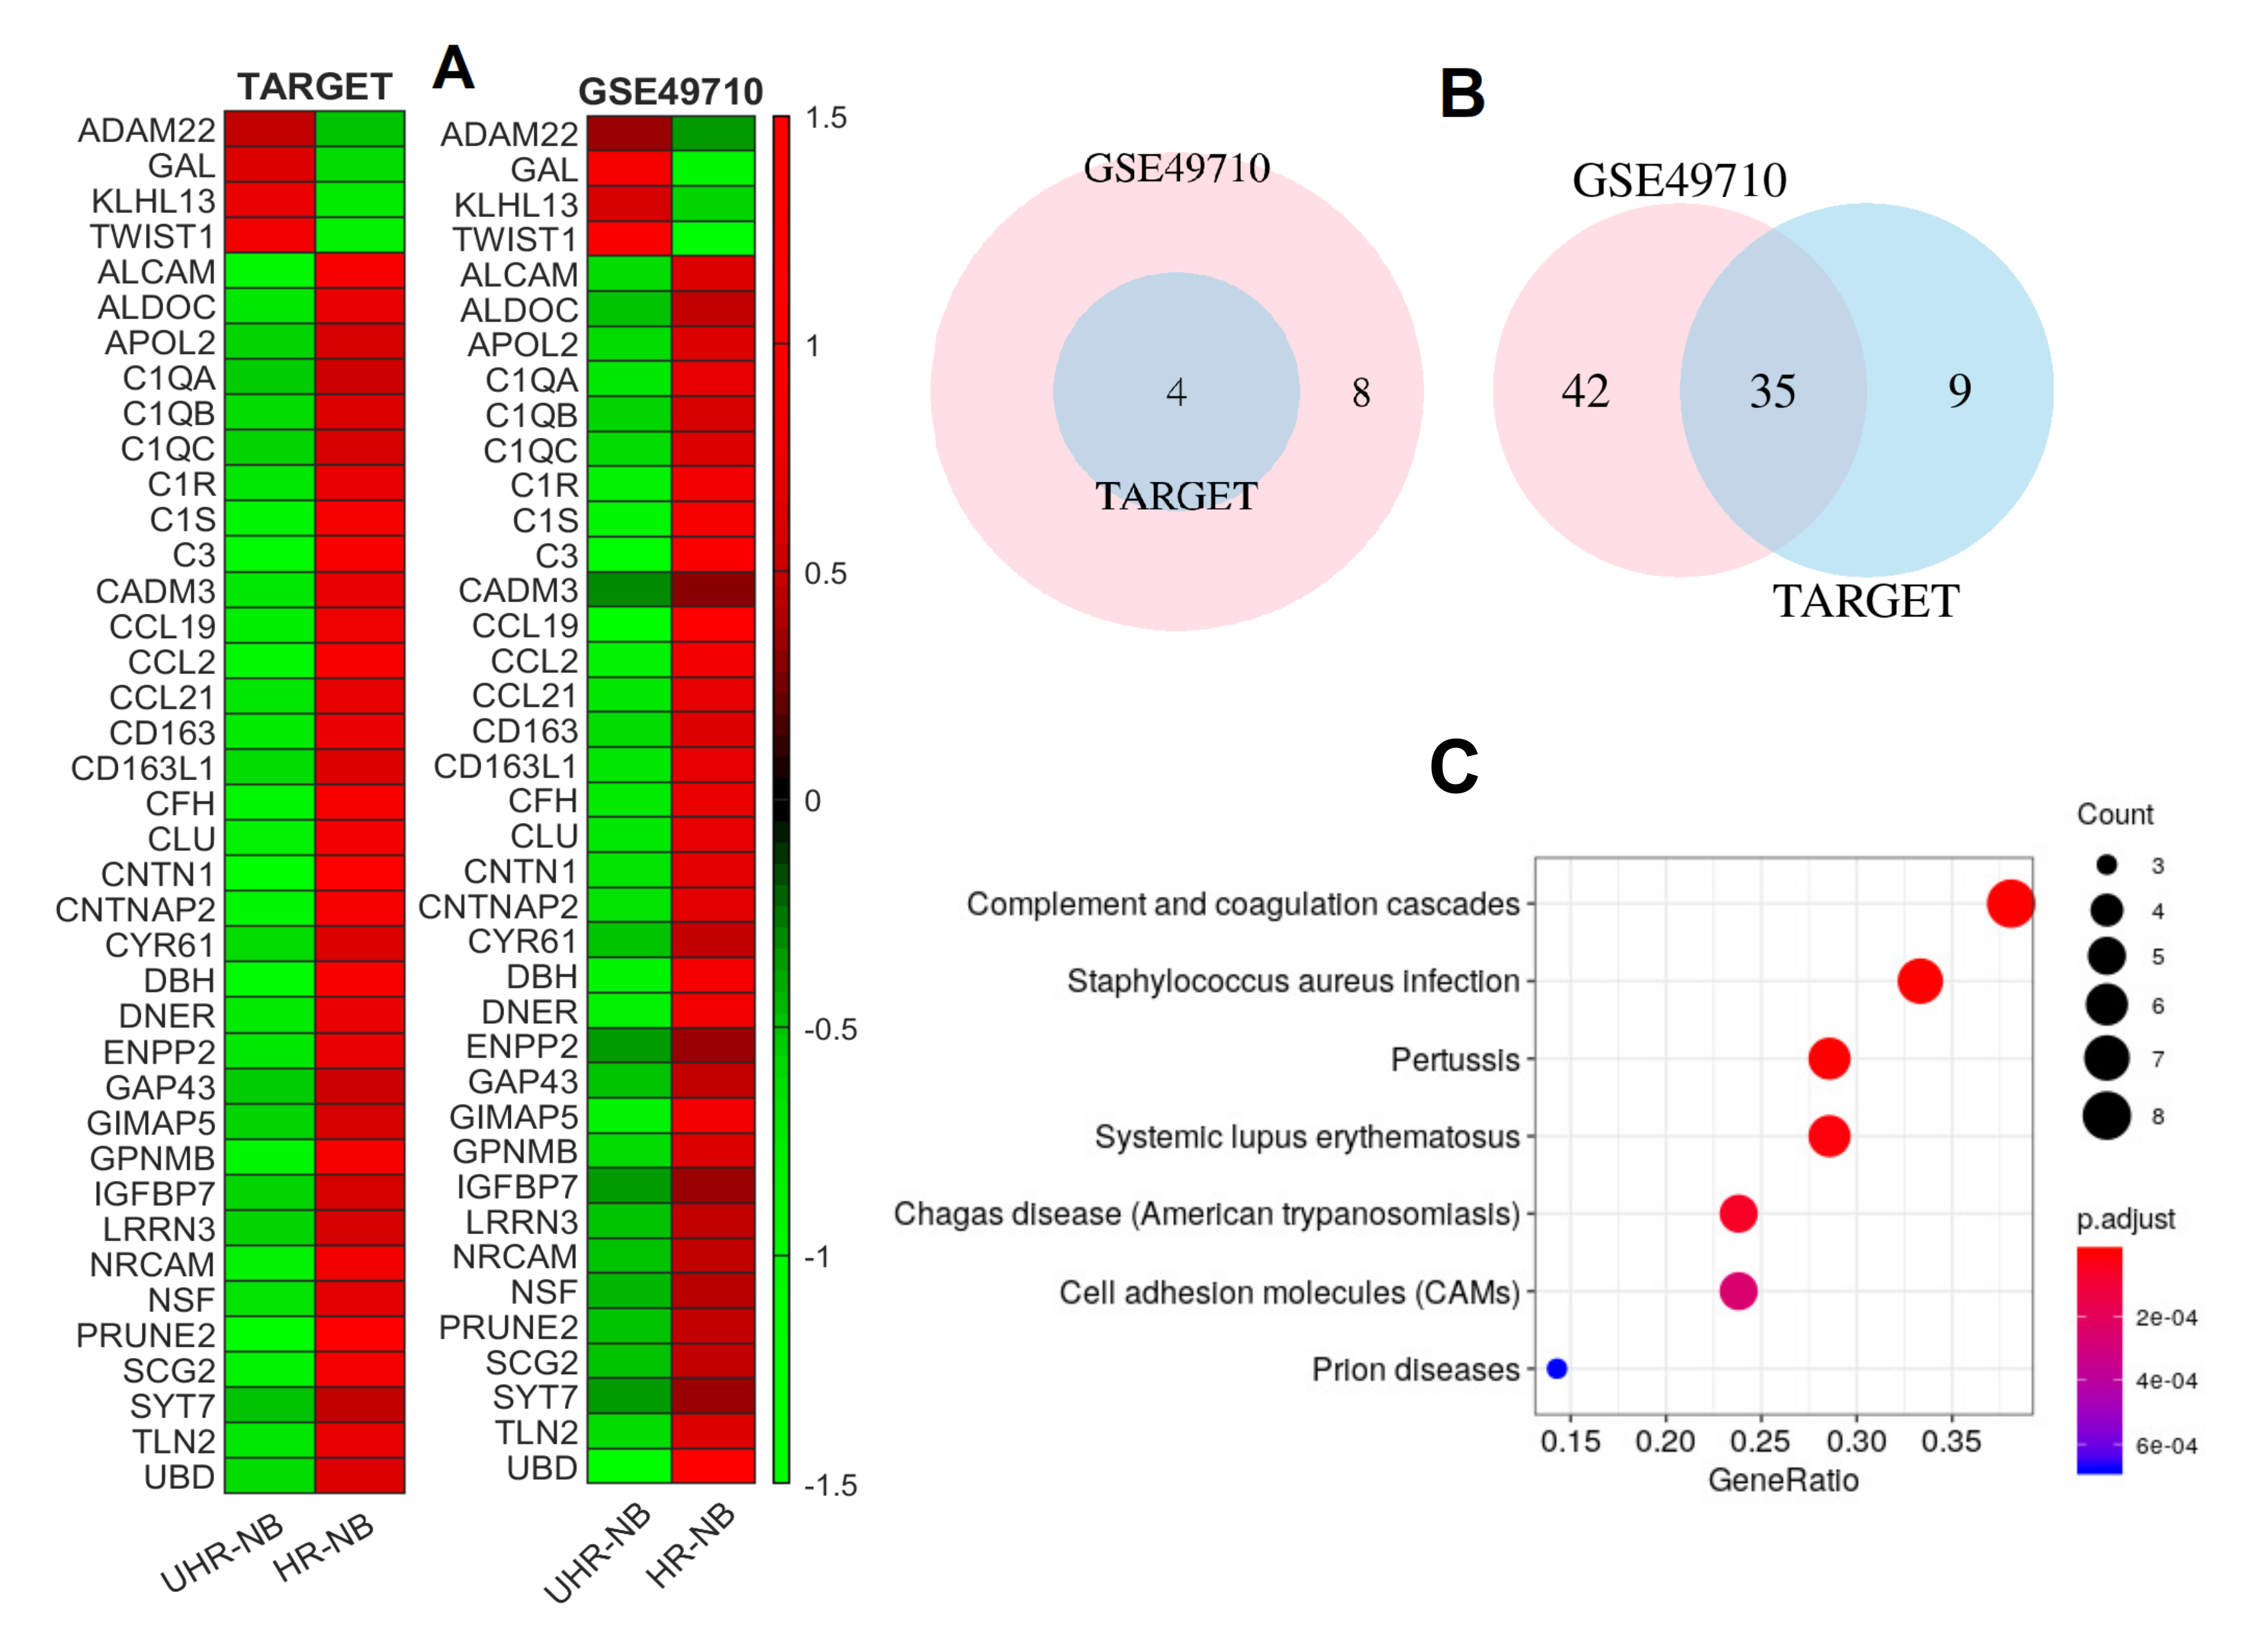
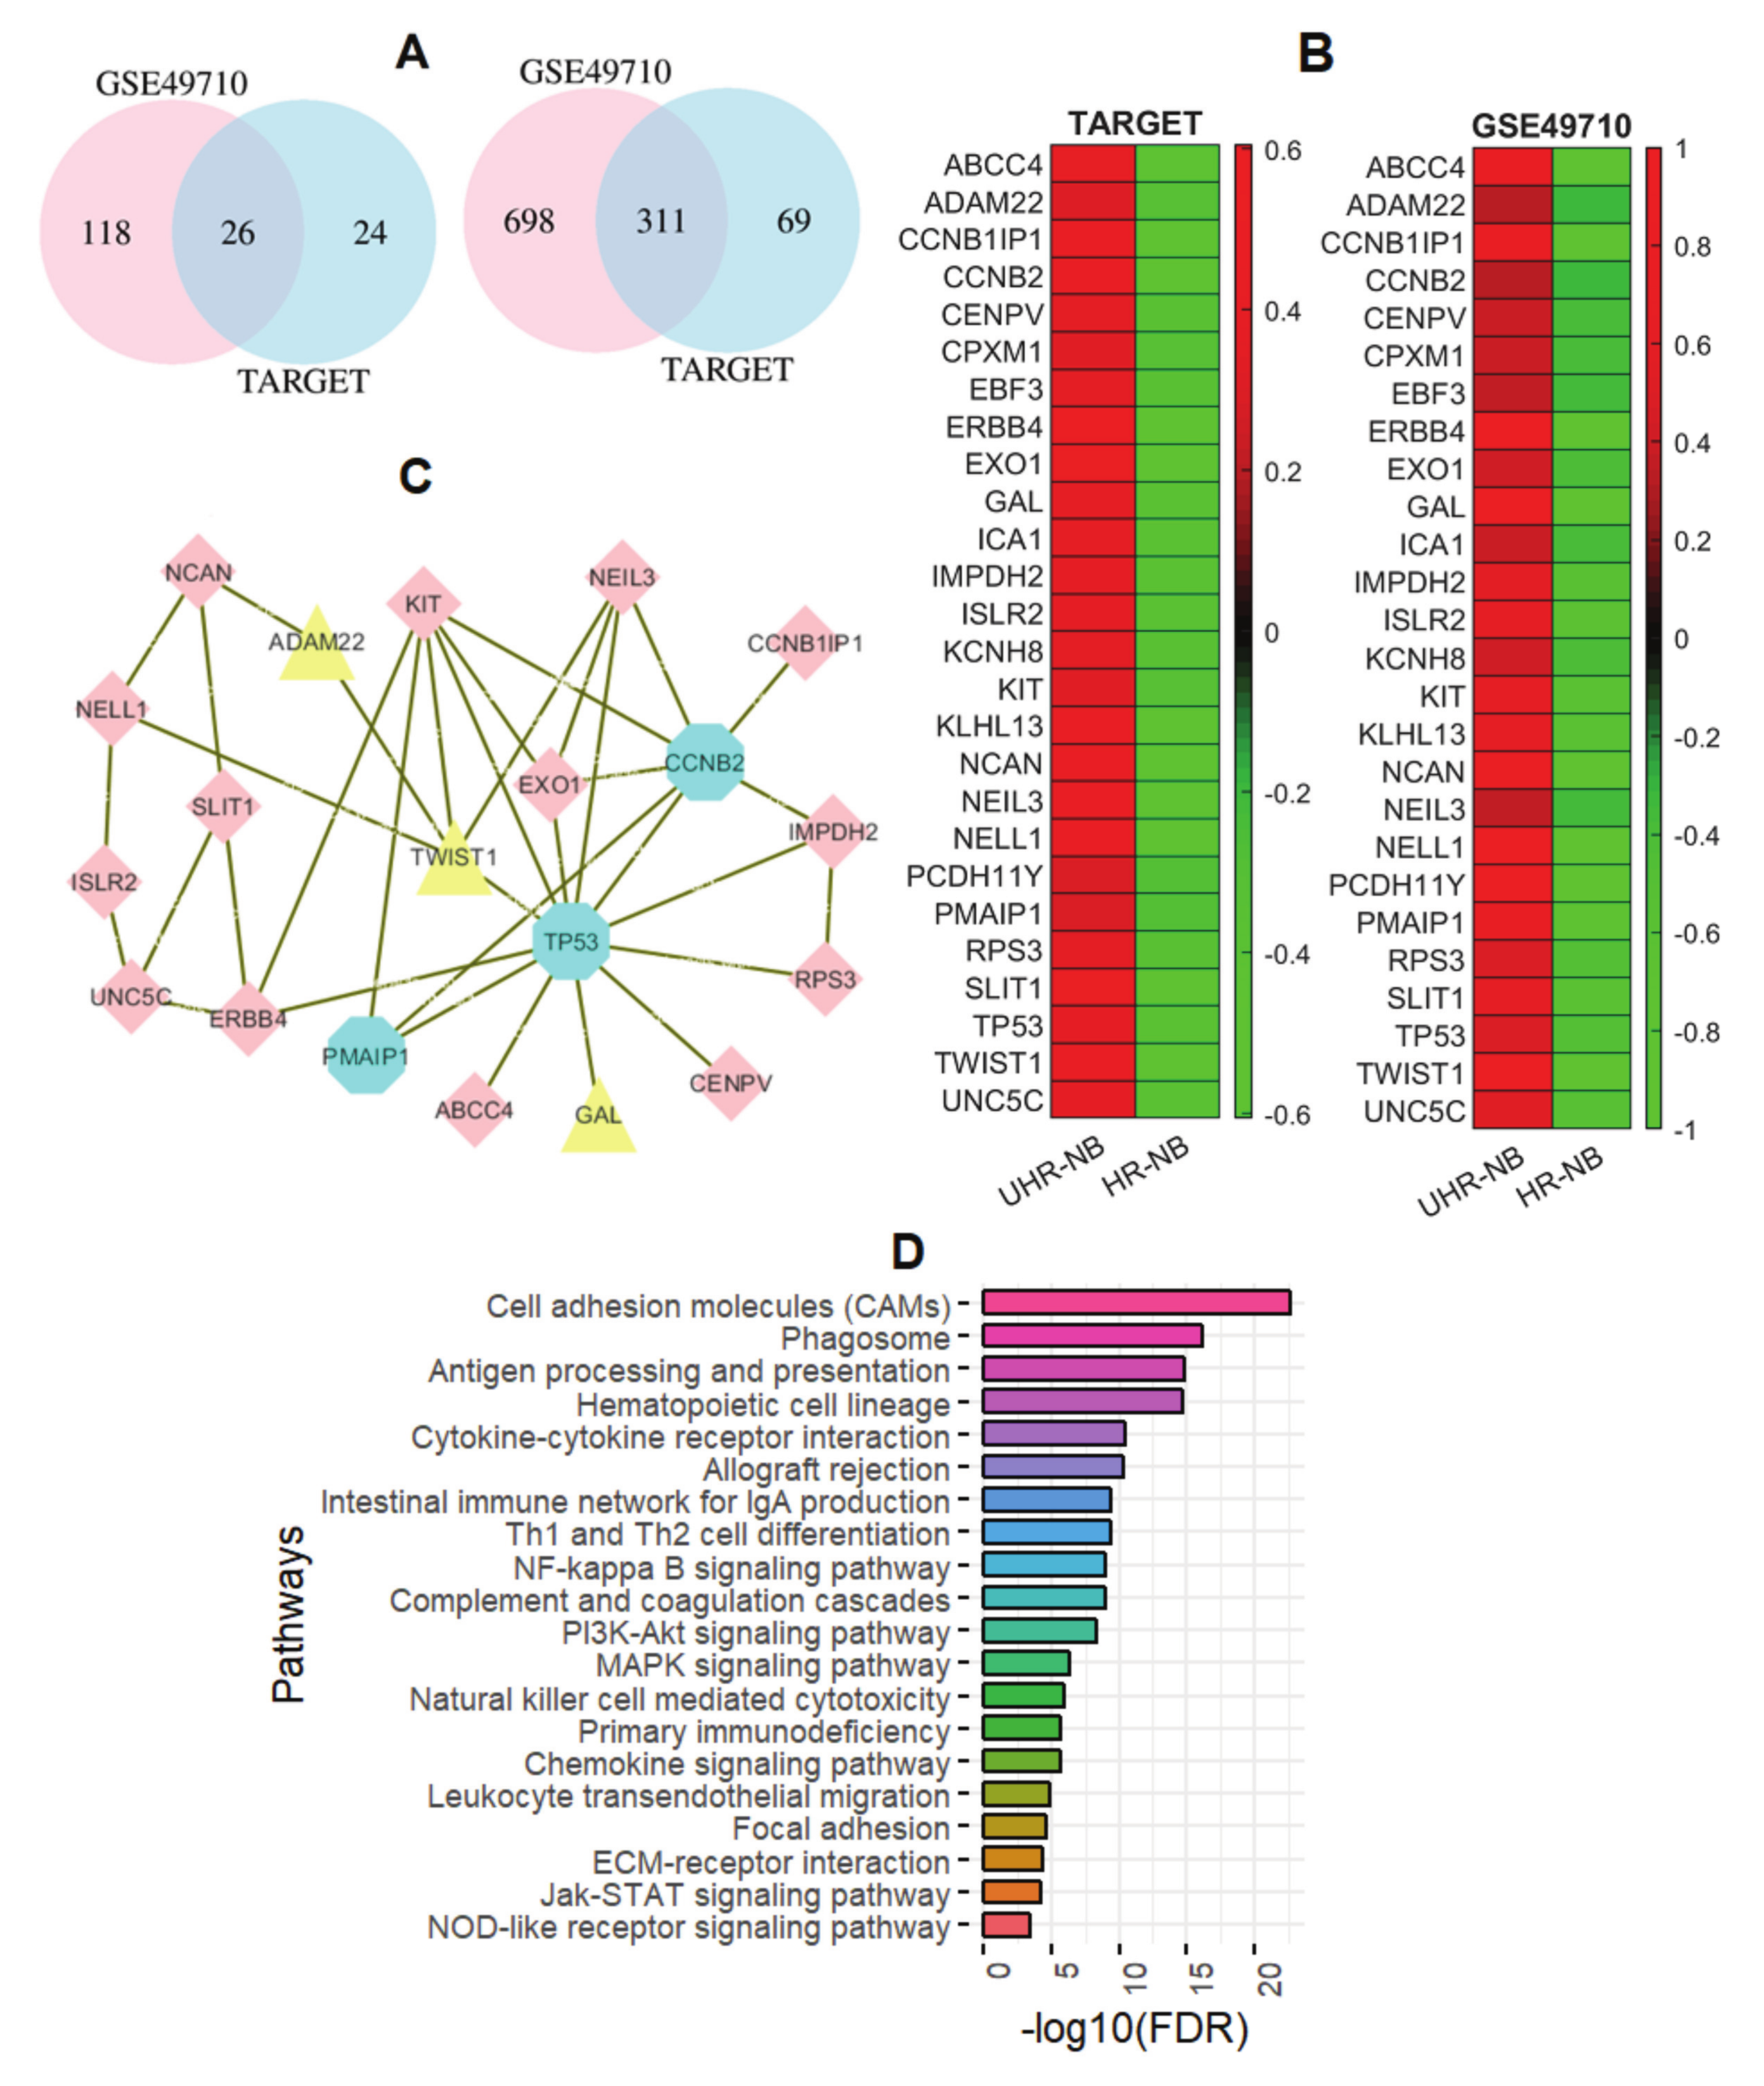
2.2. Thirty-Nine NB-Specific Differentiated Immune-Related Genes and Their Biological Characterization in UHR-NB and HR-NB Subtypes
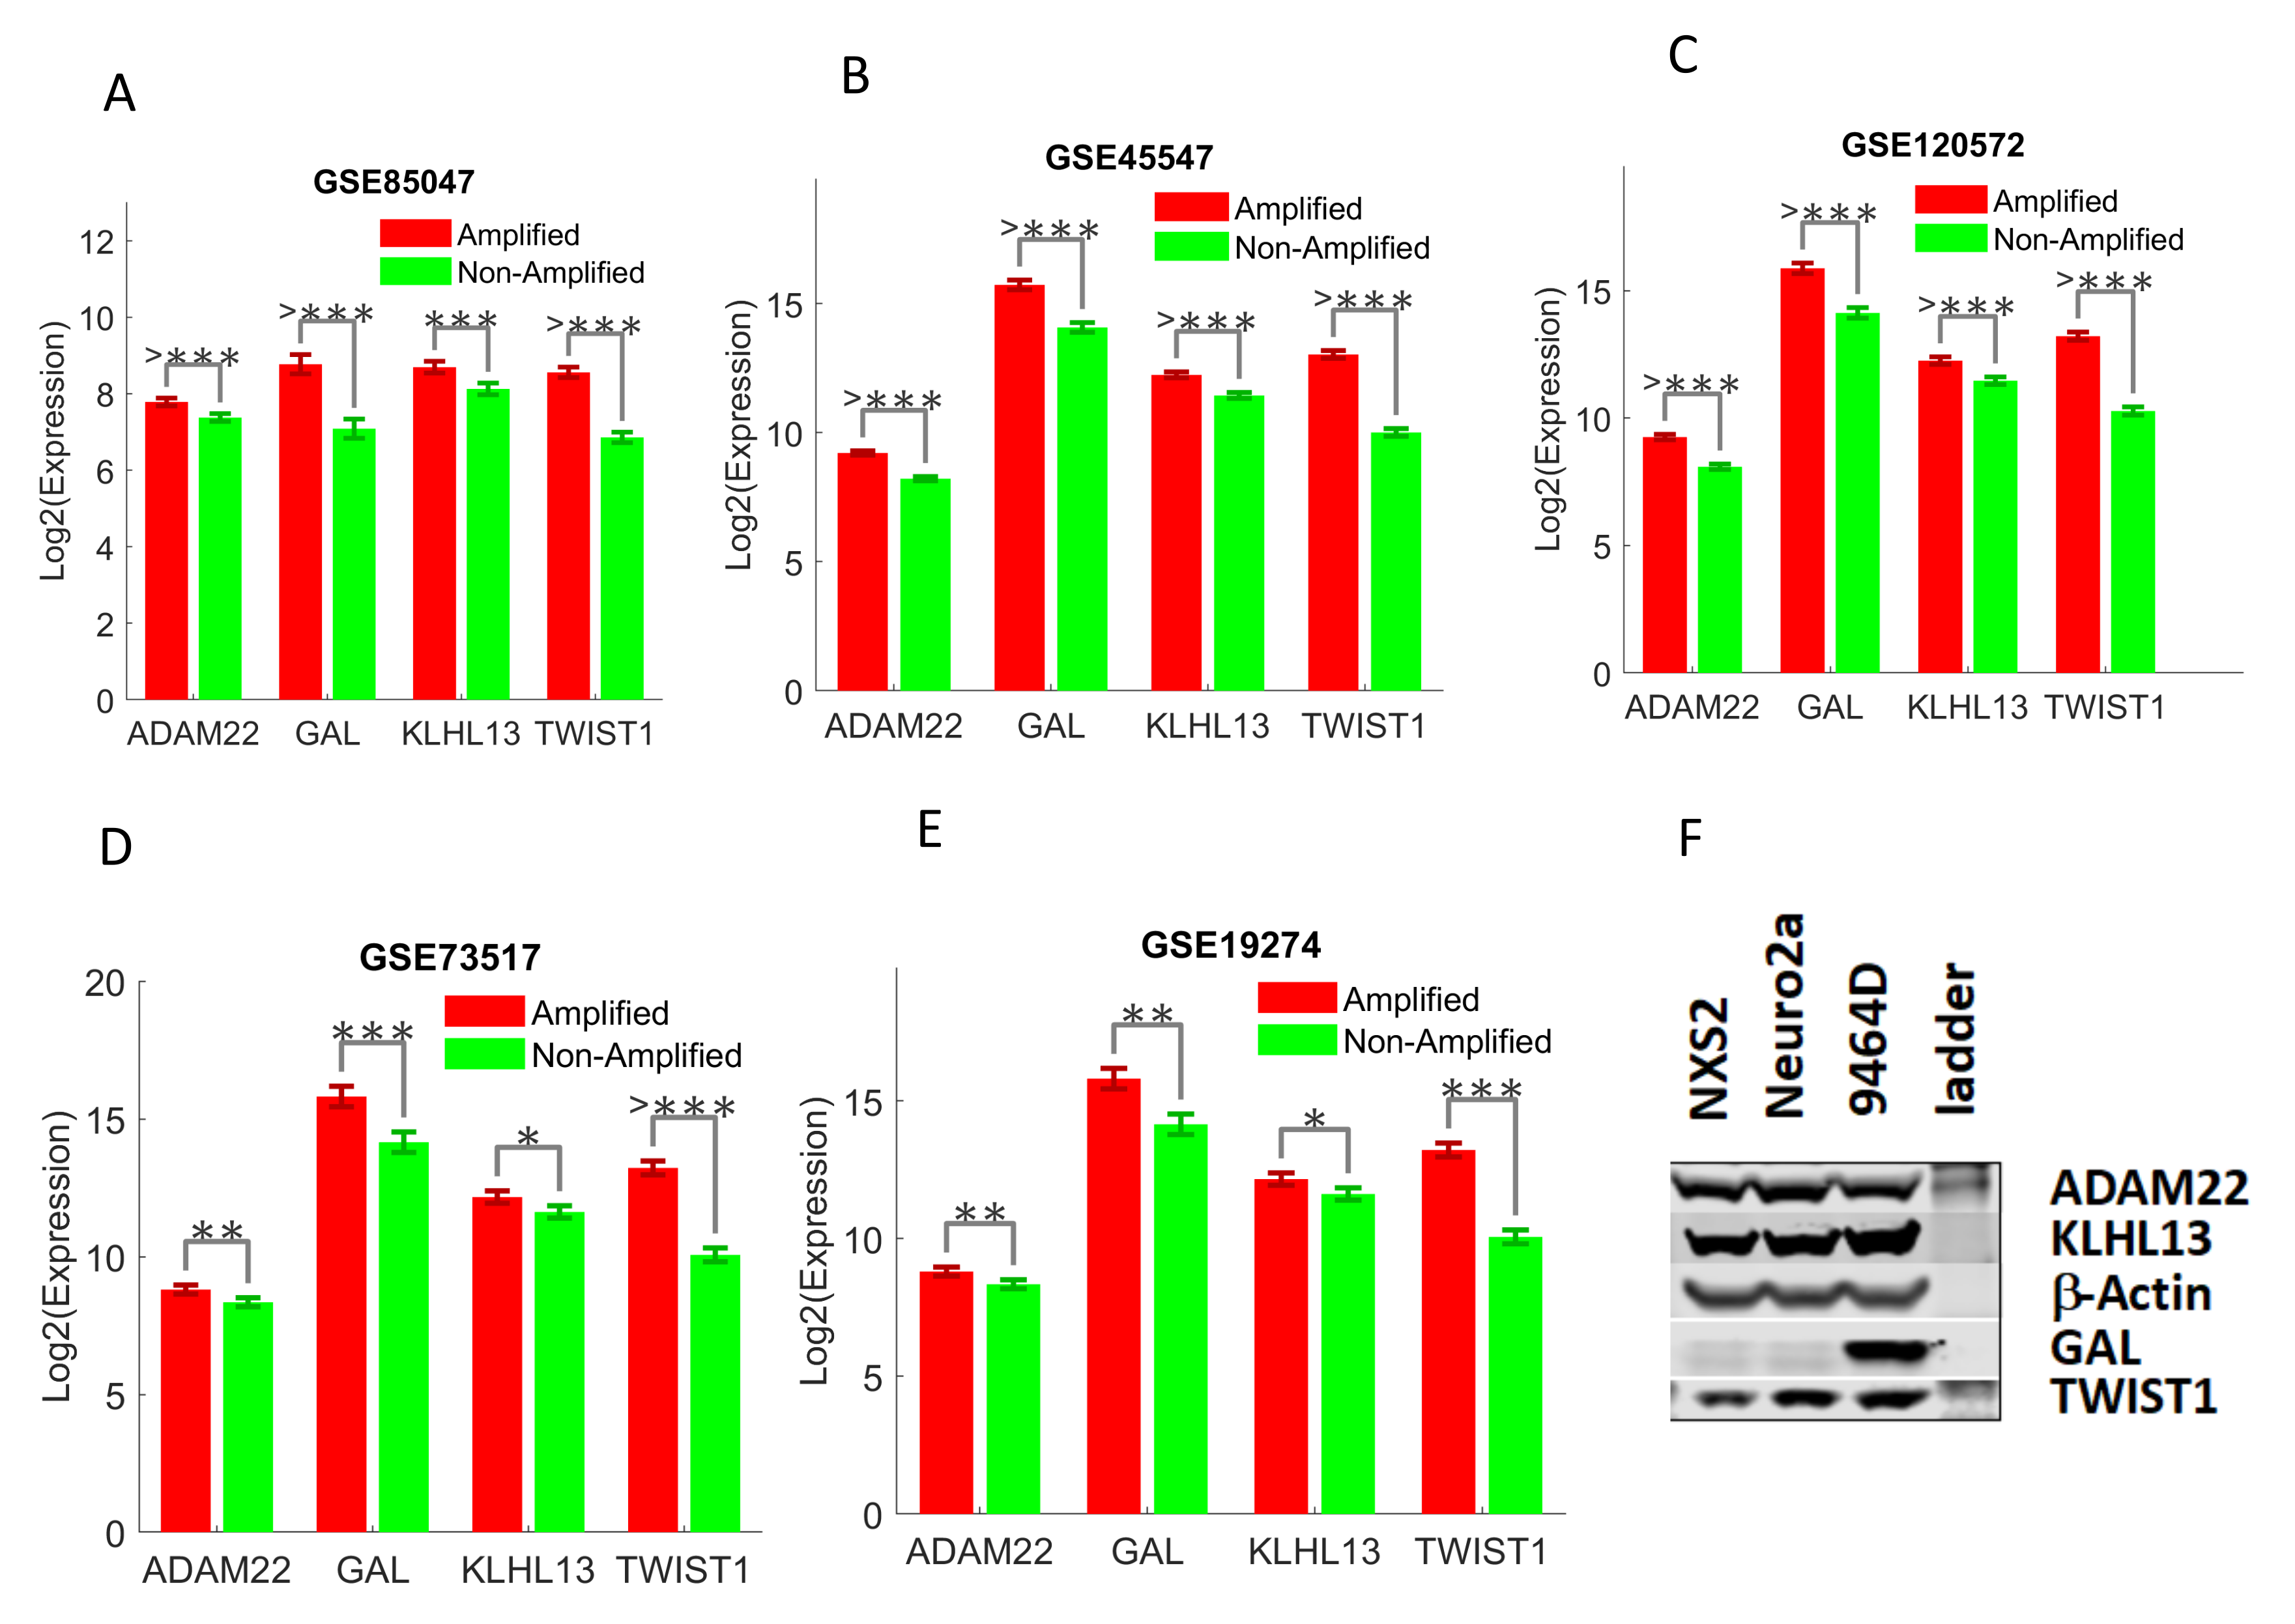
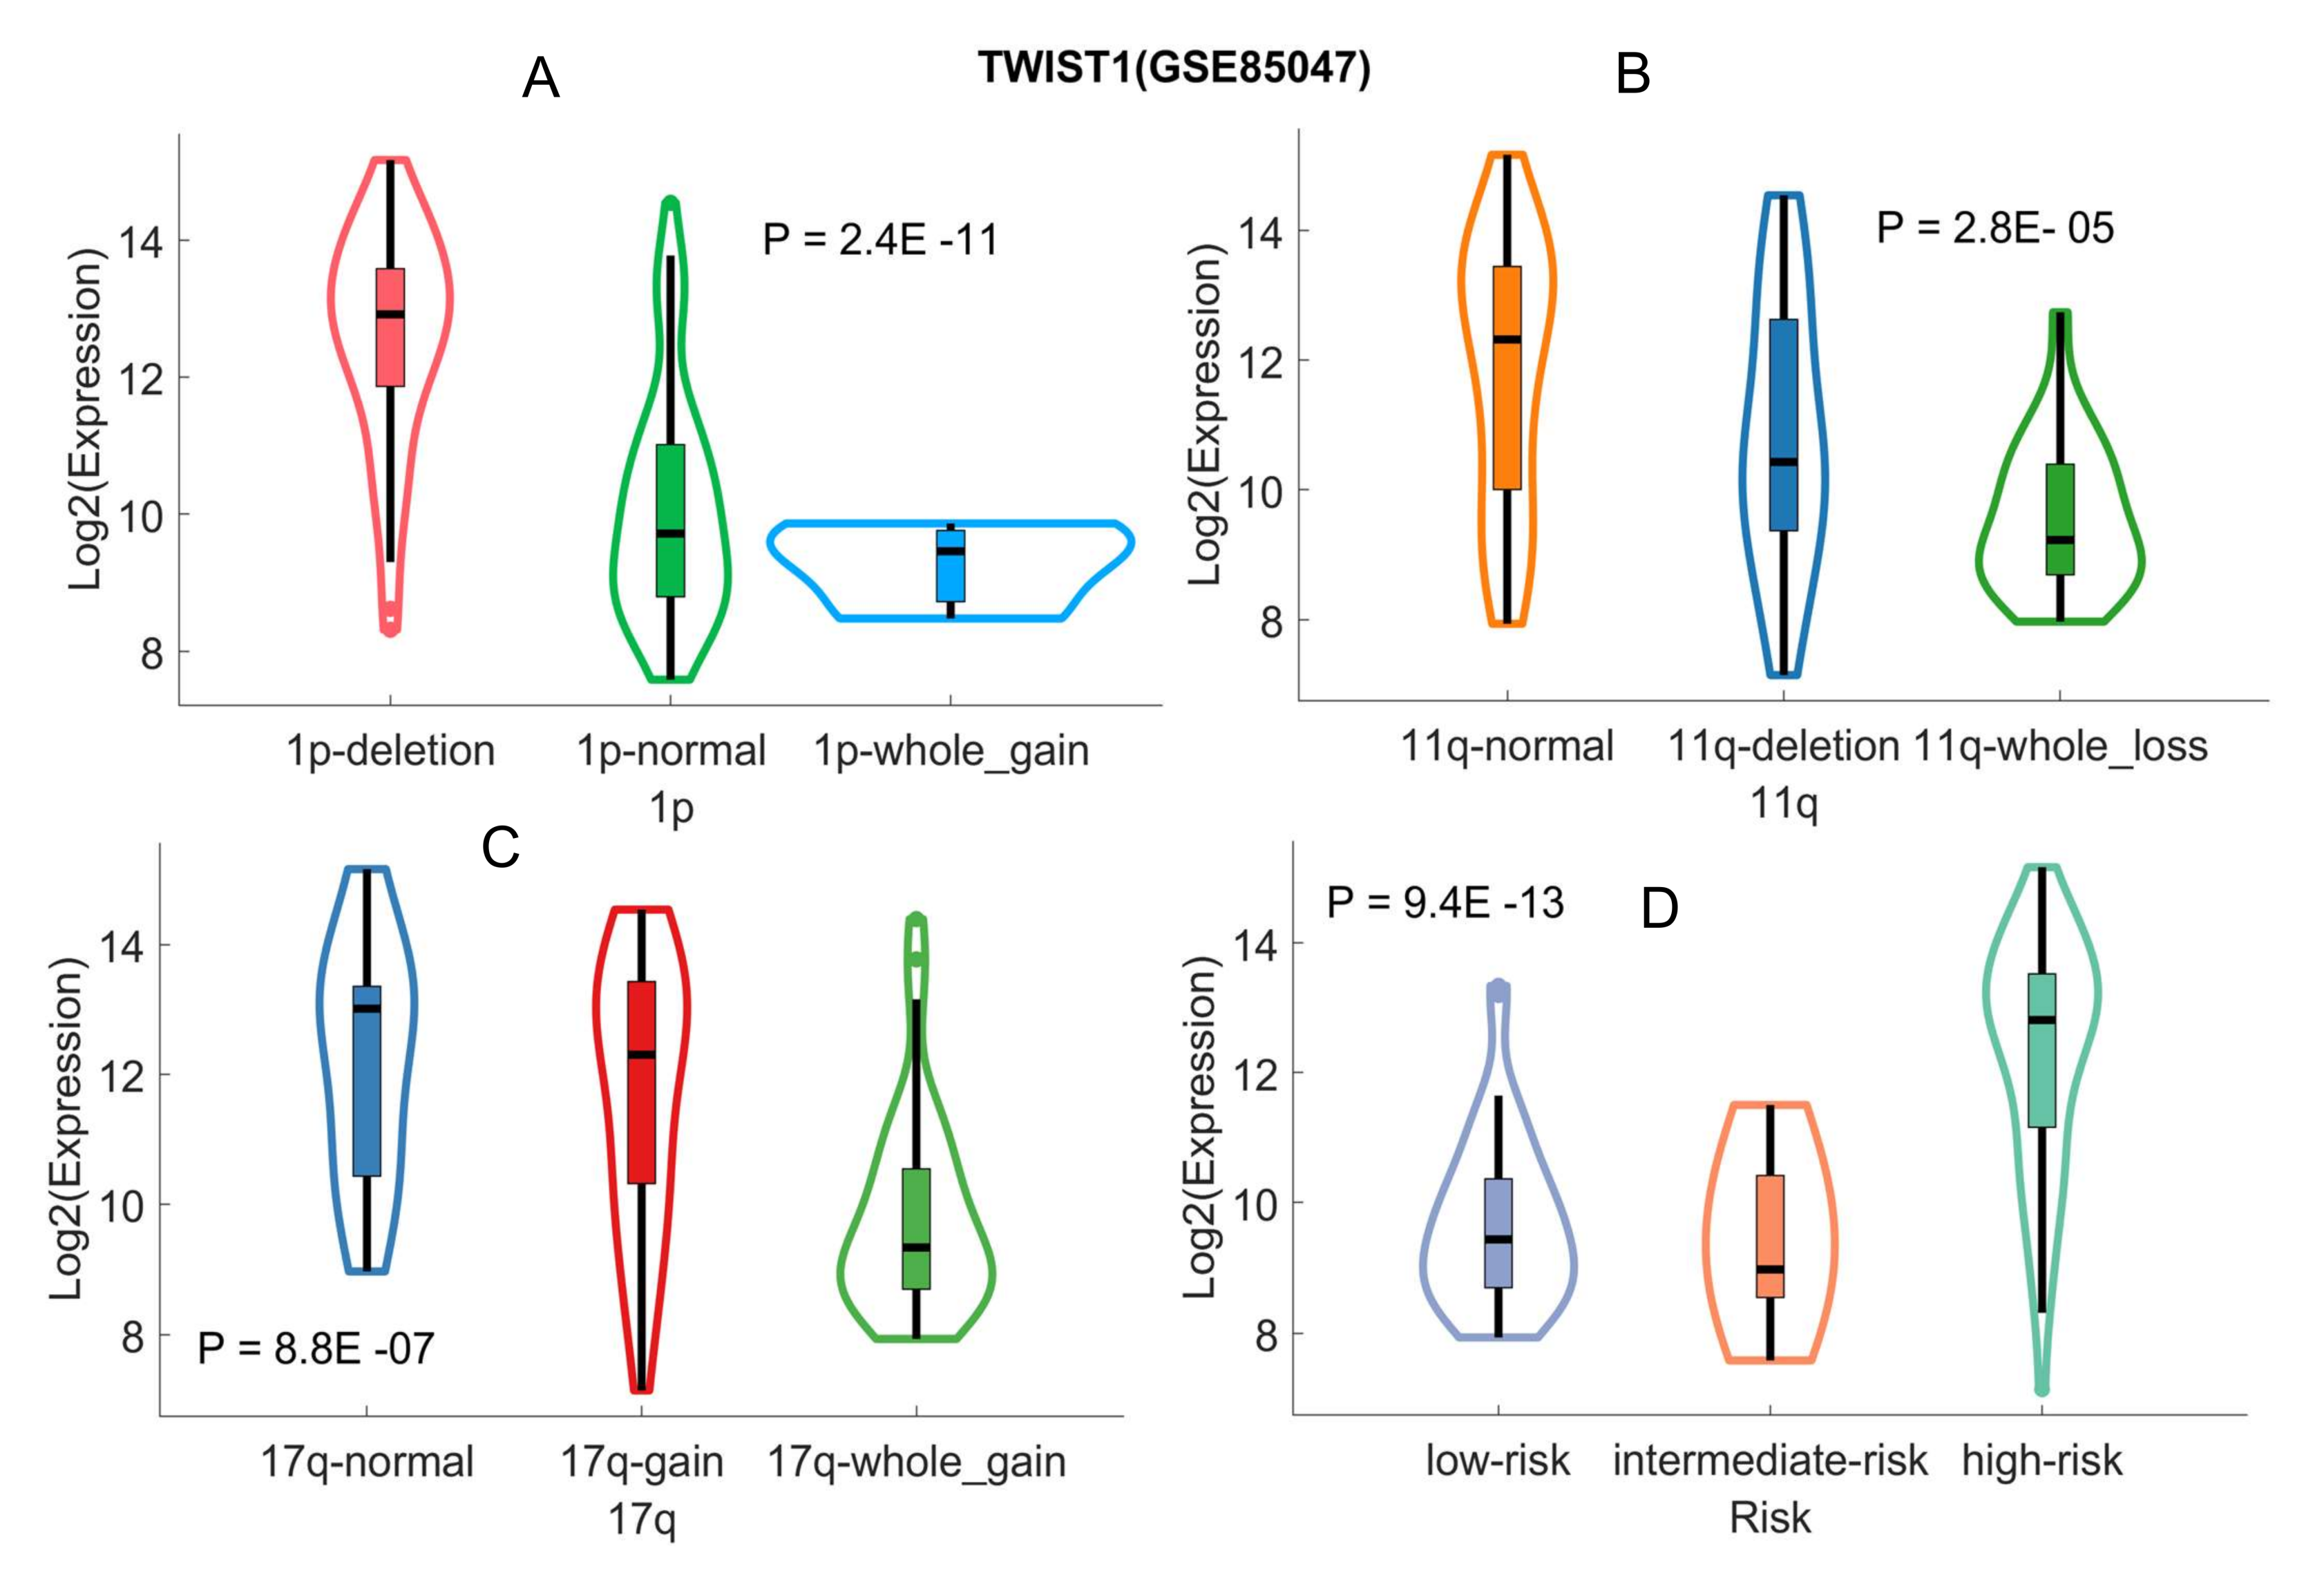
2.3. Validating Four Upregulated Immune-Related Genes in UHR-NB with Additional Independent Cohorts
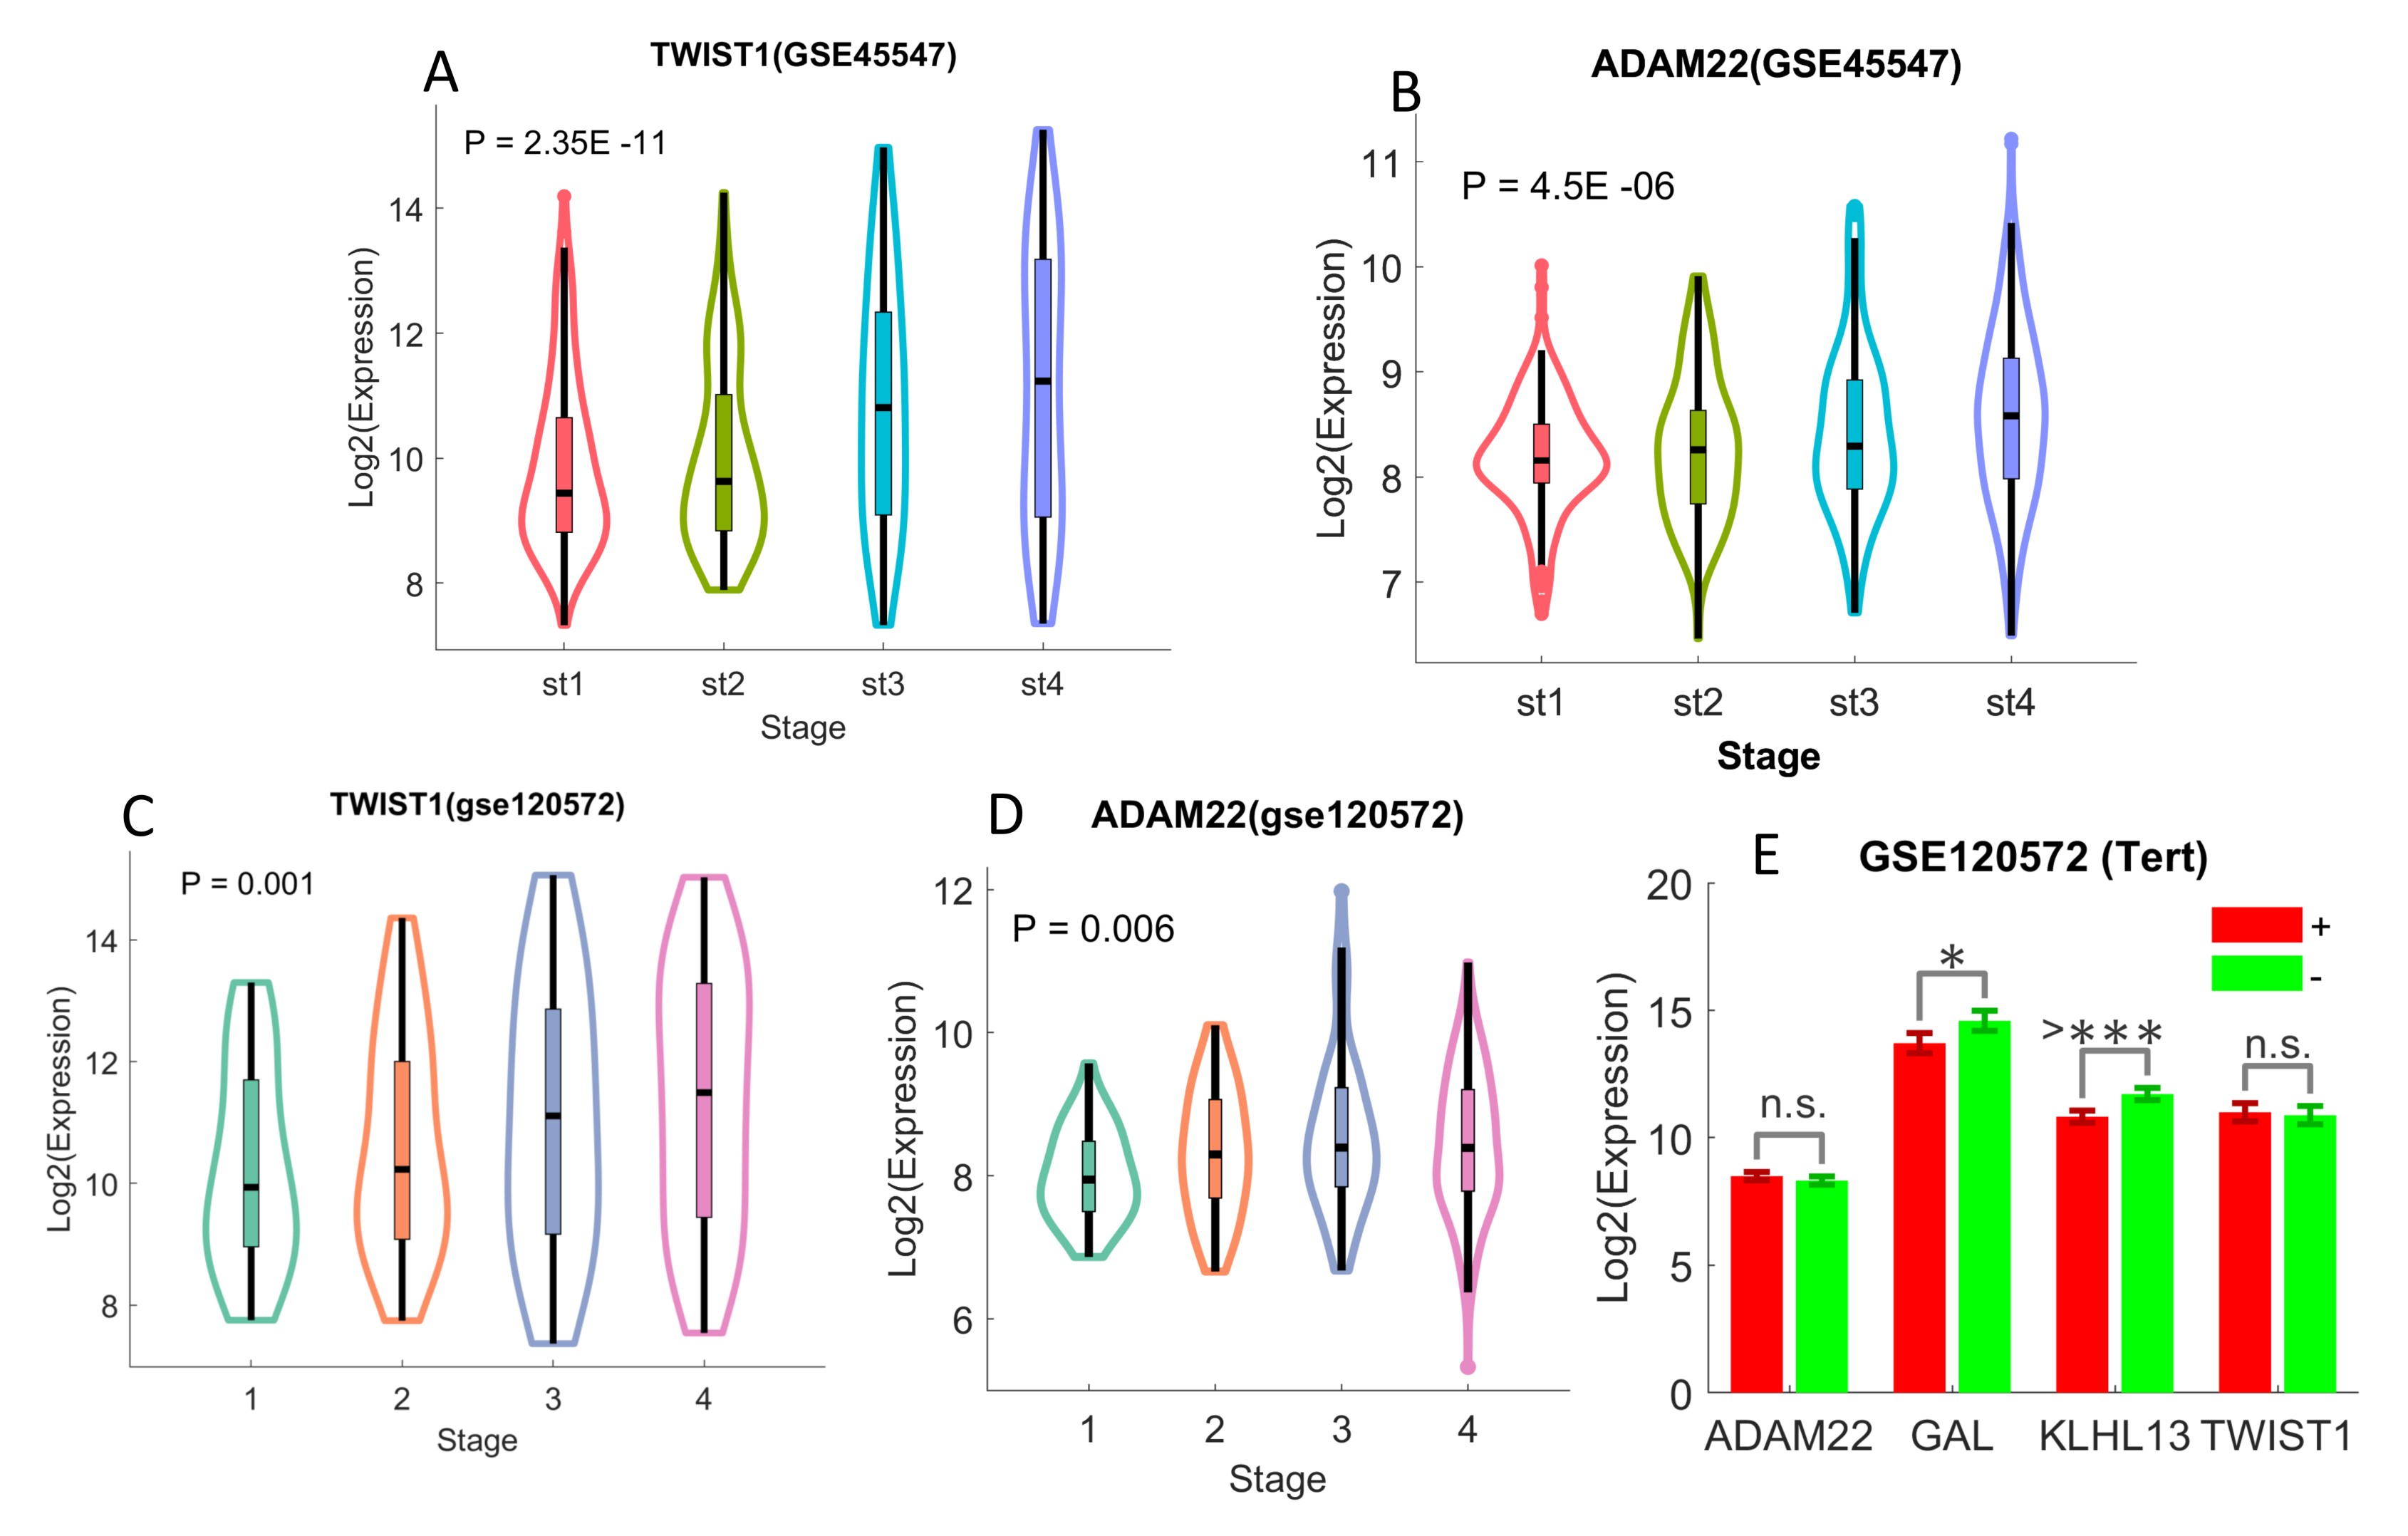
2.4. Differentiated Immune-Related Genes in UHR-NB Subtype and Their Biological Significance
3. Discussion
4. Materials and Methods
4.1. Datasets
4.1.1. RNA-Seq Data for Pediatric Pan-Cancer from TARGET
4.1.2. Neuroblastoma Gene Expression Data from TARGET
4.1.3. GSE49710 RNA-Seq Data
4.1.4. Other Neuroblastoma Patient Datasets from GEO:
- GSE19274 [27]: it includes the expression data of neuroblastoma primary tumors with the Illumina Human 6 version 2 expression l bead chip. There are 100 samples and total 19,937 genes. Clinical information including age, gender, stage, MYCN and PLOIDY status, and risk categories is available, but there is no patient survival information in this data.
- GSE45547 [28]: the expression profiles from 649 neuroblastoma tumors were originally generated using 44K oligonucleotide microarrays. There are a total of 19,320 genes in the data, and clinical information including age, gender, stage, and mycn status, and survival are available, but there is no risk stratification in the data.
- GSE73517 [20]: the RNA expression profiles of 105 primary neuroblastomas were originally generated with the k oligonucleotide microarrays. There are 105 NB samples and 19,320 genes available. Clinical metadata include age, stage, risk, MYCN status, and heterozygous deletions of 1p or 11q and gain of 17q.
- GSE85047 [29]: this is the expression profiles of 283 primary untreated neuroblastoma tumors with Affymetrix Human Exon 1.0 ST Array. There are 13,489 expressed genes. All of the tumor samples are fully annotated including patient age at diagnosis, overall and progression free survival and MYCN amplification status.
- GSE120572 [6]: the gene expression profiles of 394 NB samples were originally produced with Agilent-020382 Human Custom Microarray 44k. There are 30,853 genes (transcripts) in the data. Clinical metadata, including age, stage, MYCN, and TERT status, are available.
4.2. Methods
5. Conclusions
Supplementary Materials
Author Contributions
Funding
Conflicts of Interest
Abbreviations
| HR-NB | high risk neuroblastoma |
| UHR-NB | ultra-high risk neuroblastoma |
| NB | neuroblastoma |
| ALL | acute lymphoblastic leukemia |
| AML | acute myeloid leukemia |
| WT | Wilms tumor |
| TARGET | tumor alterations relevant for genomics-driven therapy |
| ADAM22 | A Disintegrin And Metalloproteinase Domain 22 |
| GAL | Galanin And GMAP Prepropeptide |
| KLHL13 | Kelch Like Family Member 13 |
| TWIST1 | Twist Family BHLH Transcription Factor 1 |
| OS | overall survival |
| EFS | event-free survival |
| MYCN | MYCN Proto-Oncogene, BHLH Transcription Factor. |
References
- Tolbert, V.; Matthay, K. Neuroblastoma: Clinical and biological approach to risk stratification and treatment. Cell Tissue Res. 2018, 372, 195–209. [Google Scholar] [CrossRef]
- Morgenstern, D.; Potschger, U.; Moreno, L.; Papadakis, V.; Owens, C.; Ash, S.; Pasqualini, C.; Luksch, R.; Garaventa, A.; Canete, A.; et al. Risk stratification of high-risk metastatic neuroblastoma: A report from the HR-NBL-1/SIOPEN study. Pediatr. Blood Cancer 2018, e27363. [Google Scholar] [CrossRef]
- Nicolai, S.; Pieraccioli, M.; Peschiaroli, A.; Melino, G.; Raschella, G. Neuroblastoma: Oncogenic mechanisms and therapeutic exploitation of necroptosis. Cell Death Dis. 2015, 6, e2010. [Google Scholar] [CrossRef] [PubMed]
- Kholodenko, I.; Kalinovsky, D.; Doronin, I.; Deyev, S.; Kholodenko, R. Neuroblastoma Origin and Therapeutic Targets for Immunotherapy. J. Immunol. Res. 2018, 2018, 7394268. [Google Scholar] [CrossRef]
- Ham, J.; Costa, C.; Sano, R.; Lochmann, T.; Sennott, E.; Patel, N.; Dastur, A.; Gomez-Caraballo, M.; Krytska, K.; Hata, A.N.; et al. Exploitation of the Apoptosis-Primed State of MYCN-Amplified Neuroblastoma to Develop a Potent and Specific Targeted Therapy Combination. Cancer Cell 2016, 29, 159–172. [Google Scholar] [CrossRef]
- Ackermann, S.; Cartolano, M.; Hero, B.; Welte, A.; Kahlert, Y.; Roderwieser, A.; Bartenhagen, C.; Walter, E.; Gecht, J.; Kerschke, L.; et al. A mechanistic classification of clinical phenotypes in neuroblastoma. Science 2018, 362, 1165–1170. [Google Scholar] [CrossRef] [PubMed]
- Martinez, E.; Yoshihara, K.; Kim, H.; Mills, G.; Trevino, V.; Verhaak, R. Comparison of gene expression patterns across 12 tumor types identifies a cancer supercluster characterized by TP53 mutations and cell cycle defects. Oncogene 2015, 34, 2732–2740. [Google Scholar] [CrossRef]
- Konstantinopoulos, P.; Spentzos, D.; Cannistra, S. Gene-expression profiling in epithelial ovarian cancer. Nat. Clin. Pract. Oncol. 2008, 5, 577–587. [Google Scholar] [CrossRef] [PubMed]
- Bijlsma, M.; Sadanandam, A.; Tan, P.; Vermeulen, L. Molecular subtypes in cancers of the gastrointestinal tract. Nat. Rev. Gastroenterol. Hepatol. 2017, 14, 333–342. [Google Scholar] [CrossRef] [PubMed]
- Kwa, M.; Makris, A.; Esteva, F. Clinical utility of gene-expression signatures in early stage breast cancer. Nat. Rev. Clin. Oncol. 2017, 14, 595–610. [Google Scholar] [CrossRef] [PubMed]
- Franco, H.; Nagari, A.; Malladi, V.; Li, W.; Xi, Y.; Richardson, D.; Allton, K.L.; Tanaka, K.; Li, J.; Murakami, S.; et al. Enhancer transcription reveals subtype-specific gene expression programs controlling breast cancer pathogenesis. Genome Res. 2018, 28, 159–170. [Google Scholar] [CrossRef] [PubMed]
- Sorlie, T.; Perou, C.; Tibshirani, R.; Aas, T.; Geisler, S.; Johnsen, H.; Hastie, T.; Eisen, M.B.; van de Rijn, M.; Jeffrey, S.S.; et al. Gene expression patterns of breast carcinomas distinguish tumor subclasses with clinical implications. Proc. Natl. Acad. Sci. USA 2001, 98, 10869–10874. [Google Scholar] [CrossRef]
- Pio, R.; Ajona, D.; Lambris, J.D. Complement inhibition in cancer therapy. Semin. Immunol. 2013, 25, 54–64. [Google Scholar] [CrossRef]
- Afshar-Kharghan, V. The role of the complement system in cancer. JCI 2017, 127, 780–789. [Google Scholar] [CrossRef] [PubMed]
- Bolger, J.; Young, L. ADAM22 as a prognostic and therapeutic drug target in the treatment of endocrine-resistant breast cancer. Vitam. Horm. 2013, 93, 307–321. [Google Scholar] [PubMed]
- Batzke, K.; Buchel, G.; Hansen, W.; Schramm, A. TrkB-Target Galectin-1 Impairs Immune Activation and Radiation Responses in Neuroblastoma: Implications for Tumour Therapy. Int. J. Mol. Sci. 2018, 19, 718. [Google Scholar] [CrossRef]
- Selmi, A.; de Saint-Jean, M.; Jallas, A.; Garin, E.; Hogarty, M.; Bénard, J.; Puisieux, A.; Marabelle, A.; Valsesia-Wittmann, S. TWIST1 is a direct transcriptional target of MYCN and MYC in neuroblastoma. Cancer Lett. 2015, 357, 412–418. [Google Scholar] [CrossRef]
- Petrov, I.; Suntsova, M.; Ilnitskaya, E.; Roumiantsev, S.; Sorokin, M.; Garazha, A.; Spirin, P.; Lebedev, T.; Gaifullin, N.; Larin, S.; et al. Gene expression and molecular pathway activation signatures of MYCN-amplified neuroblastoma. Oncotarget 2017, 8, 83768–83780. [Google Scholar] [CrossRef]
- Zeid, R.; Lawlor, M.; Poon, E.; Reyes, J.; Fulciniti, M.; Lopez, M.; Scott, T.G.; Nabet, B.; Erb, M.A.; Winter, G.E.; et al. Enhancer invasion shapes MYCN-dependent transcriptional amplification in neuroblastoma. Nat. Genet. 2018, 50, 515–523. [Google Scholar] [CrossRef]
- Henrich, K.; Bender, S.; Saadati, M.; Dreidax, D.; Gartlgruber, M.; Shao, C.; Herrmann, C.; Wiesenfarth, M.; Parzonka, M.; Wehrmann, L.; et al. Integrative Genome-Scale Analysis Identifies Epigenetic Mechanisms of Transcriptional Deregulation in Unfavorable Neuroblastomas. Cancer Res. 2016, 76, 5523–5537. [Google Scholar] [CrossRef]
- Melling, N.; Norrenbrock, S.; Kluth, M.; Simon, R.; Hube-Magg, C.; Steurer, S.; Hinsch, A.; Burandt, E.; Jacobsen, F.; Wilczak, W.; et al. p53 overexpression is a prognosticator of poor outcome in esophageal cancer. Oncol. Lett. 2019, 17, 3826–3834. [Google Scholar] [CrossRef] [PubMed]
- Li, C.; Bu, J.; Liao, Y.; Zhang, J.; Han, J.; Zhang, H.; Xing, H.; Li, Z.; Wu, H.; Liang, L.; et al. High Expressions of CUL4A and TP53 in Colorectal Cancer Predict Poor Survival. Cell Physiol. Biochem. 2018, 51, 2829–2842. [Google Scholar] [CrossRef] [PubMed]
- Wang, X.; Sun, Q. TP53 mutations, expression and interaction networks in human cancers. Oncotarget 2017, 8, 624–643. [Google Scholar] [CrossRef] [PubMed]
- Munoz-Fontela, C.; Mandinova, A.; Aaronson, S.; Lee, S. Emerging roles of p53 and other tumour-suppressor genes in immune regulation. Nat. Rev. Immunol. 2016, 16, 741–750. [Google Scholar] [CrossRef]
- Pugh, T.; Morozova, O.; Attiyeh, E.; Asgharzadeh, S.; Wei, J.; Auclair, D.; Carter, S.L.; Cibulskis, K.; Hanna, M.; Kiezun, A.; et al. The genetic landscape of high-risk neuroblastom. Nat. Genet. 2013, 45, 279–284. [Google Scholar] [CrossRef]
- Wang, C.; Gong, B.; Bushel, P.R.; Thierry-Mieg, J.; Thierry-Mieg, D.; Xu, J.; Fang, H.; Hong, H.; Shen, J.; Su, Z.; et al. The concordance between RNA-seq and microarray data depends on chemical treatment and transcript abundance. Nat. Biotechnol. 2014, 32, 926–932. [Google Scholar] [CrossRef]
- Cole, K.; Huggins, J.; Laquaglia, M.; Hulderman, C.; Russell, M.R.; Bosse, K.; Diskin, S.J.; Attiyeh, E.F.; Sennett, R.; Norris, G.; et al. RNAi screen of the protein kinome identifies checkpoint kinase 1 (CHK1) as a therapeutic target in neuroblastoma. Proc. Natl. Acad. Sci. USA 2011, 108, 3336–3341. [Google Scholar] [CrossRef]
- Kocak, H.; Ackermann, S.; Hero, B.; Kahlert, Y.; Oberthuer, A.; Juraeva, D.; Roels, F.; Theissen, J.; Westermann, F.; Deubzer, H.; et al. Hox-C9 activates the intrinsic pathway of apoptosis and is associated with spontaneous regression in neuroblastoma. Cell Death Dis. 2013, 4, e586. [Google Scholar] [CrossRef]
- Rajbhandari, P.; Lopez, G.; Capdevila, C.; Salvatori, B.; Yu, J.; Rodriguez-Barrueco, R.; Martinez, D.; Yarmarkovich, M.; Weichert-Leahey, N.; Abraham, B.J.; et al. Cross-Cohort Analysis Identifies a TEAD4-MYCN Positive Feedback Loop as the Core Regulatory Element of High-Risk Neuroblastoma. Cancer Discov. 2018, 8, 582–599. [Google Scholar] [CrossRef] [PubMed]
- Padilha, V.; Campello, R. A systematic comparative evaluation of biclustering techniques. BMC Bioinform. 2017, 18, 55. [Google Scholar] [CrossRef]
- Busygin, S.; Prokopyev, O.; Pardalos, P. Biclustering in data mining. Comp. Operat. Res. 2008, 35, 2964–2987. [Google Scholar] [CrossRef]
- Dhillon, I. Co-clustering documents and words using Bipartite Spectral Graph Partitioning. In Proceedings of the Seventh ACM SIGKDD International Conference on Knowledge Discovery and Data Mining (KDD), San Francisco, CA, USA, 26–29 August 2001. [Google Scholar]
- Chen, H.; Boutros, P.; Chen, H.; Boutros, P.C. VennDiagram: A package for the generation of highly-customizable Venn and Euler diagrams in R. BMC Bioinformatics 12: 35. BMC Bioinform. 2011, 12, 35. [Google Scholar] [CrossRef] [PubMed]
- Yu, G.; Wang, L.G.; Han, Y.; He, Q.Y. clusterProfiler: An R Package for Comparing Biological Themes Among Gene Clusters. Omics J. Integrat. Biol. 2012, 16, 284–287. [Google Scholar] [CrossRef]
- Shannon, P.; Markiel, A.; Ozier, O.; Baliga, N.; Wang, J.; Ramage, D.; Amin, N.; Schwikowski, B.; Ideker, T. Cytoscape: A Software Environment for Integrated Models of Biomolecular Interaction Networks. Genome Res. 2003, 13, 2498–2504. [Google Scholar] [CrossRef] [PubMed]
Sample Availability: All gene expression datasets in this manuscript were downloaded from public domain. The software tools for data analysis will be posted on GitHub (www.github.com), and will be freely available to any investigator wishing to use them. |


© 2020 by the authors. Licensee MDPI, Basel, Switzerland. This article is an open access article distributed under the terms and conditions of the Creative Commons Attribution (CC BY) license (http://creativecommons.org/licenses/by/4.0/).
Share and Cite
Liu, Z.; Grant, C.N.; Sun, L.; Miller, B.A.; Spiegelman, V.S.; Wang, H.-G. Expression Patterns of Immune Genes Reveal Heterogeneous Subtypes of High-Risk Neuroblastoma. Cancers 2020, 12, 1739. https://doi.org/10.3390/cancers12071739
Liu Z, Grant CN, Sun L, Miller BA, Spiegelman VS, Wang H-G. Expression Patterns of Immune Genes Reveal Heterogeneous Subtypes of High-Risk Neuroblastoma. Cancers. 2020; 12(7):1739. https://doi.org/10.3390/cancers12071739
Chicago/Turabian StyleLiu, Zhenqiu, Christa N. Grant, Lidan Sun, Barbara A. Miller, Vladimir S. Spiegelman, and Hong-Gang Wang. 2020. "Expression Patterns of Immune Genes Reveal Heterogeneous Subtypes of High-Risk Neuroblastoma" Cancers 12, no. 7: 1739. https://doi.org/10.3390/cancers12071739
APA StyleLiu, Z., Grant, C. N., Sun, L., Miller, B. A., Spiegelman, V. S., & Wang, H.-G. (2020). Expression Patterns of Immune Genes Reveal Heterogeneous Subtypes of High-Risk Neuroblastoma. Cancers, 12(7), 1739. https://doi.org/10.3390/cancers12071739