Calcium Signaling Alterations Caused by Epigenetic Mechanisms in Pancreatic Cancer: From Early Markers to Prognostic Impact

 , , , , , , and
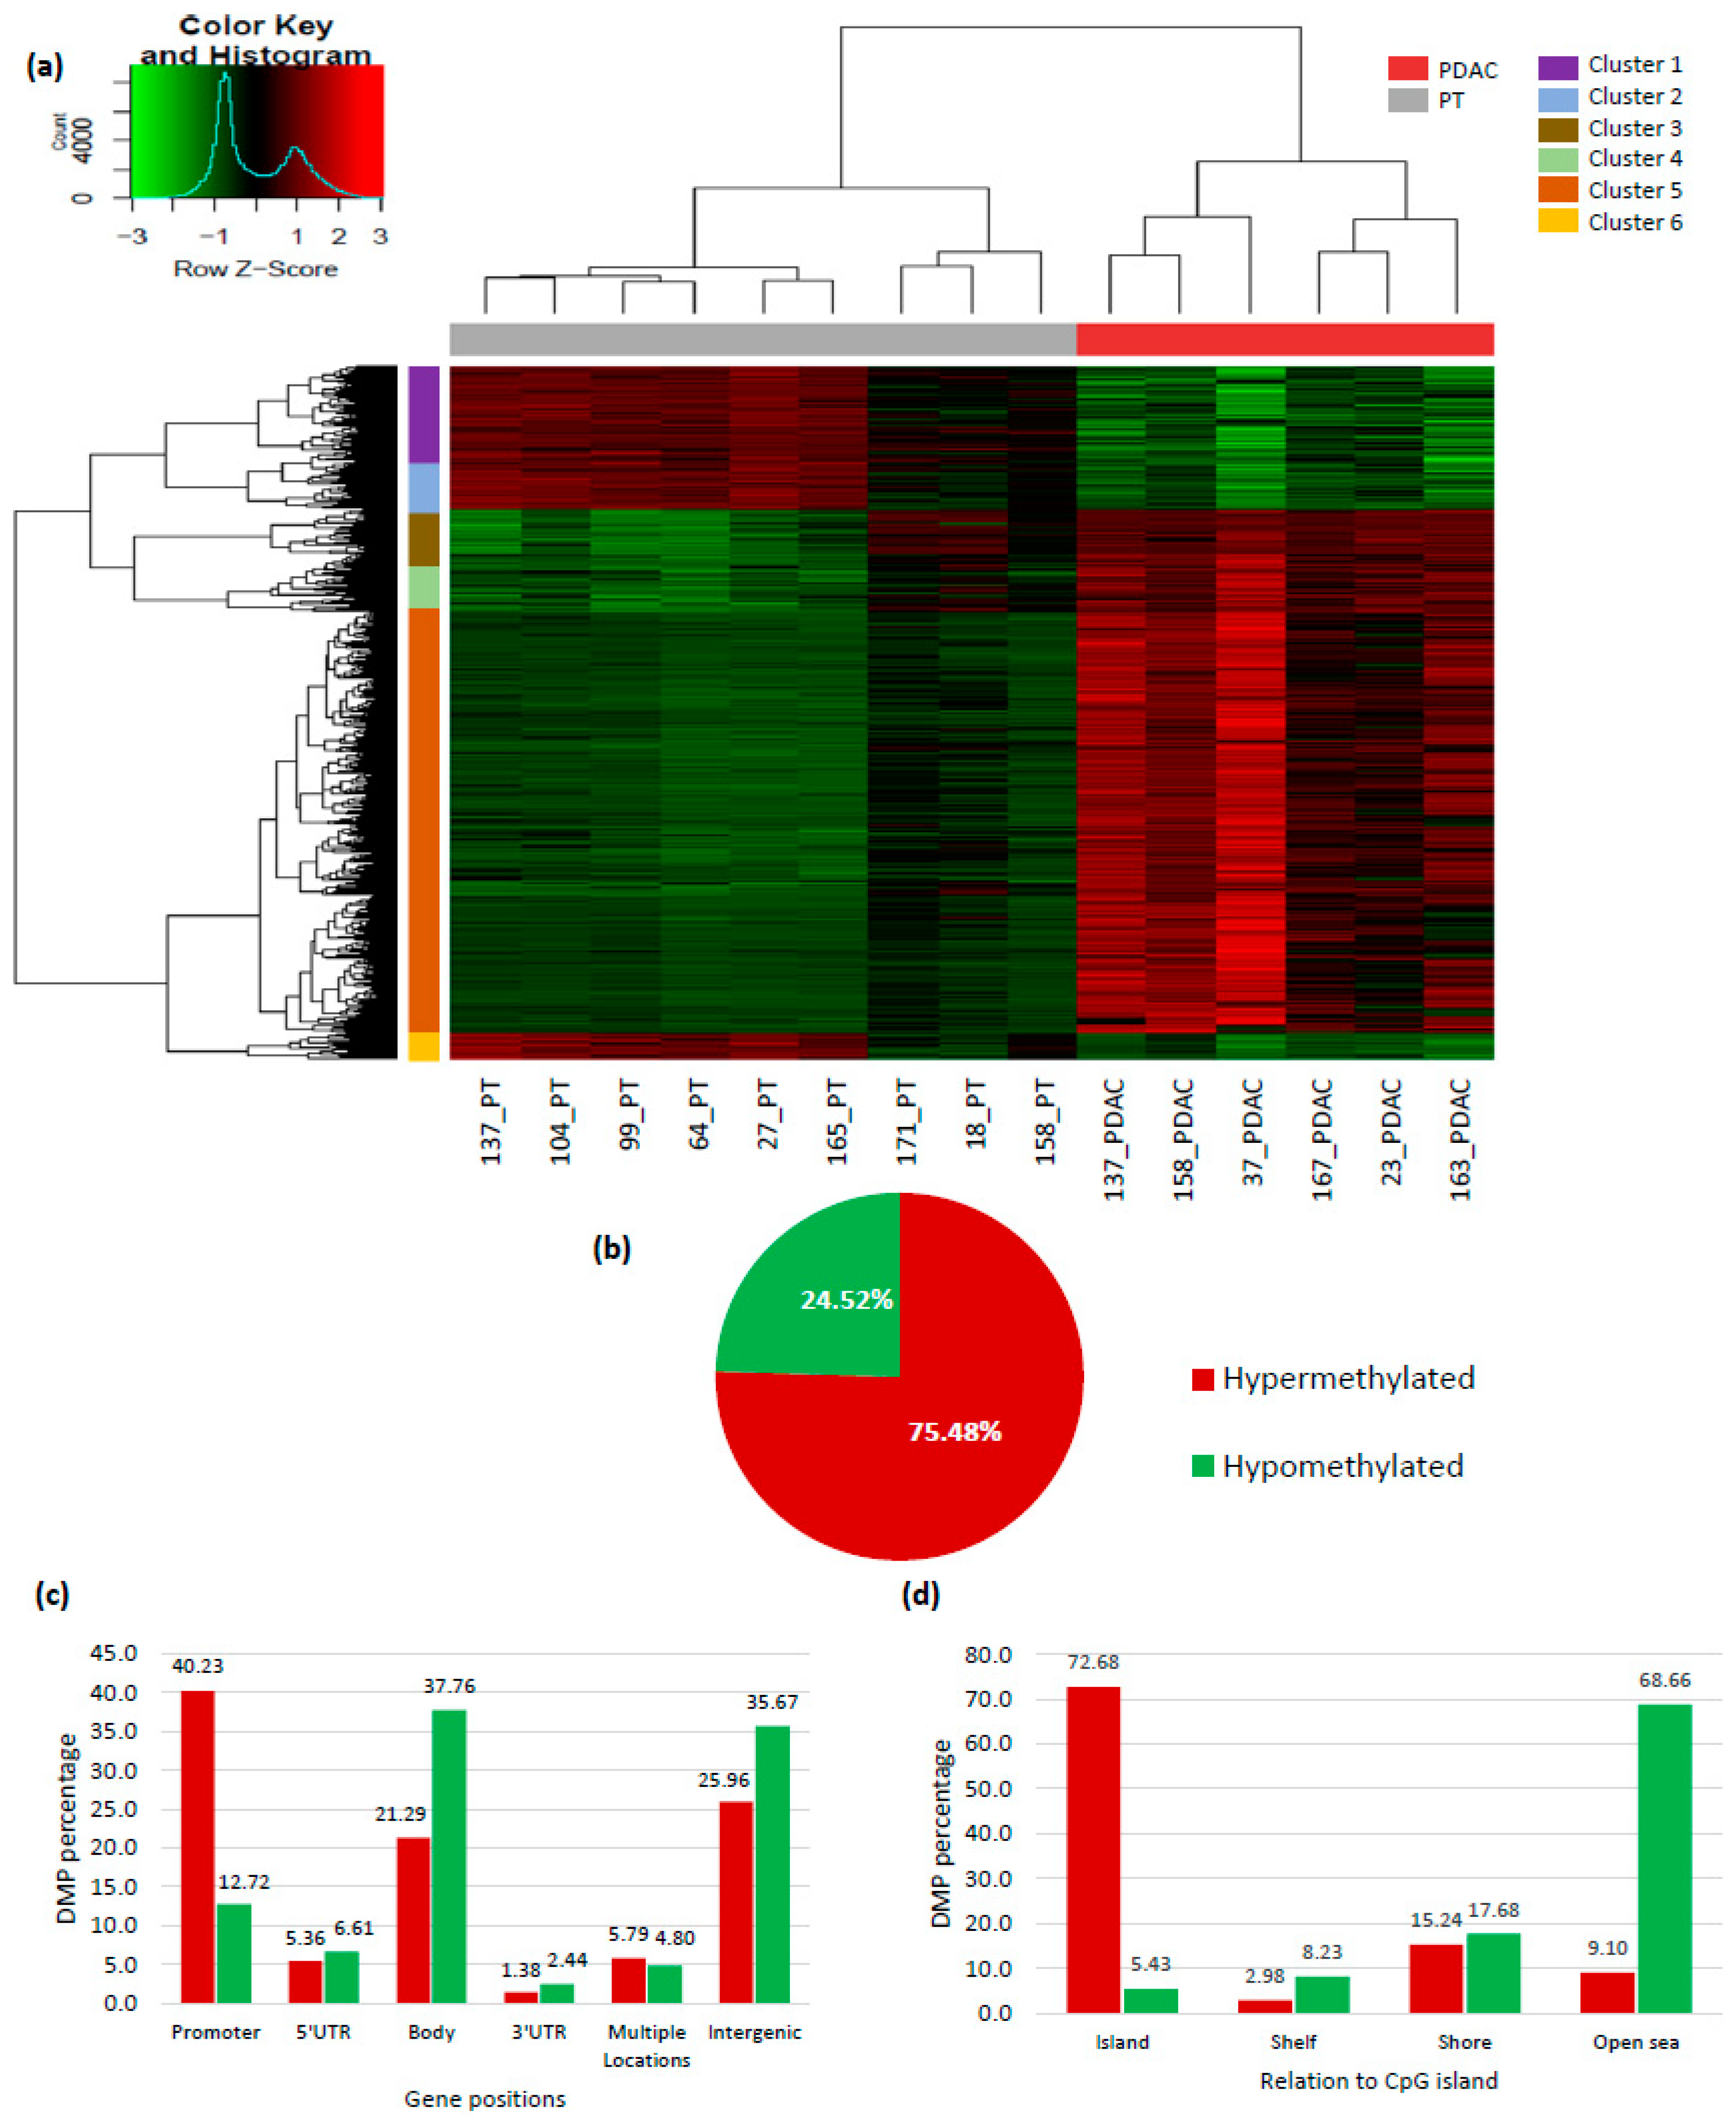
Abstract
:1. Introduction
2. Results
2.1. Genome-Wide DNA Methylation Profile in Pancreatic Adenocarcinoma
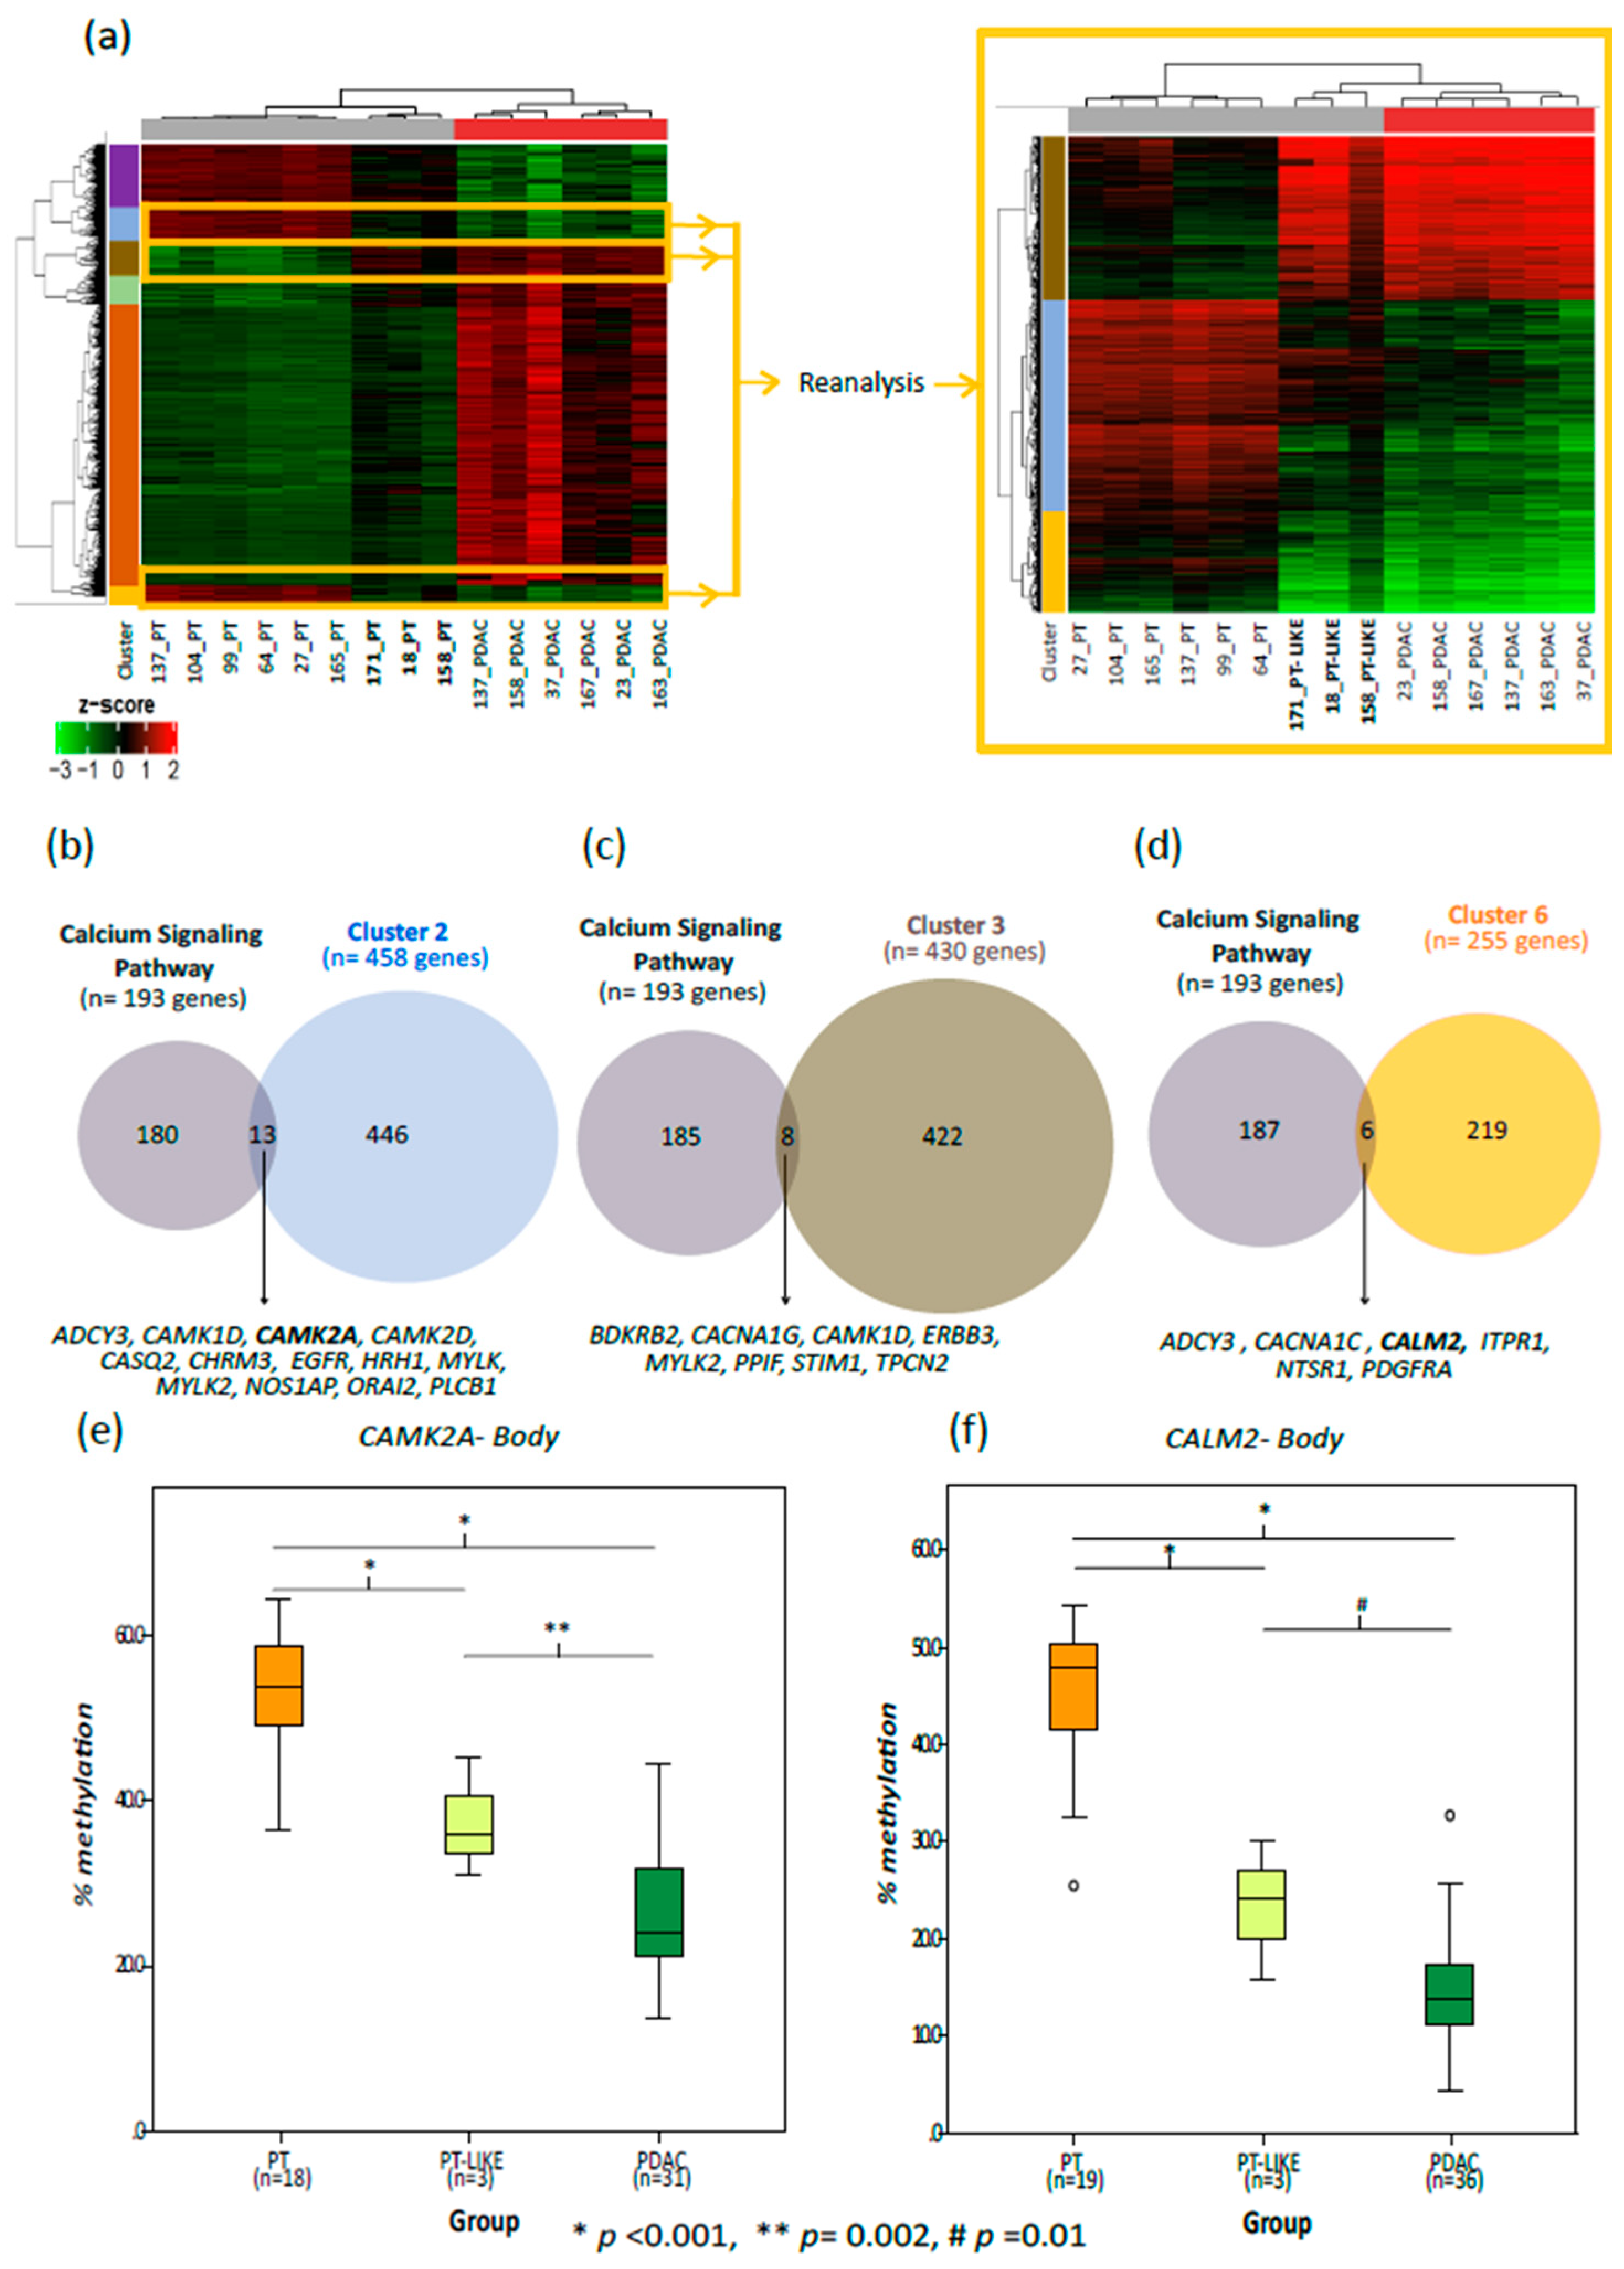
2.2. Ca2+ Pathway Genes Are Epigenetically Altered in PDAC
2.3. Validation Cohort
2.4. Correlation between Methylation and Expression of Ca2+ Pathway Genes
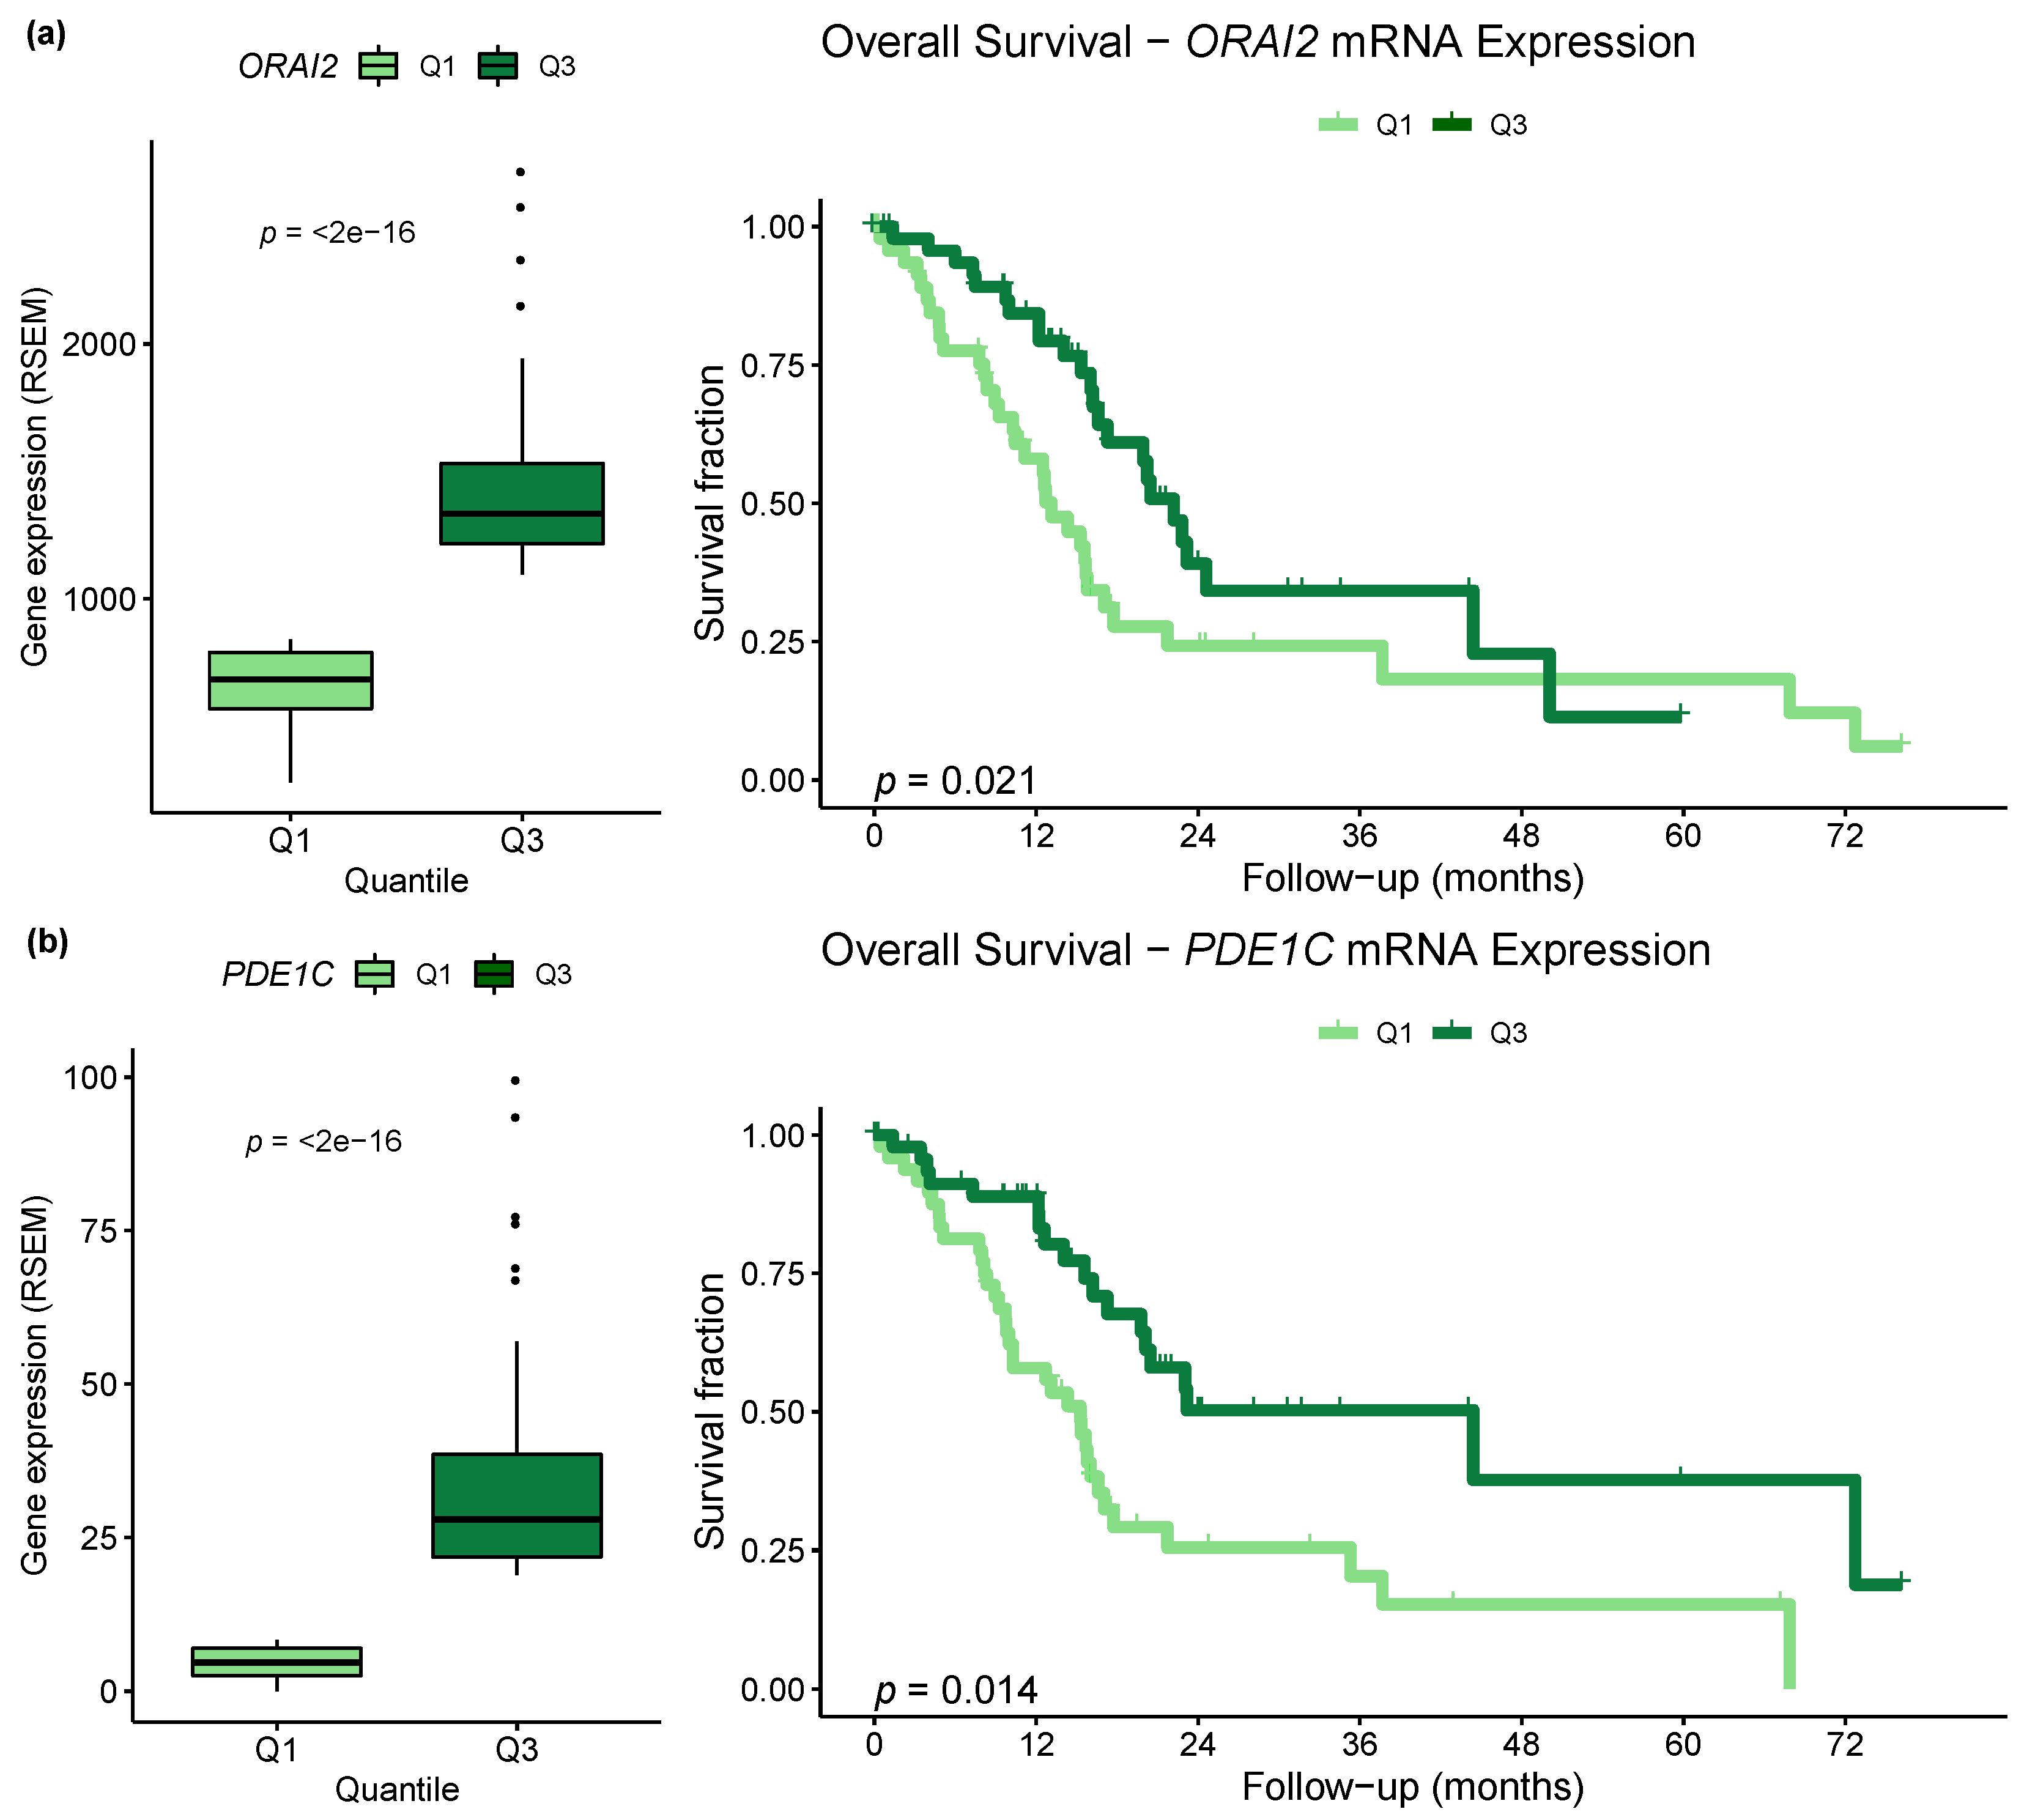
2.5. Differential Expression of Ca2+ Pathway Genes Is Potentially Associated with Survival
2.6. Aberrant Methylation in Ca2+ Genes Is an Early Change in Pancreatic Cancer
3. Discussion
4. Materials and Methods
4.1. Patients and Sample Collection
4.2. DNA Isolation and Bisulfite Conversion
4.3. Human Methylation 450 K Array and Data Preprocessing
4.4. Differential Methylation Analysis
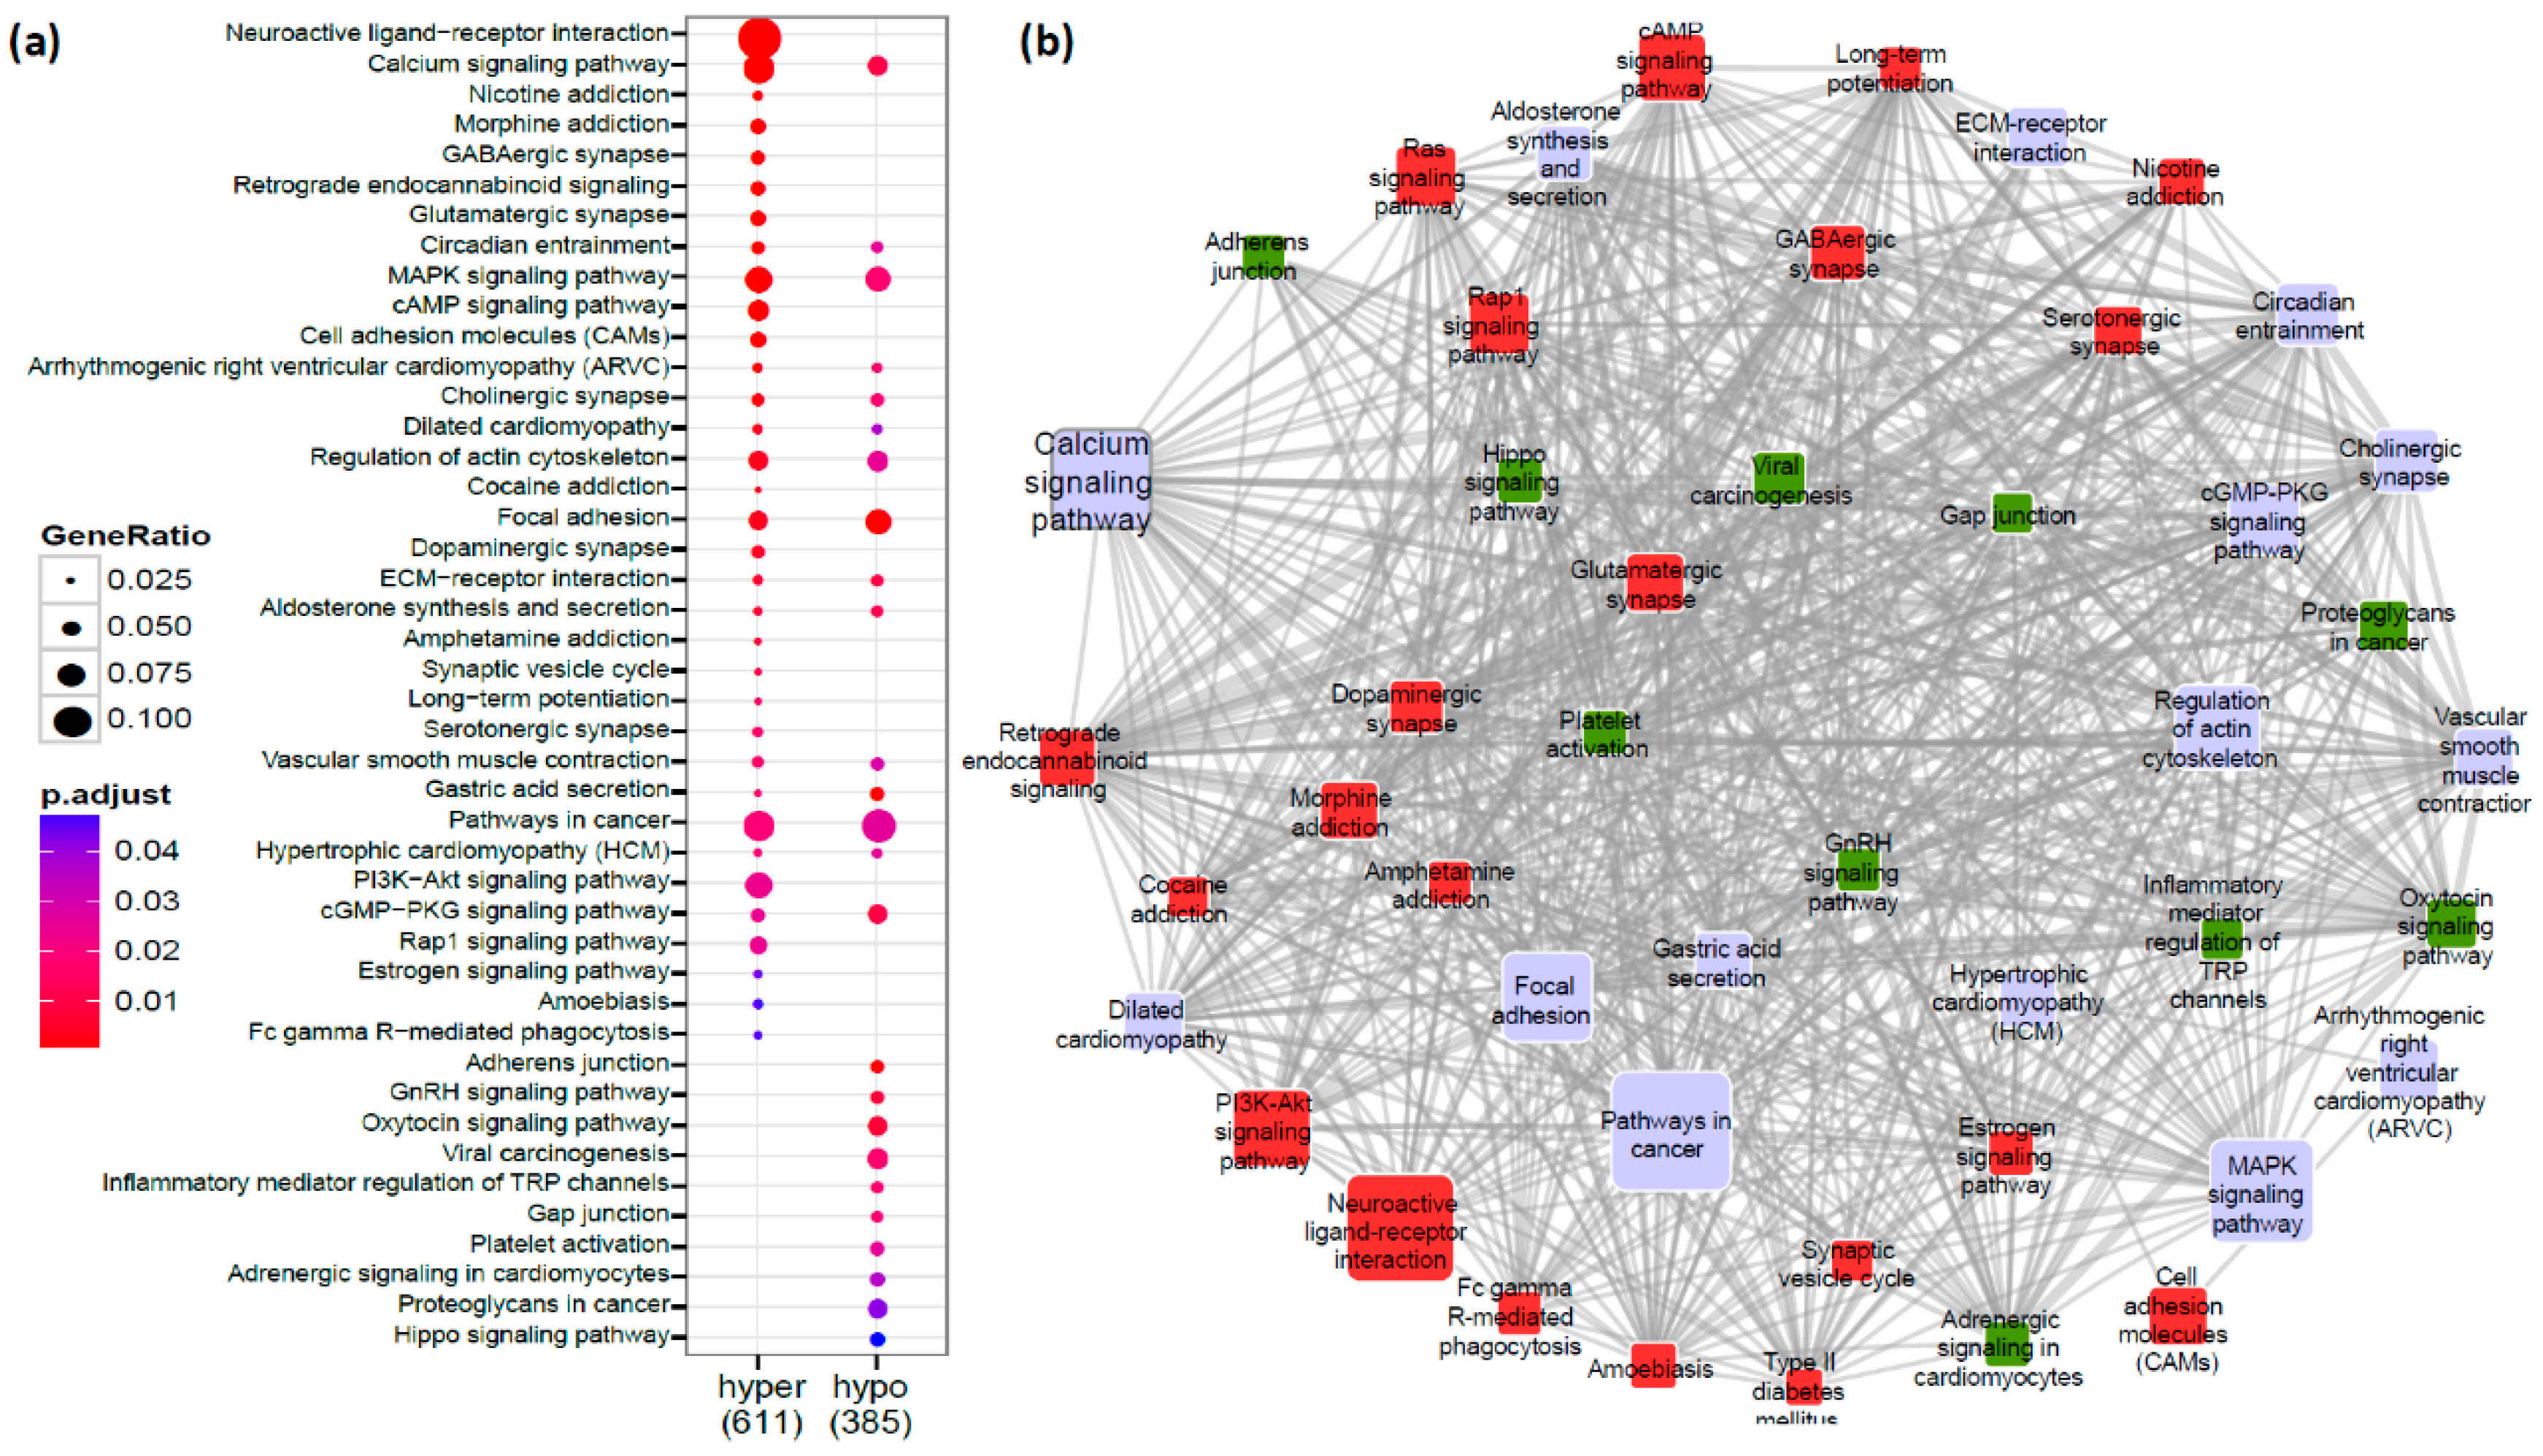
4.5. Functional Enrichment Analysis
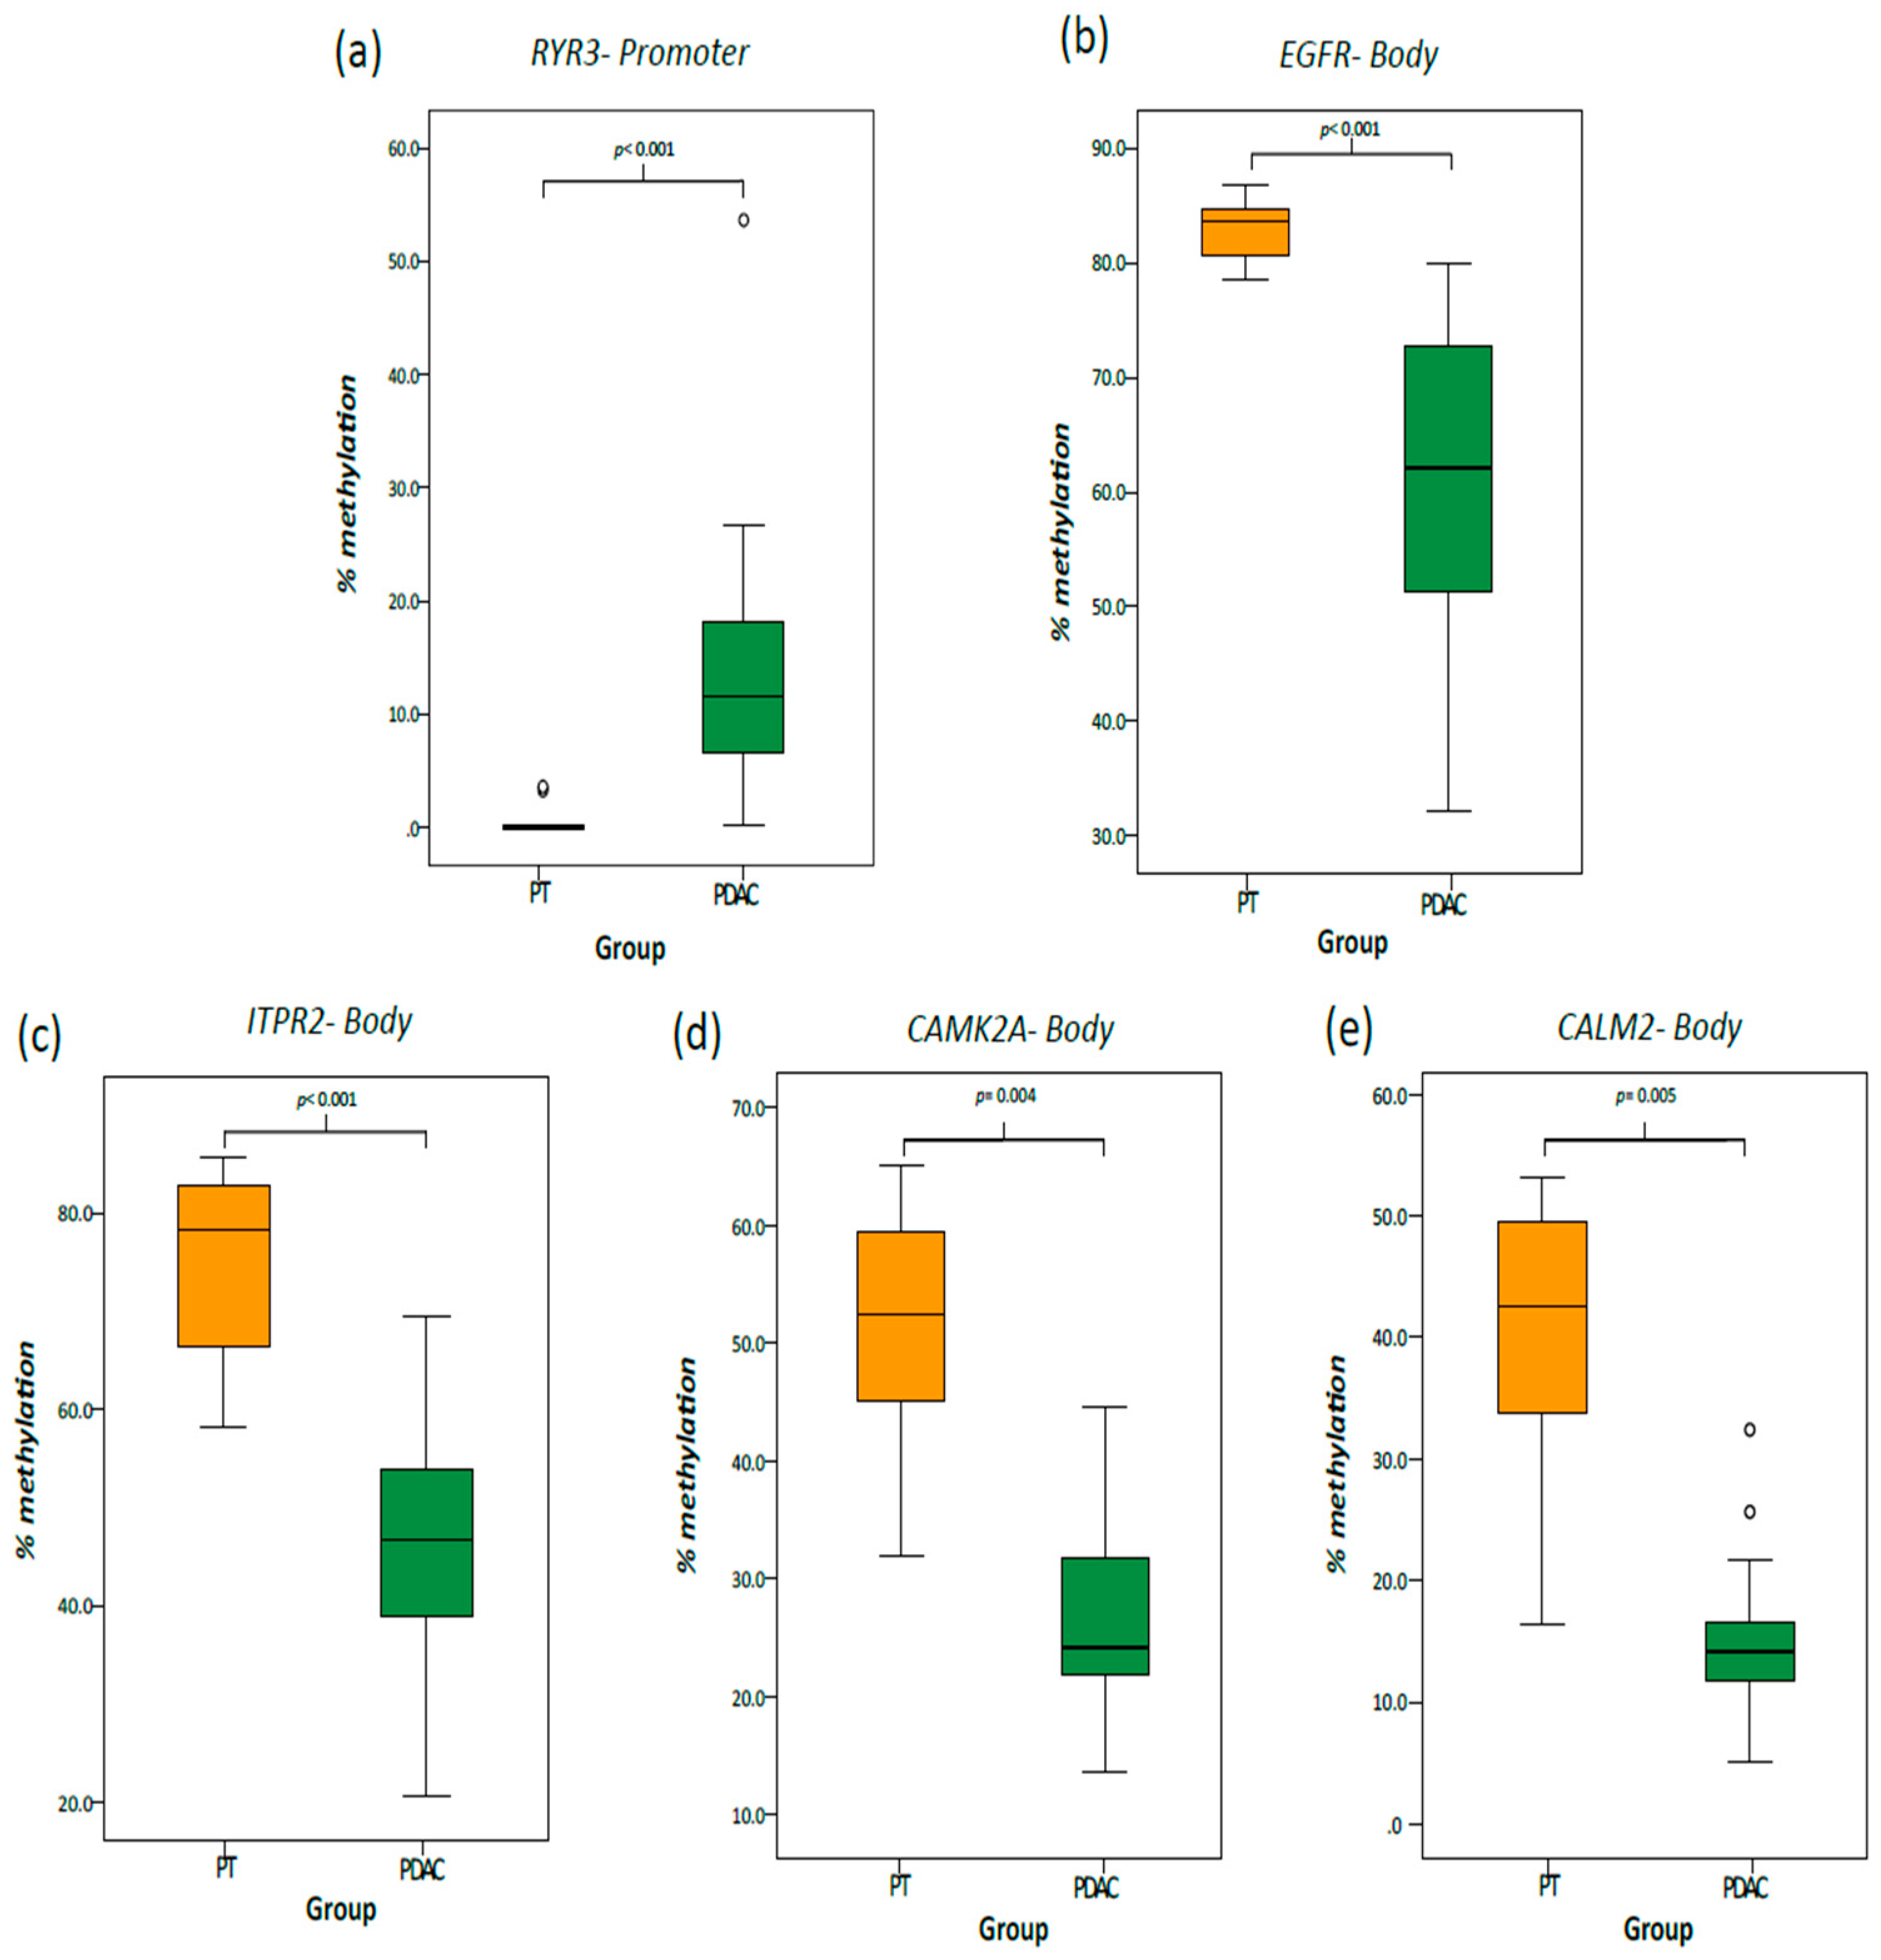
4.6. Technical and Biologic Validation
4.7. TCGA Analysis
5. Conclusions
Supplementary Materials
Author Contributions
Funding
Acknowledgments
Conflicts of Interest
Abbreviations
| ADCY8 | Adenylate Cyclase 8 |
| ADRA1A | Adrenoceptor Alpha 1A |
| AGTR1 | Angiotensin II Receptor Type 1 |
| ASICs | Acid-Sensing Ion Channels |
| Ca2+ | Calcium |
| CACNA1A | Calcium Voltage-Gated Channel Subunit Alpha1 A |
| CACNA1B | Calcium Voltage-Gated Channel Subunit Alpha1 B |
| CACNA1C | Calcium Voltage-Gated Channel Subunit Alpha1 C |
| CACNA1D | Calcium Voltage-Gated Channel Subunit Alpha1 D |
| CACNA1H | Calcium Voltage-Gated Channel Subunit Alpha1 H |
| CALM2 | Calmodulin 2 |
| CAMK2A | Calcium/Calmodulin Dependent Protein Kinase II Alpha |
| CAMKK1 | Calcium/Calmodulin Dependent Protein Kinase Kinase 1 |
| CASQ2 | Calsequestrin 2 |
| CDO1 | Cysteine Dioxygenase Type 1 |
| CRAC | Calcium Release-Activated Calcium Channels |
| DMPs | Differentially Methylated Probes |
| EGFR | Epidermal Growth Factor Receptor |
| ER | Endoplasmic Reticulum |
| FAK | Focal Adhesion Kinase |
| FDR | False Discovery Rate |
| FOXE1 | Forkhead Box E1 |
| GEO | Gene Expression Omnibus |
| GRIN2A | Glutamate Ionotropic Receptor NMDA Type Subunit 2A |
| HM450K | Human Methylation 450k |
| HR | Hazard Ratio |
| HRH1 | Histamine Receptor H1 |
| IP3 | Inositol-1,4,5-Trisphosphate |
| IP3Rs | Inositol 1,4,5-Trisphosphate Receptors |
| ITPKB | Inositol-Trisphosphate 3-Kinase B |
| ITPR1 | Inositol 1,4,5-Trisphosphate Receptor Type 1 |
| ITPR2 | Inositol 1,4,5-Trisphosphate Receptor Type 2 |
| KEGG | Kyoto Encyclopedia of Genes and Genomes |
| KRAS | KRAS Proto-Oncogene, GTPase |
| Mg2+ | Magnesium |
| NHE1 | Sodium/Proton Exchanger-1 |
| NPTX2 | Neuronal Pentraxin 2 |
| ORAI1 | ORAI Calcium Release-Activated Calcium Modulator 1 |
| ORAI2 | ORAI Calcium Release-Activated Calcium Modulator 2 |
| OS | Overall Survival |
| P2RX2 | Purinergic Receptor P2X 2 |
| PCDH10 | Protocadherin 10 |
| PDAC | Pancreatic Ductal Adenocarcinoma |
| PDE1C | Phosphodiesterase 1C |
| PENK | Proenkephalin |
| PLCB1 | Phospholipase C Beta 1 |
| PRKCB | Protein Kinase C Beta |
| PT | Pancreatic Non-Tumoral Tissue |
| PT-LIKE | Pancreatic Non-Tumoral-Like Tissue |
| RSEM | RNA-Seq by Expectation-Maximization |
| RYR2 | Ryanodine Receptor 2 |
| RYR3 | Ryanodine Receptor 3 |
| RyRs | Ryanodine Receptors |
| S1004A | S100 Calcium Binding Protein A4 |
| SERCA | Sarcoendoplasmic Reticulum Ca2+ ATPases |
| SFRP1 | Secreted Frizzled Related Protein 1 |
| SFRP2 | Secreted Frizzled Related Protein 2 |
| SLC8A3 | Solute Carrier Family 8 Member A3 |
| SOCE | Store Operated Calcium Entry |
| STIM | Stromal Interaction Molecule |
| STIM | Stromal Interaction Molecule 1 |
| TCGA | Cancer Genome Atlas |
| TFPI2 | Tissue Factor Pathway Inhibitor 2 |
| TNM | TNM Classification of Malignant Tumors |
| TRPCs | Transient Receptor Potential Channels |
| TRPVs | Transient Receptor Potential Vanilloid Channels |
| TSGs | Tumor Suppressor Genes |
| UTR | Untranslated Region |
References
- Collisson, E.A.; Maitra, A. Pancreatic Cancer Genomics 2.0: Profiling Metastases. Cancer Cell 2017, 31, 309–310. [Google Scholar] [CrossRef] [Green Version]
- Siegel, R.L.; Miller, K.D.; Jemal, A. Cancer statistics, 2018. CA Cancer J. Clin. 2018, 68, 7–30. [Google Scholar] [CrossRef] [PubMed]
- Chakraborty, S.; Baine, M.J.; Sasson, A.R.; Batra, S.K. Current status of molecular markers for early detection of sporadic pancreatic cancer. Biochim. Biophys. Acta 2011, 1815, 44–64. [Google Scholar] [CrossRef] [Green Version]
- Rahib, L.; Smith, B.D.; Aizenberg, R.; Rosenzweig, A.B.; Fleshman, J.M.; Matrisian, L.M. Projecting cancer incidence and deaths to 2030: The unexpected burden of thyroid, liver, and pancreas cancers in the United States. Cancer Res. 2014, 74, 2913–2921. [Google Scholar] [CrossRef] [PubMed] [Green Version]
- Kleeff, J.; Korc, M.; Apte, M.; La Vecchia, C.; Johnson, C.D.; Biankin, A.V.; Neale, R.E.; Tempero, M.; Tuveson, D.A.; Hruban, R.H.; et al. Pancreatic cancer. Nat. Rev. Dis Prim. 2016, 2, 16022. [Google Scholar] [CrossRef] [PubMed]
- Orth, M.; Metzger, P.; Gerum, S.; Mayerle, J.; Schneider, G.; Belka, C.; Schnurr, M.; Lauber, K. Pancreatic ductal adenocarcinoma: Biological hallmarks, current status, and future perspectives of combined modality treatment approaches. Radiat. Oncol. 2019, 14, 141. [Google Scholar] [CrossRef]
- Ehrlich, M. DNA hypomethylation in cancer cells. Epigenomics 2009, 1, 239–259. [Google Scholar] [CrossRef] [Green Version]
- Wang, X.-X.; Xiao, F.-H.; Li, Q.-G.; Liu, J.; He, Y.-H.; Kong, Q.-P. Large-scale DNA methylation expression analysis across 12 solid cancers reveals hypermethylation in the calcium-signaling pathway. Oncotarget 2017, 8, 11868–11876. [Google Scholar] [CrossRef]
- Ahuja, N.; Sharma, A.R.; Baylin, S.B. Epigenetic Therapeutics: A New Weapon in the War Against Cancer. Annu. Rev. Med. 2016, 67, 73–89. [Google Scholar] [CrossRef] [Green Version]
- Nones, K.; Waddell, N.; Song, S.; Patch, A.-M.; Miller, D.; Johns, A.; Wu, J.; Kassahn, K.S.; Wood, D.; Bailey, P.; et al. Genome-wide DNA methylation patterns in pancreatic ductal adenocarcinoma reveal epigenetic deregulation of SLIT-ROBO, ITGA2 and MET signaling. Int. J. cancer 2014, 135, 1110–1118. [Google Scholar] [CrossRef] [Green Version]
- Mishra, N.K.; Guda, C. Genome-wide DNA methylation analysis reveals molecular subtypes of pancreatic cancer. Oncotarget 2017, 8, 28990–29012. [Google Scholar] [CrossRef] [PubMed] [Green Version]
- Boutros, T.; Chevet, E.; Metrakos, P. Mitogen-activated protein (MAP) kinase/MAP kinase phosphatase regulation: Roles in cell growth, death, and cancer. Pharmacol. Rev. 2008, 60, 261–310. [Google Scholar] [CrossRef] [PubMed]
- Maziveyi, M.; Alahari, S.K. Cell matrix adhesions in cancer: The proteins that form the glue. Oncotarget 2017, 8, 48471–48487. [Google Scholar] [CrossRef] [PubMed] [Green Version]
- Xu, M.; Seas, A.; Kiyani, M.; Ji, K.S.Y.; Bell, H.N. A temporal examination of calcium signaling in cancer- from tumorigenesis, to immune evasion, and metastasis. Cell Biosci. 2018, 8, 25. [Google Scholar] [CrossRef] [Green Version]
- Network, C.G.A.R. Integrated Genomic Characterization of Pancreatic Ductal Adenocarcinoma. Cancer Cell 2017, 32, 185.e13–203.e13. [Google Scholar]
- Curtius, K.; Wright, N.A.; Graham, T.A. An evolutionary perspective on field cancerization. Nat. Rev. Cancer 2018, 18, 19–32. [Google Scholar] [CrossRef]
- Baylin, S.B.; Jones, P.A. A decade of exploring the cancer epigenome-biological and translational implications. Nat. Rev. Cancer 2011, 11, 726–734. [Google Scholar] [CrossRef]
- Yamashita, K.; Hosoda, K.; Nishizawa, N.; Katoh, H.; Watanabe, M. Epigenetic biomarkers of promoter DNA methylation in the new era of cancer treatment. Cancer Sci. 2018, 109, 3695–3706. [Google Scholar] [CrossRef]
- Nishizawa, N.; Harada, H.; Kumamoto, Y.; Kaizu, T.; Katoh, H.; Tajima, H.; Ushiku, H.; Yokoi, K.; Igarashi, K.; Fujiyama, Y.; et al. Diagnostic potential of hypermethylation of the cysteine dioxygenase 1 gene (CDO1) promoter DNA in pancreatic cancer. Cancer Sci. 2019. [Google Scholar] [CrossRef] [Green Version]
- Kinugawa, Y.; Uehara, T.; Sano, K.; Matsuda, K.; Maruyama, Y.; Kobayashi, Y.; Nakajima, T.; Hamano, H.; Kawa, S.; Higuchi, K.; et al. Methylation of Tumor Suppressor Genes in Autoimmune Pancreatitis. Pancreas 2017, 46, 614–618. [Google Scholar] [CrossRef]
- Matsubayashi, H.; Canto, M.; Sato, N.; Klein, A.; Abe, T.; Yamashita, K.; Yeo, C.J.; Kalloo, A.; Hruban, R.; Goggins, M. DNA methylation alterations in the pancreatic juice of patients with suspected pancreatic disease. Cancer Res. 2006, 66, 1208–1217. [Google Scholar] [CrossRef] [PubMed] [Green Version]
- Yang, L.; Yang, H.; Li, J.; Hao, J.; Qian, J. ppENK Gene Methylation Status in the Development of Pancreatic Carcinoma. Gastroenterol. Res. Pr. 2013, 2013, 130927. [Google Scholar]
- Brune, K.; Hong, S.M.; Li, A.; Yachida, S.; Abe, T.; Griffith, M.; Yang, D.; Omura, N.; Eshleman, J.; Canto, M.; et al. Genetic and epigenetic alterations of familial pancreatic cancers. Cancer Epidemiol. Biomarkers Prev. 2008, 17, 3536–3542. [Google Scholar] [CrossRef] [PubMed] [Green Version]
- Sato, N.; Fukushima, N.; Maitra, A.; Matsubayashi, H.; Yeo, C.J.; Cameron, J.L.; Hruban, R.H.; Goggins, M. Discovery of novel targets for aberrant methylation in pancreatic carcinoma using high-throughput microarrays. Cancer Res. 2003, 63, 3735–3742. [Google Scholar]
- Berridge, M.J.; Lipp, P.; Bootman, M.D. The versatility and universality of calcium signalling. Nat. Rev. Mol. Cell Biol. 2000, 1, 11–21. [Google Scholar] [CrossRef]
- Li, H.; Liu, J.-W.; Liu, S.; Yuan, Y.; Sun, L.-P. Bioinformatics-Based Identification of Methylated-Differentially Expressed Genes and Related Pathways in Gastric Cancer. Dig. Dis. Sci. 2017, 62, 3029–3039. [Google Scholar] [CrossRef]
- Pedriali, G.; Rimessi, A.; Sbano, L.; Giorgi, C.; Wieckowski, M.R.; Previati, M.; Pinton, P. Regulation of Endoplasmic Reticulum-Mitochondria Ca. Front. Oncol. 2017, 7, 180. [Google Scholar] [CrossRef] [Green Version]
- Bootman, M.D. Calcium signaling. Cold Spring Harb. Perspect Biol. 2012, 4, a011171. [Google Scholar] [CrossRef] [Green Version]
- Eichberg, J.; Zhu, M.X. Calcium Entry Channels in Non-Excitable Cells, 1st ed.; Kozak, J.A., Putney, J.W.J., Eds.; CRC Press: Boca Raton, FL, USA, 2018; ISBN 9781315152592. [Google Scholar]
- Feber, A.; Clark, J.; Goodwin, G.; Dodson, A.R.; Smith, P.H.; Fletcher, A.; Edwards, S.; Flohr, P.; Falconer, A.; Roe, T.; et al. Amplification and overexpression of E2F3 in human bladder cancer. Oncogene 2004, 23, 1627–1630. [Google Scholar] [CrossRef] [Green Version]
- Holcomb, I.N.; Young, J.M.; Coleman, I.M.; Salari, K.; Grove, D.I.; Hsu, L.; True, L.D.; Roudier, M.P.; Morrissey, C.M.; Higano, C.S.; et al. Comparative analyses of chromosome alterations in soft-tissue metastases within and across patients with castration-resistant prostate cancer. Cancer Res. 2009, 69, 7793–7802. [Google Scholar] [CrossRef] [Green Version]
- Monteith, G.R.; Davis, F.M.; Roberts-Thomson, S.J. Calcium channels and pumps in cancer: Changes and consequences. J. Biol. Chem. 2012, 287, 31666–31673. [Google Scholar] [CrossRef] [PubMed] [Green Version]
- Monteith, G.R.; McAndrew, D.; Faddy, H.M.; Roberts-Thomson, S.J. Calcium and cancer: Targeting Ca2+ transport. Nat. Rev. Cancer 2007, 7, 519–530. [Google Scholar] [CrossRef]
- Ibrahim, S.; Dakik, H.; Vandier, C.; Chautard, R.; Paintaud, G.; Mazurier, F.; Lecomte, T.; Guéguinou, M.; Raoul, W. Expression Profiling of Calcium Channels and Calcium-Activated Potassium Channels in Colorectal Cancer. Cancers (Basel) 2019, 11, 561. [Google Scholar] [CrossRef] [Green Version]
- McAndrew, D.; Grice, D.M.; Peters, A.A.; Davis, F.M.; Stewart, T.; Rice, M.; Smart, C.E.; Brown, M.A.; Kenny, P.A.; Roberts-Thomson, S.J.; et al. ORAI1-mediated calcium influx in lactation and in breast cancer. Mol. Cancer Ther. 2011, 10, 448–460. [Google Scholar] [CrossRef] [PubMed] [Green Version]
- Crottès, D.; Lin, Y.T.; Peters, C.J.; Gilchrist, J.M.; Wiita, A.P.; Jan, Y.N.; Jan, L.Y. TMEM16A controls EGF-induced calcium signaling implicated in pancreatic cancer prognosis. Proc. Natl. Acad. Sci. USA 2019, 116, 13026–13035. [Google Scholar] [CrossRef] [PubMed] [Green Version]
- Chen, Y.F.; Chen, Y.T.; Chiu, W.T.; Shen, M.R. Remodeling of calcium signaling in tumor progression. J. Biomed. Sci. 2013, 20, 23. [Google Scholar] [CrossRef] [PubMed] [Green Version]
- Raynal, N.J.; Lee, J.T.; Wang, Y.; Beaudry, A.; Madireddi, P.; Garriga, J.; Malouf, G.G.; Dumont, S.; Dettman, E.J.; Gharibyan, V.; et al. Targeting Calcium Signaling Induces Epigenetic Reactivation of Tumor Suppressor Genes in Cancer. Cancer Res. 2016, 76, 1494–1505. [Google Scholar] [CrossRef] [PubMed] [Green Version]
- Deliot, N.; Constantin, B. Plasma membrane calcium channels in cancer: Alterations and consequences for cell proliferation and migration. Biochim. Biophys. Acta 2015, 1848, 2512–2522. [Google Scholar] [CrossRef] [Green Version]
- Roberts-Thomson, S.J.; Chalmers, S.B.; Monteith, G.R. The Calcium-Signaling Toolkit in Cancer: Remodeling and Targeting. Cold Spring Harb. Perspect. Biol. 2019, 11. [Google Scholar] [CrossRef] [Green Version]
- Boye, K.; Maelandsmo, G.M. S100A4 and metastasis: A small actor playing many roles. Am. J. Pathol. 2010, 176, 528–535. [Google Scholar] [CrossRef]
- Rosty, C.; Ueki, T.; Argani, P.; Jansen, M.; Yeo, C.J.; Cameron, J.L.; Hruban, R.H.; Goggins, M. Overexpression of S100A4 in pancreatic ductal adenocarcinomas is associated with poor differentiation and DNA hypomethylation. Am. J. Pathol. 2002, 160, 45–50. [Google Scholar] [CrossRef] [Green Version]
- Qiu, C.; Bu, X.; Jiang, Z. Protocadherin-10 acts as a tumor suppressor gene, and is frequently downregulated by promoter methylation in pancreatic cancer cells. Oncol. Rep. 2016, 36, 383–389. [Google Scholar] [CrossRef] [Green Version]
- Curia, M.C.; Fantini, F.; Lattanzio, R.; Tavano, F.; Di Mola, F.; Piantelli, M.; Battista, P.; Di Sebastiano, P.; Cama, A. High methylation levels of PCDH10 predict poor prognosis in patients with pancreatic ductal adenocarcinoma. BMC Cancer 2019, 19, 452. [Google Scholar] [CrossRef]
- Nguyen, N.T.; Han, W.; Cao, W.-M.; Wang, Y.; Wen, S.; Huang, Y.; Li, M.; Du, L.; Zhou, Y. Store-Operated Calcium Entry Mediated by ORAI and STIM. Compr. Physiol. 2018, 8, 981–1002. [Google Scholar] [PubMed]
- Kondratska, K.; Kondratskyi, A.; Yassine, M.; Lemonnier, L.; Lepage, G.; Morabito, A.; Skryma, R.; Prevarskaya, N. Orai1 and STIM1 mediate SOCE and contribute to apoptotic resistance of pancreatic adenocarcinoma. Biochim. Biophys. Acta 2014, 1843, 2263–2269. [Google Scholar] [CrossRef] [PubMed] [Green Version]
- Khan, H.Y.; Mpilla, G.B.; Sexton, R.; Viswanadha, S.; Penmetsa, K.V.; Aboukameel, A.; Diab, M.; Kamgar, M.; Al-Hallak, M.N.; Szlaczky, M.; et al. Calcium Release-Activated Calcium (CRAC) Channel Inhibition Suppresses Pancreatic Ductal Adenocarcinoma Cell Proliferation and Patient-Derived Tumor Growth. Cancers (Basel) 2020, 12, 750. [Google Scholar] [CrossRef] [PubMed] [Green Version]
- Roderick, H.L.; Cook, S.J. Ca2+ signalling checkpoints in cancer: Remodelling Ca2+ for cancer cell proliferation and survival. Nat. Rev. Cancer 2008, 8, 361–375. [Google Scholar] [CrossRef] [Green Version]
- Yarden, Y. The EGFR family and its ligands in human cancer. signalling mechanisms and therapeutic opportunities. Eur. J. Cancer 2001, 37 (Suppl. S4), S3–S8. [Google Scholar] [CrossRef]
- Cui, C.; Merritt, R.; Fu, L.; Pan, Z. Targeting calcium signaling in cancer therapy. Acta Pharm. Sin. B 2017, 7, 3–17. [Google Scholar] [CrossRef]
- Navas, C.; Hernández-Porras, I.; Schuhmacher, A.J.; Sibilia, M.; Guerra, C.; Barbacid, M. EGF receptor signaling is essential for k-ras oncogene-driven pancreatic ductal adenocarcinoma. Cancer Cell 2012, 22, 318–330. [Google Scholar] [CrossRef] [Green Version]
- Balsano, R.; Tommasi, C.; Garajova, I. State of the Art for Metastatic Pancreatic Cancer Treatment: Where Are We Now? Anticancer Res. 2019, 39, 3405–3412. [Google Scholar] [CrossRef] [PubMed]
- Shi, J.L.; Fu, L.; Wang, W.D. High expression of inositol 1,4,5-trisphosphate receptor, type 2 (ITPR2) as a novel biomarker for worse prognosis in cytogenetically normal acute myeloid leukemia. Oncotarget 2015, 6, 5299–5309. [Google Scholar] [CrossRef] [PubMed] [Green Version]
- Prior, I.A.; Lewis, P.D.; Mattos, C. A comprehensive survey of Ras mutations in cancer. Cancer Res. 2012, 72, 2457–2467. [Google Scholar] [CrossRef] [PubMed] [Green Version]
- Schaal, C.; Padmanabhan, J.; Chellappan, S. The Role of nAChR and Calcium Signaling in Pancreatic Cancer Initiation and Progression. Cancers (Basel) 2015, 7, 1447–1471. [Google Scholar] [CrossRef]
- Lanner, J.T.; Georgiou, D.K.; Joshi, A.D.; Hamilton, S.L. Ryanodine receptors: Structure, expression, molecular details, and function in calcium release. Cold Spring Harb. Perspect Biol. 2010, 2, a003996. [Google Scholar] [CrossRef] [Green Version]
- Brzozowski, J.S.; Skelding, K.A. The Multi-Functional Calcium/Calmodulin Stimulated Protein Kinase (CaMK) Family: Emerging Targets for Anti-Cancer Therapeutic Intervention. Pharmaceuticals 2019, 12, 8. [Google Scholar] [CrossRef] [Green Version]
- Wang, Y.Y.; Zhao, R.; Zhe, H. The emerging role of CaMKII in cancer. Oncotarget 2015, 6, 11725–11734. [Google Scholar] [CrossRef] [Green Version]
- Tai, Y.L.; Chen, L.C.; Shen, T.L. Emerging roles of focal adhesion kinase in cancer. Biomed. Res. Int. 2015, 2015, 690690. [Google Scholar] [CrossRef]
- Chen, W.; An, P.; Quan, X.-J.; Zhang, J.; Zhou, Z.-Y.; Zou, L.-P.; Luo, H.-S. Ca(2+)/calmodulin-dependent protein kinase II regulates colon cancer proliferation and migration via ERK1/2 and p38 pathways. World J. Gastroenterol. 2017, 23, 6111–6118. [Google Scholar] [CrossRef]
- Bouchard, V.; Demers, M.J.; Thibodeau, S.; Laquerre, V.; Fujita, N.; Tsuruo, T.; Beaulieu, J.F.; Gauthier, R.; Vézina, A.; Villeneuve, L.; et al. Fak/Src signaling in human intestinal epithelial cell survival and anoikis: Differentiation state-specific uncoupling with the PI3-K/Akt-1 and MEK/Erk pathways. J. Cell Physiol. 2007, 212, 717–728. [Google Scholar] [CrossRef]
- Ma, X.; Cai, Y.; He, D.; Zou, C.; Zhang, P.; Lo, C.Y.; Xu, Z.; Chan, F.L.; Yu, S.; Chen, Y.; et al. Transient receptor potential channel TRPC5 is essential for P-glycoprotein induction in drug-resistant cancer cells. Proc. Natl. Acad. Sci. USA 2012, 109, 16282–16287. [Google Scholar] [CrossRef] [PubMed] [Green Version]
- Zhang, S.; Miao, Y.; Zheng, X.; Gong, Y.; Zhang, J.; Zou, F.; Cai, C. STIM1 and STIM2 differently regulate endogenous Ca(2+) entry and promote TGF-β-induced EMT in breast cancer cells. Biochem. Biophys. Res. Commun. 2017, 488, 74–80. [Google Scholar] [CrossRef] [PubMed]
- Zhu, S.; Zhou, H.-Y.; Deng, S.-C.; Deng, S.-J.; He, C.; Li, X.; Chen, J.-Y.; Jin, Y.; Hu, Z.-L.; Wang, F.; et al. ASIC1 and ASIC3 contribute to acidity-induced EMT of pancreatic cancer through activating Ca(2+)/RhoA pathway. Cell Death Dis. 2017, 8, e2806. [Google Scholar] [CrossRef] [PubMed]
- Bhattacharya, A.; Kumar, J.; Hermanson, K.; Sun, Y.; Qureshi, H.; Perley, D.; Scheidegger, A.; Singh, B.B.; Dhasarathy, A. The calcium channel proteins ORAI3 and STIM1 mediate TGF-β induced Snai1 expression. Oncotarget 2018, 9, 29468–29483. [Google Scholar] [CrossRef] [Green Version]
- Porcelli, L.; Iacobazzi, R.M.; Di Fonte, R.; Serratì, S.; Intini, A.; Solimando, A.G.; Brunetti, O.; Calabrese, A.; Leonetti, F.; Azzariti, A.; et al. CAFs and TGF-β Signaling Activation by Mast Cells Contribute to Resistance to Gemcitabine/Nabpaclitaxel in Pancreatic Cancer. Cancers (Basel) 2019, 11, 330. [Google Scholar] [CrossRef] [Green Version]
- Köster, S.; Pavkov-Keller, T.; Kühlbrandt, W.; Yildiz, Ö. Structure of human Na+/H+ exchanger NHE1 regulatory region in complex with calmodulin and Ca2+. J. Biol. Chem. 2011, 286, 40954–40961. [Google Scholar] [CrossRef] [PubMed] [Green Version]
- Argentiero, A.; De Summa, S.; Di Fonte, R.; Iacobazzi, M.R.; Porcelli, L.; Da Vià, M.; Brunetti, O.; Azzariti, A.; Silvestris, N.; Solimando, G.A. Gene Expression Comparison between the Lymph Node-Positive and -Negative Reveals a Peculiar Immune Microenvironment Signature and a Theranostic Role for WNT Targeting in Pancreatic Ductal Adenocarcinoma: A Pilot Study. Cancers 2019, 11, 942. [Google Scholar] [CrossRef] [PubMed] [Green Version]
- Martinez-Bosch, N.; Vinaixa, J.; Navarro, P. Immune Evasion in Pancreatic Cancer: From Mechanisms to Therapy. Cancers 2018, 10, 6. [Google Scholar] [CrossRef] [Green Version]
- Anderson, K.G.; Stromnes, I.M.; Greenberg, P.D. Obstacles Posed by the Tumor Microenvironment to T cell Activity: A Case for Synergistic Therapies. Cancer Cell 2017, 31, 311–325. [Google Scholar] [CrossRef] [Green Version]
- Zhang, Q.; Lou, Y.; Zhang, J.; Fu, Q.; Wei, T.; Sun, X.; Chen, Q.; Yang, J.; Bai, X.; Liang, T. Hypoxia-inducible factor-2α promotes tumor progression and has crosstalk with Wnt/β-catenin signaling in pancreatic cancer. Mol. Cancer 2017, 16, 119. [Google Scholar] [CrossRef] [Green Version]
- Camuzi, D.; de Amorim, Í.S.S.; Ribeiro Pinto, L.F.; Oliveira Trivilin, L.; Mencalha, A.L.; Soares Lima, S.C. Regulation Is in the Air: The Relationship between Hypoxia and Epigenetics in Cancer. Cells 2019, 8, 300. [Google Scholar] [CrossRef] [PubMed] [Green Version]
- Maftouh, M.; Belo, A.I.; Avan, A.; Funel, N.; Peters, G.J.; Giovannetti, E.; Van Die, I. Galectin-4 expression is associated with reduced lymph node metastasis and modulation of Wnt/β-catenin signalling in pancreatic adenocarcinoma. Oncotarget 2014, 5, 5335–5349. [Google Scholar] [CrossRef] [PubMed] [Green Version]
- De, A. Wnt/Ca2+ signaling pathway: A brief overview. Acta Biochim. Biophys. Sin. (Shanghai) 2011, 43, 745–756. [Google Scholar] [CrossRef]
- Bong, A.H.L.; Monteith, G.R. Calcium signaling and the therapeutic targeting of cancer cells. Biochim. Biophys. Acta. Mol. Cell Res. 2018, 1865, 1786–1794. [Google Scholar] [CrossRef] [PubMed]
- Yang, S.; Zhang, J.J.; Huang, X.-Y. Orai1 and STIM1 are critical for breast tumor cell migration and metastasis. Cancer Cell 2009, 15, 124–134. [Google Scholar] [CrossRef] [Green Version]
- Sallán, M.C.; Visa, A.; Shaikh, S.; Nàger, M.; Herreros, J.; Cantí, C. T-type Ca(2+) Channels: T for Targetable. Cancer Res. 2018, 78, 603–609. [Google Scholar] [CrossRef] [Green Version]
- Peters, A.A.; Jamaludin, S.Y.N.; Yapa, K.T.D.S.; Chalmers, S.; Wiegmans, A.P.; Lim, H.F.; Milevskiy, M.J.G.; Azimi, I.; Davis, F.M.; Northwood, K.S.; et al. Oncosis and apoptosis induction by activation of an overexpressed ion channel in breast cancer cells. Oncogene 2017, 36, 6490–6500. [Google Scholar] [CrossRef] [Green Version]
- Zhang, L.; Barritt, G.J. Evidence that TRPM8 is an androgen-dependent Ca2+ channel required for the survival of prostate cancer cells. Cancer Res. 2004, 64, 8365–8373. [Google Scholar] [CrossRef] [Green Version]
- Tang, B.-D.; Xia, X.; Lv, X.-F.; Yu, B.-X.; Yuan, J.-N.; Mai, X.-Y.; Shang, J.-Y.; Zhou, J.-G.; Liang, S.-J.; Pang, R.-P. Inhibition of Orai1-mediated Ca(2+) entry enhances chemosensitivity of HepG2 hepatocarcinoma cells to 5-fluorouracil. J. Cell. Mol. Med. 2017, 21, 904–915. [Google Scholar] [CrossRef] [PubMed]
- Dziegielewska, B.; Casarez, E.V.; Yang, W.Z.; Gray, L.S.; Dziegielewski, J.; Slack-Davis, J.K. T-Type Ca2+ Channel Inhibition Sensitizes Ovarian Cancer to Carboplatin. Mol. Cancer Ther. 2016, 15, 460–470. [Google Scholar] [CrossRef] [Green Version]
- Whitaker, M. Calcium at fertilization and in early development. Physiol. Rev. 2006, 86, 25–88. [Google Scholar] [CrossRef] [PubMed]
- Chiappinelli, K.B.; Strissel, P.L.; Desrichard, A.; Li, H.; Henke, C.; Akman, B.; Hein, A.; Rote, N.S.; Cope, L.M.; Snyder, A.; et al. Inhibiting DNA Methylation Causes an Interferon Response in Cancer via dsRNA Including Endogenous Retroviruses. Cell 2016, 164, 1073. [Google Scholar] [CrossRef] [PubMed] [Green Version]
- Roulois, D.; Loo Yau, H.; Singhania, R.; Wang, Y.; Danesh, A.; Shen, S.Y.; Han, H.; Liang, G.; Jones, P.A.; Pugh, T.J.; et al. DNA-Demethylating Agents Target Colorectal Cancer Cells by Inducing Viral Mimicry by Endogenous Transcripts. Cell 2015, 162, 961–973. [Google Scholar] [CrossRef] [PubMed] [Green Version]
- Jones, P.A.; Ohtani, H.; Chakravarthy, A.; De Carvalho, D.D. Epigenetic therapy in immune-oncology. Nat. Rev. Cancer 2019, 19, 151–161. [Google Scholar] [CrossRef] [PubMed]
- Gai, W.; Sun, K. Epigenetic Biomarkers in Cell-Free DNA and Applications in Liquid Biopsy. Genes (Basel) 2019, 10, 32. [Google Scholar] [CrossRef] [Green Version]
- Aryee, M.J.; Jaffe, A.E.; Corrada-Bravo, H.; Ladd-Acosta, C.; Feinberg, A.P.; Hansen, K.D.; Irizarry, R.A. Minfi: A flexible and comprehensive Bioconductor package for the analysis of Infinium DNA methylation microarrays. Bioinformatics 2014, 30, 1363–1369. [Google Scholar] [CrossRef] [Green Version]
- Fortin, J.P.; Labbe, A.; Lemire, M.; Zanke, B.W.; Hudson, T.J.; Fertig, E.J.; Greenwood, C.M.; Hansen, K.D. Functional normalization of 450k methylation array data improves replication in large cancer studies. Genome Biol. 2014, 15, 503. [Google Scholar] [CrossRef] [Green Version]
- Du, P.; Zhang, X.; Huang, C.-C.; Jafari, N.; Kibbe, W.A.; Hou, L.; Lin, S.M. Comparison of Beta-value and M-value methods for quantifying methylation levels by microarray analysis. BMC Bioinform. 2010, 11, 587. [Google Scholar] [CrossRef] [Green Version]
- Martin, M.; Ancey, P.B.; Cros, M.P.; Durand, G.; Le Calvez-Kelm, F.; Hernandez-Vargas, H.; Herceg, Z. Dynamic imbalance between cancer cell subpopulations induced by transforming growth factor beta (TGF-β) is associated with a DNA methylome switch. BMC Genom. 2014, 15, 435. [Google Scholar] [CrossRef] [Green Version]
- Kanehisa, M.; Goto, S. KEGG: Kyoto encyclopedia of genes and genomes. Nucleic Acids Res. 2000, 28, 27–30. [Google Scholar] [CrossRef]
- Kanehisa, M.; Sato, Y.; Kawashima, M.; Furumichi, M.; Tanabe, M. KEGG as a reference resource for gene and protein annotation. Nucleic Acids Res. 2016, 44, D457–D462. [Google Scholar] [CrossRef] [PubMed] [Green Version]
- Yu, G.; Wang, L.G.; Han, Y.; He, Q.Y. clusterProfiler: An R package for comparing biological themes among gene clusters. OMICS 2012, 16, 284–287. [Google Scholar] [CrossRef] [PubMed]


© 2020 by the authors. Licensee MDPI, Basel, Switzerland. This article is an open access article distributed under the terms and conditions of the Creative Commons Attribution (CC BY) license (http://creativecommons.org/licenses/by/4.0/).
Share and Cite
Gregório, C.; Soares-Lima, S.C.; Alemar, B.; Recamonde-Mendoza, M.; Camuzi, D.; de Souza-Santos, P.T.; Rivero, R.; Machado, S.; Osvaldt, A.; Ashton-Prolla, P.; et al. Calcium Signaling Alterations Caused by Epigenetic Mechanisms in Pancreatic Cancer: From Early Markers to Prognostic Impact. Cancers 2020, 12, 1735. https://doi.org/10.3390/cancers12071735
Gregório C, Soares-Lima SC, Alemar B, Recamonde-Mendoza M, Camuzi D, de Souza-Santos PT, Rivero R, Machado S, Osvaldt A, Ashton-Prolla P, et al. Calcium Signaling Alterations Caused by Epigenetic Mechanisms in Pancreatic Cancer: From Early Markers to Prognostic Impact. Cancers. 2020; 12(7):1735. https://doi.org/10.3390/cancers12071735
Chicago/Turabian StyleGregório, Cleandra, Sheila Coelho Soares-Lima, Bárbara Alemar, Mariana Recamonde-Mendoza, Diego Camuzi, Paulo Thiago de Souza-Santos, Raquel Rivero, Simone Machado, Alessandro Osvaldt, Patricia Ashton-Prolla, and et al. 2020. "Calcium Signaling Alterations Caused by Epigenetic Mechanisms in Pancreatic Cancer: From Early Markers to Prognostic Impact" Cancers 12, no. 7: 1735. https://doi.org/10.3390/cancers12071735
APA StyleGregório, C., Soares-Lima, S. C., Alemar, B., Recamonde-Mendoza, M., Camuzi, D., de Souza-Santos, P. T., Rivero, R., Machado, S., Osvaldt, A., Ashton-Prolla, P., & Pinto, L. F. R. (2020). Calcium Signaling Alterations Caused by Epigenetic Mechanisms in Pancreatic Cancer: From Early Markers to Prognostic Impact. Cancers, 12(7), 1735. https://doi.org/10.3390/cancers12071735