Deep Learning for the Classification of Small-Cell and Non-Small-Cell Lung Cancer

 ,
,  ,
, 

 add
Show full author list
add
Show full author list
Abstract
1. Introduction
2. Methods
2.1. Patient Cohort, Tissue Microarray Construction, and Scanning of Tissue Slides
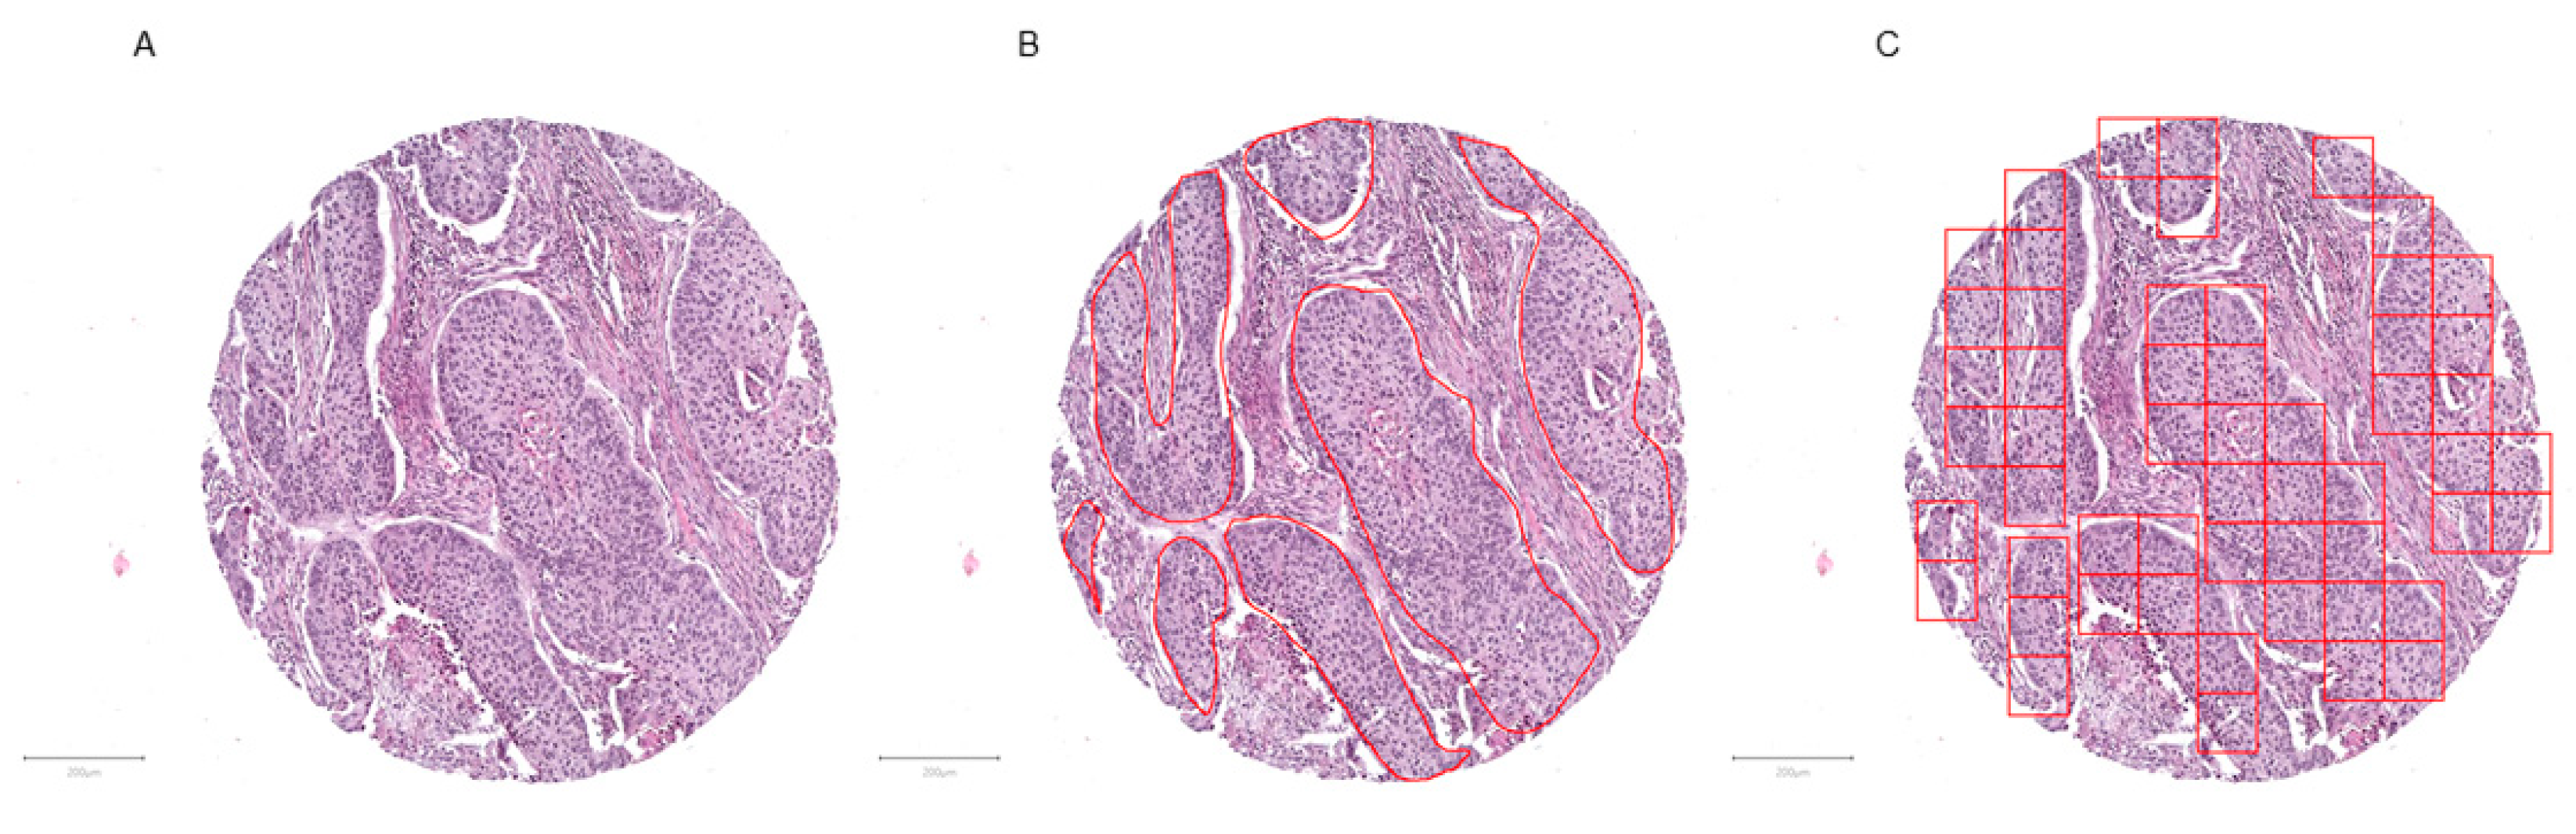
2.2. Tumor Annotation and Image Patch Extraction
2.3. Hardware and Software
2.4. Analytical Subsets
2.5. Convolutional Neuronal Network
3. Results
3.1. Patient Cohort, Annotation, Image Patches Extraction, and Subset Analysis
3.2. Convolutional Neuronal Network Selection and Hyperparameter Optimization
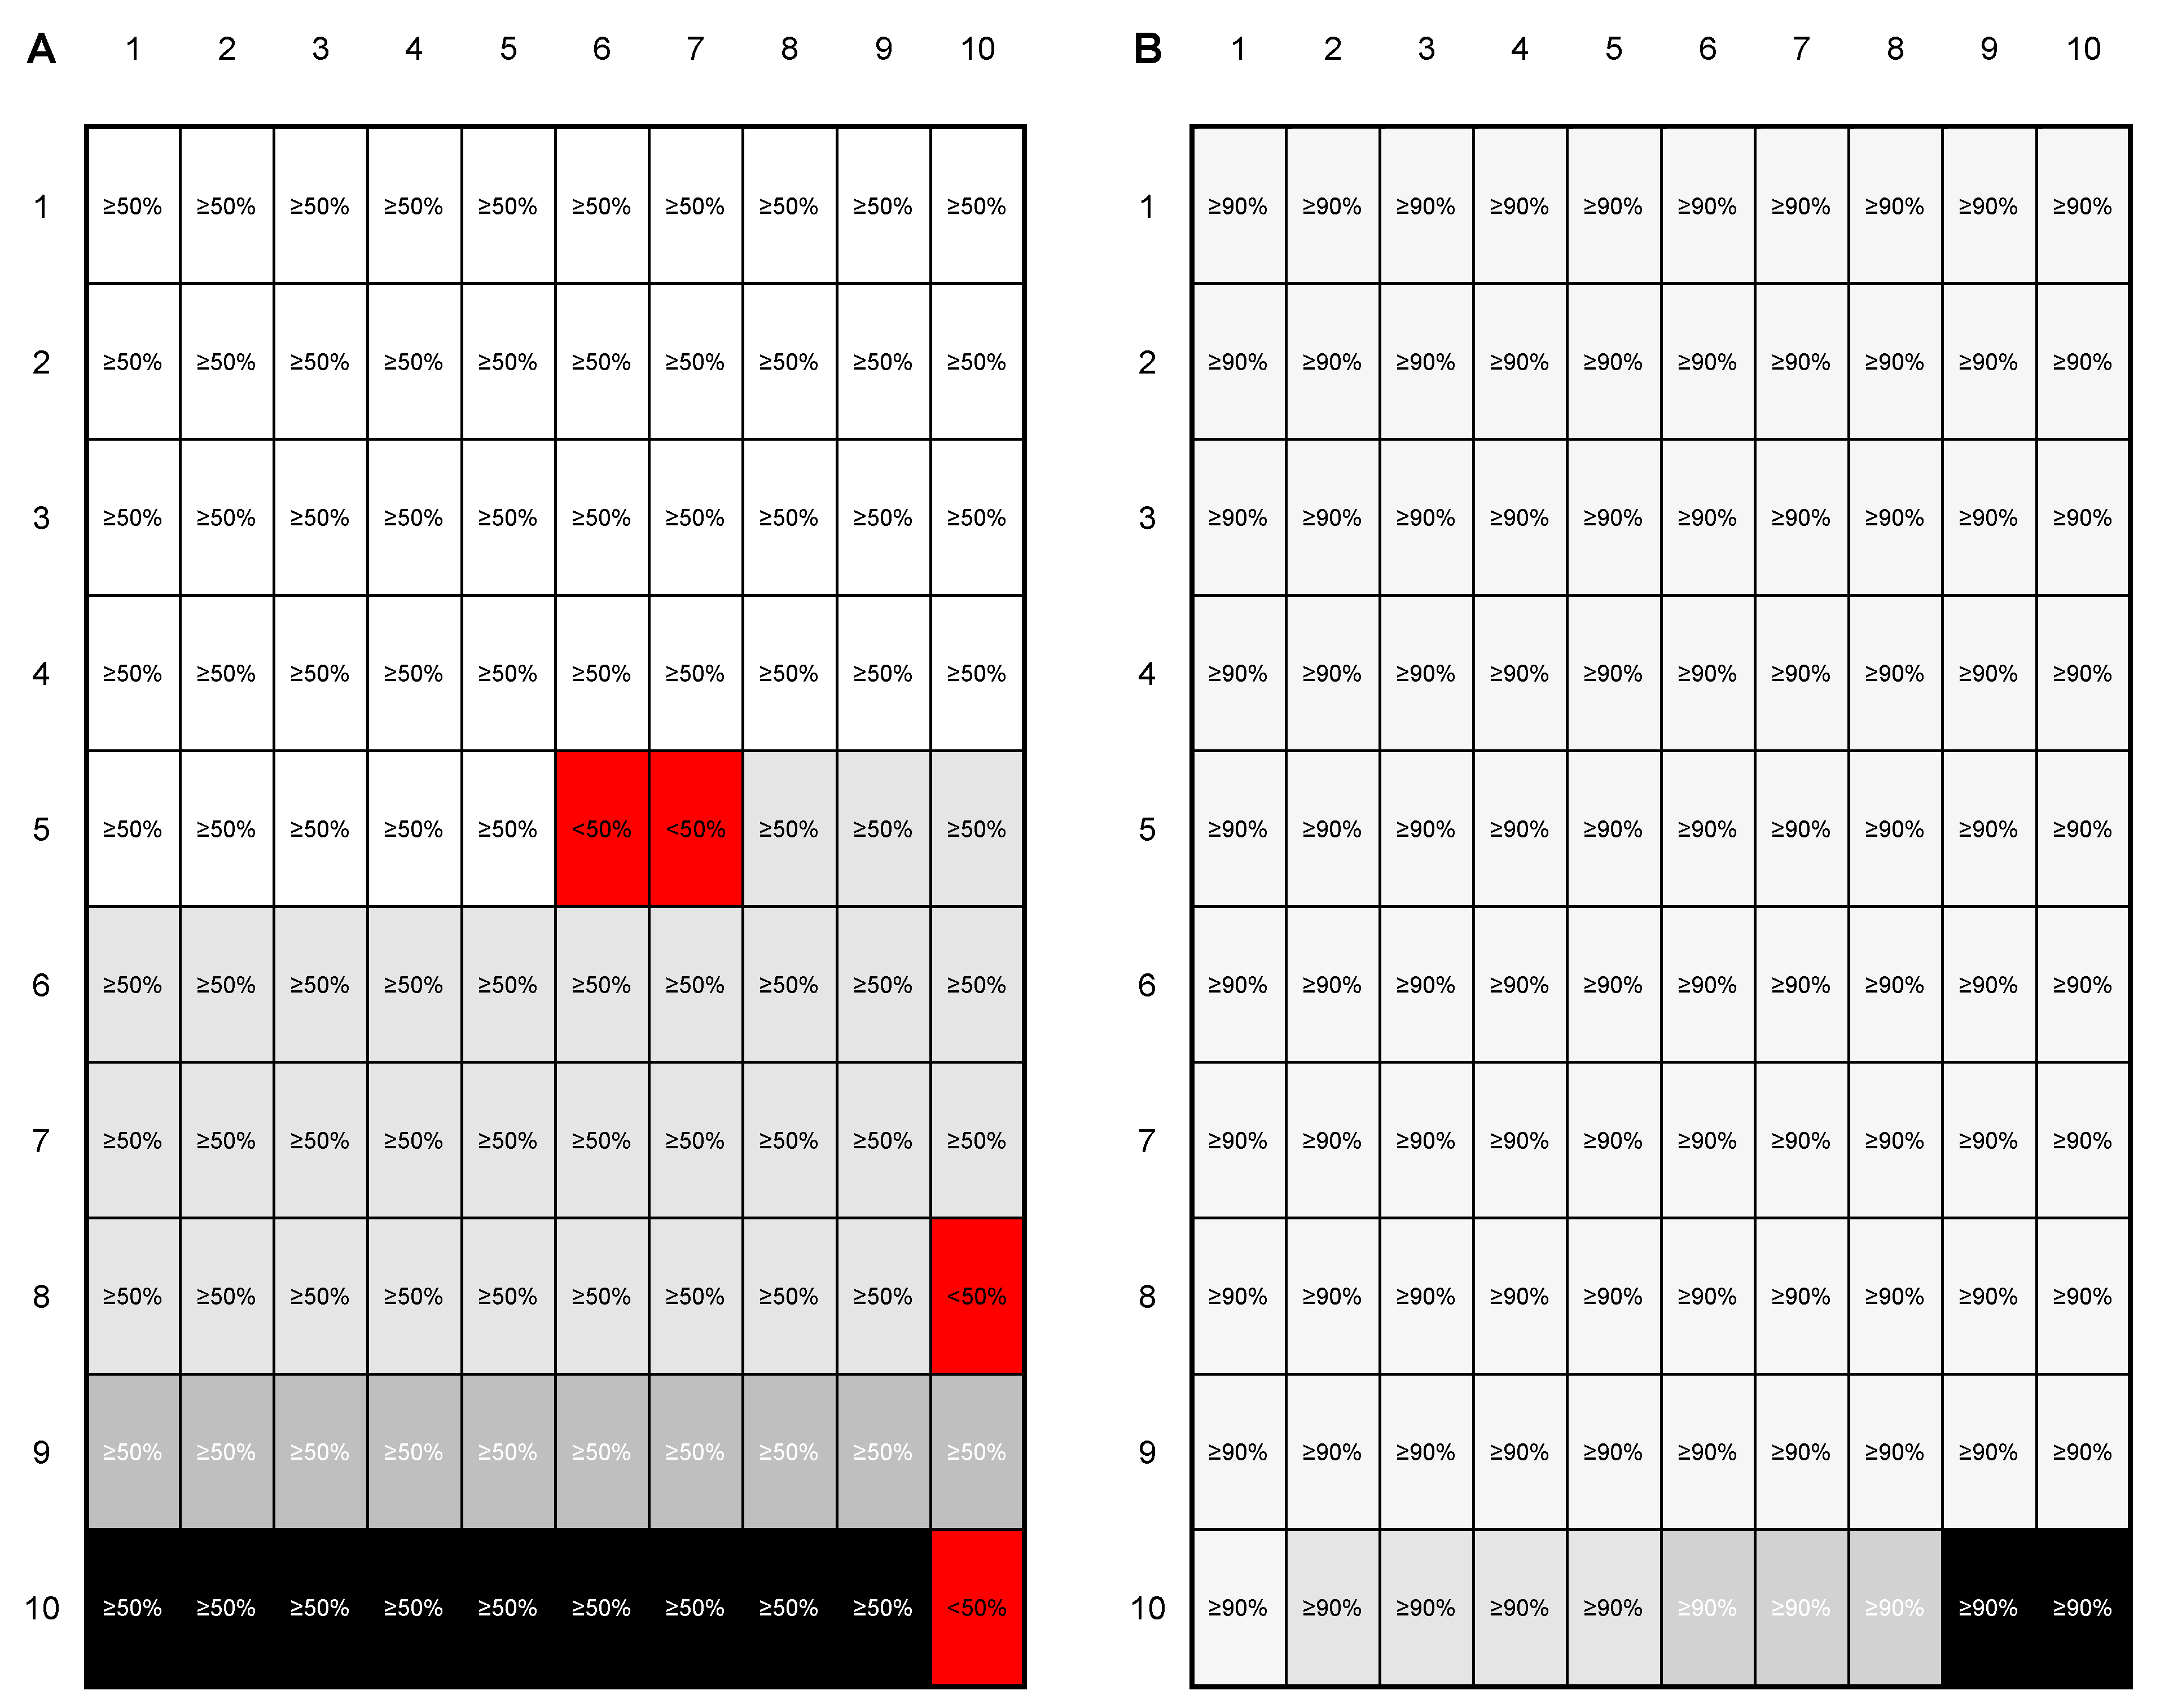
3.3. Evaluation of the Test Set and Introduction of a Quality Control
4. Discussion
5. Conclusions
Author Contributions
Funding
Acknowledgments
Conflicts of Interest
Appendix A


| Image Patch QC Value | True Diagnosis | Predicted Diagnosis | Image Patch QC Failed | |||
|---|---|---|---|---|---|---|
| ADC | SqCC | SCLC | Skeletal Muscle | |||
| 50% | ||||||
| ADC | 798 | 137 | 12 | 0 | 1 | |
| SqCC | 116 | 624 | 0 | 0 | 0 | |
| SCLC | 0 | 0 | 385 | 0 | 0 | |
| Skeletal muscle | 0 | 0 | 0 | 375 | 0 | |
| 60% | ||||||
| ADC | 776 | 109 | 12 | 0 | 51 | |
| SqCC | 101 | 611 | 0 | 0 | 28 | |
| SCLC | 0 | 0 | 385 | 0 | 0 | |
| Skeletal muscle | 0 | 0 | 0 | 375 | 0 | |
| 70% | ||||||
| ADC | 753 | 86 | 12 | 0 | 97 | |
| SqCC | 89 | 598 | 0 | 0 | 53 | |
| SCLC | 0 | 0 | 385 | 0 | 0 | |
| Skeletal muscle | 0 | 0 | 0 | 375 | 0 | |
| 80% | ||||||
| ADC | 721 | 66 | 11 | 0 | 150 | |
| SqCC | 71 | 564 | 0 | 0 | 105 | |
| SCLC | 0 | 0 | 385 | 0 | 0 | |
| Skeletal muscle | 0 | 0 | 0 | 375 | 0 | |
| 90% | ||||||
| ADC | 672 | 46 | 10 | 0 | 220 | |
| SqCC | 51 | 523 | 0 | 0 | 166 | |
| SCLC | 0 | 0 | 385 | 0 | 0 | |
| Skeletal muscle | 0 | 0 | 0 | 375 | 0 | |
References
- Cronin, K.A.; Lake, A.J.; Scott, S.; Sherman, R.L.; Noone, A.M.; Howlader, N.; Henley, S.J.; Anderson, R.N.; Firth, A.U.; Ma, J.; et al. Annual Report to the Nation on the Status of Cancer, part I: National cancer statistics. Cancer 2018, 124, 2785–2800. [Google Scholar] [CrossRef] [PubMed]
- Bray, F.; Ferlay, J.; Soerjomataram, I.; Siegel, R.L.; Torre, L.A.; Jemal, A. Global cancer statistics 2018: GLOBOCAN estimates of incidence and mortality worldwide for 36 cancers in 185 countries. CA. Cancer J. Clin. 2018, 68, 394–424. [Google Scholar] [CrossRef] [PubMed]
- Ferlay, J.; Colombet, M.; Soerjomataram, I.; Mathers, C.; Parkin, D.M.; Pineros, M.; Znaor, A.; Bray, F. Estimating the global cancer incidence and mortality in 2018: GLOBOCAN sources and methods. Int. J. Cancer 2019, 144, 1941–1953. [Google Scholar] [CrossRef] [PubMed]
- Reck, M.; Rabe, K.F. Precision Diagnosis and Treatment for Advanced Non-Small-Cell Lung Cancer. N. Engl. J. Med. 2017, 377, 849–861. [Google Scholar] [CrossRef]
- Chen, Z.; Fillmore, C.M.; Hammerman, P.S.; Kim, C.F.; Wong, K.K. Non-small-cell lung cancers: A heterogeneous set of diseases. Nat. Rev. Cancer 2014, 14, 535–546. [Google Scholar] [CrossRef]
- Santarpia, M.; Aguilar, A.; Chaib, I.; Cardona, A.F.; Fancelli, S.; Laguia, F.; Bracht, J.W.P.; Cao, P.; Molina-Vila, M.A.; Karachaliou, N.; et al. Non-Small-Cell Lung Cancer Signaling Pathways, Metabolism, and PD-1/PD-L1 Antibodies. Cancers (Basel) 2020, 12, e1475. [Google Scholar] [CrossRef]
- Warth, A.; Endris, V.; Stenzinger, A.; Penzel, R.; Harms, A.; Duell, T.; Abdollahi, A.; Lindner, M.; Schirmacher, P.; Muley, T.; et al. Genetic changes of non-small cell lung cancer under neoadjuvant therapy. Oncotarget 2016, 7, 29761–29769. [Google Scholar] [CrossRef]
- Gandhi, L.; Rodriguez-Abreu, D.; Gadgeel, S.; Esteban, E.; Felip, E.; De Angelis, F.; Domine, M.; Clingan, P.; Hochmair, M.J.; Powell, S.F.; et al. Pembrolizumab plus Chemotherapy in Metastatic Non-Small-Cell Lung Cancer. N. Engl. J. Med. 2018, 378, 2078–2092. [Google Scholar] [CrossRef]
- Reck, M. Pembrolizumab as first-line therapy for metastatic non-small-cell lung cancer. Immunotherapy 2018, 10, 93–105. [Google Scholar] [CrossRef]
- Reck, M.; Heigener, D.F.; Mok, T.; Soria, J.C.; Rabe, K.F. Management of non-small-cell lung cancer: Recent developments. Lancet 2013, 382, 709–719. [Google Scholar] [CrossRef]
- Mukhopadhyay, S.; Katzenstein, A.L. Subclassification of non-small cell lung carcinomas lacking morphologic differentiation on biopsy specimens: Utility of an immunohistochemical panel containing TTF-1, napsin A, p63, and CK5/6. Am. J. Surg. Pathol. 2011, 35, 15–25. [Google Scholar] [CrossRef] [PubMed]
- Travis, W.D.; Brambilla, E.; Nicholson, A.G.; Yatabe, Y.; Austin, J.H.M.; Beasley, M.B.; Chirieac, L.R.; Dacic, S.; Duhig, E.; Flieder, D.B.; et al. The 2015 World Health Organization Classification of Lung Tumors: Impact of Genetic, Clinical and Radiologic Advances Since the 2004 Classification. J. Thorac. Oncol. 2015, 10, 1243–1260. [Google Scholar] [CrossRef] [PubMed]
- Adeyi, O.A. Pathology services in developing countries-the West African experience. Arch. Pathol. Lab. Med. 2011, 135, 183–186. [Google Scholar] [CrossRef] [PubMed]
- Aeffner, F.; Zarella, M.D.; Buchbinder, N.; Bui, M.M.; Goodman, M.R.; Hartman, D.J.; Lujan, G.M.; Molani, M.A.; Parwani, A.V.; Lillard, K.; et al. Introduction to Digital Image Analysis in Whole-slide Imaging: A White Paper from the Digital Pathology Association. J. Pathol. Inform. 2019, 10, e9. [Google Scholar] [CrossRef]
- Higgins, C. Applications and challenges of digital pathology and whole slide imaging. Biotech. Histochem. 2015, 90, 341–347. [Google Scholar] [CrossRef]
- Grobholz, R. [Digital pathology: The time has come!]. Pathologe 2018, 39, 228–235. [Google Scholar] [CrossRef]
- Unternaehrer, J.; Grobholz, R.; Janowczyk, A.; Zlobec, I.; Swiss Digital Pathology, C. Current opinion, status and future development of digital pathology in Switzerland. J. Clin. Pathol. 2019, 73, 341–346. [Google Scholar] [CrossRef]
- Lisenko, K.; Leichsenring, J.; Zgorzelski, C.; Longuespee, R.; Casadonte, R.; Harms, A.; Kazdal, D.; Stenzinger, A.; Warth, A.; Kriegsmann, M. Qualitative Comparison Between Carrier-based and Classical Tissue Microarrays. Appl. Immunohistochem. Mol. Morphol. 2017, 25, e74–e79. [Google Scholar] [CrossRef]
- Ly, A.; Longuespee, R.; Casadonte, R.; Wandernoth, P.; Schwamborn, K.; Bollwein, C.; Marsching, C.; Kriegsmann, K.; Hopf, C.; Weichert, W.; et al. Site-to-Site Reproducibility and Spatial Resolution in MALDI-MSI of Peptides from Formalin-Fixed Paraffin-Embedded Samples. Proteom. Clin. Appl 2019, 13, e1800029. [Google Scholar] [CrossRef]
- Acs, B.; Pelekanou, V.; Bai, Y.; Martinez-Morilla, S.; Toki, M.; Leung, S.C.Y.; Nielsen, T.O.; Rimm, D.L. Ki67 reproducibility using digital image analysis: An inter-platform and inter-operator study. Lab. Invest. 2019, 99, 107–117. [Google Scholar] [CrossRef]
- Bankhead, P.; Fernandez, J.A.; McArt, D.G.; Boyle, D.P.; Li, G.; Loughrey, M.B.; Irwin, G.W.; Harkin, D.P.; James, J.A.; McQuaid, S.; et al. Integrated tumor identification and automated scoring minimizes pathologist involvement and provides new insights to key biomarkers in breast cancer. Lab. Invest. 2018, 98, 15–26. [Google Scholar] [CrossRef] [PubMed]
- Song, L.; Liu, J.; Qian, B.; Sun, M.; Yang, K.; Sun, M.; Abbas, S. A Deep Multi-Modal CNN for Multi-Instance Multi-Label Image Classification. IEEE Trans Image Process. 2018, 27, 6025–6038. [Google Scholar] [CrossRef] [PubMed]
- Maruyama, T.; Hayashi, N.; Sato, Y.; Hyuga, S.; Wakayama, Y.; Watanabe, H.; Ogura, A.; Ogura, T. Comparison of medical image classification accuracy among three machine learning methods. J. Xray Sci. Technol. 2018, 26, 885–893. [Google Scholar] [CrossRef] [PubMed]
- Yatabe, Y.; Dacic, S.; Borczuk, A.C.; Warth, A.; Russell, P.A.; Lantuejoul, S.; Beasley, M.B.; Thunnissen, E.; Pelosi, G.; Rekhtman, N.; et al. Best Practices Recommendations for Diagnostic Immunohistochemistry in Lung Cancer. J. Thorac. Oncol. 2019, 14, 377–407. [Google Scholar] [CrossRef]
- Kriegsmann, K.; Zgorzelski, C.; Kazdal, D.; Cremer, M.; Muley, T.; Winter, H.; Longuespee, R.; Kriegsmann, J.; Warth, A.; Kriegsmann, M. Insulinoma-associated Protein 1 (INSM1) in Thoracic Tumors is Less Sensitive but More Specific Compared With Synaptophysin, Chromogranin A, and CD56. Appl. Immunohistochem. Mol. Morphol 2020, 28, 237–242. [Google Scholar] [CrossRef]
- Kriegsmann, K.; Cremer, M.; Zgorzelski, C.; Harms, A.; Muley, T.; Winter, H.; Kazdal, D.; Warth, A.; Kriegsmann, M. Agreement of CK5/6, p40, and p63 immunoreactivity in non-small cell lung cancer. Pathologe 2019, 51, 240–245. [Google Scholar] [CrossRef]
- Kriegsmann, M.; Harms, A.; Longuespee, R.; Muley, T.; Winter, H.; Kriegsmann, K.; Kazdal, D.; Goeppert, B.; Pathil, A.; Warth, A. Role of conventional immunomarkers, HNF4-alpha and SATB2, in the differential diagnosis of pulmonary and colorectal adenocarcinomas. Histopathology 2018, 72, 997–1006. [Google Scholar] [CrossRef]
- Kriegsmann, M.; Kriegsmann, K.; Harms, A.; Longuespee, R.; Zgorzelski, C.; Leichsenring, J.; Muley, T.; Winter, H.; Kazdal, D.; Goeppert, B.; et al. Expression of HMB45, MelanA and SOX10 is rare in non-small cell lung cancer. Diagn. Pathol. 2018, 13, e68. [Google Scholar] [CrossRef]
- Mazo, C.; Bernal, J.; Trujillo, M.; Alegre, E. Transfer learning for classification of cardiovascular tissues in histological images. Comput. Methods Programs Biomed. 2018, 165, 69–76. [Google Scholar] [CrossRef]
- Nishio, M.; Sugiyama, O.; Yakami, M.; Ueno, S.; Kubo, T.; Kuroda, T.; Togashi, K. Computer-aided diagnosis of lung nodule classification between benign nodule, primary lung cancer, and metastatic lung cancer at different image size using deep convolutional neural network with transfer learning. PLoS ONE 2018, 13, e0200721. [Google Scholar] [CrossRef]
- Toratani, M.; Konno, M.; Asai, A.; Koseki, J.; Kawamoto, K.; Tamari, K.; Li, Z.; Sakai, D.; Kudo, T.; Satoh, T.; et al. A Convolutional Neural Network Uses Microscopic Images to Differentiate between Mouse and Human Cell Lines and Their Radioresistant Clones. Cancer Res. 2018, 78, 6703–6707. [Google Scholar] [CrossRef]
- Khosravi, P.; Kazemi, E.; Imielinski, M.; Elemento, O.; Hajirasouliha, I. Deep Convolutional Neural Networks Enable Discrimination of Heterogeneous Digital Pathology Images. EBioMedicine 2018, 27, 317–328. [Google Scholar] [CrossRef]
- Lucas, M.; Jansen, I.; Savci-Heijink, C.D.; Meijer, S.L.; de Boer, O.J.; van Leeuwen, T.G.; de Bruin, D.M.; Marquering, H.A. Deep learning for automatic Gleason pattern classification for grade group determination of prostate biopsies. Virchows Arch. 2019, 475, 77–83. [Google Scholar] [CrossRef] [PubMed]
- Wang, Y.; Huang, F.; Zhang, Y.; Zhang, R.; Lei, B.; Wang, T. Breast Cancer Image Classification via Multi-level Dual-network Features and Sparse Multi-Relation Regularized Learning. Conf. Proc. IEEE Eng. Med. Biol. Soc. 2019, 2019, 7023–7026. [Google Scholar] [CrossRef] [PubMed]
- Cho, S.I.; Sun, S.; Mun, J.H.; Kim, C.; Kim, S.Y.; Cho, S.; Youn, S.W.; Kim, H.C.; Chung, J.H. Dermatologist-level classification of malignant lip diseases using a deep convolutional neural network. Br. J. Derm. 2019, 182, 1388–1394. [Google Scholar] [CrossRef] [PubMed]
- Raimi, K. Illustrated: 10 CNN Architectures. Available online: https://towardsdatascience.com/illustrated-10-cnn-architectures-95d78ace614d (accessed on 14 June 2020).
- Wang, S.; Yang, D.M.; Rong, R.; Zhan, X.; Fujimoto, J.; Liu, H.; Minna, J.; Wistuba, I.I.; Xie, Y.; Xiao, G. Artificial Intelligence in Lung Cancer Pathology Image Analysis. Cancers (Basel) 2019, 11, e1673. [Google Scholar] [CrossRef]
- Coudray, N.; Ocampo, P.S.; Sakellaropoulos, T.; Narula, N.; Snuderl, M.; Fenyo, D.; Moreira, A.L.; Razavian, N.; Tsirigos, A. Classification and mutation prediction from non-small cell lung cancer histopathology images using deep learning. Nat. Med. 2018, 24, 1559–1567. [Google Scholar] [CrossRef] [PubMed]
- Iizuka, O.; Kanavati, F.; Kato, K.; Rambeau, M.; Arihiro, K.; Tsuneki, M. Deep Learning Models for Histopathological Classification of Gastric and Colonic Epithelial Tumours. Sci. Rep. 2020, 10, e1504. [Google Scholar] [CrossRef]
- Gonzalez, D.; Dietz, R.L.; Pantanowitz, L. Feasibility of a deep learning algorithm to distinguish large cell neuroendocrine from small cell lung carcinoma in cytology specimens. Cytopathology 2020. [Google Scholar] [CrossRef]
- Gonem, S.; Janssens, W.; Das, N.; Topalovic, M. Applications of artificial intelligence and machine learning in respiratory medicine. Thorax 2020. [Google Scholar] [CrossRef]
- Warth, A.; Stenzinger, A.; von Brunneck, A.C.; Goeppert, B.; Cortis, J.; Petersen, I.; Hoffmann, H.; Schnabel, P.A.; Weichert, W. Interobserver variability in the application of the novel IASLC/ATS/ERS classification for pulmonary adenocarcinomas. Eur. Respir. J. 2012, 40, 1221–1227. [Google Scholar] [CrossRef] [PubMed]
- Warth, A.; Muley, T.; Herpel, E.; Meister, M.; Herth, F.J.; Schirmacher, P.; Weichert, W.; Hoffmann, H.; Schnabel, P.A. Large-scale comparative analyses of immunomarkers for diagnostic subtyping of non-small-cell lung cancer biopsies. Histopathology 2012, 61, 1017–1025. [Google Scholar] [CrossRef] [PubMed]
- Sauter, G. Representativity of TMA studies. Methods Mol. Biol. 2010, 664, 27–35. [Google Scholar] [CrossRef] [PubMed]
- Steiner, D.F.; MacDonald, R.; Liu, Y.; Truszkowski, P.; Hipp, J.D.; Gammage, C.; Thng, F.; Peng, L.; Stumpe, M.C. Impact of Deep Learning Assistance on the Histopathologic Review of Lymph Nodes for Metastatic Breast Cancer. Am. J. Surg. Pathol. 2018, 42, 1636–1646. [Google Scholar] [CrossRef]
- Kather, J.N.; Pearson, A.T.; Halama, N.; Jager, D.; Krause, J.; Loosen, S.H.; Marx, A.; Boor, P.; Tacke, F.; Neumann, U.P.; et al. Deep learning can predict microsatellite instability directly from histology in gastrointestinal cancer. Nat. Med. 2019, 25, 1054–1056. [Google Scholar] [CrossRef]
- Bulten, W.; Pinckaers, H.; van Boven, H.; Vink, R.; de Bel, T.; van Ginneken, B.; van der Laak, J.; Hulsbergen-van de Kaa, C.; Litjens, G. Automated deep-learning system for Gleason grading of prostate cancer using biopsies: A diagnostic study. Lancet. Oncol. 2020, 21, 233–241. [Google Scholar] [CrossRef]
- Gertych, A.; Swiderska-Chadaj, Z.; Ma, Z.; Ing, N.; Markiewicz, T.; Cierniak, S.; Salemi, H.; Guzman, S.; Walts, A.E.; Knudsen, B.S. Convolutional neural networks can accurately distinguish four histologic growth patterns of lung adenocarcinoma in digital slides. Sci. Rep. 2019, 9, e1483. [Google Scholar] [CrossRef]
- Singh, R.; Ahmed, T.; Kumar, A.; Singh, A.K.; Pandey, A.K.; Singh, S.K. Imbalanced Breast Cancer Classification Using Transfer Learning. IEEE/ACM Trans. Comput. Biol. Bioinform. 2020. [Google Scholar] [CrossRef]
- Chen, Z.; Xu, T.B.; Du, C.; Liu, C.L.; He, H. Dynamical Channel Pruning by Conditional Accuracy Change for Deep Neural Networks. IEEE Trans. Neural Netw. Learn. Syst 2020. [Google Scholar] [CrossRef]
- Frazier-Logue, N.; Hanson, S.J. The Stochastic Delta Rule: Faster and More Accurate Deep Learning Through Adaptive Weight Noise. Neural Comput. 2020, 32, 1018–1032. [Google Scholar] [CrossRef]
- Liu, Y.; Kohlberger, T.; Norouzi, M.; Dahl, G.E.; Smith, J.L.; Mohtashamian, A.; Olson, N.; Peng, L.H.; Hipp, J.D.; Stumpe, M.C. Artificial Intelligence-Based Breast Cancer Nodal Metastasis Detection: Insights Into the Black Box for Pathologists. Arch. Pathol. Lab. Med. 2019, 143, 859–868. [Google Scholar] [CrossRef] [PubMed]
- Guo, Z.; Liu, H.; Ni, H.; Wang, X.; Su, M.; Guo, W.; Wang, K.; Jiang, T.; Qian, Y. A Fast and Refined Cancer Regions Segmentation Framework in Whole-slide Breast Pathological Images. Sci. Rep. 2019, 9, e882. [Google Scholar] [CrossRef]
- Ehteshami Bejnordi, B.; Veta, M.; Johannes van Diest, P.; van Ginneken, B.; Karssemeijer, N.; Litjens, G.; van der Laak, J.; the, C.C.; Hermsen, M.; Manson, Q.F.; et al. Diagnostic Assessment of Deep Learning Algorithms for Detection of Lymph Node Metastases in Women With Breast Cancer. JAMA. 2017, 318, 2199–2210. [Google Scholar] [CrossRef] [PubMed]
- Bandi, P.; Geessink, O.; Manson, Q.; Van Dijk, M.; Balkenhol, M.; Hermsen, M.; Ehteshami Bejnordi, B.; Lee, B.; Paeng, K.; Zhong, A.; et al. From Detection of Individual Metastases to Classification of Lymph Node Status at the Patient Level: The CAMELYON17 Challenge. IEEE Trans. Med. Imaging 2019, 38, 550–560. [Google Scholar] [CrossRef]
- Komura, D.; Ishikawa, S. Machine Learning Methods for Histopathological Image Analysis. Comput. Struct. Biotechnol. J. 2018, 16, 34–42. [Google Scholar] [CrossRef]
- Wei, J. Classification of Histopathology Images with Deep Learning. Available online: https://medium.com/health-data-science/classification-of-histopathology-images-with-deep-learning-a-practical-guide-2e3ffd6d59c5 (accessed on 14 June 2020).
- Zhang, J.T.; Li, Y.; Yan, L.X.; Zhu, Z.F.; Dong, X.R.; Chu, Q.; Wu, L.; Zhang, H.M.; Xu, C.W.; Lin, G.; et al. Disparity in clinical outcomes between pure and combined pulmonary large-cell neuroendocrine carcinoma: A multi-center retrospective study. Lung Cancer 2020, 139, 118–123. [Google Scholar] [CrossRef] [PubMed]
- Lin, M.W.; Su, K.Y.; Su, T.J.; Chang, C.C.; Lin, J.W.; Lee, Y.H.; Yu, S.L.; Chen, J.S.; Hsieh, M.S. Clinicopathological and genomic comparisons between different histologic components in combined small cell lung cancer and non-small cell lung cancer. Lung Cancer 2018, 125, 282–290. [Google Scholar] [CrossRef] [PubMed]


| Tissue Type | ADC | SqCC | SCLC | Skeletal Muscle | Overall Sum |
|---|---|---|---|---|---|
| Overall Analysis Set, 100% of Cases | |||||
| Cases, n | 80 | 80 | 80 | 30 | |
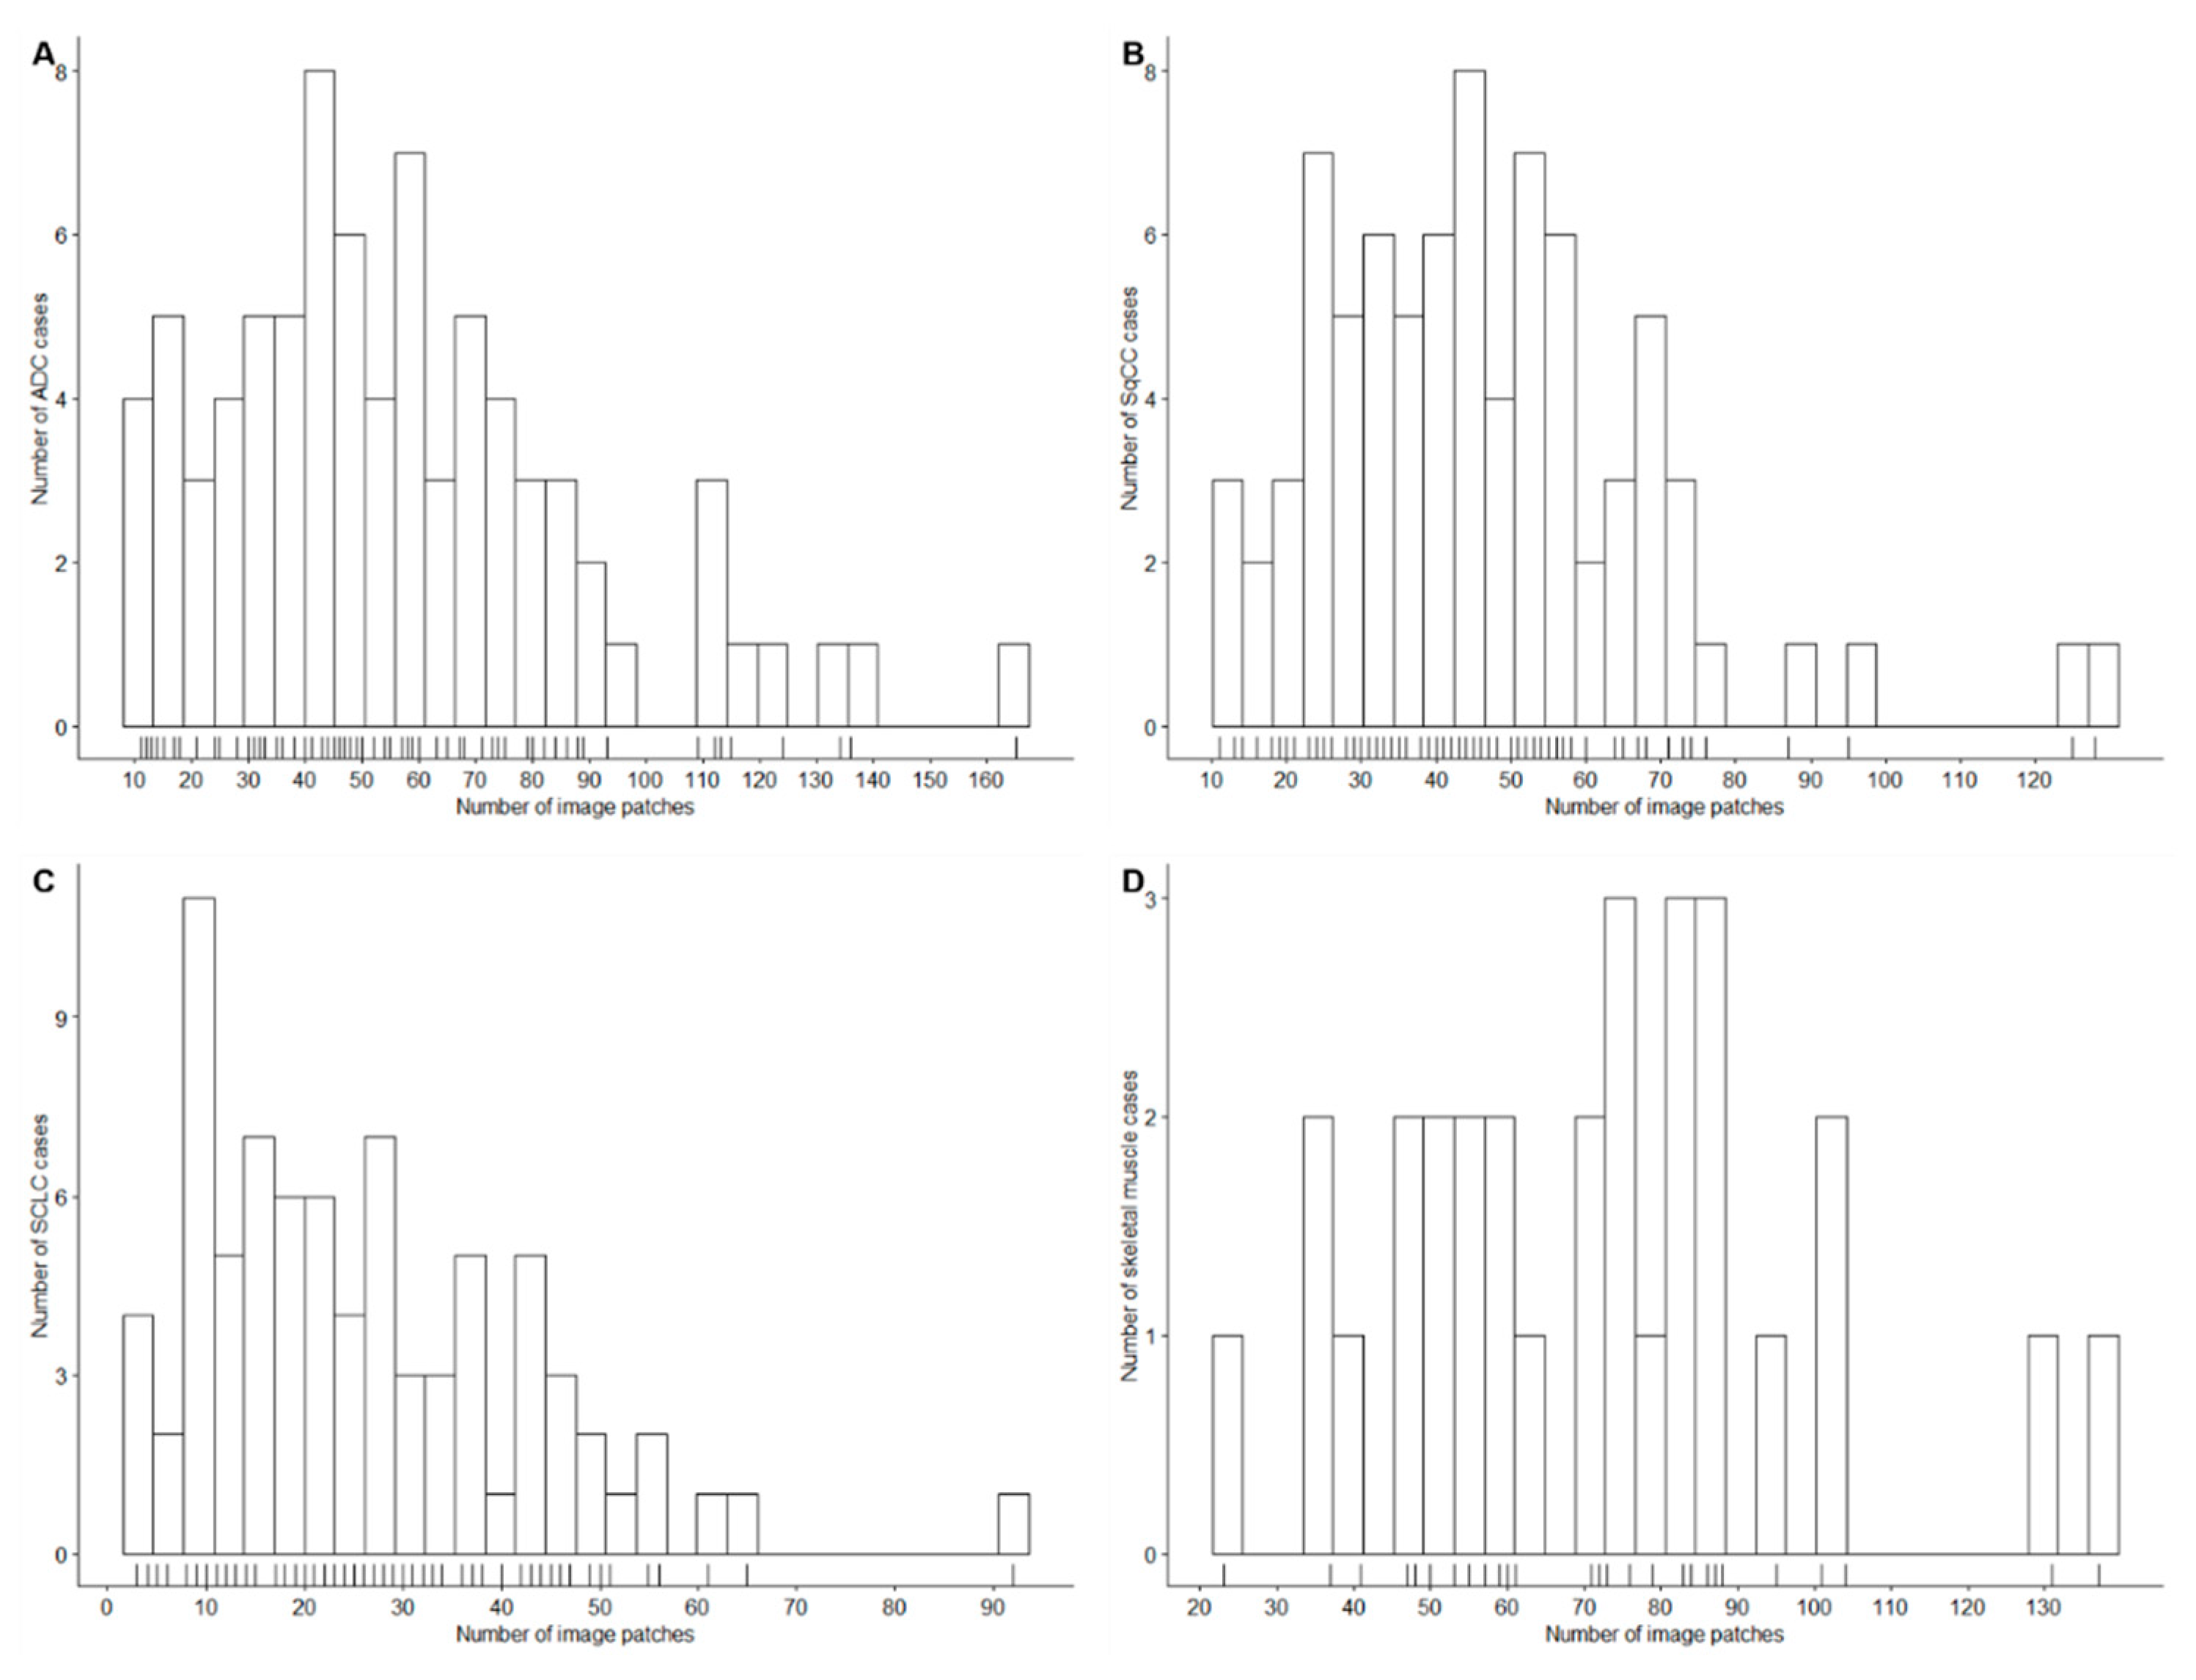
| Image patches, n | |||||
| Sum | 4505 | 3695 | 2075 | 2152 | 12,427 |
| Minimum | 11 | 11 | 3 | 23 | |
| Maximum | 165 | 128 | 92 | 137 | |
| Mean | 56 | 46 | 26 | 72 | |
| Median | 51 | 43 | 23 | 73 | |
| Training Set, 60% of Cases | |||||
| Cases, n | 48 | 48 | 49 | 18 | |
| Image patches, n | |||||
| Sum | 2686 | 2108 | 1253 | 1298 | 7345 |
| Minimum | 11 | 13 | 3 | 37 | |
| Maximum | 165 | 95 | 92 | 131 | |
| Mean | 56 | 44 | 26 | 72 | |
| Median | 54 | 43 | 22 | 73 | |
| Validation Set, 20% of Cases | |||||
| Cases, n | 16 | 16 | 15 | 6 | |
| Image patches, n | |||||
| Sum | 871 | 845 | 437 | 479 | 2632 |
| Minimum | 15 | 11 | 4 | 37 | |
| Maximum | 136 | 128 | 65 | 137 | |
| Mean | 54 | 53 | 29 | 80 | |
| Median | 46 | 48 | 28 | 72 | |
| Test Set, 20% of Cases | |||||
| Cases, n | 16 | 16 | 16 | 6 | |
| Image patches, n | |||||
| Sum | 948 | 742 | 385 | 375 | 2450 * |
| Minimum | 13 | 19 | 4 | 23 | |
| Maximum | 115 | 76 | 56 | 87 | |
| Mean | 59 | 46 | 24 | 63 | |
| Median | 55 | 41 | 23 | 70 | |
| A. CNN Models with Pretrained Weights on the ImageNet Dataset | ||||||||||
|---|---|---|---|---|---|---|---|---|---|---|
| CNN | VGG16 | InceptionV3 | InceptionResNetV2 | |||||||
| Epochs, n | 20 | 50 | 20 | 50 | 20 | 50 | ||||
| Training set | 81% | 82% | 68% | 70% | 72% | 74% | ||||
| Validation set | 81% | 81% | 59% | 64% | 62% | 60% | ||||
| B. CNN Models with Weights Trained on the Training Set | ||||||||||
| CNN | VGG16 | InceptionV3 | InceptionResNetV2 | |||||||
| Epochs, n | 20 | 50 | 20 | 50 | 20 | 50 | ||||
| Training set | 88% | 91% | 83% | 88% | 87% | 89% | ||||
| Validation set | 83% | 86% | 86% | 85% | 85% | 84% | ||||
| C. Different Image Input Sizes | ||||||||||
| Input size, px | 128 × 128 | 256 × 256 | 395 × 395 | |||||||
| Epochs, n | 20 | 20 | 20 | |||||||
| Training set | 83% | 95% | 93% | |||||||
| Validation set | 84% | 89% | 84% | |||||||
| D. Different Batch Sizes | ||||||||||
| Batch size, n | 8 | 16 | 32 | 64 | ||||||
| Epochs, n | 20 | 20 | 20 | 20 | ||||||
| Training set | 84% | 95% | 94% | 96% | ||||||
| Validation set | 88% | 89% | 87% | 89% | ||||||
| E. Different Dropout Rates | ||||||||||
| Dropout rate | 0 | 0.1 | 0.2 | 0.3 | 0.4 | 0.5 | ||||
| Epochs, n | 20 | 20 | 20 | 20 | 20 | 20 | ||||
| Training set | 95% | 89% | 89% | 88% | 89% | 88% | ||||
| Validation set | 89% | 86% | 84% | 86% | 86% | 89% | ||||
| Image Patch QC Value | Image Patches with Failed QC (n) | Proportion of Image Patches with Failed QC (%) | Classification Accuracy of ADC, SqCC, SCLC, Skeletal Muscle Image Patches (%) | Classification Accuracy of ADC, SqCC, SCLC Image Patches (%) | Classification Accuracy of ADC, SqCC Image Patches (%) |
|---|---|---|---|---|---|
| 50% | 1 | 0.04 | 89 | 87 | 85 |
| 60% | 79 | 3 | 91 | 89 | 87 |
| 70% | 150 | 6 | 92 | 90 | 89 |
| 80% | 255 | 10 | 93 | 92 | 90 |
| 90% | 389 | 16 | 95 | 94 | 92 |
| Case QC Value | 50% | 60% | 70% | 80% | 90% | ||||||
|---|---|---|---|---|---|---|---|---|---|---|---|
| Parameter | CA (%) | QC Failed (%) | CA (%) | QC Failed (%) | CA (%) | QC Failed (%) | CA (%) | QC Failed (%) | CA (%) | QC Failed (%) | |
| A. ADC, SqCC, SCLC, and Skeletal Muscle Cases | |||||||||||
| Image patch QC value | 50% | 94 | 0 | 96 | 6 | 98 | 11 | 100 | 19 | 100 | 24 |
| 60% | 94 | 0 | 98 | 4 | 98 | 9 | 98 | 17 | 100 | 22 | |
| 70% | 94 | 0 | 98 | 6 | 98 | 9 | 98 | 15 | 100 | 20 | |
| 80% | 94 | 0 | 98 | 4 | 98 | 9 | 98 | 13 | 100 | 19 | |
| 90% | 96 | 0 | 98 | 4 | 98 | 7 | 98 | 9 | 100 | 19 | |
| B. ADC, SqCC, and SCLC Cases | |||||||||||
| Image patch QC value | 50% | 94 | 0 | 96 | 6 | 98 | 13 | 100 | 21 | 100 | 27 |
| 60% | 94 | 0 | 98 | 4 | 98 | 10 | 97 | 19 | 100 | 25 | |
| 70% | 94 | 0 | 98 | 6 | 98 | 10 | 98 | 17 | 100 | 23 | |
| 80% | 94 | 0 | 98 | 4 | 98 | 10 | 98 | 15 | 100 | 21 | |
| 90% | 96 | 0 | 98 | 4 | 98 | 8 | 98 | 10 | 100 | 21 | |
| C. ADC and SqCC Cases | |||||||||||
| Image patch QC value | 50% | 91 | 0 | 93 | 9 | 96 | 19 | 100 | 31 | 100 | 41 |
| 60% | 91 | 0 | 97 | 6 | 96 | 16 | 96 | 28 | 100 | 38 | |
| 70% | 91 | 0 | 97 | 9 | 96 | 16 | 96 | 25 | 100 | 34 | |
| 80% | 91 | 0 | 97 | 6 | 96 | 16 | 96 | 22 | 100 | 31 | |
| 90% | 94 | 0 | 97 | 6 | 96 | 13 | 96 | 16 | 100 | 31 | |
© 2020 by the authors. Licensee MDPI, Basel, Switzerland. This article is an open access article distributed under the terms and conditions of the Creative Commons Attribution (CC BY) license (http://creativecommons.org/licenses/by/4.0/).
Share and Cite
Kriegsmann, M.; Haag, C.; Weis, C.-A.; Steinbuss, G.; Warth, A.; Zgorzelski, C.; Muley, T.; Winter, H.; Eichhorn, M.E.; Eichhorn, F.; et al. Deep Learning for the Classification of Small-Cell and Non-Small-Cell Lung Cancer. Cancers 2020, 12, 1604. https://doi.org/10.3390/cancers12061604
Kriegsmann M, Haag C, Weis C-A, Steinbuss G, Warth A, Zgorzelski C, Muley T, Winter H, Eichhorn ME, Eichhorn F, et al. Deep Learning for the Classification of Small-Cell and Non-Small-Cell Lung Cancer. Cancers. 2020; 12(6):1604. https://doi.org/10.3390/cancers12061604
Chicago/Turabian StyleKriegsmann, Mark, Christian Haag, Cleo-Aron Weis, Georg Steinbuss, Arne Warth, Christiane Zgorzelski, Thomas Muley, Hauke Winter, Martin E. Eichhorn, Florian Eichhorn, and et al. 2020. "Deep Learning for the Classification of Small-Cell and Non-Small-Cell Lung Cancer" Cancers 12, no. 6: 1604. https://doi.org/10.3390/cancers12061604
APA StyleKriegsmann, M., Haag, C., Weis, C.-A., Steinbuss, G., Warth, A., Zgorzelski, C., Muley, T., Winter, H., Eichhorn, M. E., Eichhorn, F., Kriegsmann, J., Christopoulos, P., Thomas, M., Witzens-Harig, M., Sinn, P., von Winterfeld, M., Heussel, C. P., Herth, F. J. F., Klauschen, F., ... Kriegsmann, K. (2020). Deep Learning for the Classification of Small-Cell and Non-Small-Cell Lung Cancer. Cancers, 12(6), 1604. https://doi.org/10.3390/cancers12061604