CD34+CD38−CD123+ Leukemic Stem Cell Frequency Predicts Outcome in Older Acute Myeloid Leukemia Patients Treated by Intensive Chemotherapy but Not Hypomethylating Agents

 , , , ,
Abstract
1. Introduction
2. Results
2.1. Characteristics and Outcome of Patients According to Treatment Choice
2.2. CD34+CD38−CD123+ Leukemic Stem Cells at Diagnosis
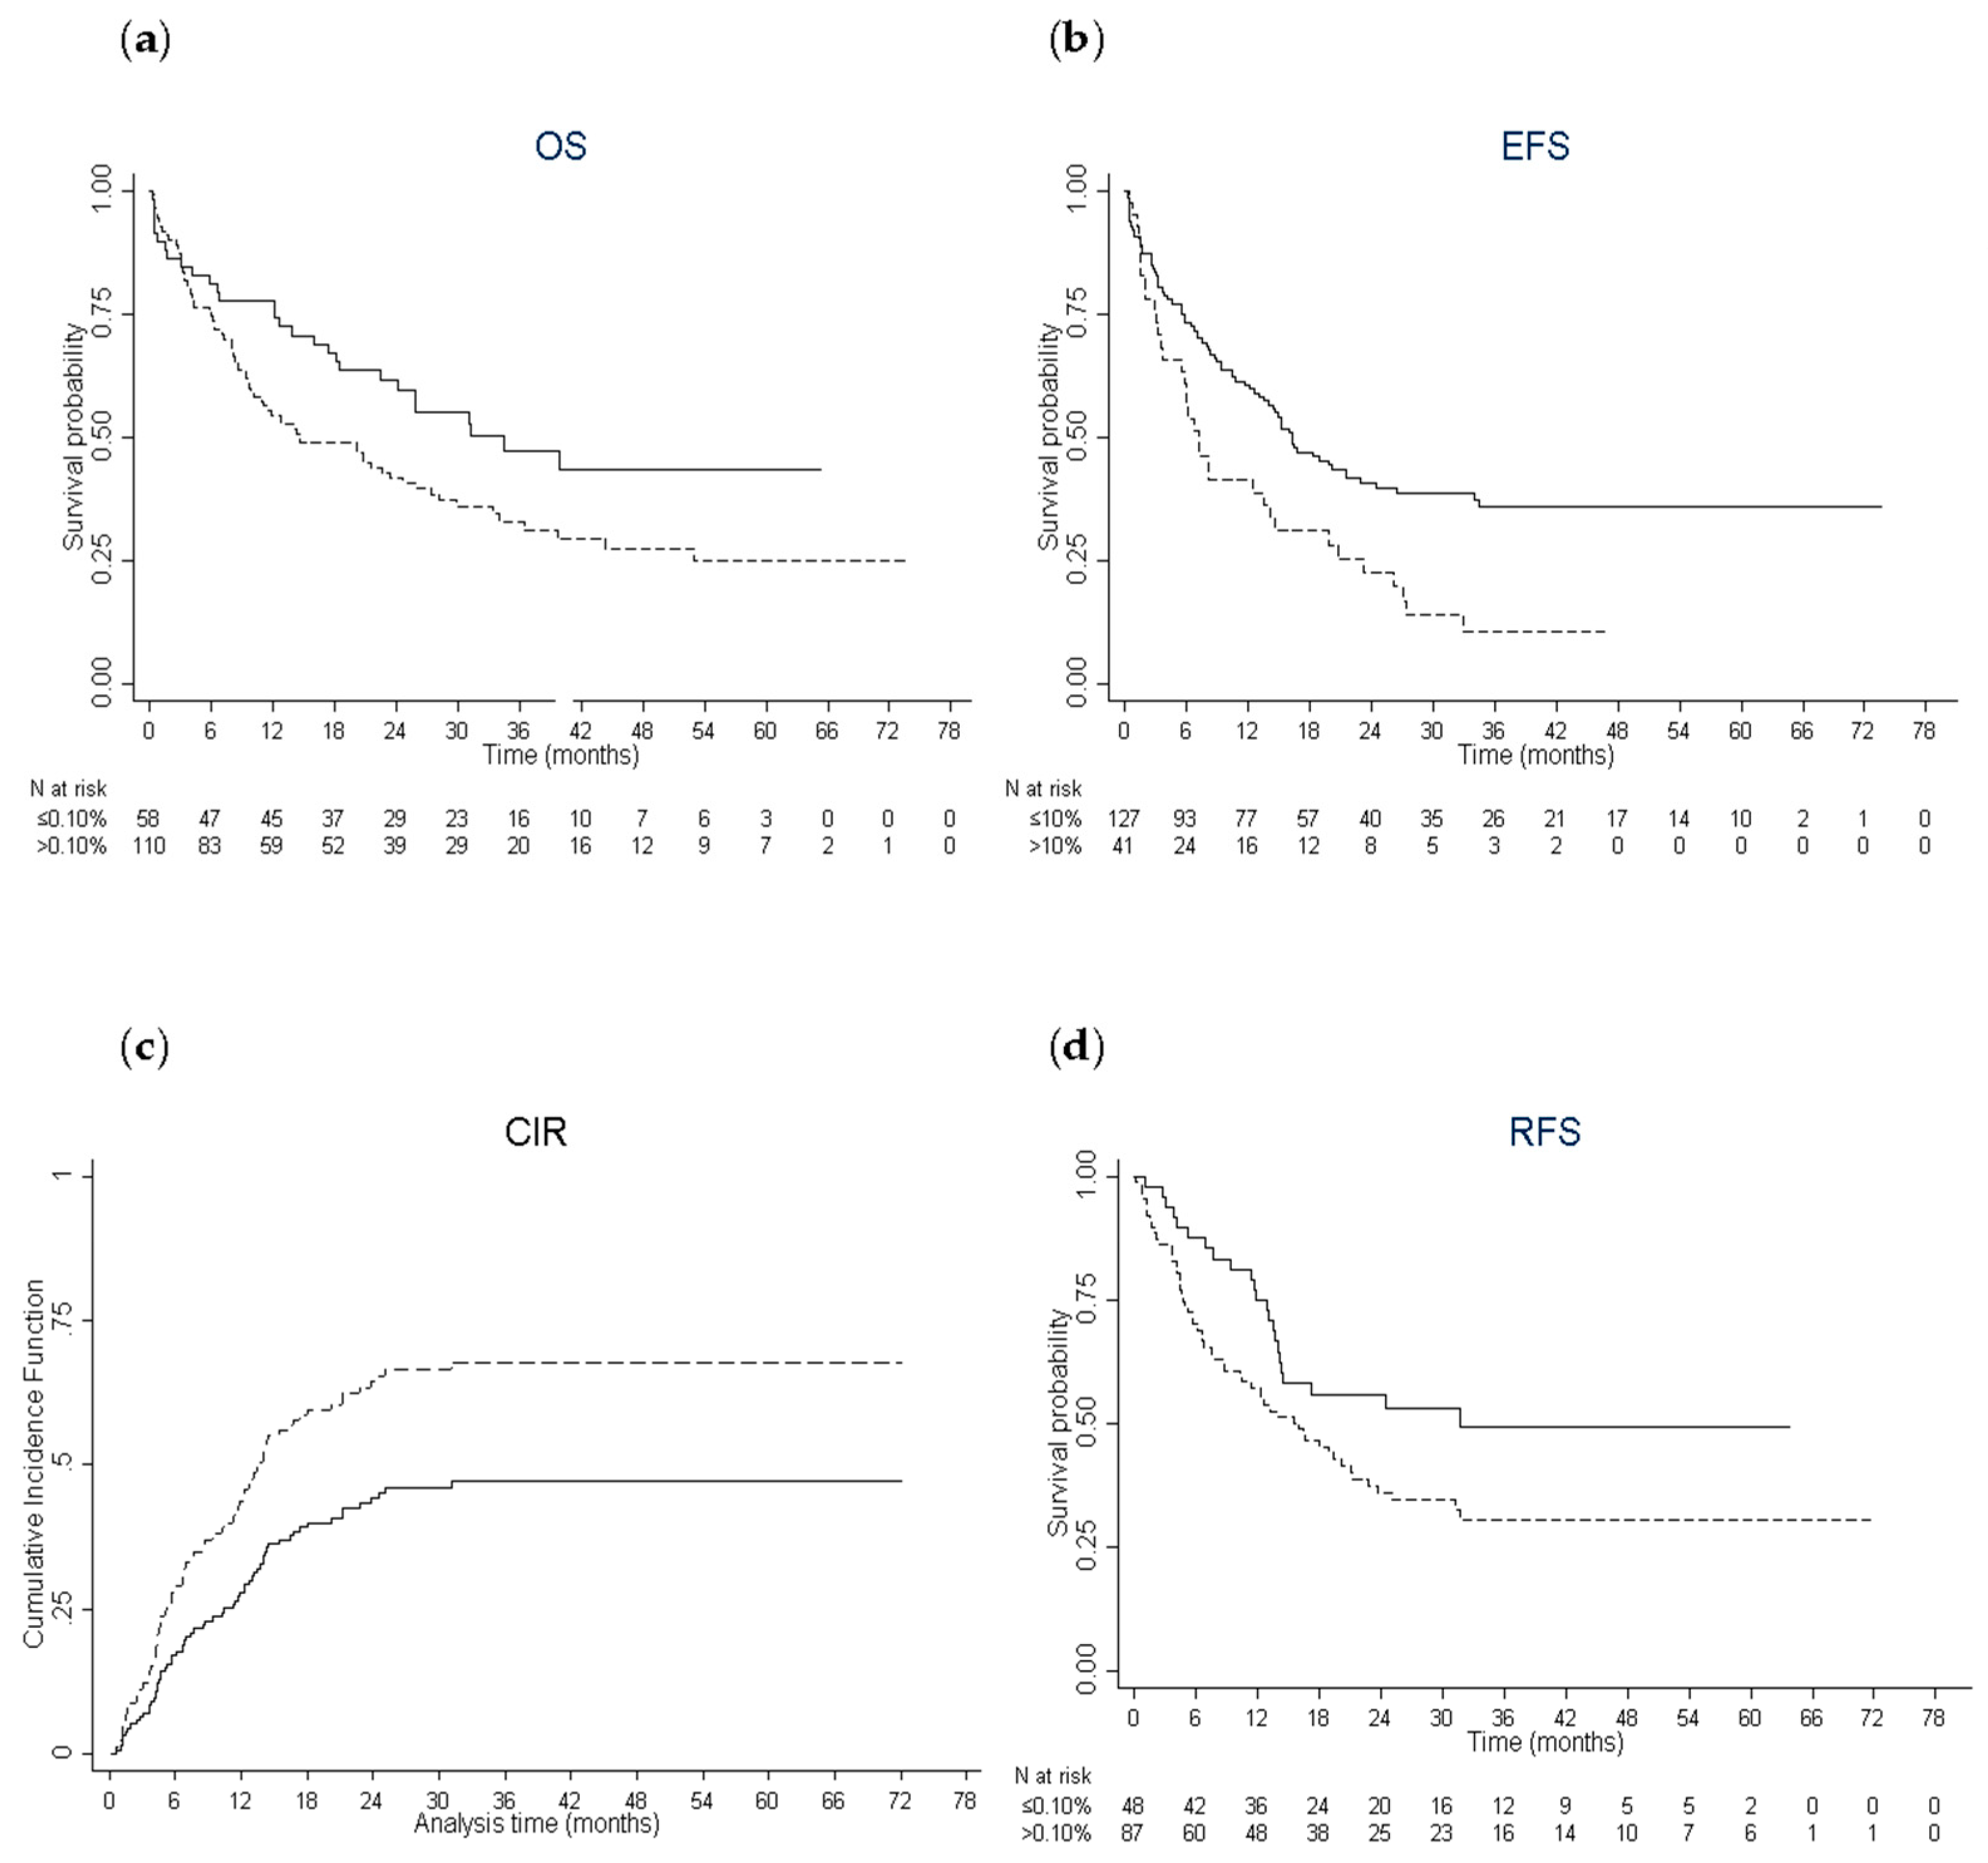
2.3. Prognostic Impact of CD34+CD38−CD123+ Leukemic Stem Cells in Patients Treated by Intensive Chemotherapy
2.4. Characteristics of Older AML Patients Treated by Intensive Chemotherapy With a High Leukemic Stem Cell Burden
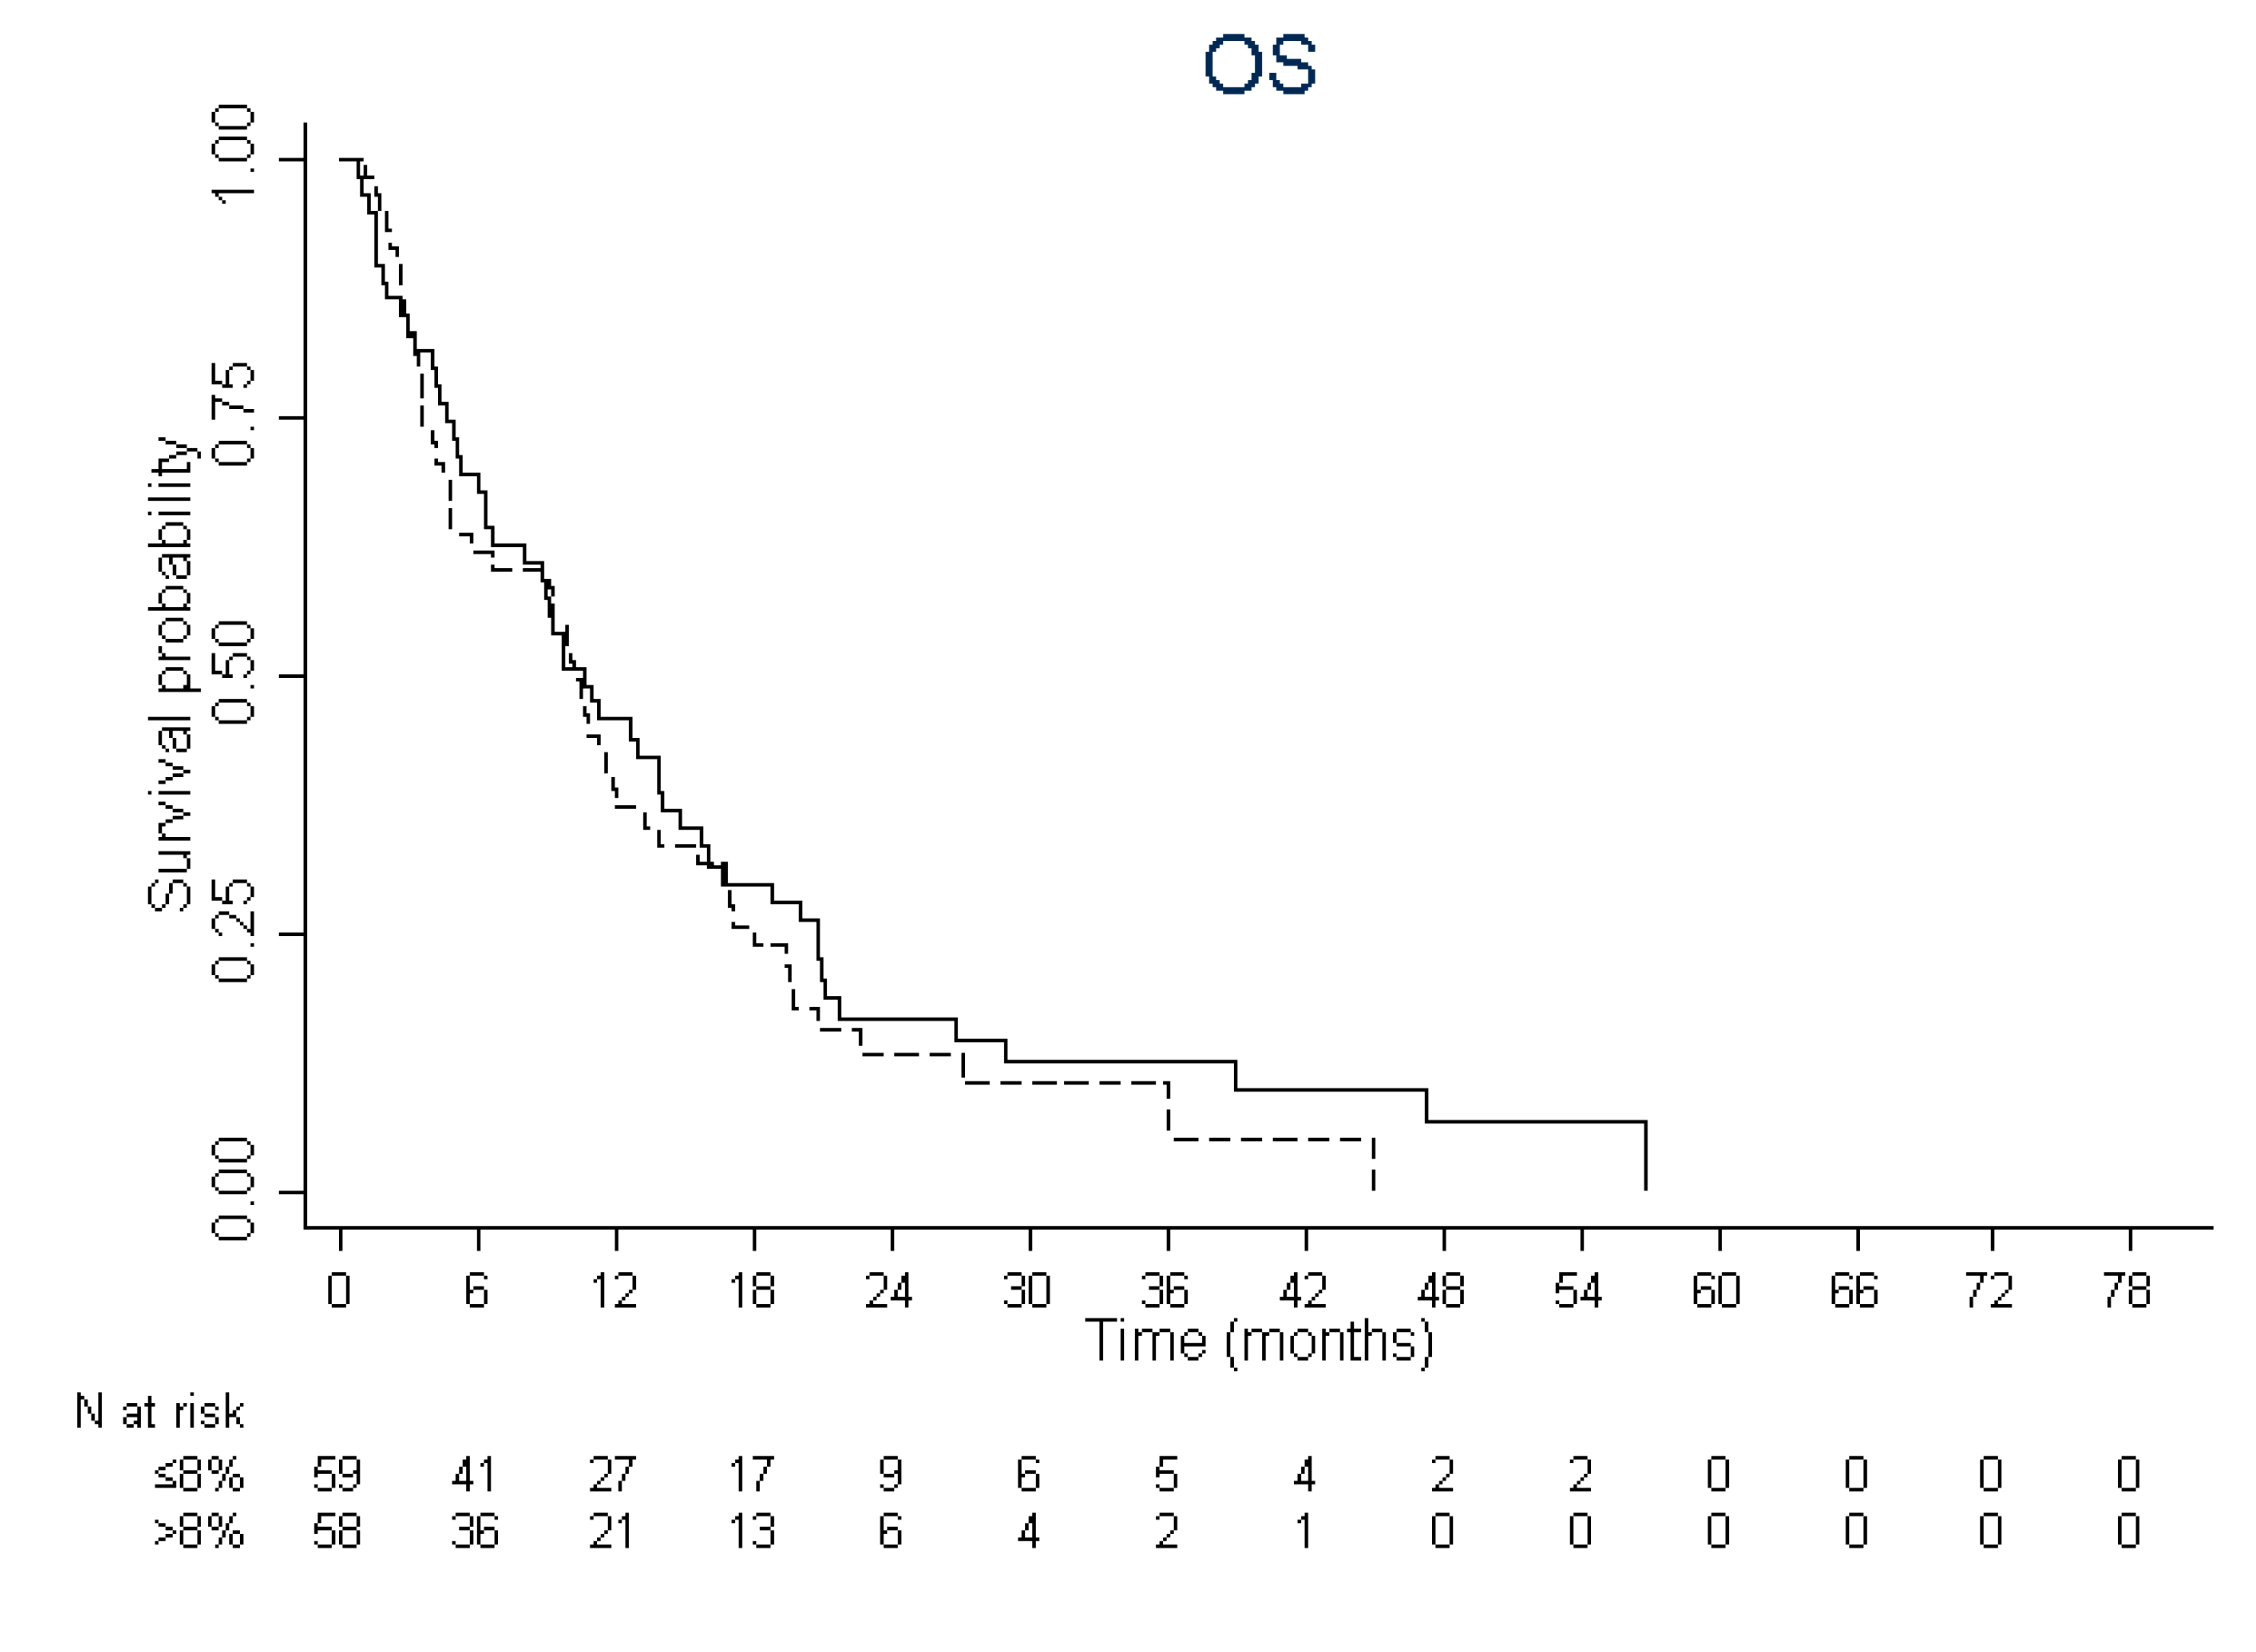
2.5. Prognostic Impact of CD34+CD38−CD123+ Leukemic Stem Cells in Patients Treated by Hypomethylating Agents
3. Discussion
4. Materials and Methods
4.1. Patients
4.2. Assessment of Efficacy
4.3. Analysis of Leukemic Stem Cells
4.4. Statistical Analyses
5. Conclusions
Supplementary Materials
Author Contributions
Funding
Acknowledgments
Conflicts of Interest
References
- Dick, J.E. Stem cell concepts renew cancer research. Blood 2008, 112, 4793–4807. [Google Scholar] [CrossRef]
- Bonnet, D.; Dick, J.E. Human acute myeloid leukemia is organized as a hierarchy that originates from a primitive hematopoietic cell. Nat. Med. 1997, 3, 730–737. [Google Scholar] [CrossRef] [PubMed]
- Sarry, J.E.; Murphy, K.; Perry, R.; Sanchez, P.V.; Secreto, A.; Keefer, C.; Swider, C.R.; Strzelecki, A.C.; Cavelier, C.; Recher, C.; et al. Human acute myelogenous leukemia stem cells are rare and heterogeneous when assayed in NOD/SCID/IL2Rgammac-deficient mice. J. Clin. Investig. 2011, 121, 384–395. [Google Scholar] [CrossRef] [PubMed]
- Costello, R.T.; Mallet, F.; Gaugler, B.; Sainty, D.; Arnoulet, C.; Gastaut, J.A.; Olive, D. Human acute myeloid leukemia CD34+/CD38- progenitor cells have decreased sensitivity to chemotherapy and Fas-induced apoptosis, reduced immunogenicity, and impaired dendritic cell transformation capacities. Cancer Res. 2000, 60, 4403–4411. [Google Scholar] [PubMed]
- Ishikawa, F.; Yoshida, S.; Saito, Y.; Hijikata, A.; Kitamura, H.; Tanaka, S.; Nakamura, R.; Tanaka, T.; Tomiyama, H.; Saito, N.; et al. Chemotherapy-resistant human AML stem cells home to and engraft within the bone-marrow endosteal region. Nat. Biotechnol. 2007, 25, 1315–1321. [Google Scholar] [CrossRef]
- Thomas, D.; Powell, J.A.; Vergez, F.; Segal, D.H.; Nguyen, N.Y.; Baker, A.; Teh, T.C.; Barry, E.F.; Sarry, J.E.; Lee, E.M.; et al. Targeting acute myeloid leukemia by dual inhibition of PI3K signaling and Cdk9-mediated Mcl-1 transcription. Blood 2013, 122, 738–748. [Google Scholar] [CrossRef] [PubMed]
- Ng, S.W.; Mitchell, A.; Kennedy, J.A.; Chen, W.C.; McLeod, J.; Ibrahimova, N.; Arruda, A.; Popescu, A.; Gupta, V.; Schimmer, A.D.; et al. A 17-gene stemness score for rapid determination of risk in acute leukaemia. Nature 2016, 540, 433–437. [Google Scholar] [CrossRef]
- Ho, T.C.; LaMere, M.; Stevens, B.M.; Ashton, J.M.; Myers, J.R.; O’Dwyer, K.M.; Liesveld, J.L.; Mendler, J.H.; Guzman, M.; Morrissette, J.D.; et al. Evolution of acute myelogenous leukemia stem cell properties after treatment and progression. Blood 2016, 128, 1671–1678. [Google Scholar] [CrossRef]
- Hackl, H.; Steinleitner, K.; Lind, K.; Hofer, S.; Tosic, N.; Pavlovic, S.; Suvajdzic, N.; Sill, H.; Wieser, R. A gene expression profile associated with relapse of cytogenetically normal acute myeloid leukemia is enriched for leukemia stem cell genes. Leuk Lymphoma 2015, 56, 1126–1128. [Google Scholar] [CrossRef]
- Vergez, F.; Green, A.S.; Tamburini, J.; Sarry, J.E.; Gaillard, B.; Cornillet-Lefebvre, P.; Pannetier, M.; Neyret, A.; Chapuis, N.; Ifrah, N.; et al. High levels of CD34+CD38low/-CD123+ blasts are predictive of an adverse outcome in acute myeloid leukemia: A Groupe Ouest-Est des Leucemies Aigues et Maladies du Sang (GOELAMS) study. Haematologica 2011, 96, 1792–1798. [Google Scholar] [CrossRef]
- Jordan, C.T.; Upchurch, D.; Szilvassy, S.J.; Guzman, M.L.; Howard, D.S.; Pettigrew, A.L.; Meyerrose, T.; Rossi, R.; Grimes, B.; Rizzieri, D.A.; et al. The interleukin-3 receptor alpha chain is a unique marker for human acute myelogenous leukemia stem cells. Leukemia 2000, 14, 1777–1784. [Google Scholar] [CrossRef] [PubMed]
- van Rhenen, A.; Feller, N.; Kelder, A.; Westra, A.H.; Rombouts, E.; Zweegman, S.; van der Pol, M.A.; Waisfisz, Q.; Ossenkoppele, G.J.; Schuurhuis, G.J. High stem cell frequency in acute myeloid leukemia at diagnosis predicts high minimal residual disease and poor survival. Clin. Cancer Res. 2005, 11, 6520–6527. [Google Scholar] [CrossRef] [PubMed]
- Zeijlemaker, W.; Grob, T.; Meijer, R.; Hanekamp, D.; Kelder, A.; Carbaat-Ham, J.C.; Oussoren-Brockhoff, Y.J.M.; Snel, A.N.; Veldhuizen, D.; Scholten, W.J.; et al. CD34(+)CD38(-) leukemic stem cell frequency to predict outcome in acute myeloid leukemia. Leukemia 2019, 33, 1102–1112. [Google Scholar] [CrossRef] [PubMed]
- Khan, N.; Freeman, S.D.; Virgo, P.; Couzens, S.; Richardson, P.; Thomas, I.; Grech, A.; Vyas, P.; Grimwade, D.; Russell, N.H.; et al. An immunophenotypic pre-treatment predictor for poor response to induction chemotherapy in older acute myeloid leukaemia patients: Blood frequency of CD34+ CD38 low blasts. Br. J. Haematol. 2015, 170, 80–84. [Google Scholar] [CrossRef] [PubMed]
- Bertoli, S.; Paubelle, E.; Bérard, E.; Saland, E.; Thomas, X.; Tavitian, S.; Larcher, M.V.; Vergez, F.; Delabesse, E.; Sarry, A.; et al. Ferritin heavy/light chain (FTH1/FTL) expression, serum ferritin levels, and their functional as well as prognostic roles in acute myeloid leukemia. Eur. J. Haematol. 2019, 102, 131–142. [Google Scholar] [CrossRef]
- Craddock, C.; Quek, L.; Goardon, N.; Freeman, S.; Siddique, S.; Raghavan, M.; Aztberger, A.; Schuh, A.; Grimwade, D.; Ivey, A.; et al. Azacitidine fails to eradicate leukemic stem/progenitor cell populations in patients with acute myeloid leukemia and myelodysplasia. Leukemia 2013, 27, 1028–1036. [Google Scholar] [CrossRef]
- Merlevede, J.; Droin, N.; Qin, T.; Meldi, K.; Yoshida, K.; Morabito, M.; Chautard, E.; Auboeuf, D.; Fenaux, P.; Braun, T.; et al. Mutation allele burden remains unchanged in chronic myelomonocytic leukaemia responding to hypomethylating agents. Nat. Commun. 2016, 7, 10767. [Google Scholar] [CrossRef]
- Lagadinou, E.D.; Sach, A.; Callahan, K.; Rossi, R.M.; Neering, S.J.; Minhajuddin, M.; Ashton, J.M.; Pei, S.; Grose, V.; O’Dwyer, K.M.; et al. BCL-2 inhibition targets oxidative phosphorylation and selectively eradicates quiescent human leukemia stem cells. Cell Stem Cell 2013, 12, 329–341. [Google Scholar] [CrossRef]
- Pollyea, D.A.; Stevens, B.M.; Jones, C.L.; Winters, A.; Pei, S.; Minhajuddin, M.; D’Alessandro, A.; Culp-Hill, R.; Riemondy, K.A.; Gillen, A.E.; et al. Venetoclax with azacitidine disrupts energy metabolism and targets leukemia stem cells in patients with acute myeloid leukemia. Nat. Med. 2018, 24, 1859–1866. [Google Scholar] [CrossRef]
- DiNardo, C.D.; Tiong, I.S.; Quaglieri, A.; MacRaild, S.; Loghavi, S.; Brown, F.C.; Thijssen, R.; Pomilio, G.; Ivey, A.; Salmon, J.M.; et al. Molecular patterns of response and treatment failure after frontline venetoclax combinations in older patients with AML. Blood 2020, 135, 791–803. [Google Scholar] [CrossRef]
- Farge, T.; Saland, E.; de Toni, F.; Aroua, N.; Hosseini, M.; Perry, R.; Bosc, C.; Sugita, M.; Stuani, L.; Fraisse, M.; et al. Chemotherapy-resistant human acute myeloid leukemia cells are not enriched for leukemic stem cells but require oxidative metabolism. Cancer Discov. 2017, 7, 716–735. [Google Scholar] [CrossRef]
- Bosc, C.; Selak, M.A.; Sarry, J.E. Resistance is futile: Targeting mitochondrial energetics and metabolism to overcome drug resistance in cancer treatment. Cell Metab. 2017, 26, 705–707. [Google Scholar] [CrossRef]
- Grimwade, D.; Hills, R.K.; Moorman, A.V.; Walker, H.; Chatters, S.; Goldstone, A.H.; Wheatley, K.; Harrison, C.J.; Burnett, A.K.; National Cancer Research Institute Adult Leukaemia Working Group. Refinement of cytogenetic classification in acute myeloid leukemia: Determination of prognostic significance of rare recurring chromosomal abnormalities among 5876 younger adult patients treated in the United Kingdom Medical Research Council trials. Blood 2010, 116, 354–365. [Google Scholar] [CrossRef]
- Dohner, H.; Estey, E.H.; Amadori, S.; Appelbaum, F.R.; Buchner, T.; Burnett, A.K.; Dombret, H.; Fenaux, P.; Grimwade, D.; Larson, R.A.; et al. Diagnosis and management of acute myeloid leukemia in adults: Recommendations from an international expert panel, on behalf of the European LeukemiaNet. Blood 2009, 115, 453–474. [Google Scholar] [CrossRef] [PubMed]
- Bories, P.; Bertoli, S.; Berard, E.; Laurent, J.; Duchayne, E.; Sarry, A.; Delabesse, E.; Beyne-Rauzy, O.; Huguet, F.; Recher, C. Intensive chemotherapy, azacitidine, or supportive care in older acute myeloid leukemia patients: An analysis from a regional healthcare network. Am. J. Hematol. 2014, 89, E244–E252. [Google Scholar] [CrossRef] [PubMed]
- Bertoli, S.; Tavitian, S.; Huynh, A.; Borel, C.; Guenounou, S.; Luquet, I.; Delabesse, E.; Sarry, A.; Laurent, G.; Attal, M.; et al. Improved outcome for AML patients over the years 2000–2014. Blood Cancer J. 2017, 7, 635. [Google Scholar] [CrossRef] [PubMed]
- Pigneux, A.; Bene, M.C.; Salmi, L.R.; Dumas, P.Y.; Delaunay, J.; Bonmati, C.; Guieze, R.; Luquet, I.; Cornillet-Lefebvre, P.; Delabesse, E.; et al. Improved survival by adding lomustine to conventional chemotherapy for elderly patients with AML without unfavorable cytogenetics: Results of the LAM-SA 2007 FILO trial. J. Clin. Oncol. 2018, 36, 3203–3210. [Google Scholar] [CrossRef]
- Dohner, H.; Estey, E.; Grimwade, D.; Amadori, S.; Appelbaum, F.R.; Buchner, T.; Dombret, H.; Ebert, B.L.; Fenaux, P.; Larson, R.A.; et al. Diagnosis and management of AML in adults: 2017 ELN recommendations from an international expert panel. Blood 2017, 129, 424–447. [Google Scholar] [CrossRef]
- Machin, D.; Campbell, M.J.; Tan, S.-B.; Tan, S.-H. Sample Size Tables for Clinical Studies, 3rd ed.; Wiley-Blackwell: Oxford, UK, 2011; p. 264. [Google Scholar]
- Fine, J.P.; Gray, R.J. A Proportional hazards model for the subdistribution of a competing risk. J. Am. Stat. Assoc. 1999, 94, 496–509. [Google Scholar] [CrossRef]
- Altman, D.G.; Lausen, B.; Sauerbrei, W.; Schumacher, M. Dangers of using “optimal” cutpoints in the evaluation of prognostic factors. J. Natl. Cancer Inst. 1994, 86, 829–835. [Google Scholar] [CrossRef]
- Marrie, R.A.; Dawson, N.V.; Garland, A. Quantile regression and restricted cubic splines are useful for exploring relationships between continuous variables. J. Clin. Epidemiol. 2009, 62, 511–517. [Google Scholar] [CrossRef] [PubMed]
- Royston, P.; Altman, D.G.; Sauerbrei, W. Dichotomizing continuous predictors in multiple regression: A bad idea. Stat. Med. 2006, 25, 127–141. [Google Scholar] [CrossRef] [PubMed]
- Harrel, F.E., Jr. Regression Modeling Strategies: With Applications to Linear Models, Logistic Regression, and Survival Analysis; Springer: New York, NY, USA, 2001. [Google Scholar]


| Characteristics | Intensive Chemo N = 168 | HMA N = 117 | LDAC N = 16 | Supportive Care N = 143 | p-Value |
|---|---|---|---|---|---|
| Sex, n. (%) | 0.5142 | ||||
| Male | 96 (57.1) | 66 (56.4) | 9 (56.3) | 92 (64.3) | |
| Female | 72 (42.9) | 51 (43.6) | 7 (43.8) | 51 (35.7) | |
| Age, years | |||||
| Median (IQR) | 66.9 (63.6–71.8) | 76.5 (72.0–81.8) | 76.7 (72.7–80.2) | 79.5 (73.4–84.6) | <0.0001 |
| ≤70, n. (%) | 113 (67.3) | 21 (17.9) | 3 (18.8) | 19 (13.3) | |
| 70–80, n. (%) | 55 (32.7) | 57 (48.7) | 9 (56.3) | 58 (40.6) | <0.0001 |
| >80, n. (%) | 0 (0.0) | 39 (33.3) | 4 (25.0) | 66 (46.2) | |
| CCI ≥1, n. (%) | 50 (29.9) | 47 (41.2) | 8 (50.0) | 74 (64.3) | <0.0001 |
| ECOG PS, n. (%) | 0.0004 | ||||
| 0–1 | 115 (70.6) | 71 (67.6) | 8 (53.3) | 47 (46.1) | |
| 2–4 | 48 (29.4) | 34 (32.4) | 7 (46.7) | 55 (53.9) | |
| EMD, n. (%) | 0.0007 | ||||
| No | 117 (69.6) | 99 (86.8) | 8 (50.0) | 82 (77.4) | |
| Yes | 51 (30.4) | 15 (13.2) | 8 (50.0) | 24 (22.6) | |
| AML subtype, n. (%) | <0.0001 | ||||
| De novo AML | 124 (73.8) | 52 (44.4) | 6 (37.5) | 65 (48.9) | |
| Secondary | 44 (26.2) | 65 (55.6) | 10 (62.5) | 68 (51.1) | |
| FAB, n. (%) | <0.0010 | ||||
| M0 | 7 (4.2) | 6 (5.5) | 0 (0.0) | 10 (8.5) | |
| M1 | 41 (24.6) | 12 (11.0) | 4 (26.7) | 18 (15.3) | |
| M2 | 57 (34.1) | 60 (55.1) | 6 (40.0) | 40 (33.9) | |
| M4 | 29 (17.4) | 5 (4.6) | 2 (13.3) | 19 (16.1) | |
| M5 | 15 (9.0) | 4 (3.7) | 2 (13.3) | 8 (6.8) | |
| M6 | 4 (2.4) | 13 (11.9) | 0 (0.0) | 5 (4.2) | |
| Unclassified | 14 (8.4) | 9 (8.3) | 1 (6.7) | 18 (15.3) | |
| WBC, G/L | |||||
| Median (IQR) | 11.6 (2.7–60.8) | 2.7 (1.6–8.5) | 50.0 (7.0–95.8) | 10.9 (2.5–35.7) | <0.0001 |
| Platelet count, G/L | |||||
| Median (IQR) | 64 (39–110) | 73 (39–116) | 48 (23–69) | 53 (26–98) | 0.0117 |
| BM blasts, % | |||||
| Median (IQR) | 57 (35–82) | 32 (25–52) | 43 (22–92) | 43 (30–71) | <0.0001 |
| ≤30, n. (%) | 29 (17.5) | 52 (46.0) | 5 (33.3) | 37 (30.3) | <0.0001 |
| >30, n. (%) | 137 (82.5) | 61 (54.0) | 10 (66.7) | 85 (69.7) | |
| MLD, n. (%) | 0.0039 | ||||
| Yes | 20 (12.3) | 32 (29.6) | 2 (14.3) | 19 (17.3) | |
| No | 143 (87.7) | 76 (70.4) | 12 (85.7) | 91 (82.7) | |
| Cytogenetics, n. (%) | <0.0001 | ||||
| Favorable | 8 (4.8) | 0 (0.0) | 0 (0.0) | 1 (0.8) | |
| Intermediate | 130 (77.4) | 59 (51.3) | 8 (50.0) | 59 (46.8) | |
| Adverse | 30 (17.9) | 56 (48.7) | 8 (50.0) | 66 (52.4) | |
| ELN 2010, n. (%) | <0.0001 | ||||
| Favorable | 41 (25.0) | 3 (2.9) | 0 (0.0) | 7 (6.4) | |
| Intermediate-1 | 53 (32.3) | 19 (18.6) | 5 (33.3) | 14 (12.8) | |
| Intermediate-2 | 40 (24.4) | 24 (23.5) | 2 (13.3) | 22 (20.2) | |
| Adverse | 30 (18.3) | 56 (54.9) | 8 (53.3) | 66 (60.6) | |
| FLT3-ITD, n.(%) | 0.0579 | ||||
| Yes | 34 (24.5) | 5 (9.1) | 5 (35.7) | 10 (21.3) | |
| No | 105 (75.5) | 50 (90.9) | 9 (64.3) | 37 (78.7) | |
| NPM1, n. (%) | <0.0001 | ||||
| Yes | 61 (43.9) | 6 (10.9) | 3 (23.1) | 10 (21.3) | |
| No | 78 (56.1) | 49 (89.1) | 10 (76.9) | 37 (78.7) | |
| CEBPA, n. (%) | |||||
| Yes | 5 (9.6) | 1 (16.7) | 0 (0.0) | 0 (0.0) | 0.6632 |
| No | 47 (90.4) | 5 (83.3) | 6 (100.0) | 5 (100.0) | |
| IDH1R132, n. (%) | 0.1334 | ||||
| Yes | 10 (12.5) | 1 (2.5) | 0 (0.0) | 1 (2.9) | |
| No | 70 (87.5) | 39 (97.5) | 3 (100.0) | 34 (97.1) | |
| IDH2R140, n. (%) | 0.0317 | ||||
| Yes | 15 (18.8) | 2 (5.0) | 0 (0.0) | 1 (2.9) | |
| No | 65 (81.3) | 38 (95.0) | 3 (100.0) | 34 (97.1) | |
| IDH2R172, n. (%) | 0.9684 | ||||
| Yes | 3 (3.8) | 1 (2.6) | 0 (0.0) | 1 (2.9) | |
| No | 76 (96.2) | 38 (97.4) | 3 (100.0) | 34 (97.1) | |
| DNMT3A | 0.5094 | ||||
| Yes | 5 (16.7) | 0 (0.0) | 0 (0.0) | 0 (0.0) | |
| No | 25 (83.3) | 3 (100.0) | 0 (0.0) | 4 (100.0) | |
| Albumin, g/L | |||||
| Median (IQR) | 36.0 (31.5–40.0) | 37.0 (34.0–40.0) | 31.5 (30.0–39.0) | 34.0 (27.0–38.0) | <0.0001 |
| ≥30 g/L, n. (%) | 103 (62.8) | 73 (71.6) | 5 (41.7) | 37 (42.5) | 0.0002 |
| <30 g/L, n. (%) | 61 (37.2) | 29 (28.4) | 7 (58.3) | 50 (57.5) | |
| LDH, UI/L | |||||
| Median (IQR) | 499 (287–803) | 407 (214–619) | 622 (316–1076) | 643 (305–1239) | 0.0001 |
| <Normal, n. (%) | 39 (23.4) | 42 (39.3) | 4 (25.0) | 20 (23.0) | 0.0213 |
| >Normal, n. (%) | 128 (76.6) | 65 (60.7) | 12 (75.0) | 67 (77.0) | |
| Creatinine, µmol/L | |||||
| Median (IQR) | 81.0 (69.0–102.5) | 82.5 (65.5–106.0) | 87.5 (67.5–103.0) | 92.0 (71.0–119.0) | 0.1259 |
| Bilirubin, µmol/L | |||||
| Median (IQR) | 8.3 (6.0–10.3) | 9.0 (6.8–14.0) | 7.8 (5.4–11.5) | 10.0 (6.9–15.0) | 0.0040 |
| Fibrinogen, g/L | |||||
| Median (IQR) | 3.9 (3.1–4.8) | 3.9 (3.1–5.0) | 4.0 (2.4–5.8) | 3.7 (3.1–5.0) | 0.9461 |
| Serum ferritin, µg/L | |||||
| Median (IQR) | 713 (372–1321) | 523 (263–1086) | 1007 (651–3468) | 996 (637–2109) | 0.0010 |
| ≤900, n. (%) | 97 (59.5) | 49 (68.1) | 3 (42.9) | 28 (47.5) | 0.0917 |
| >900, n. (%) | 66 (40.5) | 23 (31.9) | 4 (57.1) | 31 (52.5) |
| Clinical Parameters | Intensive Chemo N = 168 | HMA N = 117 | LDAC N = 16 | Supportive Care N = 143 |
|---|---|---|---|---|
| CR, n. (%) | 135 (80.4) | 21 (17.9) | 0 (0.0) | NA |
| Day-30 death, n. (%) | 17 (10.1) | 6 (5.1) | 2 (12.5) | 58 (40.6) |
| Day-60 death, n. (%) | 21 (12.5) | 16 (13.7) | 4 (25.0) | 81 (56.6) |
| EFS | NA | NA | NA | |
| Median, months (IQR) | 14.6 (4.1–NR) | |||
| 1-y, % (95% CI) | 56.0 (48.1–63.1) | |||
| 3-y | 29.6 (22.4–37.1) | |||
| 5-y | 29.6 (22.4–37.1) | |||
| RFS | NA | NA | NA | |
| Median, months (IQR) | 17.3 (6.7–NR) | |||
| 1-y, % (95% CI) | 63.6 (54.8–71.1) | |||
| 3-y | 37.2 (28.4–45.9) | |||
| 5-y | 37.2 (28.4–45.9) | |||
| CIR | ||||
| 1-y, % (95% CI) | 31.9 (24.3–40.0) | |||
| 3-y | 51.8 (42.8–60.4) | |||
| 5-y | 51.8 (42.8–60.4) | |||
| OS | ||||
| Median, months (IQR) | 22.6 (6.2–NR) | 10.5 (4.1–19.6) | 3.6 (2.4–7.0) | 1.1 (0.5–3.5) |
| 1-y, % (95% CI) | 62.5 (54.7–69.3) | 41.6 (32.6–50.3) | 12.5 (2.1–32.8) | 7.7 (3.8–13.3) |
| 3-y | 37.9 (30.0–45.8) | 11.8 (6.4–18.9) | NR | 0.9 (0.1–4.2) |
| 5-y | 31.1 (22.7–39.8) | NR | NR | NR |
| LSCs (%) | Intensive Chemo N = 168 | HMA N = 117 | LDAC N = 16 | Supportive Care N = 143 | p-Value | All Patients N = 444 |
|---|---|---|---|---|---|---|
| Mean (SD) | 8.0 (15.7) | 18.0 (21.9) | 9.7 (14.2) | 20.3 (23.8) | <0.0001 | 14.7 (20.9) |
| Median | 0.6 | 8.0 | 2.3 | 11.1 | 4.3 | |
| IQR | 0.1–8.7 | 1.1–29.9 | 0.4–16.9 | 0.8–36.9 | 0.3–20.2 | |
| Min, Max | 0.0–93.9 | 0.0–85.3 | 0.0–52.7 | 0.0–92.2 | 0.0–93.9 |
| Variable | HR | 95% CI | p-Value |
|---|---|---|---|
| Overall Survival | |||
| LSC >0.10% | 1.85 | 1.18–2.88 | 0.007 |
| WBC >median | 1.84 | 1.44–2.37 | <0.001 |
| Albumin ≥30 g/L | 0.44 | 0.32–0.61 | <0.001 |
| Cytogenetic risk | |||
| Intermediate | 2.13 | 0.86–5.27 | 0.102 |
| Adverse | 3.14 | 1.24–7.93 | 0.015 |
| Event free survival | |||
| LSC >10% | 2.33 | 1.54–3.54 | <0.001 |
| Age 70–80y | 1.62 | 1.08–2.44 | 0.019 |
| Albumin ≥30 G/L | 0.37 | 0.23–0.59 | <0.001 |
| Cytogenetic risk | |||
| Intermediate | 2.06 | 0.75–5.66 | 0.158 |
| Adverse | 4.51 | 1.50–13.57 | 0.007 |
| Allo-SCT | 0.47 | 0.24–0.92 | 0.027 |
| Cumulative incidence of relapse | |||
| LSC >10% | 2.00 | 1.24–3.20 | 0.004 |
| Allo-SCT | 0.27 | 0.12–0.64 | 0.003 |
| Relapse free survival | |||
| LSC >0.1% | 1.75 | 1.06–2.86 | 0.027 |
| Albumin ≥30 g/L | 0.49 | 0.28–0.86 | 0.013 |
| Allo-SCT | 0.51 | 0.27–0.97 | 0.039 |
| LSCs | ≤0.10% N = 58 | >0.10% N = 110 | p-Value | ≤10% N = 127 | >10% N = 41 | p-Value |
|---|---|---|---|---|---|---|
| Sex, n. (%) | 0.7078 | 0.3506 | ||||
| Male | 32 (55.2) | 64 (58.2) | 70 (55.1) | 26 (63.4) | ||
| Female | 26 (44.8) | 46 (41.8) | 57 (44.9) | 15 (36.6) | ||
| Age, years | ||||||
| Median (IQR) | 66.9 (63.4–73.4) | 66.9 (63.8–71.6) | 0.4216 | 66.8 (63.3–72.0) | 67.4 (65.2–70.9) | 0.7761 |
| ≤70, n. (%) | 39 (67.2) | 74 (67.3) | 1.0000 | 84 (66.1) | 29 (70.7) | 0.7026 |
| 70–80, n. (%) | 19 (32.8) | 36 (32.7) | 43 (33.9) | 12 (29.3) | ||
| CCI ≥ 1, n. (%) | 13 (22.4) | 37 (33.9) | 0.1213 | 40 (31.5) | 10 (25.0) | 0.4340 |
| ECOG PS, n. (%) | 0.0251 | 0.0271 | ||||
| 0–1 | 34 (59.6) | 81 (76.4) | 82 (66.1) | 33 (84.6) | ||
| 2–4 | 23 (40.4) | 25 (23.6) | 42 (33.9) | 6 (15.4) | ||
| EMD, n. (%) | 0.6230 | 0.8615 | ||||
| Yes | 19 (32.8) | 32 (29.1) | 39 (30.7) | 12 (29.3) | ||
| No | 39 (67.2) | 78 (70.9) | 88 (69.3) | 29 (70.7) | ||
| AML subtype, n. (%) | 0.0079 | 0.0315 | ||||
| De novo AML | 50 (86.2) | 74 (67.3) | 99 (78.0) | 25 (61.0) | ||
| Secondary | 8 (13.8) | 36 (32.7) | 28 (22.0) | 16 (39.0) | ||
| WBC, G/L Median (IQR) | 26.4 (5.0–92.4) | 7.1 (2.4–42.3) | 0.0046 | 14.5 (2.8–68.8) | 9.7 (2.5–46.0) | 0.2561 |
| Platelet count, G/L Median (IQR) | 56 (29–102) | 65 (39–117) | 0.1261 | 68 (41–110) | 54 (35–95) | 0.1788 |
| BM blasts, % | ||||||
| Median (IQR) | 80 (49–91) | 48 (33–68) | <0.0001 | 57 (36–84) | 55 (35–75) | 0.4144 |
| ≤30, n. (%) | 6 (10.3) | 23 (21.3) | 0.0764 | 22 (17.5) | 7 (17.5) | 0.9954 |
| >30, n. (%) | 52 (89.7) | 85 (78.7) | 104 (82.5) | 33 (82.5) | ||
| MLD, n. (%) | 0.0143 | 0.0996 | ||||
| Yes | 2 (3.6) | 18 (16.8) | 12 (9.8) | 8 (20.0) | ||
| No | 54 (96.4) | 89 (83.2) | 111 (90.2) | 32 (20.0) | ||
| Cytogenetics, n. (%) | 0.2400 | 0.0118 | ||||
| Favorable | 1 (1.7) | 7 (6.4) | 5 (3.9) | 3 (7.3) | ||
| Intermediate | 49 (84.5) | 81 (73.6) | 105 (82.7) | 25 (61.0) | ||
| Adverse | 8 (13.8) | 22 (20.0) | 17 (13.4) | 13 (31.7) | ||
| ELN 2010, n. (%) | 0.2752 | 0.0109 | ||||
| Favorable | 19 (33.9) | 22 (20.4) | 37 (30.1) | 4 (9.8) | ||
| Intermediate-1 | 16 (28.6) | 37 (34.3) | 41 (33.3) | 12 (29.3) | ||
| Intermediate-2 | 13 (23.2) | 27 (25.0) | 28 (22.8) | 12 (29.3) | ||
| Adverse | 8 (14.3) | 22 (20.4) | 17 (13.8) | 13 (31.7) | ||
| FLT3-ITD, n. (%) | 0.1762 | 0.7823 | ||||
| Yes | 15 (31.3) | 19 (20.9) | 27 (25.0) | 7 (22.6) | ||
| No | 33 (68.8) | 72 (79.1) | 81 (75.0) | 24 (77.4) | ||
| NPM1, n. (%) | 0.0003 | <0.0001 | ||||
| Yes | 31 (64.6) | 30 (33.0) | 58 (53.7) | 3 (9.7) | ||
| No | 17 (35.4) | 61 (67.0) | 50 (46.3) | 28 (90.3) | ||
| CEBPA, n. (%) | 0.0656 | 1.0000 | ||||
| Yes | 4 (20.0) | 1 (3.1) | 4 (9.3) | 1 (11.1) | ||
| No | 16 (80.0) | 31 (96.9) | 39 (90.7) | 8 (88.9) | ||
| IDH1R132, n. (%) | 1.0000 | 0.4097 | ||||
| Yes | 4 (12.9) | 6 (12.2) | 7 (10.9) | 3 (18.8) | ||
| No | 27 (87.1) | 43 (87.8) | 57 (89.1) | 13 (81.3) | ||
| IDH2R140, n. (%) | 0.1983 | 0.7228 | ||||
| Yes | 8 (25.8) | 7 (14.3) | 13 (20.3) | 2 (12.5) | ||
| No | 23 (74.2) | 42 (85.7) | 51 (79.7) | 14 (87.5) | ||
| IDH2R172, n. (%) | 1.0000 | 1.0000 | ||||
| Yes | 1 (3.3) | 2 (4.1) | 3 (4.8) | 0 (0.0) | ||
| No | 29 (96.7) | 47 (95.9) | 60 (95.2) | 16 (100.0) | ||
| DNMT3A | 1.0000 | 0.5561 | ||||
| Yes | 2 (16.7) | 3 (16.7) | 5 (20.0) | 0 (0.0) | ||
| No | 10 (83.3) | 15 (83.3) | 20 (80.0) | 5 (100.0) | ||
| Albumin, g/L | ||||||
| Median (IQR) | 35.5 (30.5–40.0) | 36.0 (32.2–40.0) | 0.2653 | 35.0 (30.0–39.0) | 38 (35.0–40.5) | 0.0203 |
| ≥30 g/L, n. (%) | 32 (57.1) | 71 (65.7) | 0.2800 | 73 (58.4) | 30 (76.9) | 0.0366 |
| <30 g/L, n. (%) | 24 (42.9) | 37 (34.3) | 52 (41.6) | 9 (23.1) | ||
| LDH, UI/L | ||||||
| Median (IQR) | 448 (270–836) | 530 (330–781) | 0.9086 | 537 (295–836) | 453 (241–676) | 0.1218 |
| <Normal, n. (%) | 10 (17.5) | 29 (26.4) | 0.2014 | 27 (21.4) | 12 (29.3) | 0.3027 |
| >Normal, n. (%) | 47 (82.5) | 81 (73.6) | 99 (78.6) | 29 (70.7) | ||
| Creatinine, µmol/L | ||||||
| Median (IQR) | 85 (69–108) | 80 (69–100) | 0.4918 | 83 (68–105) | 78 (74–91) | 0.7507 |
| Bilirubin, µmol/L | ||||||
| Median (IQR) | 7.6 (6.0–9.5) | 8.4 (6.1–10.5) | 0.4915 | 8.3 (6.1–10.0) | 8.3 (6.0–11.0) | 0.8970 |
| Fibrinogen, g/L | ||||||
| Median (IQR) | 3.7 (2.9–4.7) | 4.0 (3.3–4.9) | 0.1069 | 4.0 (3.0–4.9) | 3.9 (3.4–4.4) | 0.8074 |
| Serum ferritin, µg/L | ||||||
| Median (IQR) | 956 (554–1809) | 578 (344–1199) | 0.0039 | 761 (376–1477) | 569 (370–862) | 0.0588 |
| ≤900, n. (%) | 26 (46.4) | 71 (66.4) | 0.0138 | 66 (53.7) | 31 (77.5) | 0.0076 |
| >900, n. (%) | 30 (53.6) | 36 (33.6) | 57 (46.3) | 9 (22.5) |
© 2020 by the authors. Licensee MDPI, Basel, Switzerland. This article is an open access article distributed under the terms and conditions of the Creative Commons Attribution (CC BY) license (http://creativecommons.org/licenses/by/4.0/).
Share and Cite
Vergez, F.; Nicolau-Travers, M.-L.; Bertoli, S.; Rieu, J.-B.; Tavitian, S.; Bories, P.; Luquet, I.; De Mas, V.; Largeaud, L.; Sarry, A.; et al. CD34+CD38−CD123+ Leukemic Stem Cell Frequency Predicts Outcome in Older Acute Myeloid Leukemia Patients Treated by Intensive Chemotherapy but Not Hypomethylating Agents. Cancers 2020, 12, 1174. https://doi.org/10.3390/cancers12051174
Vergez F, Nicolau-Travers M-L, Bertoli S, Rieu J-B, Tavitian S, Bories P, Luquet I, De Mas V, Largeaud L, Sarry A, et al. CD34+CD38−CD123+ Leukemic Stem Cell Frequency Predicts Outcome in Older Acute Myeloid Leukemia Patients Treated by Intensive Chemotherapy but Not Hypomethylating Agents. Cancers. 2020; 12(5):1174. https://doi.org/10.3390/cancers12051174
Chicago/Turabian StyleVergez, François, Marie-Laure Nicolau-Travers, Sarah Bertoli, Jean-Baptiste Rieu, Suzanne Tavitian, Pierre Bories, Isabelle Luquet, Véronique De Mas, Laetitia Largeaud, Audrey Sarry, and et al. 2020. "CD34+CD38−CD123+ Leukemic Stem Cell Frequency Predicts Outcome in Older Acute Myeloid Leukemia Patients Treated by Intensive Chemotherapy but Not Hypomethylating Agents" Cancers 12, no. 5: 1174. https://doi.org/10.3390/cancers12051174
APA StyleVergez, F., Nicolau-Travers, M.-L., Bertoli, S., Rieu, J.-B., Tavitian, S., Bories, P., Luquet, I., De Mas, V., Largeaud, L., Sarry, A., Huguet, F., Delabesse, E., Bérard, E., & Récher, C. (2020). CD34+CD38−CD123+ Leukemic Stem Cell Frequency Predicts Outcome in Older Acute Myeloid Leukemia Patients Treated by Intensive Chemotherapy but Not Hypomethylating Agents. Cancers, 12(5), 1174. https://doi.org/10.3390/cancers12051174