Article

Downstream Effectors of ILK in Cisplatin-Resistant Ovarian Cancer

by
Jeyshka M. Reyes-González
1,
Blanca I. Quiñones-Díaz
1,
Yasmarie Santana
2,
Perla M. Báez-Vega
3,
Daniel Soto
4,
Fatima Valiyeva
3,
María J. Marcos-Martínez
5,6,
Ricardo J. Fernández-de Thomas
7 and
Pablo E. Vivas-Mejía
1,3,*
1
Department of Biochemistry, Medical Sciences Campus, University of Puerto Rico, San Juan, PR 00936, USA
2
Center for Collaborative Research in Health Disparities (CCRHD), Medical Sciences Campus, University of Puerto Rico, San Juan, PR 00936, USA
3
Comprehensive Cancer Center, University of Puerto Rico, San Juan, PR 00936, USA
4
Department of Biology, Rio Piedras Campus, University of Puerto Rico, San Juan, PR 00931, USA
5
Department of Pathology and Laboratory Medicine, Medical Sciences Campus, University of Puerto Rico, San Juan, PR 00936, USA
6
Anatomic Pathology Laboratory, Puerto Rico Medical Services Administration, San Juan, PR 00935, USA
7
School of Medicine, Medical Sciences Campus, University of Puerto Rico, San Juan, PR 00936, USA
*
Author to whom correspondence should be addressed.
Cancers 2020, 12(4), 880; https://doi.org/10.3390/cancers12040880
Submission received: 23 March 2020 / Accepted: 31 March 2020 / Published: 4 April 2020
(This article belongs to the Special Issue Targeted Cancer Therapy)

Abstract

:
Despite good responses to first-line treatment with platinum-based combination chemotherapy, most ovarian cancer patients will relapse and eventually develop platinum-resistant disease with poor prognosis. Although reports suggest that integrin-linked kinase (ILK) is a potential target for ovarian cancer treatment, identification of ILK downstream effectors has not been fully explored. The purpose of this study was to investigate the molecular and biological effects of targeting ILK in cisplatin-resistant ovarian cancer. Western blot analysis showed that phosphorylation levels of ILK were higher in cisplatin-resistant compared with cisplatin-sensitive ovarian cancer cells. Further immunohistochemical analysis of ovarian cancer patient samples showed a significant increase in phosphorylated ILK levels in the tumor tissue when compared to normal ovarian epithelium. Targeting ILK by small-interfering RNA (siRNA) treatment reduced cisplatin-resistant cell growth and invasion ability, and increased apoptosis. Differential gene expression analysis by RNA sequencing (RNA-Seq) upon ILK-siRNA transfection followed by Ingenuity Pathway Analysis (IPA) and survival analysis using the Kaplan–Meier plotter database identified multiple target genes involved in cell growth, apoptosis, invasion, and metastasis, including several non-coding RNAs. Taken together, results from this study support ILK as an attractive target for ovarian cancer and provide potential ILK downstream effectors with prognostic and therapeutic value.

1. Introduction

Ovarian cancer remains a significant cause of female cancer-related deaths, with approximately 21,750 new cases and 13,940 deaths for 2020 in the US [1]. Its high death rate is reflective of the fact that most ovarian cancer patients are diagnosed with advanced-stage disease [2]. Epithelial ovarian cancer (EOC)—the most common type of ovarian malignancies—is a complex group of diseases that, based on histopathology and molecular genetic alterations, could be divided into five main types including high-grade serous, endometrioid, clear-cell, mucinous, and low-grade serous carcinomas [3,4,5]. High-grade serous ovarian cancer (HGSOC) represents 70% of all EOCs [5]. Despite initial response to first-line treatment with platinum-based combination chemotherapy, most HGSOC patients will relapse and eventually develop platinum-resistant disease with a poor overall prognosis [6]. Therefore, novel therapies targeting key survival pathways are urgently needed to improve clinical outcomes for women with this deadly disease.
Integrin-linked kinase (ILK) is a highly-conserved serine/threonine kinase and adaptor protein connecting the extracellular matrix (ECM), cell membrane-associated proteins (i.e., integrins), and cell signaling pathways [7,8]. ILK activity is stimulated by integrins and growth factors in a phosphatidylinositol 3-kinase (PI3K)-dependent manner [9]. On the other hand, ILK is negatively regulated by phosphatase and tensin homolog (PTEN) and ILK-associated serine/threonine phosphatase 2C (ILKAP) [9]. In addition, ILK-mediated signaling and intracellular translocation is regulated by p21-activated kinase 1 (PAK1) through ILK phosphorylation at threonine 173 (T173) and serine 246 (S246) residues [10]. Once activated, ILK can mediate a variety of cellular functions through regulation of its downstream targets including protein kinase B (AKT), glycogen synthase kinase 3β (GSK3β), and nuclear factor kappa B (NFκB) [11].
Increased levels of ILK have been associated with cancer progression, epithelial to mesenchymal transition (EMT), angiogenesis, and metastasis [7,8,9,12,13]. In ovarian cancer, ILK expression has been previously associated with tumor progression [14]. Early reports show that subcutaneous injection of ovarian cancer cells transfected with either ILK-short hairpin RNA (shRNA) or ILK-antisense oligonucleotides (ASOs) suppresses tumor formation [15] and growth [16] in vivo. Other studies have shown that ILK activity modulates the pro-metastatic behavior of ovarian cancer [17] by stimulating cell invasion and migration [18]. Moreover, increased ILK activation has been shown to protect platinum-resistant ovarian cancer cells from cisplatin-induced apoptosis [19]. Targeting ILK abrogates the invasive potential of ovarian cancer cells [15], induces apoptosis [20,21], and decreases cell viability [22].
The molecular and biological effects of siRNA-mediated ILK targeting in cisplatin-resistant ovarian cancer and the identification of associated downstream effectors have not been fully explored. In this study, we assessed the phosphorylation levels of ILK in ovarian cancer cell lines and tissue samples and investigated the effects of targeting ILK in cisplatin-resistant ovarian cancer. We report that targeting ILK with siRNA induces significant changes in the expression of several cancer-associated protein-coding genes and non-coding RNAs involved in cell growth, survival, and metastasis. Expression-based survival analysis using the Kaplan–Meier (KM) plotter database revealed significant associations between potential ILK target genes and ovarian cancer prognosis. Results from this study suggest that ILK-regulated genes may serve as potential prognostic markers and therapeutic targets in ovarian cancer.

2. Results

2.1. Expression Levels of p-ILK and ILK in Ovarian Cancer Cells and Human Ovarian Samples

Western blot and densitometric analysis of a panel of ovarian cancer cell lines showed that phosphorylation levels of ILK (p-ILK; Ser 246) relative to total ILK protein (p-ILK/ILK) were significantly higher in cisplatin-resistant A2780CP20 and OVCAR3CIS cells compared with their parental counterparts A2780 and OVCAR3, respectively (Figure 1A,B). Although not significant, p-ILK/ILK levels were also higher in cisplatin-resistant OV90CIS cells compared with their parental counterparts OV90 (Figure 1A,B). For taxane-resistant and taxane-sensitive ovarian cancer cells (HEYA8.MDR and HEYA8, respectively) this trend was not observed. We also measured the phosphorylation levels of AKT (p-AKT; Ser 473)—a downstream target of ILK [11]—in cisplatin-resistant ovarian cancer cells and their respective cisplatin-sensitive counterparts. Western blot and densitometric analysis showed that p-AKT levels relative to total AKT protein (p-AKT/AKT) were significantly higher in cisplatin-resistant A2780CP20 and OVCAR3CIS cells compared with their parental counterparts A2780 and OVCAR3, respectively (Figure S1A,B). Although not significant, p-AKT/AKT levels were also higher in cisplatin-resistant OV90CIS cells compared with their parental counterparts OV90 (Figure S1A,B). These observations are consistent with higher p-ILK/ILK protein levels in cisplatin-resistant ovarian cancer cells as compared with their cisplatin-sensitive counterparts (Figure 1A,B).
To assess the clinical significance of p-ILK expression in ovarian cancer, we performed immunohistochemical (IHC) analysis in normal ovary and ovarian cancer tissue sections. Representative IHC images are shown in Figure 1C. A significant increase in p-ILK (**** p < 0.0001) was observed in samples from ovarian cancer tissues compared with normal ovary (Figure 1D). No significant change was observed for total ILK (Figure 1C,E).

2.2. Effects of ILK-siRNA Transfection on Cell Growth, Invasion, and Viability

Next, we studied whether targeting ILK reduces cell growth and the invasive ability of cisplatin-resistant ovarian cancer cells. Transient transfection of ILK-targeted siRNAs into A2780CP20 cells decreased ILK protein levels (43.0% reduction; *** p < 0.001 and 35.0% reduction; ** p < 0.01) compared with C-siRNA-transfected cells (Figure 2A,B). In a colony formation assay with A2780CP20, both ILK-targeted siRNAs reduced the number of colonies formed compared with C-siRNA-transfected cells (Figure 2C). Particularly, ILK-siRNA(2) reduced in 60.5% (*** p < 0.001) the number of colonies, whereas ILK-siRNA(1) reduced the number of colonies in only 40.7% (** p < 0.01). Invasion assays confirmed that ILK-siRNA(1) and ILK-siRNA(2) significantly reduced (68.7% reduction; **** p < 0.0001 and 85.5% reduction; **** p < 0.0001, respectively) the invasiveness of A2780CP20 cells compared with C-siRNA-transfected cells (Figure 2D).
Then, we investigated whether ILK-targeted siRNAs alone or in combination with cisplatin (CIS) induced effects in cell viability. Transient transfection of 100 nmol/L of ILK-siRNA(2) into A2780CP20 cells significantly reduced (** p < 0.01) cell viability compared with C-siRNA (Figure 2E). Combination of ILK-siRNA(2) with CIS (2 µmol/L) significantly reduced (** p < 0.01) cell viability at siRNA doses as low as 25 nmol/L compared with C-siRNA (Figure 2E). To assess whether the effects induced on cell viability by ILK-siRNA were due to apoptosis, activation of caspase-3 was measured in cisplatin-resistant ovarian cancer cells. A significant increase (* p < 0.05) in caspase-3 activity was observed after transient transfection of 100 nmol/L of ILK-siRNA(2) into A2780CP20 cells compared with C-siRNA-transfected cells (Figure 2F). Results were validated by Western blot analysis, which showed increased caspase-3 cleavage upon ILK targeting (Figure 2G,H).
Similar to A2780CP20, transient transfection of ILK-siRNA(2) into OVCAR3CIS cells—a HGSOC cell line resistant to CIS—reduced ILK protein levels (45.0% reduction; ** p < 0.01, Figure 3A,B), colony formation (62.5% reduction; * p < 0.05, Figure 3C), and cell invasion (35.3% reduction; ** p < 0.01, Figure 3D) compared with C-siRNA-transfected cells. Combination of ILK-siRNA(2) with CIS (2 µmol/L) significantly reduced (* p < 0.05) cell viability at 100 nmol/L compared with C-siRNA (Figure 3E).
Similar results for ILK protein levels (37.0% reduction; ** p < 0.01, Figure S2A,B), colony formation (66.8% reduction; * p < 0.05, Figure S2C), and cell invasion (61.6% reduction; **** p < 0.0001, Figure S2D) were observed when transfecting ILK-siRNA(2) into OV90CIS cells, another HGSOC cell line resistant to CIS. In addition, transient transfection of ILK-siRNA(2) into HEYA8 cells decreased ILK protein levels compared with C-siRNA-transfected cells (44.0% reduction; *** p < 0.001, Figure S2E,F). However, in contrast to A2780CP20 and OVCAR3CIS cells, ILK-siRNA(2) significantly reduced (** p < 0.01) the viability of HEYA8 cells at concentrations of 25 nmol/L or lower compared with C-siRNA (Figure S2G). Importantly, no significant changes in colony formation and/or viability were observed when ILK-siRNA(2) was transfected into A2780, OVCAR3, and OV90 cells (Figure S3A–E).

2.3. Effect of a Small-Molecule ILK Inhibitor on Cell Viability

Next, we studied the effect of a small-molecule ILK inhibitor (Cpd22) on cell viability. Inhibition of ILK activity by Cpd22 has been shown to suppress the viability of prostate and breast cancer cells [23]. Treatment with Cpd22 significantly reduced the viability of both cisplatin-resistant (A2780CP20, OVCAR3CIS, and OV90CIS) and cisplatin-sensitive (A2780, OVCAR3, and OV90) ovarian cancer cells in a dose-dependent manner (Figure S4A–F). The viability of HEYA8 cells was also significantly reduced by Cpd22 treatment (Figure S4G). Western blot and densitometric analysis showed that p-ILK levels relative to total ILK protein (p-ILK/ILK) were significantly lower in OVCAR3CIS (25.3% reduction; ** p < 0.01, Figure S5A,B) and HEYA8 cells (20.7% reduction; ** p < 0.01, Figure S5C,D) upon Cpd22 (2 µmol/L) treatment. Although not significant, a reduction in p-ILK/ILK levels was also observed for A2780CP20 (26.7% reduction; p = n.s., Figure S5E,F) and OV90CIS cells (14% reduction; p = n.s., Figure S5G,H).

2.4. Effect of ILK-siRNA Transfection on Gene Expression

To further assess the signaling pathways altered as a result of ILK-siRNA transfection in cisplatin-resistant ovarian cancer cells, we performed a transcriptome-wide analysis by RNA sequencing (RNA-Seq). Using an initial false discovery rate (FDR, q-value) cutoff of <0.05, we identified 2028 differentially expressed genes between C-siRNA and ILK-siRNA-transfected cells including 1322 upregulated and 706 downregulated genes (data not shown).
Differentially expressed genes with a log2 fold change of ≥1.5 and ≤−1.5 were used to analyze functional enrichment using the Kyoto Encyclopedia of Genes and Genomes (KEGG). The top 10 most significantly enriched KEGG pathways include metabolic pathways, olfactory transduction, pathways in cancer, PI3K-AKT signaling pathway, MAPK signaling pathway, neuroactive ligand–receptor interaction, HTLV-I infection, cytokine–cytokine receptor interaction, proteoglycans in cancer, and focal adhesion (Table 1).
Gene ontology (GO) analysis of significantly enriched processes, components, and functions with a FDR < 0.01 showed that differentially expressed genes were mainly associated with tissue development, positive regulation of macromolecule biosynthetic process, cell development, positive regulation of RNA metabolic process, and regulation of multicellular organismal development within the biological processes category (Table 2); adenyl nucleotide binding, adenyl ribonucleotide binding, ATP binding, signal transducer activity, and transition metal ion binding within the molecular functions category (Table 2); and intrinsic component of plasma membrane, integral component of plasma membrane, neuron part, Golgi apparatus, and cell junction within the cellular components category (Table 2).
A dataset containing the gene symbols, fold change (log2), and p-values of the 2028 differentially expressed genes was uploaded into the Ingenuity Pathway Analysis (IPA) software. Of these genes, 1804 were mapped successfully by IPA. To select differentially expressed genes, a log2 fold change cutoff >1.5 or <−1.5 with a p-value ≤ 0.001 was used. Using these criteria, we identified a total of 77 differentially expressed genes, 68 upregulated and 9 downregulated in ILK-siRNA vs. C-siRNA-transfected cells (Table S1). Based on fold change, among the 68 upregulated genes, the top 5 include GRIA4, SCG3, CHRNB2, XKR7, and TOMM40L (Table 3). Among the nine downregulated genes, the top five include NSG1, TEX41, SLC4A8, SAG, and ILK (Table 3).
In agreement with evidence that long non-coding RNAs (lncRNAs) are key regulators of gene expression [24], using an FDR < 0.05, we identified 296 lncRNAs with altered expression following ILK-siRNA transfection, 205 upregulated and 91 downregulated (data not shown). To select differentially expressed lncRNAs, a log2 fold change cutoff >1.0 or <−1.0 with a p-value ≤ 0.001 was used. Using these criteria, we identified a total of 37 differentially expressed lncRNAs, 33 upregulated and 4 downregulated (Table S2). Based on fold change, the top 10 lncRNAs include MIR7-3HG, LINC01134, RP11-64K12.4, RP11-799D4.4, RP11-618K13.2, RP11-380L11.4, ARHGEF26-AS1, RP11-732A19.8, RP11-20G6.3, and RP11-474G23.2 (Table 4).

2.5. IPA Analysis of Differentially Expressed Genes

To better examine the interaction networks of ILK downstream genes, we performed IPA analysis with the 77 differentially expressed transcripts. This analysis produced a list of 9 significantly altered canonical pathways (p < 0.05 or –log p-value > 1.30) including SAPK/JNK signaling, NAD biosynthesis and salvage pathway, phototransduction pathway, VDR/RXR activation, Reelin signaling in neurons, and role of IL-17A in psoriasis (Table 5).
The top network with an IPA score of 23 and composed of 13 molecules was associated with nervous system development and function, organ morphology, and organismal development (Figure 4A and Table S3). The second top network (score: 23, molecules: 13) was associated with cell death and survival, cancer, and immunological disease (Figure 4B and Table S3).
In addition, other networks within the top 5 list were associated with cellular movement, cell-to-cell signaling and interaction, cellular development, and cellular growth and proliferation (Table S3). Furthermore, cell morphology, cellular assembly and organization, and cellular function and maintenance were within the top 5 cellular and molecular functions associated with ILK downregulation (Table 6).

2.6. Prognostic Value of ILK Downstream Genes

To assess whether the differentially expressed transcripts identified upon ILK targeting are clinically relevant in ovarian cancer, we conducted survival analysis using Kaplan–Meier plotter (KM plotter) [25]. Gene chip data (Affymetrix) for 70 out of the 77 differentially abundant transcripts (Table S1) were available in the database. After dividing the patients into high and low expression (according to the median value), 33 of the 70 transcripts were significantly associated with overall survival (OS) and/or progression-free survival (PFS; Table S4). Expression levels upon ILK depletion for 10 out of the 33 transcripts were concordant with survival outcomes (Table S4). A significant association between high expression levels and better prognosis (OS; HR < 1) was found for CHGA, SLC5A1, MAPK8IP2, NMNAT2, and PLA2G4C, whereas worse outcomes (OS; HR > 1) were associated with high expression of ARHGAP23 (Figure 5).
In addition, high expression levels of CHGA and BSN were associated with longer PFS (HR < 1), whereas high expression of SEMA3G, ARHGAP23, SAG, and SLC4A8 were associated with shorter PFS (HR > 1; Figure 6).
For ovarian cancer patients treated with platin, 30 of the 70 transcripts were significantly associated with OS and/or PFS (Table S5). Expression levels upon ILK depletion for 11 out of the 30 transcripts were concordant with survival outcomes (Table S5). A significant association between high expression levels and better prognosis (OS; HR < 1) was found for VGF, CHGA, and NMNAT2, whereas worse outcomes (OS; HR > 1) were associated with high expression of ARHGAP23 (Figure S6). In addition, high expression levels of CHGA, ACTL6B, BSN, PAX5, NKAIN1, SYP, CAMKV were associated with longer PFS (HR < 1), whereas high expression of ARHGAP23 and SLC4A8 were associated with shorter PFS (HR > 1; Figure S7).
For serous ovarian cancer patients, 27 of the 70 transcripts were significantly associated with OS and/or PFS (Table S6). Expression levels upon ILK depletion for 7 out of the 27 transcripts were concordant with survival outcomes (Table S6). A significant association between high expression levels and better prognosis (OS; HR < 1) was found for CHGA, SLC5A1, and NMNAT2, whereas worse outcomes (OS; HR > 1) were associated with high expression of ARHGAP23 (Figure S8). In addition, high expression levels of SEMA3G, ARHGAP23, ILK, and SAG were associated with shorter PFS (HR > 1; Figure S9).
For serous ovarian cancer patients treated with platin, 23 of the 70 transcripts were significantly associated with OS and/or PFS (Table S7). Expression levels upon ILK depletion for 5 out of the 23 transcripts were concordant with survival outcomes (Table S7). A significant association between high expression levels and better prognosis (OS; HR < 1) was found for LTF, whereas worse outcomes (OS; HR > 1) were associated with high expression of ARHGAP23 (Figure S10). In addition, high expression levels of SEMA3G, ARHGAP23, ILK, and SLC4A8 were associated with shorter PFS (HR > 1; Figure S11).
Gene chip data for 11 of the 37 differentially abundant lncRNAs following ILK targeting (Table S2) were also available in KM plotter. After dividing the patients into high and low expression (according to the median value), 6 of 11 lncRNAs including MIR7-3HG, LINC01134, HAR1A, LINC01139, LINC-PINT, and DNM3OS were significantly associated with OS and/or PFS (Figure 7 and Table S8). However, expression levels of these lncRNAs upon ILK depletion were not concordant with survival outcomes.
For ovarian cancer patients treated with platin, five lncRNAs including LINC01134, HAR1A, LINC01139, LINC-PINT, and DNM3OS were significantly associated with PFS (Figure S12 and Table S9). For serous ovarian cancer patients, three lncRNAs including HAR1A, LINC00886, and LINC-PINT were significantly associated with PFS (Figure S13 and Table S10). For serous ovarian cancer patients treated with platin, five lncRNAs including HAR1A, LINC00886, LINC01139, LINC-PINT, DNM3OS were significantly associated with PFS (Figure S14 and Table S11). However, expression levels of these lncRNAs upon ILK depletion were not concordant with survival outcomes.
Survival analysis was also conducted using Pan-cancer RNA-Seq data in KM plotter. Expression levels for 75 of the 77 differentially abundant transcripts (Table S1) were available in the database. After dividing ovarian cancer patients into high and low expression (according to the median value), 9 of 75 transcripts (Table S12) were found significantly associated with OS (n = 373) or relapse-free survival (RFS; n = 177). Expression levels of four of the nine transcripts were concordant with survival outcomes (Table S12). High expression levels of MARVELD3 were associated with longer OS (HR < 1), whereas high expression levels of PAX5, COL13A1, and ANKRD22 were associated with longer RFS (HR < 1; Figure 8). Although expression levels for 10 of the 37 differentially abundant lncRNAs were available from RNA-Seq data in KM plotter, no significant associations were found between lncRNA expression and OS or RFS.

2.7. Target Validation by qRT-PCR Analysis

Based on RNA-Seq data upon ILK targeting in cisplatin-resistant ovarian cancer cells and survival analysis of differentially expressed genes, ACTL6B, ANKRD22, ARHGAP23, BSN, CAMKV, CHGA, COL13A1, ILK, LTF, MAPK8IP2, MARVELD3, NKAIN1, NMNAT2, PAX5, SAG, SEMA3G, SLC4A8, SLC5A1, and VGF were selected for further validation by SYBR Green-based qRT-PCR analysis. Expression levels of all genes tested were concordant with RNA-Seq data except for NKAIN1 (Table 7). ARHGAP23 and COL13A1 did not show significant differences in expression (Table 7). Expression of LTF and SAG was not detected by qRT-PCR.

3. Discussion

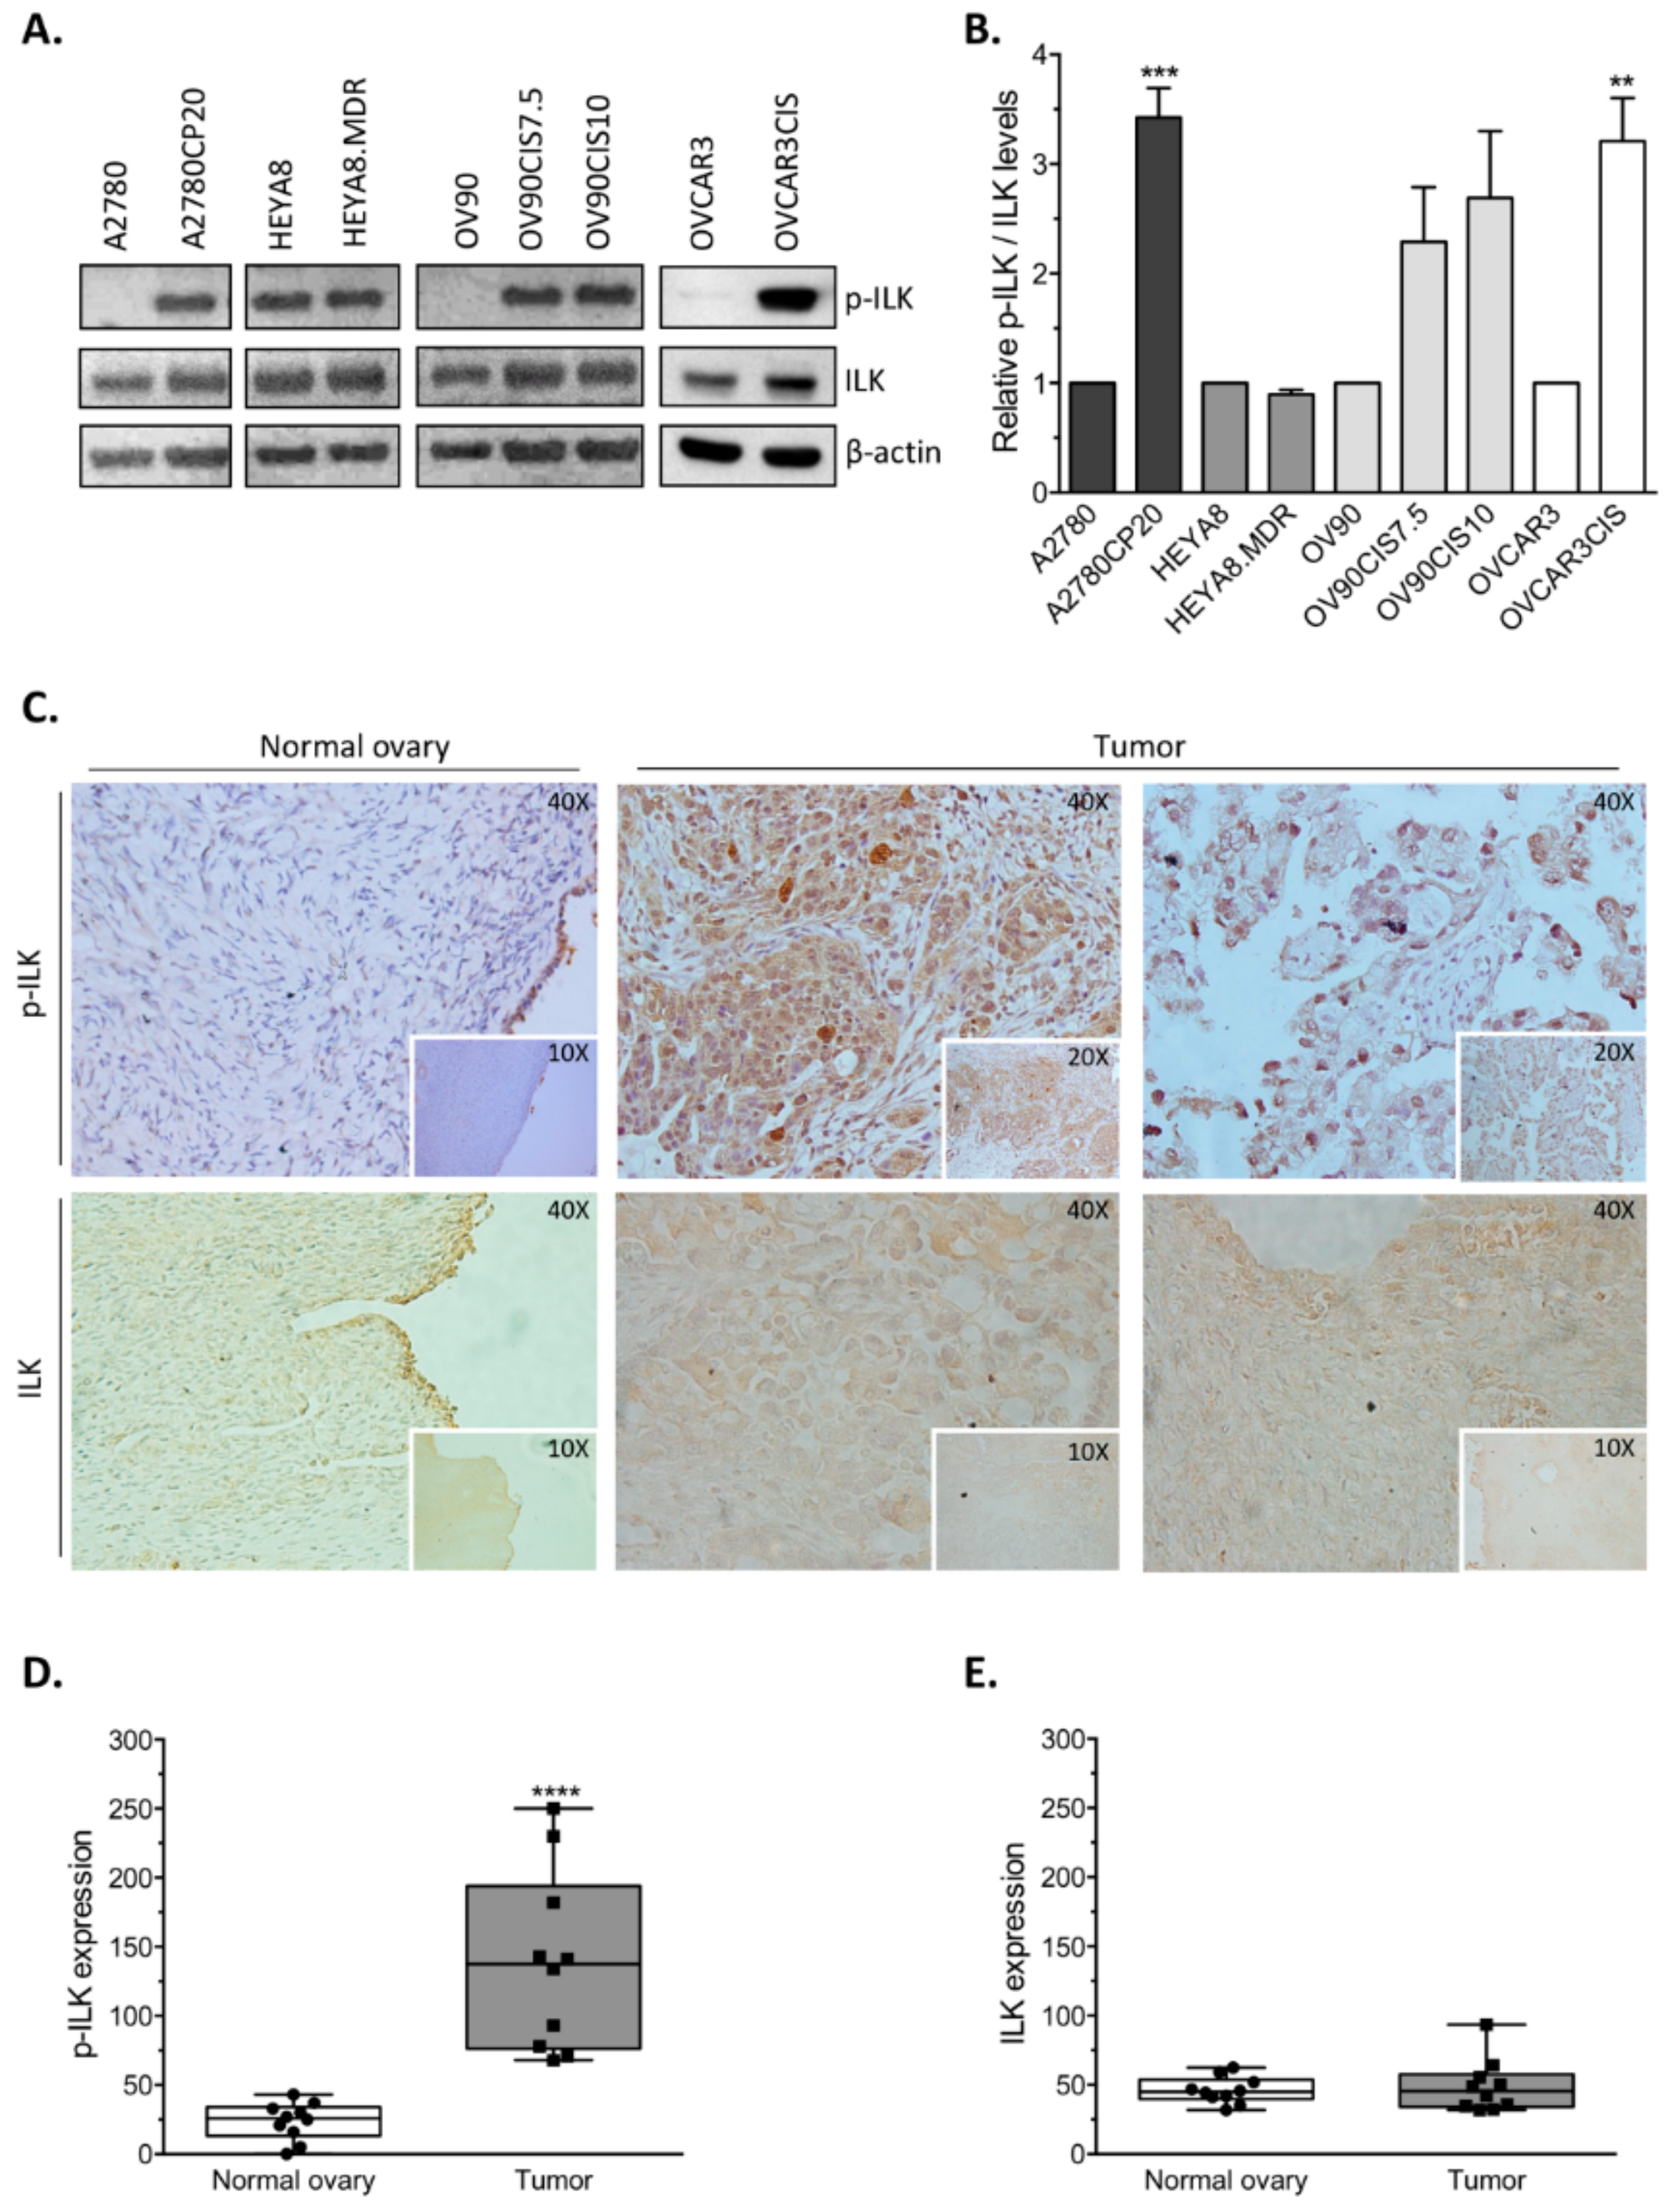
Increased levels of ILK, a serine/threonine kinase and adaptor protein, have been well documented in different tumor types, including ovarian cancer [
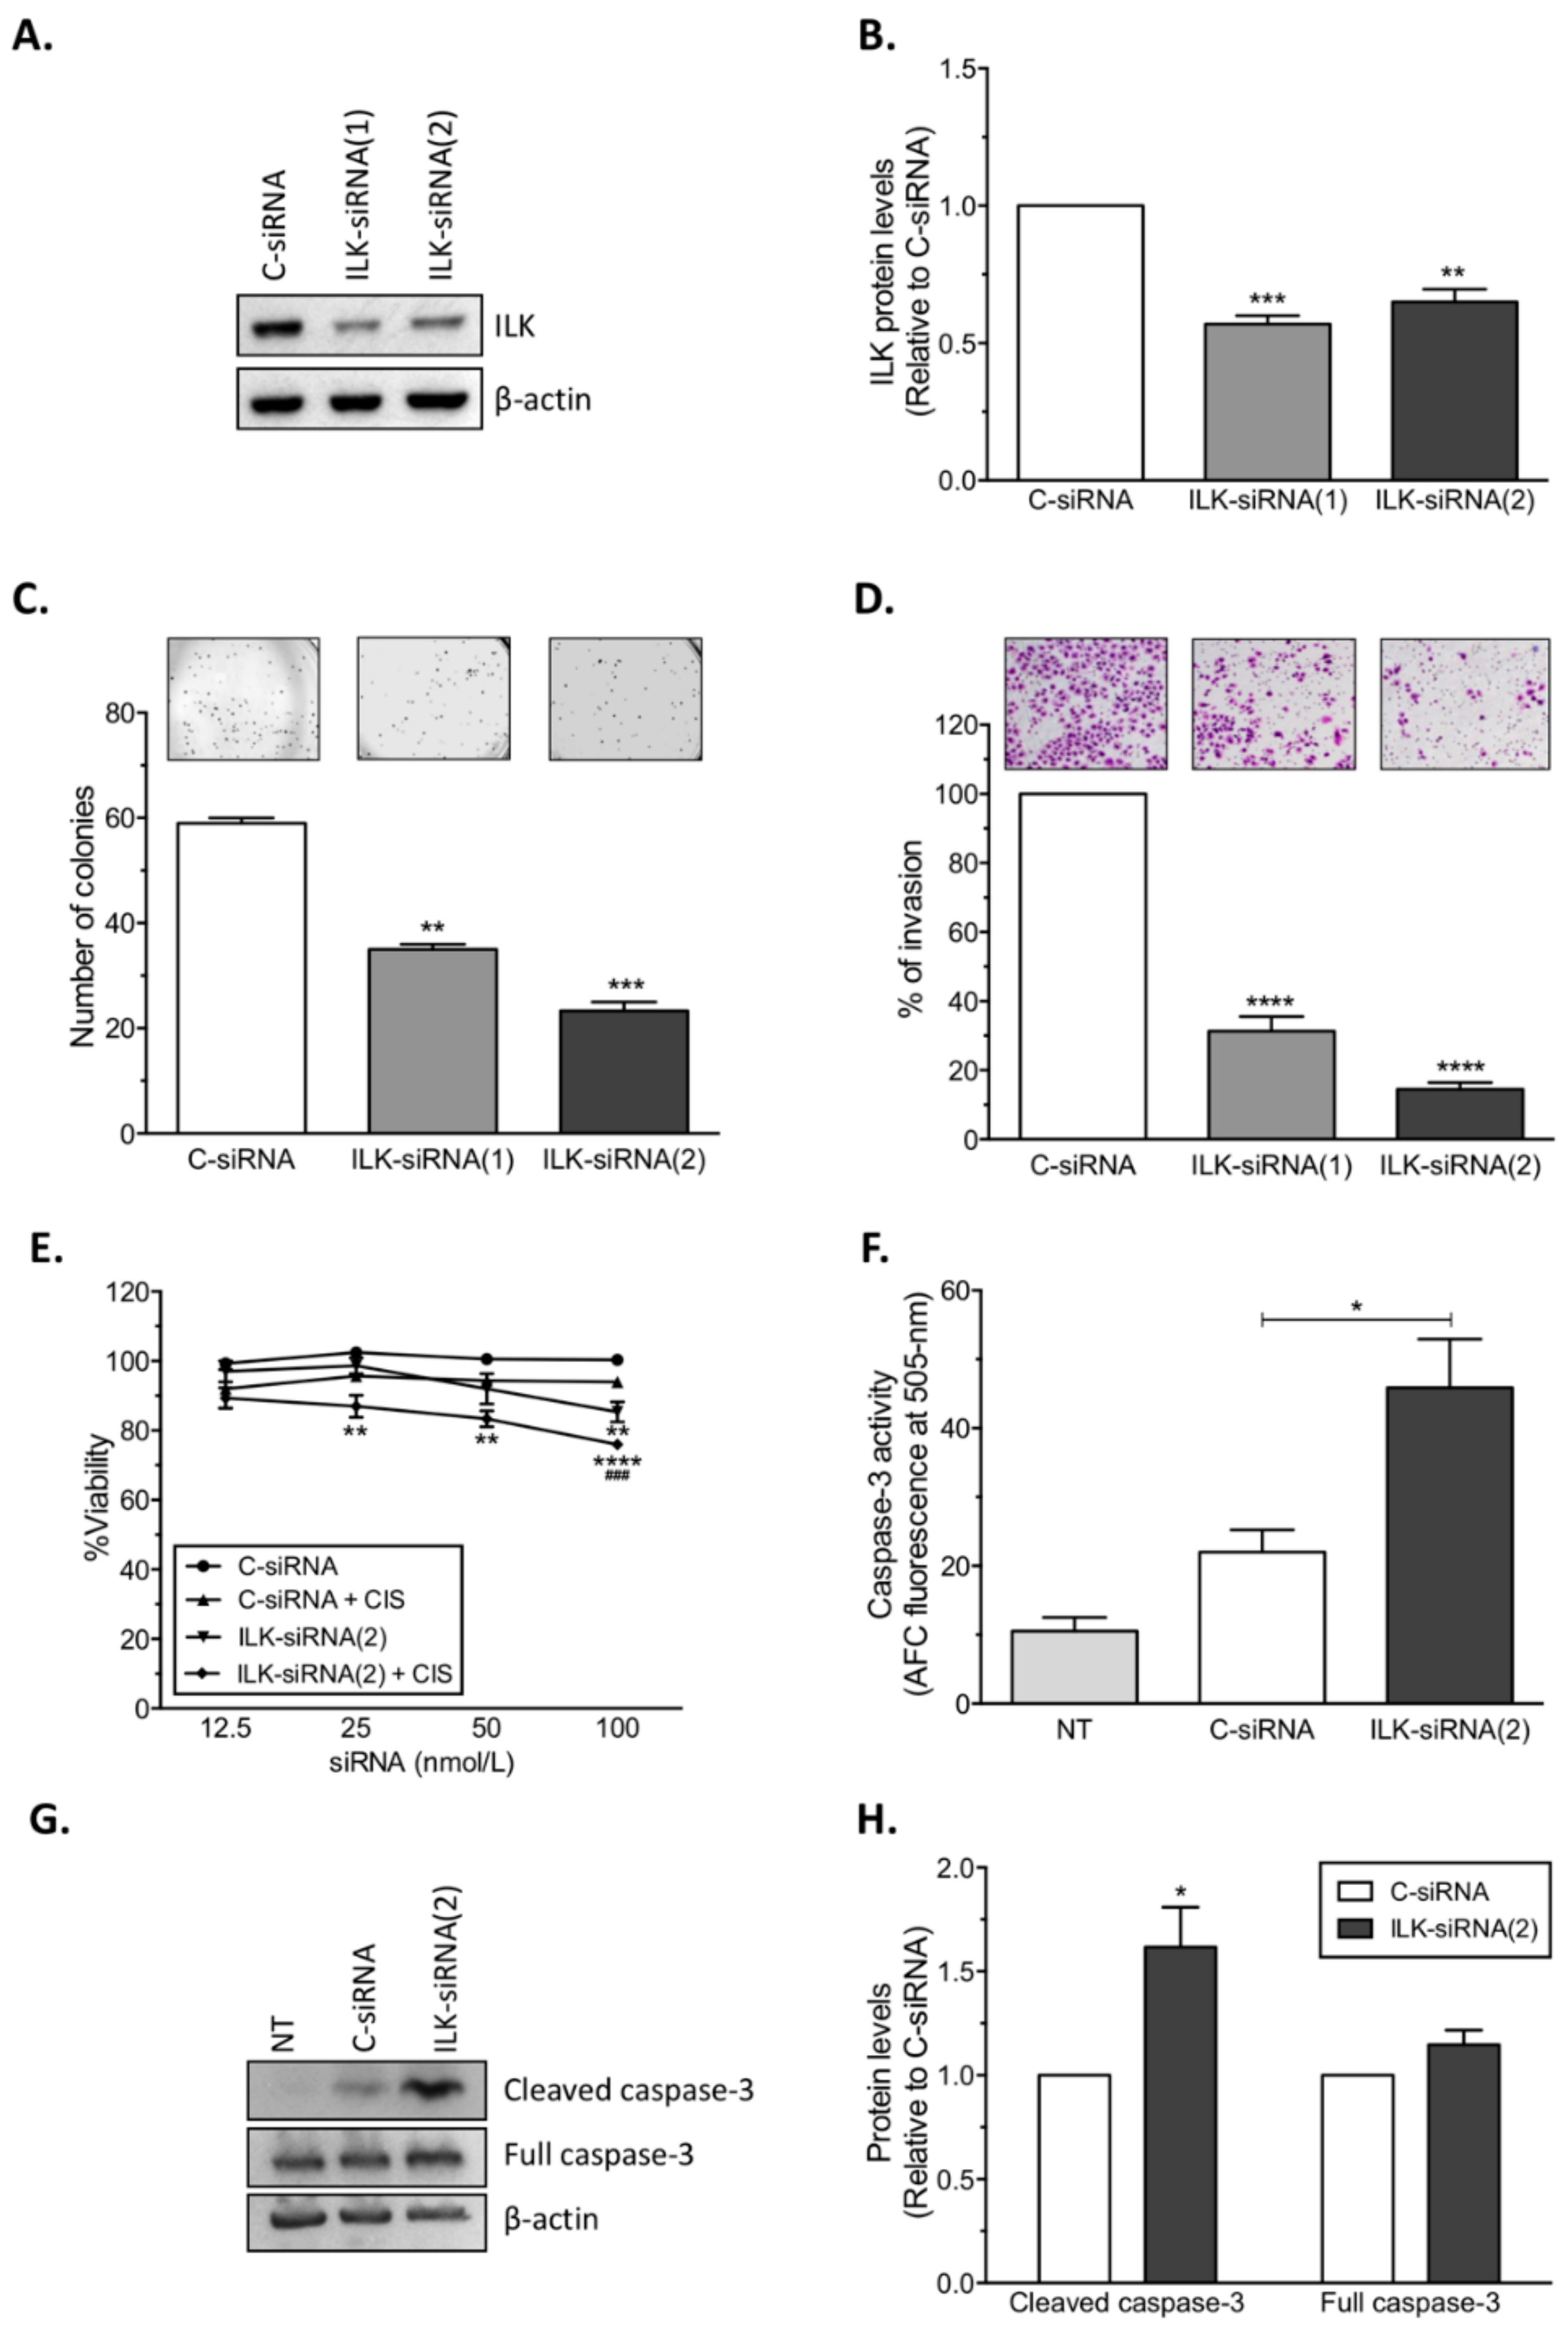
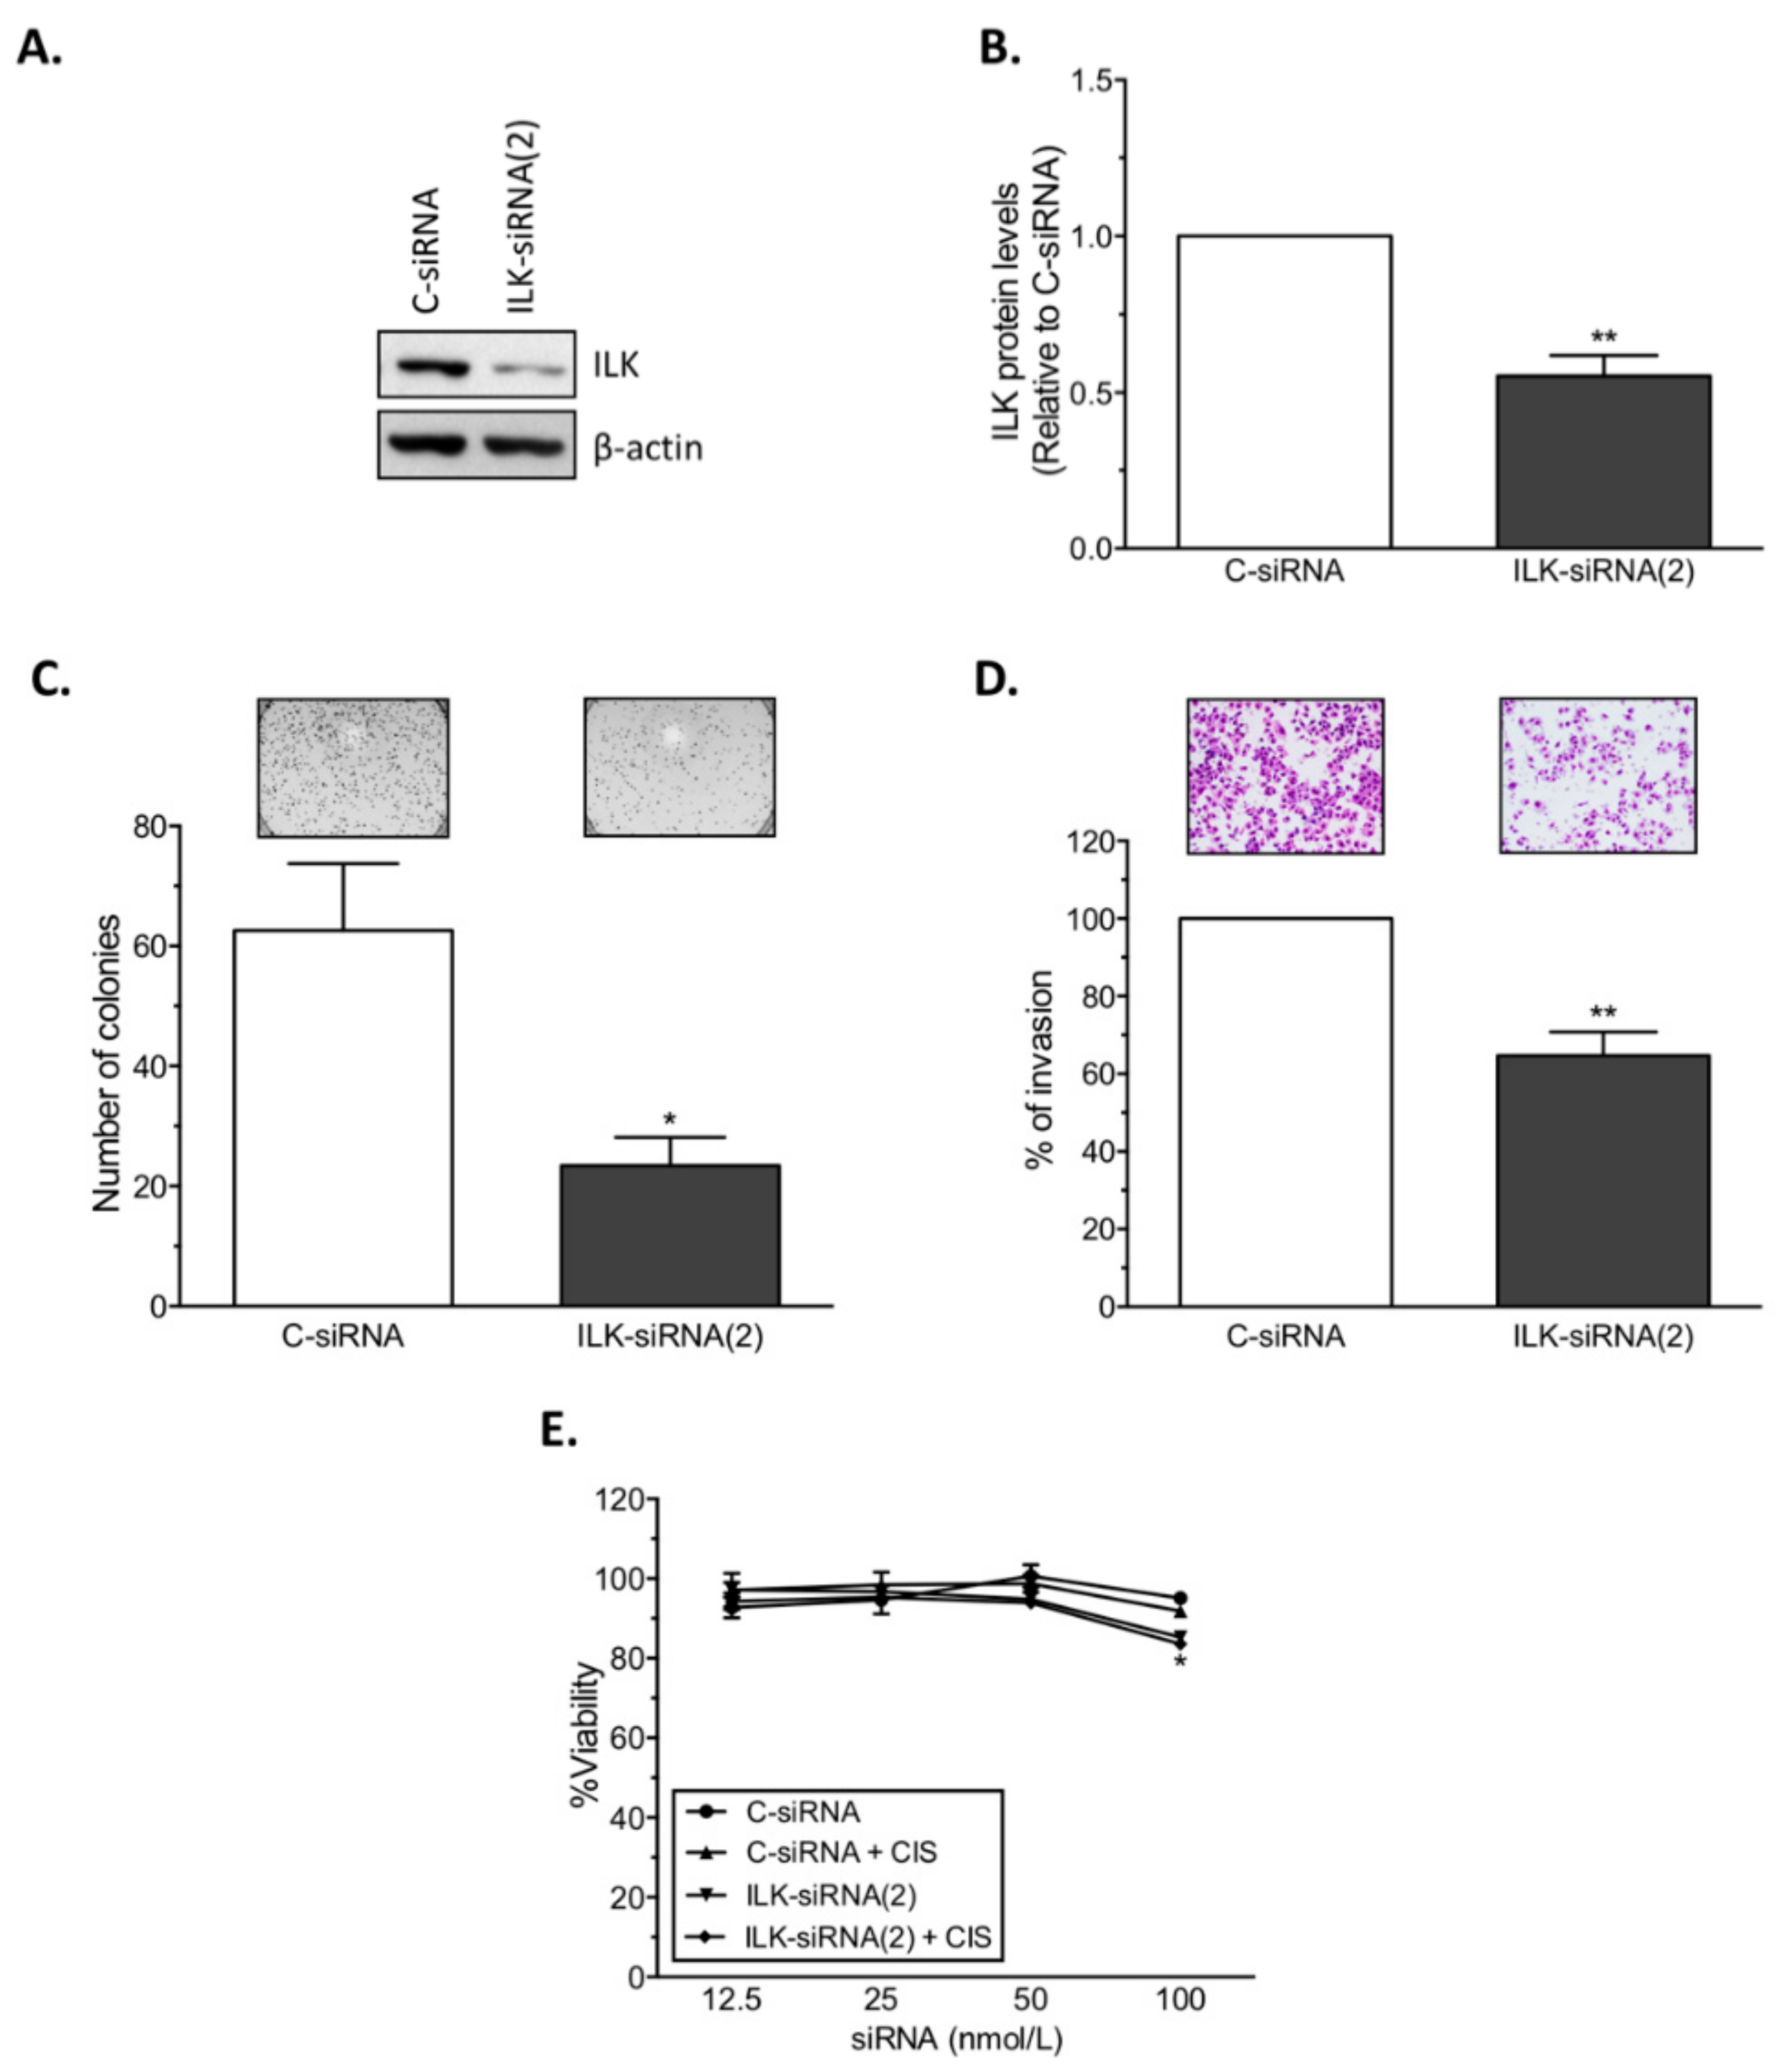
14]. Here, we present further evidence that phosphorylated ILK (p-ILK) levels are higher in human ovarian cancer tissues compared with normal ovary samples, and that p-ILK levels relative to total ILK protein (p-ILK/ILK) are higher in cisplatin-resistant compared with cisplatin-sensitive ovarian cancer cells. Transfection of ILK-siRNA into cisplatin-resistant ovarian cancer cells induced long-term effects on cell growth, short-term effects on cell viability in combination with cisplatin treatment, and increased caspase-3 activity. These results are in accordance with previous reports showing that targeting ILK decreases cell viability [22] and induces apoptosis in ovarian cancer [20,21], and increases the sensitivity of lung cancer [26], gastric carcinoma [27], and colon cancer [28] cells to cisplatin or oxaliplatin treatment. In fact, studies in platinum-resistant ovarian cancer have shown that ILKAP, a phosphatase which inactivates ILK, is downregulated by cisplatin treatment, and that silencing ILKAP increases ILK activation and protects cells from cisplatin-induced apoptosis [19]. We also observed that transfection of ILK-siRNA reduced the invasive potential of cisplatin-resistant ovarian cancer cells, which is in agreement with previous studies showing that ILK activity modulates the pro-metastatic behavior of ovarian cancer [17]. Similar to our results, ILK activity stimulates invasion and migration of the SKOV3 human ovarian cancer cell line [18], whereas ILK depletion by shRNA (short hairpin RNA) abrogates the invasive potential of SKOV3 cells [15].
Inhibition of ILK activity by Cpd22 treatment significantly reduced the viability of all cancer cell lines tested. These results are in accordance with a previous study showing that Cpd22 treatment suppresses the viability of prostate and breast cancer cells compared with normal prostate and mammary epithelial cells [23]. Cpd22 inhibits ILK kinase activity, facilitating dephosphorylation of ILK targets, suppressing the expression of YB-1 (Y-box binding protein) transcription factor and its targets, and inducing autophagy and apoptosis [23]. In addition, ILK expression levels positively correlate with the efficacy of Cpd22 in leukemia [29]. While siRNAs have high specificity in a sequence specific manner, small-molecule inhibitors can act over multiple targets [30]. These observations could explain in part the fact that the viability of both cisplatin-resistant and cisplatin-sensitive cells was reduced upon Cpd22 treatment.
Results from RNA-Seq analysis of ILK-siRNA-transfected ovarian cancer cells showed significant changes in the expression of cancer-associated molecules including protein-coding genes and lncRNAs. Repression of glutamate receptor GRIA4, one of the top upregulated genes in our study, increases cell viability, proliferation, and migratory potential in rhabdomyosarcoma/medulloblastoma and multiple myeloma cells [31]. Another GRIA family member, GRIA2, is downregulated in chemoresistant advanced serous papillary ovarian carcinomas and upregulated in chemosensitive tumors [32]. TOMM40L, also upregulated in our study, is upregulated in epithelial ovarian cancer cell lines overexpressing DOK1, a candidate tumor suppressor associated with cisplatin sensitivity [33]. Similarly, TOMM40L is downregulated in gemcitabine-resistant pancreatic cancer cells compared with their parental sensitive counterparts [34]. Inhibition of NDCBE in cholangiocarcinoma cells, a product of the SLC4A8 gene downregulated in our study, decreases proliferation and induces apoptosis [35]. TEX41, also downregulated in our study, is upregulated in portal vein tumor thrombosis (PVTT), the main route for intrahepatic metastasis in hepatocellular carcinoma [36]. Therefore, changes in the expression of these genes following siRNA-mediated ILK depletion in cisplatin-resistant ovarian cancer cells could explain in part the reduction in cell growth, invasion, and viability, and the increase in caspase-3 activity.
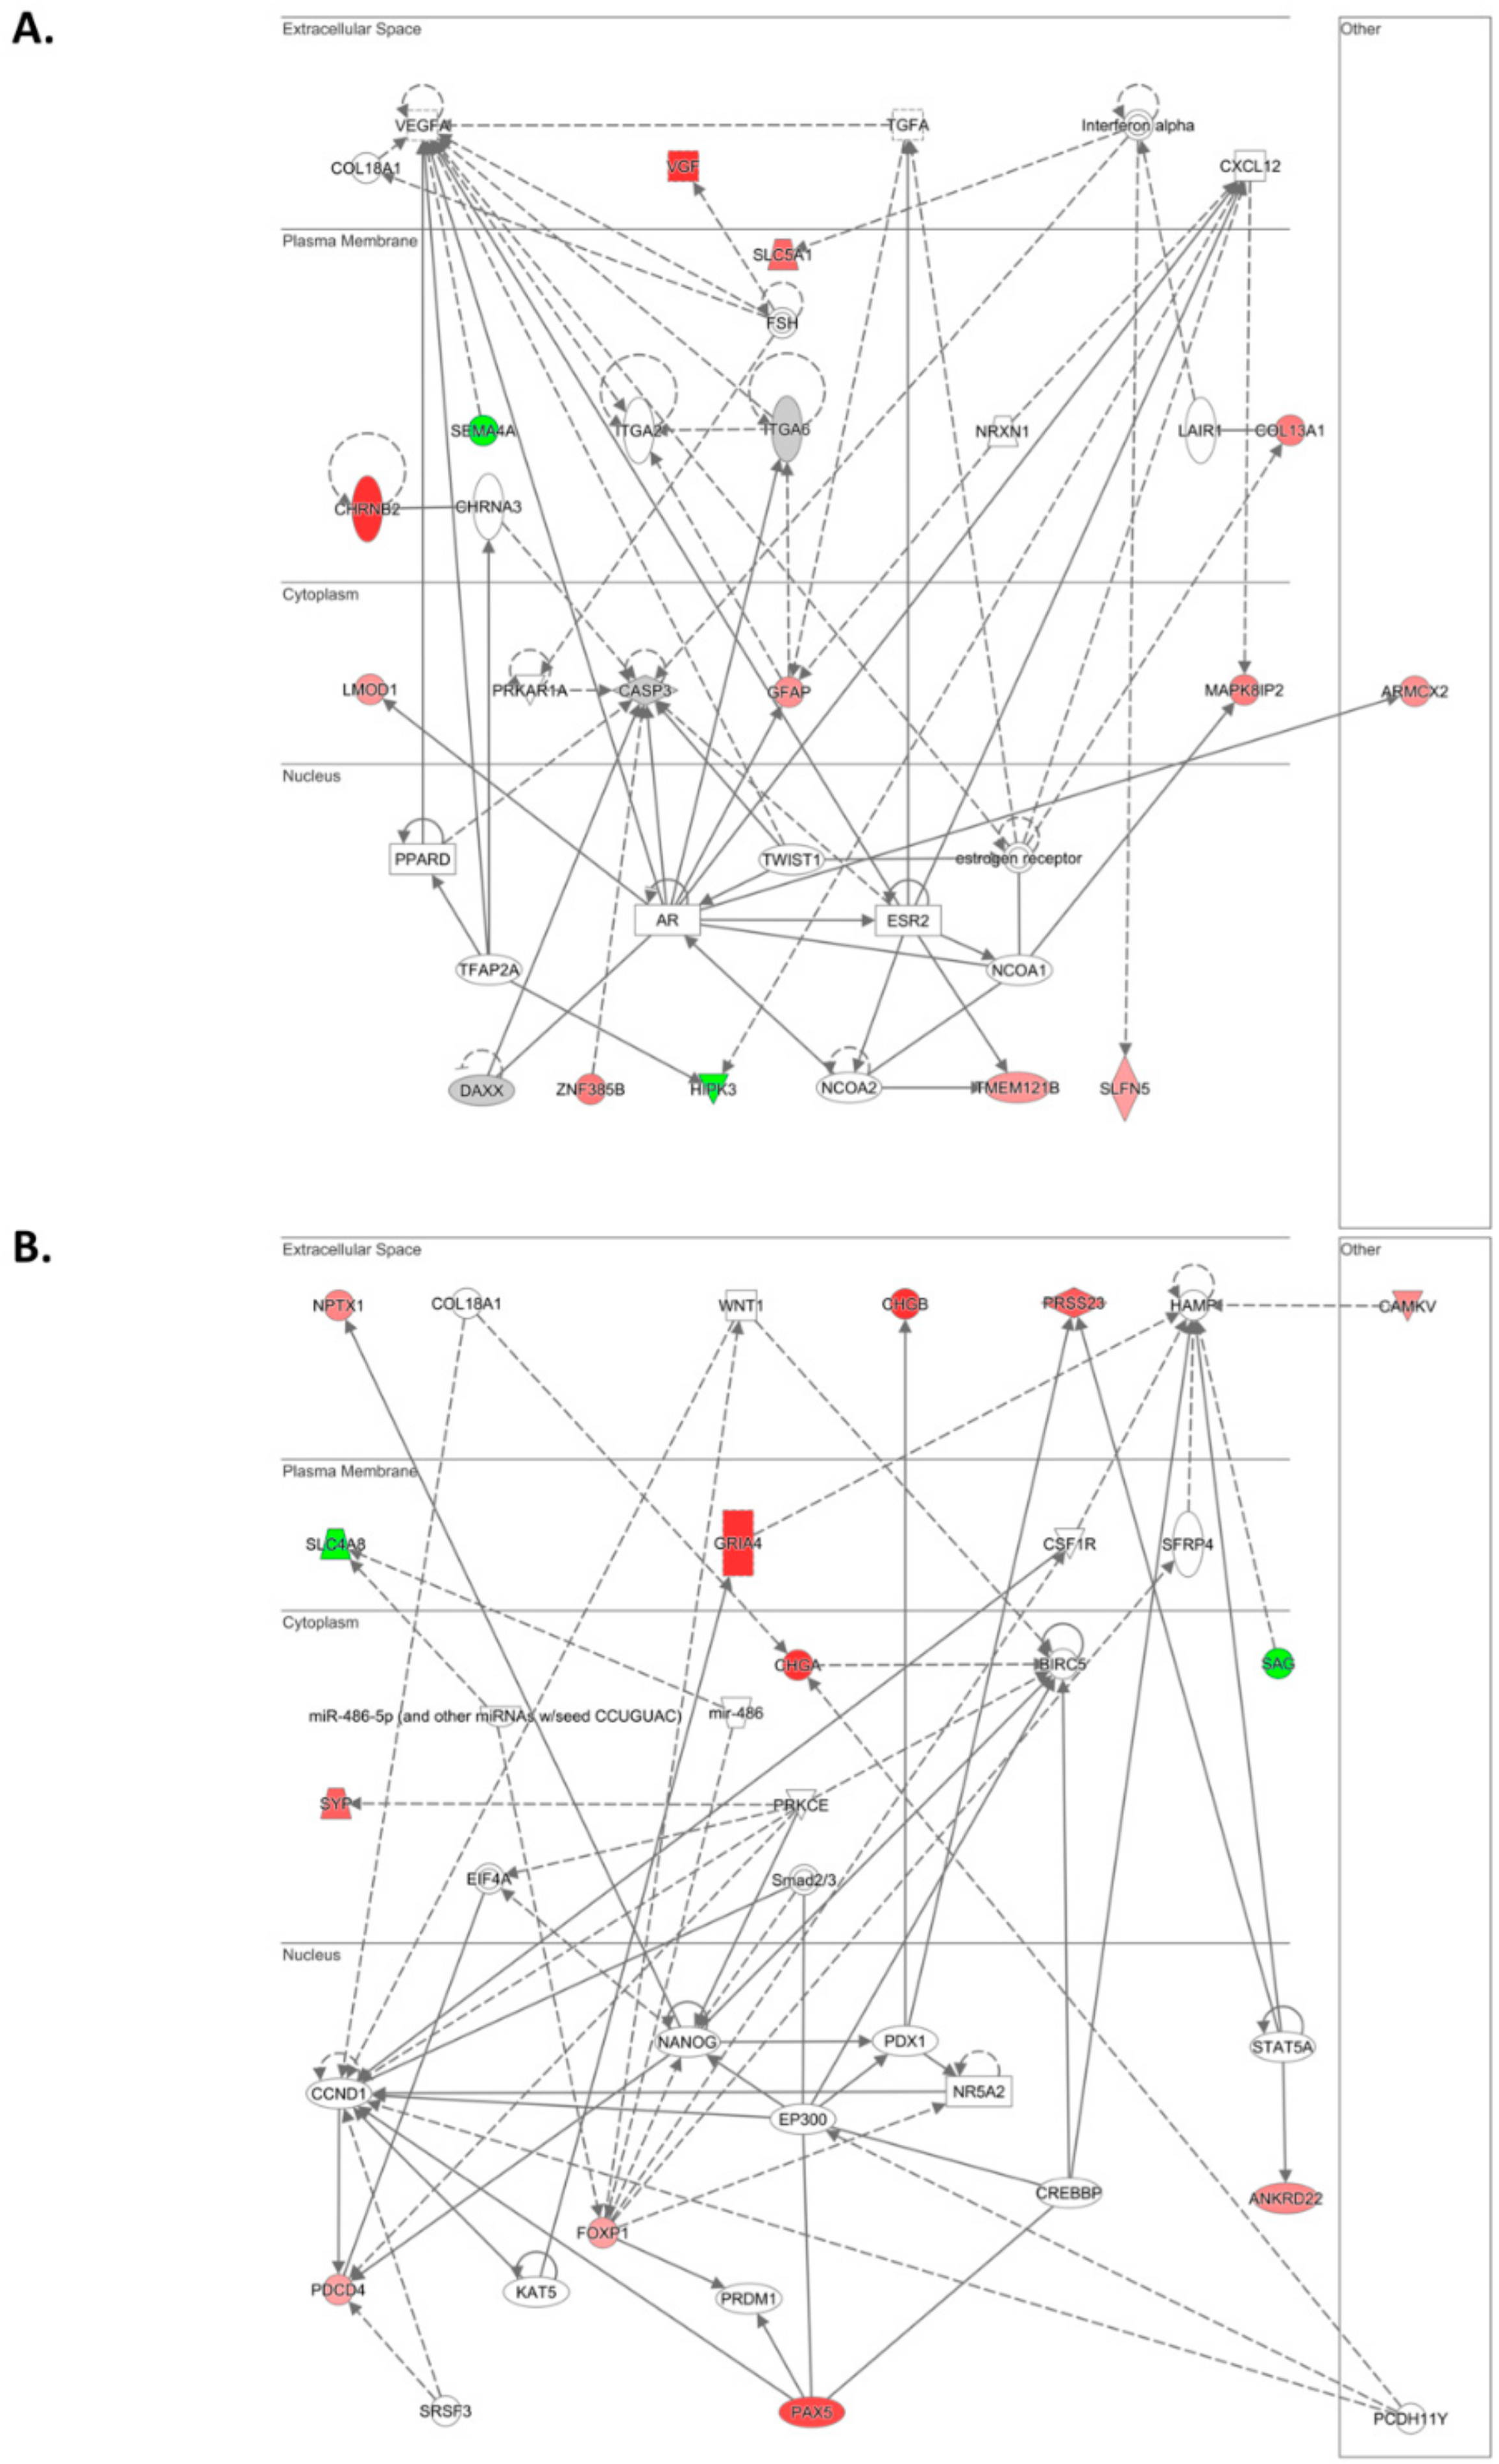
In agreement with these observations, within the list of differentially abundant transcripts, we identified additional genes involved in the regulation of cell proliferation, survival, migration, invasion, metastasis, drug resistance, and apoptosis. Interestingly, DUSP8, MARVELD3, PDCD4, MAPK8IP1, MAPK8IP2, and HIPK3 converge on JNK signaling, one of the top canonical pathways (SAPK/JNK) identified in our IPA analysis. In epithelial ovarian cancer, activated JNK is associated with decreased PFS [37]. In addition, we have previously shown that the JNK-1/c-JUN/miR-21 pathway contributes to cisplatin resistance in ovarian cancer cells [38]. ILK negatively regulates the expression of DUSP8 [39], a MAPK phosphatase upregulated in our study, and DUSP8 dephosphorylates and inactivates JNK [40,41]. Inhibition of ILK/AKT decreases miR-21 in vestibular schwannoma and meningioma cells [42], and targeting miR-21 with antisense oligonucleotides (ASOs) inhibits growth and metastasis via upregulation of DUSP8 in colorectal carcinoma [43]. MARVELD3, a transmembrane protein of tight junctions [44,45] upregulated in our study, inhibits JNK activity via recruitment of MEKK1 to cell junctions [46]. MARVELD3 is downregulated in SNAIL-induced EMT during pancreatic cancer progression [47]. Similarly, MARVELD3 silencing decreases CDH1 and increases SNAI2 expression in lung cancer [48]. Downregulation of MARVELD3 in colorectal cancer cells increases migration and proliferation, whereas upregulation inhibits migration, proliferation, and in vivo tumor formation [46]. PDCD4, a well-known tumor suppressor [49] upregulated in our study, has been suggested to interact with c-JUN, blocking c-JUN phosphorylation by JNK [50]. In ovarian cancer, lower PDCD4 expression correlates with shorter disease-free survival (DFS) [51]. Moreover, PDCD4 overexpression enhances the sensitivity of ovarian cancer cells to cisplatin by activating the death receptor pathway [52]. In bladder cancer cells, PDCD4 overexpression enhances sensitivity to cisplatin via regulation of the JNK/c-JUN pathway [53]. The JIP family of MAPK scaffold proteins, including MAPK8IP1 and MAPK8IP2 which were upregulated in our study, have been previously identified as regulators of JNK signaling [54]. MAPK8IP1, a negative regulator of MAPK activity [55], inhibits c-JUN phosphorylation by JNK [56]. In gastric cancer, miR-10a promotes cell migration and invasion by downregulating MAPK8IP1 [55]. HIPK3, a FAS/FADD-interacting kinase [57] downregulated in our study, has been previously implicated in multidrug resistance in cancer [58,59]. In fact, overexpression of HIPK3 protects osteosarcoma cells from cisplatin-induced death in vitro and in vivo [60]. In prostate cancer, JNK activity increases the expression of HIPK3 and promotes resistance to FAS receptor-mediated apoptosis [61]. Overall, these observations suggest that ILK regulates the JNK/c-JUN pathway in cisplatin-resistant ovarian cancer via modulation of DUSP8, MARVELD3, PDCD4, MAPK8IP1, MAPK8IP2, and HIPK3.
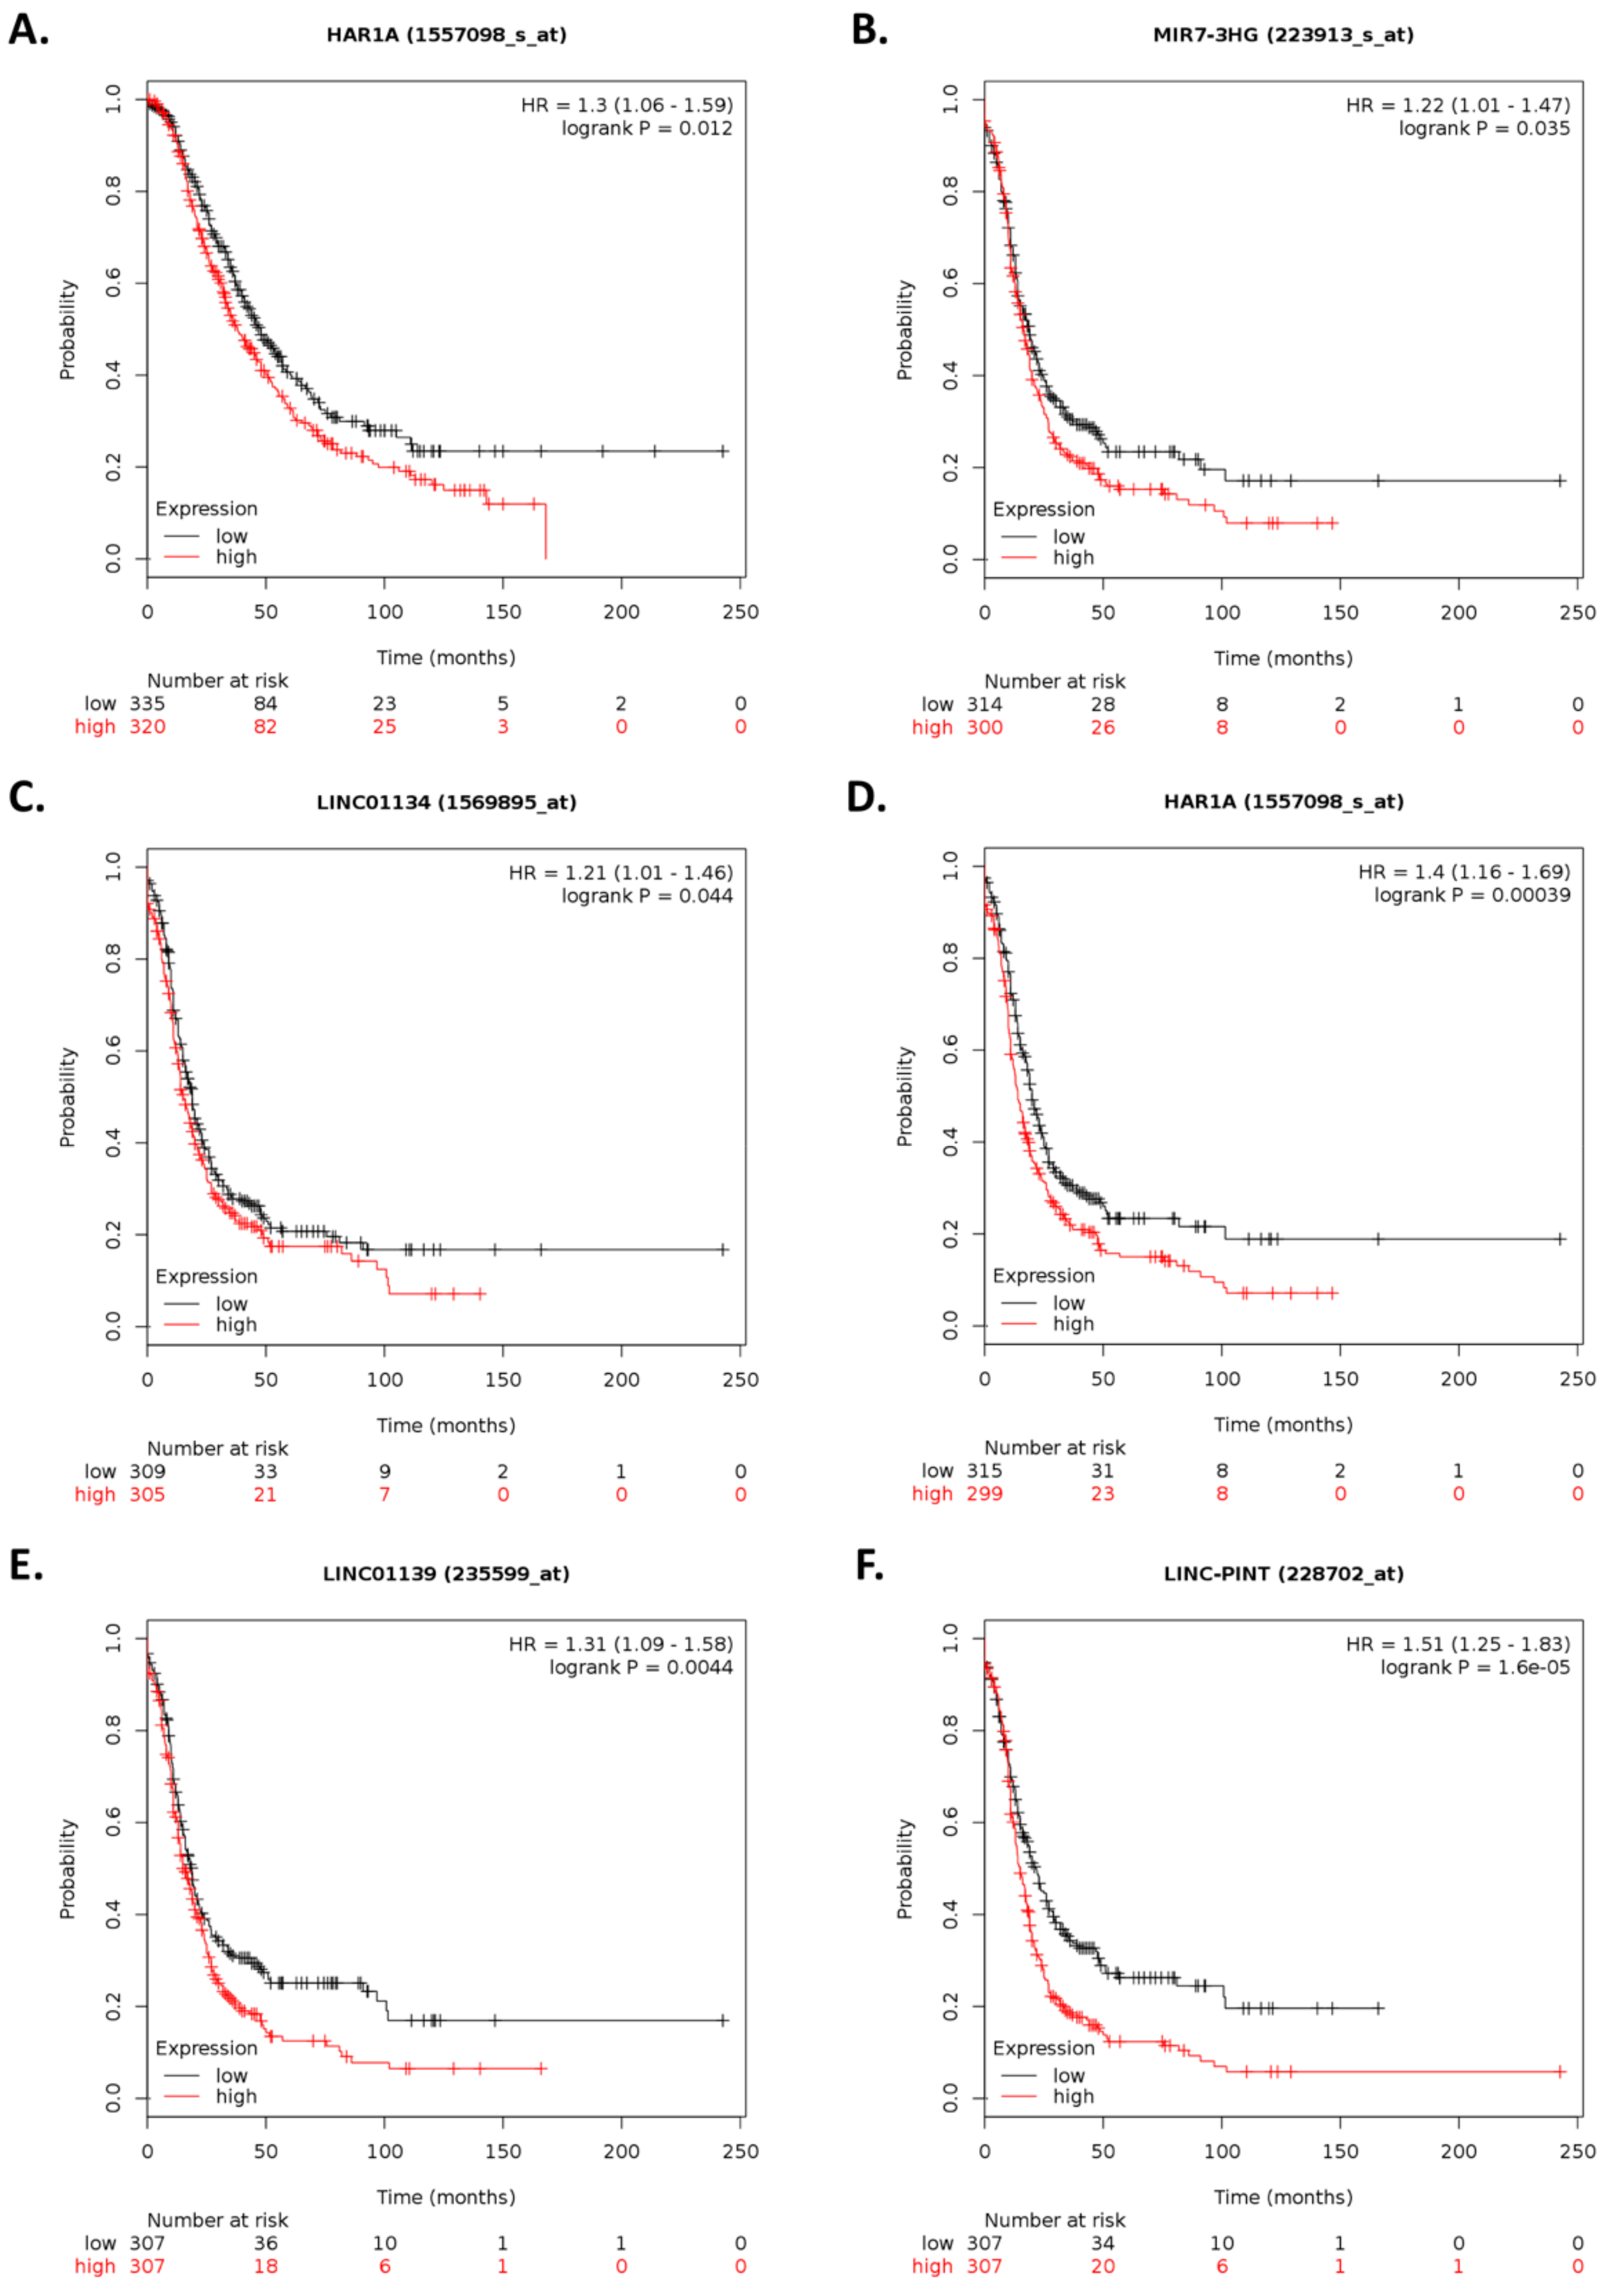
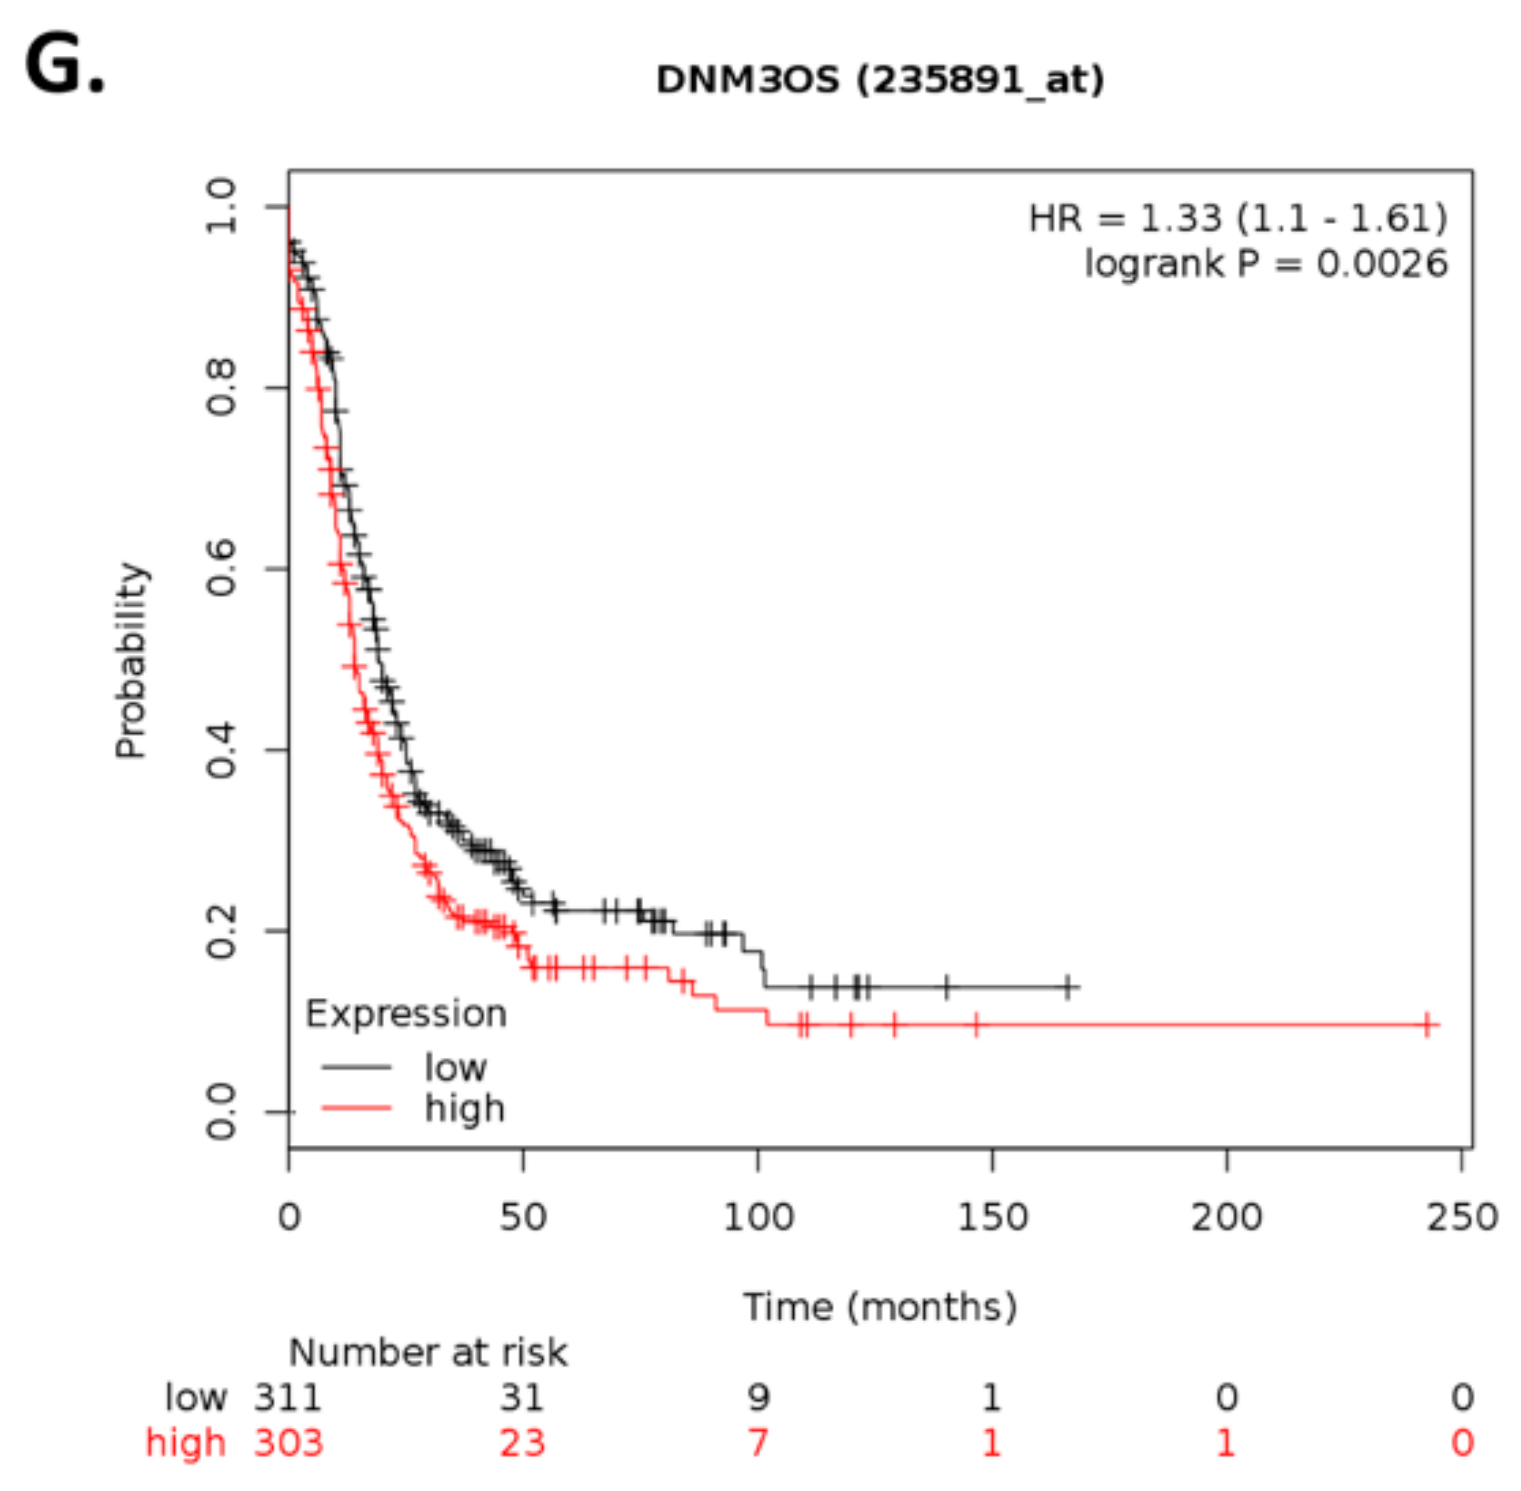
Within the top 10 differentially expressed lncRNAs, ARHGEF26-AS1 and MIR7-3HG have been previously reported in cancer. ARHGEF26-AS1 is downregulated in cancer-associated fibroblasts (CAFs) of HGSOC patients compared with normal ovarian fibroblasts (NOFs) [62]. As CAFs promote cancer metastasis [62], our results showing that ILK depletion leads to ARHGEF26-AS1 downregulation suggest additional roles for ARHGEF26-AS1 in cisplatin-resistant ovarian cancer. Similarly, MIR7-3HG upregulation in our analysis contrasts a report showing that MIR7-3HG downregulates the tumor suppressor AMBRA1 and prevents MYC dephosphorylation in lung cancer [63]. Nevertheless, our results that LINC-PINT was upregulated upon ILK-siRNA transfection is consistent with reports that show that this lncRNA inhibits cell invasion [24]. Interestingly, in osteosarcoma and gastric cancer, LINC-PINT inhibits cell invasion, migration, and proliferation by downregulating miR-21 [64,65]. In ovarian cancer, LINC-PINT is downregulated relative to normal ovary cells and tissue samples [66], whereas miR-21 is upregulated [67]. These observations warrant further investigation to elucidate the role of these lncRNAs in cisplatin-resistant ovarian cancer.
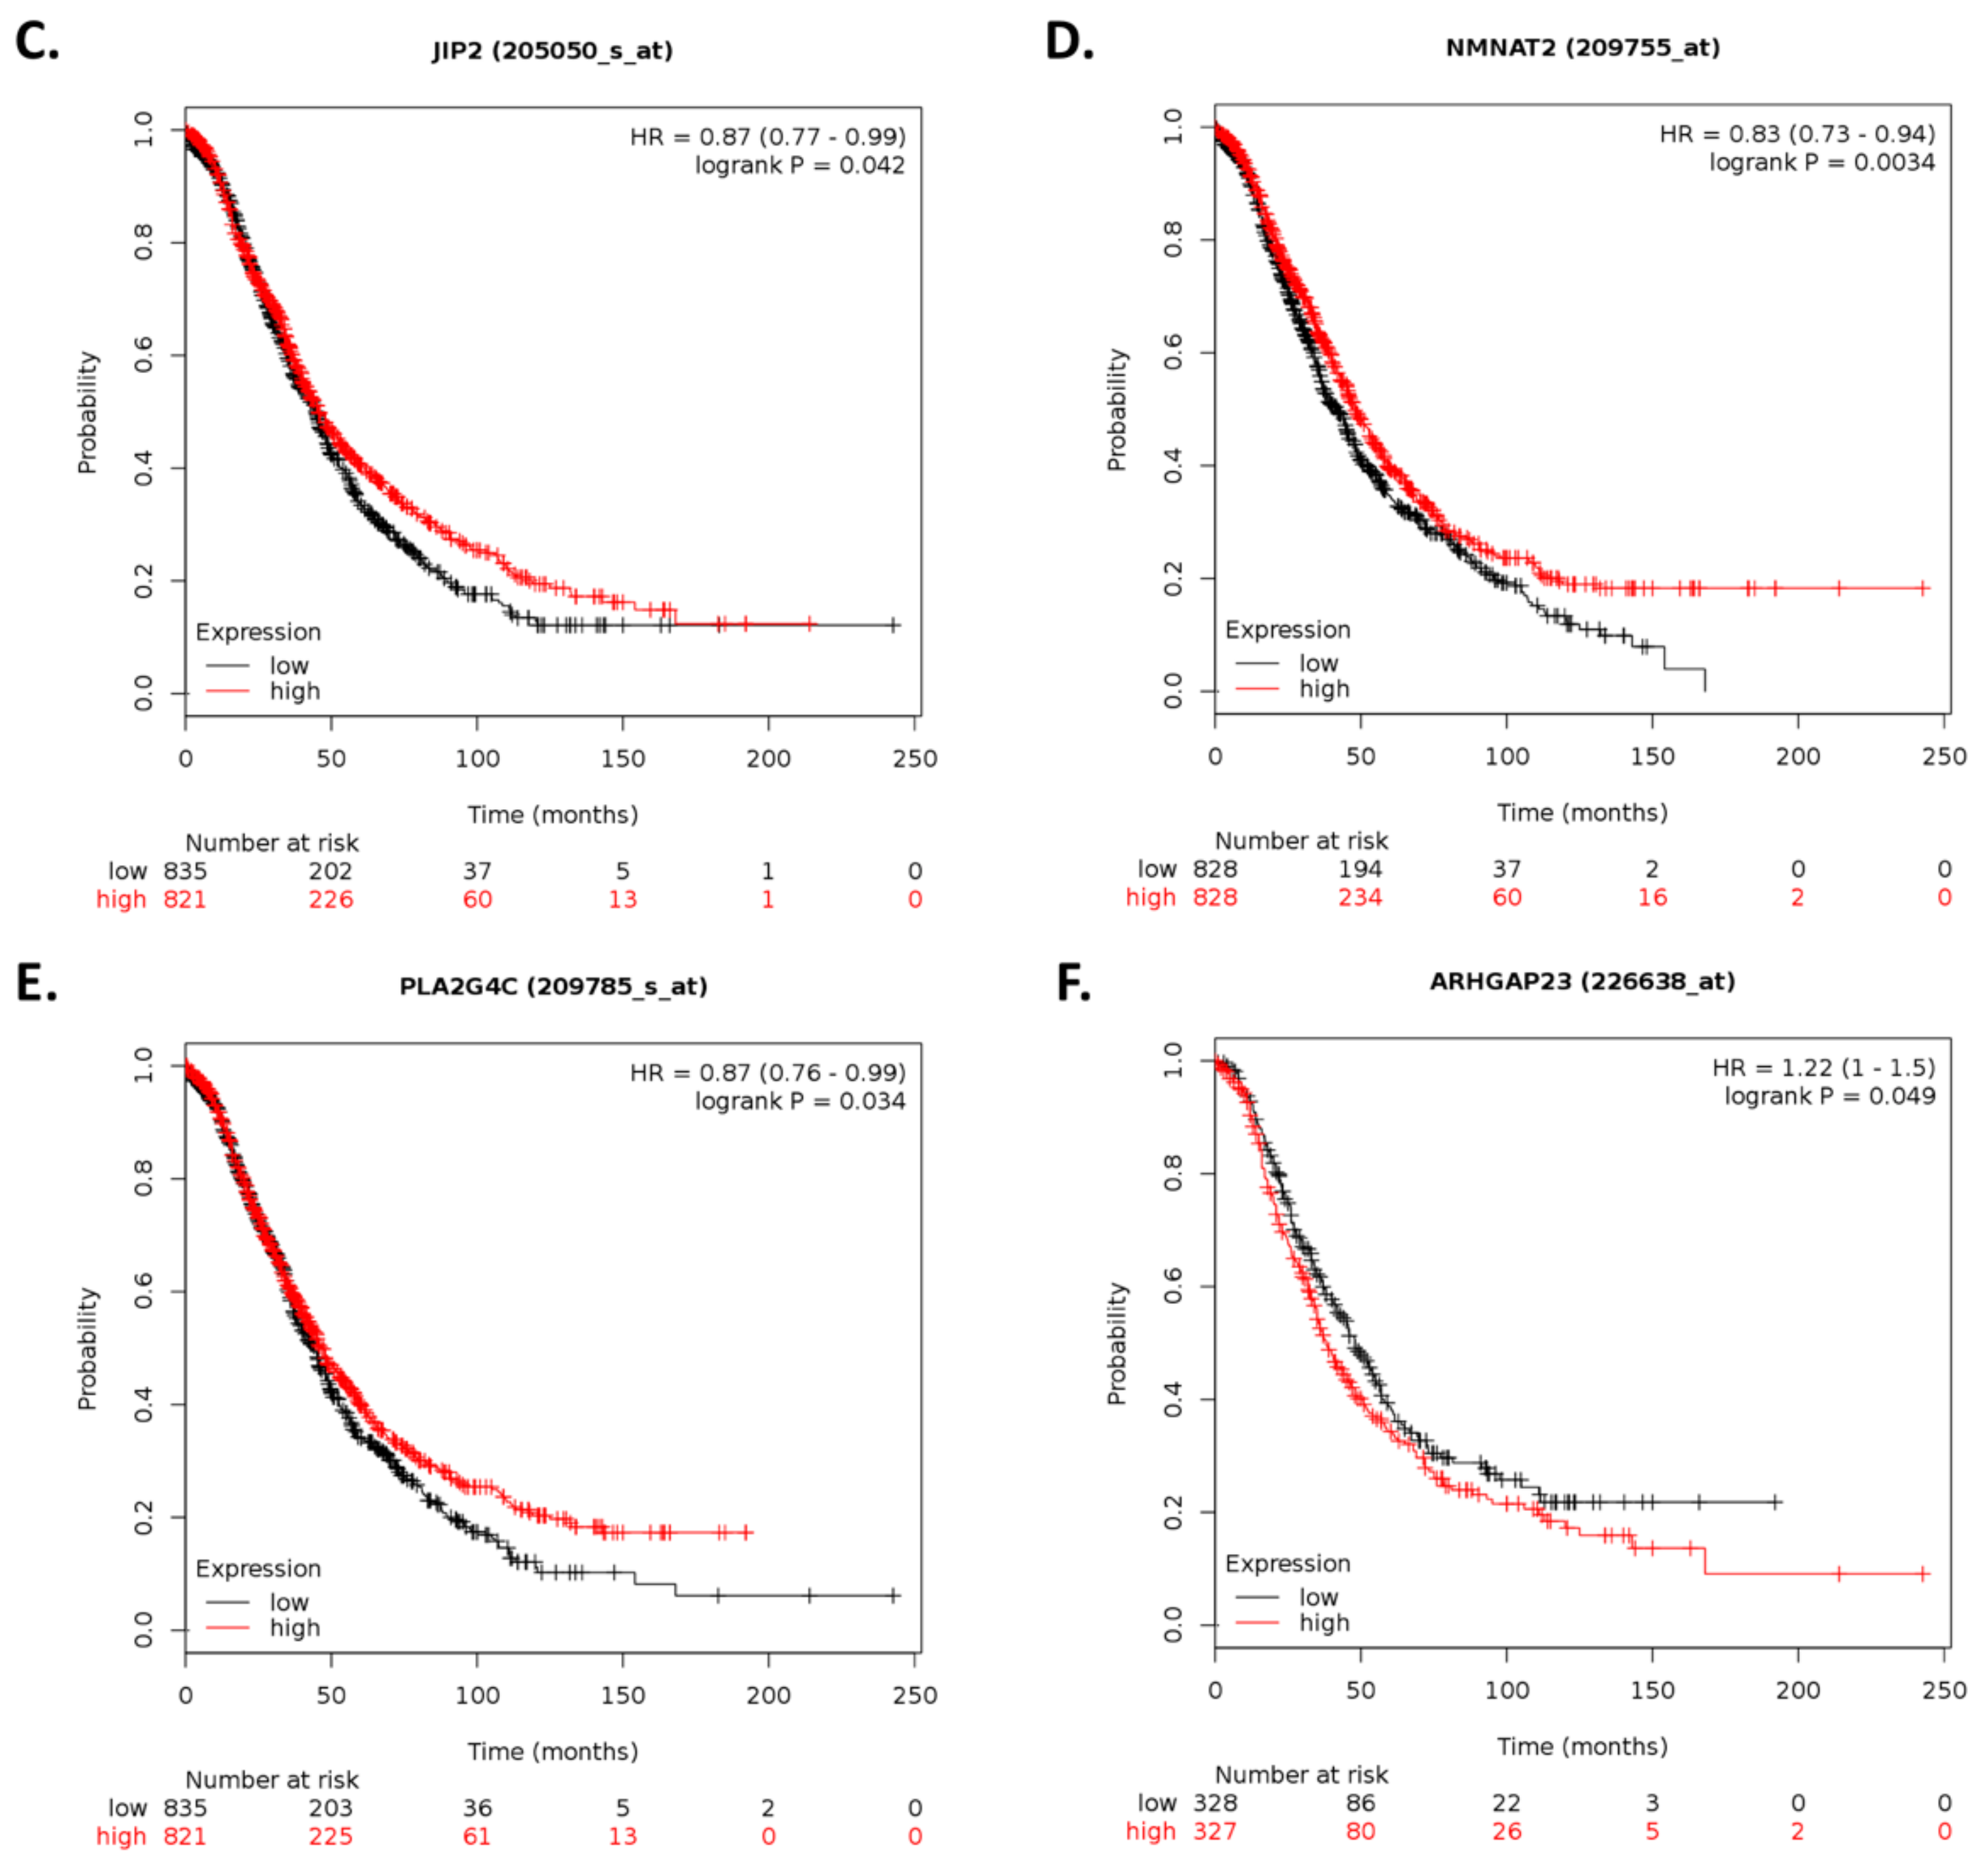
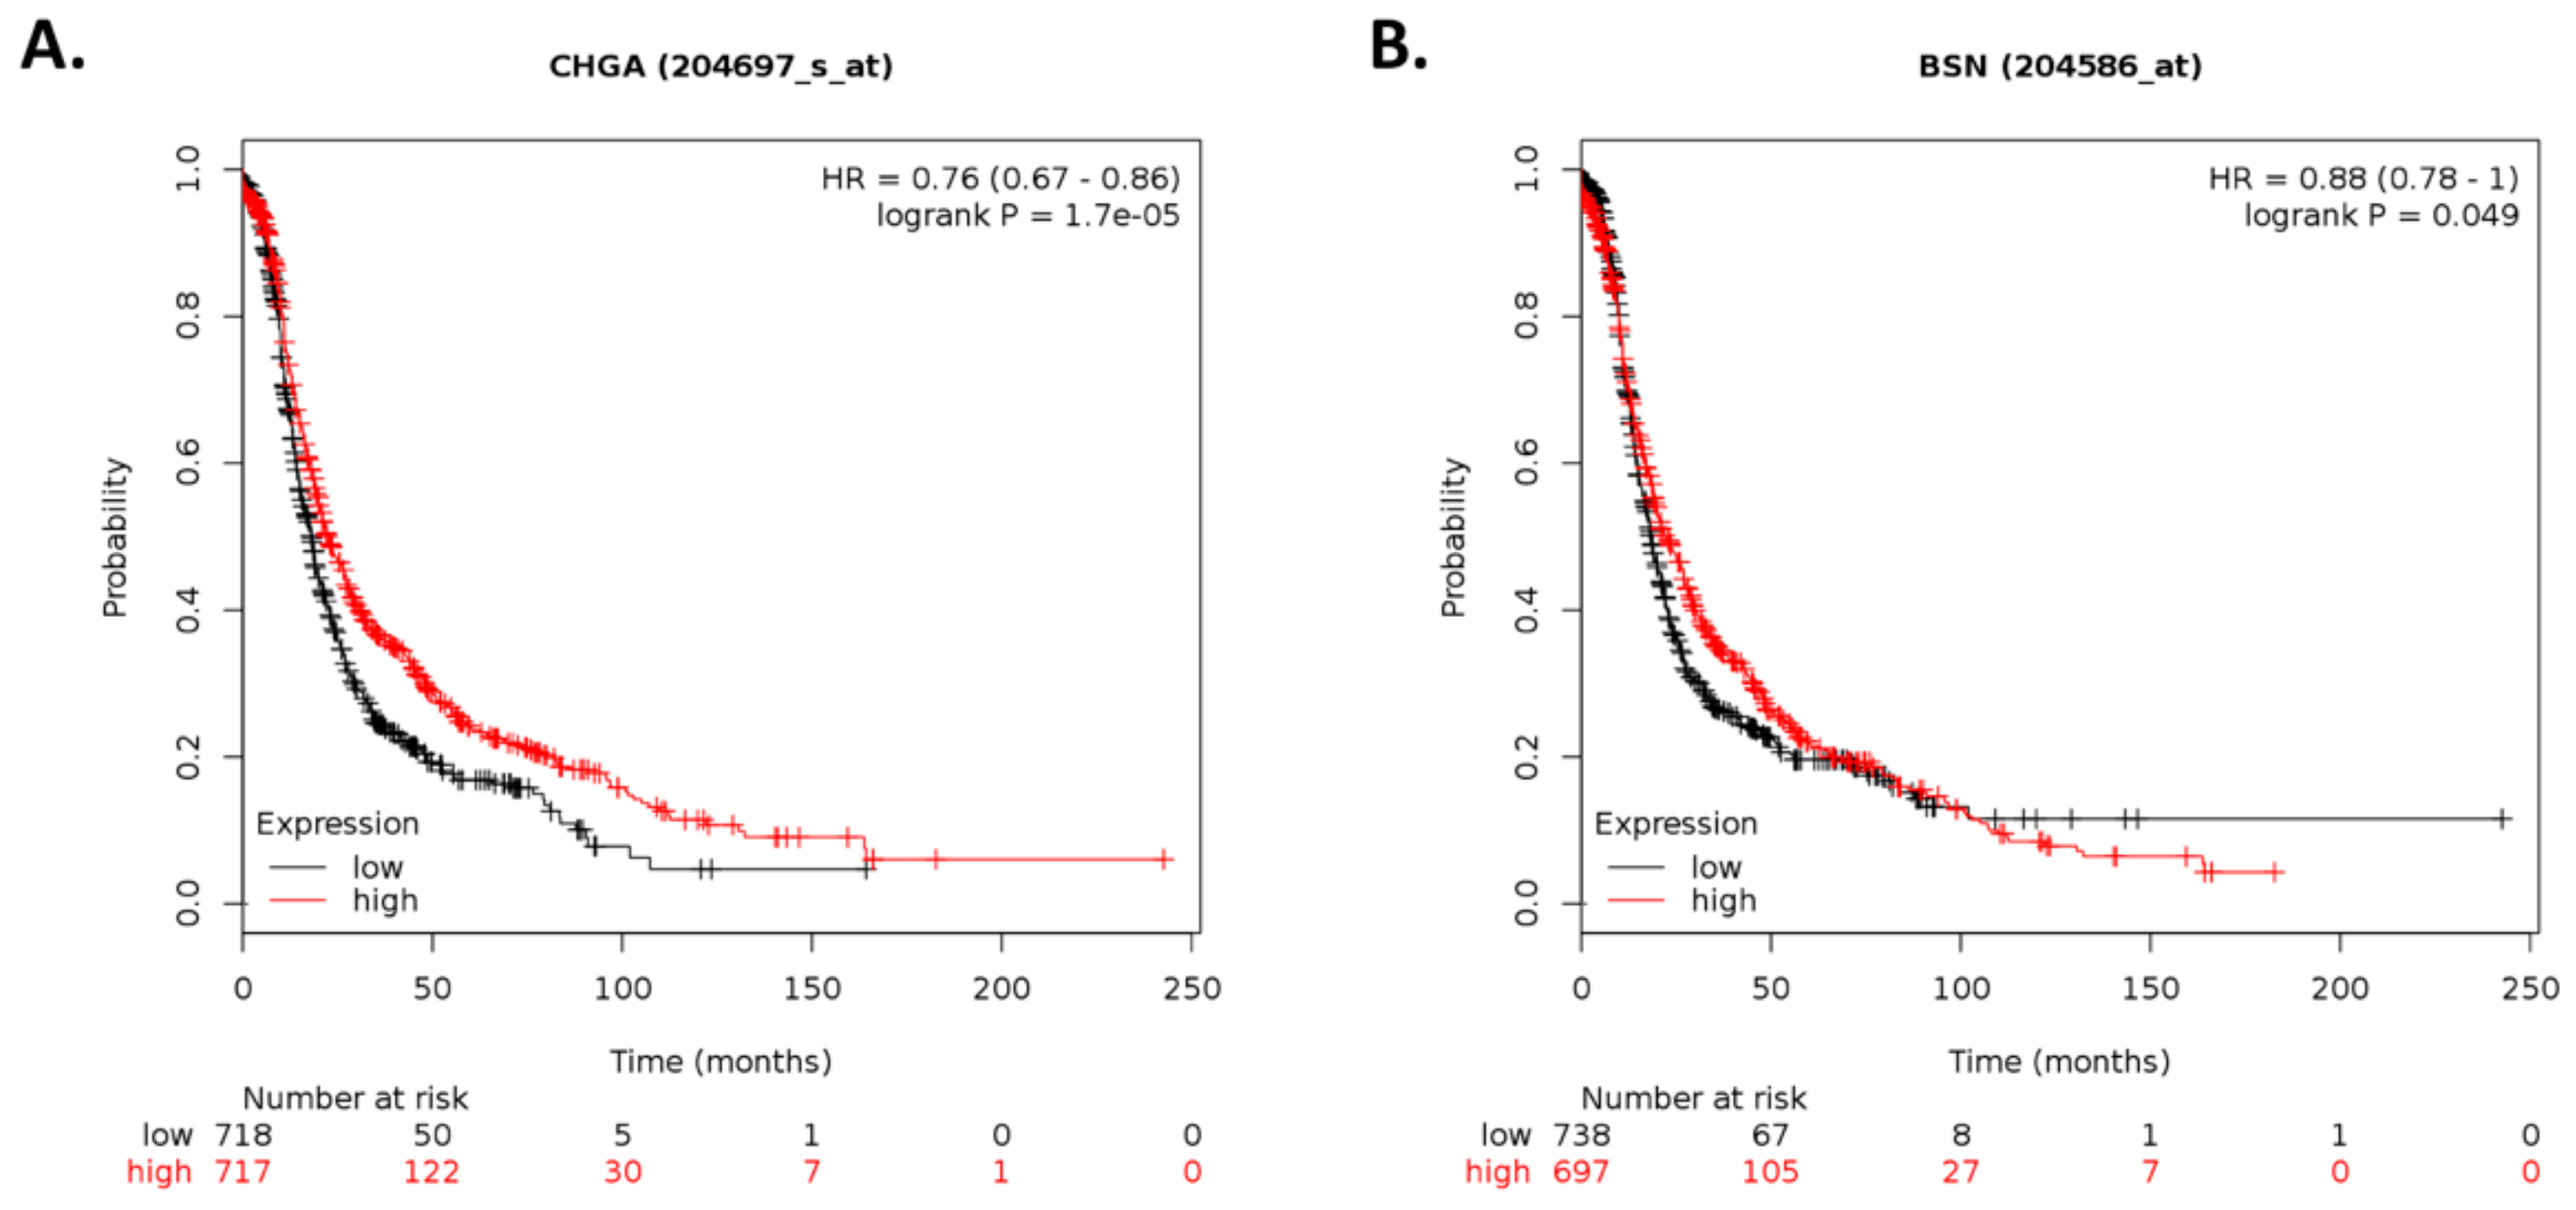
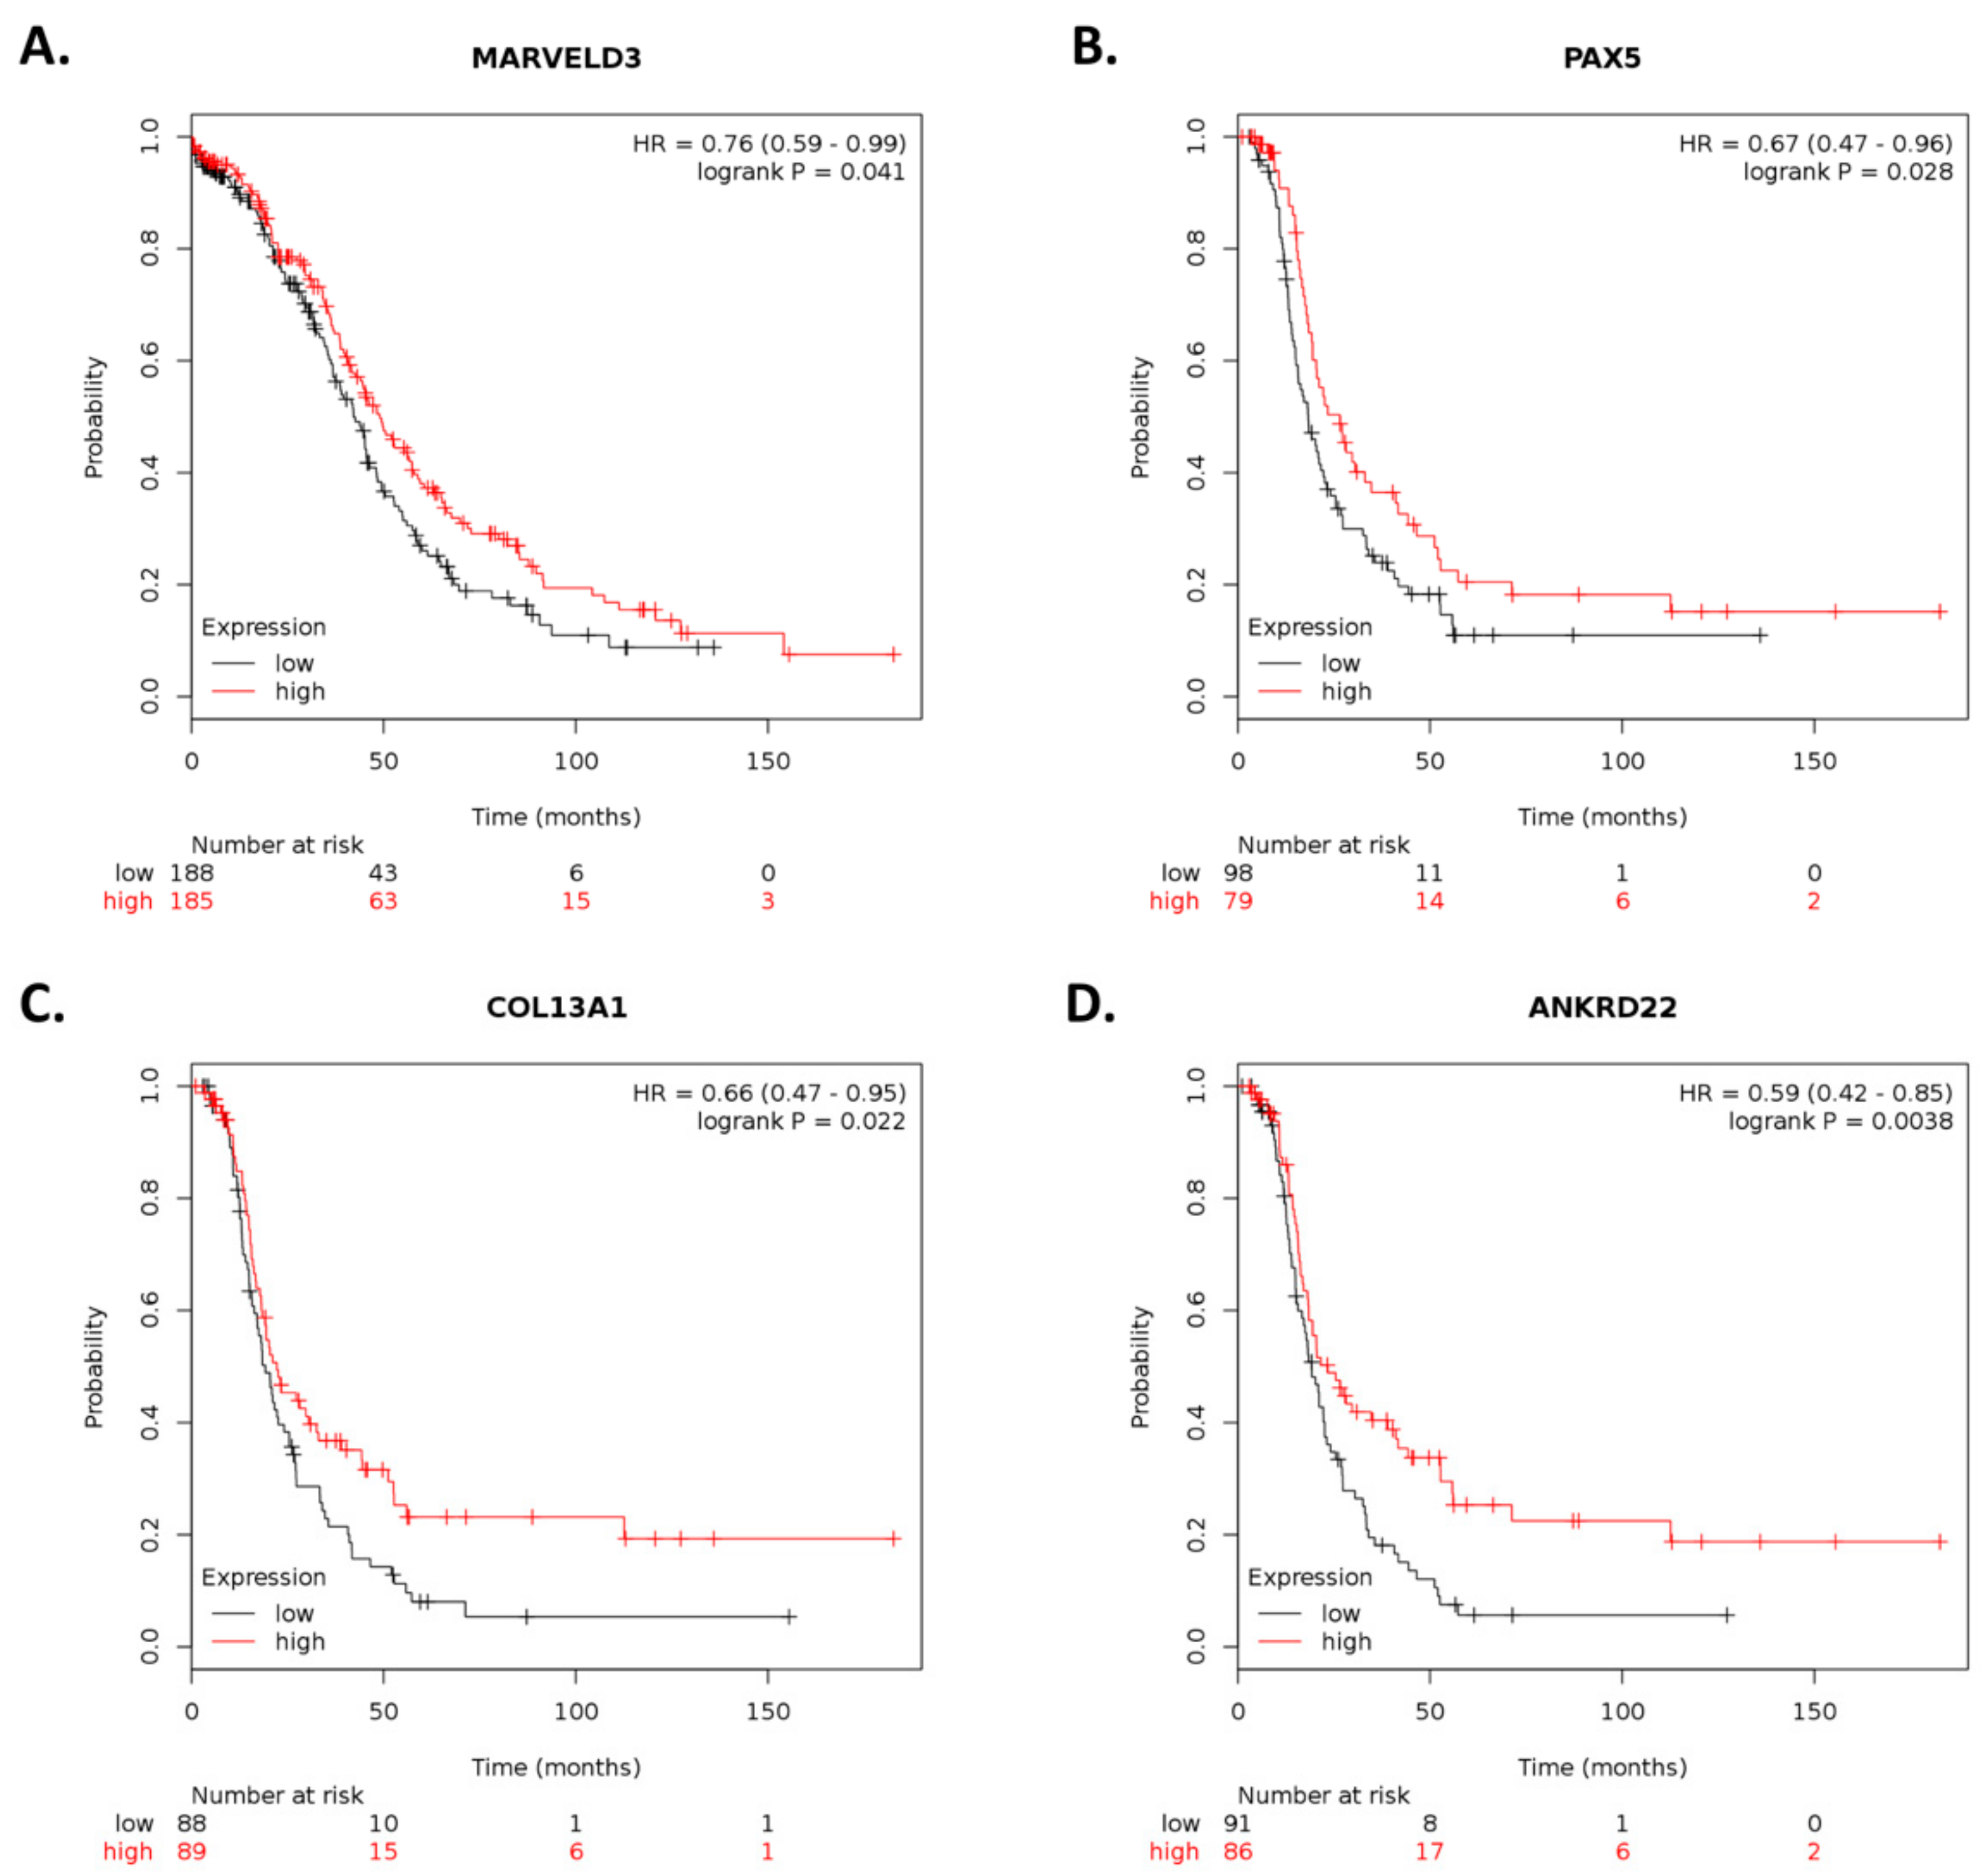
By using Kaplan–Meier analysis of publicly available mRNA expression (gene chip and RNA-Seq data) we further show that several genes differentially altered upon ILK depletion are significantly associated with survival outcomes in ovarian cancer. Based on expression levels of survival-relevant genes, we identified CHGA, BSN, SLC5A1, MAPK8IP2, NMNAT2, SEMA3G, ARHGAP23, SAG, SLC4A8, MARVELD3, PAX5, COL13A1, ANKRD22, VGF, ACTL6B, NKAIN1, CAMKV, LTF, and ILK as potential prognostic markers. Of these genes, we were able to validate CHGA, BSN, SLC5A1, MAPK8IP2, NMNAT2, SEMA3G, SLC4A8, MARVELD3, PAX5, ANKRD22, VGF, ACTL6B, CAMKV, and ILK by qRT-PCR analysis. In accordance with previous reports, CHGA can exert antiangiogenic effects and inhibit tumor growth in vivo [68]. Overexpression of PAX5 induces apoptosis in multiple myeloma [69], whereas knockdown of PAX5 increases cell proliferation and cisplatin resistance in esophageal squamous cell carcinoma [70]. Interestingly, PAX5 promoter hypermethylation has been observed in ovarian cancer [71]. Overexpression of VGF inhibits colony formation of ovarian cancer cells, however, VGF promoter hypermethylation correlates with better patient survival [72]. In contrast to our results, SEMA3G inhibits cell migration and invasion in glioma [73]. SLC5A1 promotes growth and proliferation of pancreatic cancer [74]. High expression of SGLT1, which is encoded by SLC5A1, is associated with tumor development and poor prognosis in ovarian cancer [75]. In addition, ANKRD22 promotes progression of non-small-cell lung cancer [76]. However, higher ANKRD22 expression levels in prostate cancer are associated with longer DFS following radical prostatectomy [77]. Therefore, further studies are required to elucidate the role of these genes and their therapeutic potential in cisplatin-resistant ovarian cancer.

4. Materials and Methods

4.1. Cells and Culture Conditions

The human ovarian epithelial cancer cells, A2780CP20, HEYA8, and HEYA8.MDR, were provided by Dr. Anil K. Sood (MD Anderson Cancer Center, Houston, TX, USA) and have been described elsewhere [78]. A2780 was purchased from the European Collection of Cell Cultures (ECACC, Porton Down, Salisbury, UK), and OV90 and OVCAR3 from the American Type Culture Collection (ATCC, Manassas, VA, USA)—both of which provide authenticated cell lines. OV90CIS and OVCAR3CIS cells were generated by exposing OV90 and OVCAR3 to increasing concentrations of cisplatin (CIS; Sigma-Aldrich, St. Louis, MO, USA). Cells were maintained in RPMI1640 (A2780, A2780CP20, HEYA8, and HEYA8.MDR; HyClone, GE Healthcare Life Sciences, Logan, UT, USA), RPMI1640 + insulin (0.01 mg/mL, OVCAR3 and OVCAR3CIS; Sigma) or M199/MCDB-105 (OV90 and OV90CIS; Gibco, Thermo Fisher Scientific, Grand Island, NY/Sigma) medium supplemented with 10% fetal bovine serum (FBS; HyClone) and 0.1% antibiotic/antimycotic solution (HyClone) at 37 °C in 5% CO2 and 95% air. All cell lines were screened for mycoplasma using the LookOut® Mycoplasma PCR detection kit (Sigma), and authenticated by Promega (Madison, WI, USA) and ATCC using Short Tandem Repeat (STR) analysis. In vitro assays were performed at 70%–85% cell density.

4.2. Western Blot Analysis

Cell pellets were lysed with ice-cold lysis buffer (1% Triton X, 150 mmol/L NaCl, 25 mmol/L Tris HCl, 0.4 mmol/L NaVO4, 0.4 mmol/L NaF, and protease inhibitor cocktail from Sigma) and total protein concentration was determined using Bio-Rad DC Protein Assay reagents (Bio-Rad, Hercules, CA). Protein samples were separated by SDS-PAGE and blotted onto nitrocellulose membranes. The membranes were blocked in either 5% non-fat dry milk (Bio-Rad) or 5% BSA (HyClone) and probed with phospho-ILK (Ser 246; Millipore, Burlington, MA, USA), ILK (Cell Signaling, Danvers, MA, USA), phospho-AKT (Ser 473; Cell Signaling), AKT (Cell Signaling), full caspase-3 (Cell Signaling), or cleaved caspase-3 (Cell Signaling) primary antibodies. Membranes were then incubated with mouse or rabbit IgG horseradish peroxidase (HRP)-linked secondary antibodies (Cell Signaling) followed by enhanced chemiluminescence and autoradiography. Bands were imaged with a FluorChem system (Alpha Innotech Corporation, San Leandro, CA, USA) and the signal intensity of each band was quantified using AlphaEaseFC software. All membranes were reprobed with β-actin monoclonal antibody (Sigma) as a normalizing control. Western blot images with molecular weight markers are shown in Figure S15.

4.3. Immunohistochemistry

Immunohistochemical (IHC) analysis of p-ILK and ILK was conducted on formalin-fixed paraffin-embedded (FFPE) specimens from chemonaïve serous papillary ovarian cancer (n = 10; ages 40–85, mean 64.70 ± 13.320) and normal ovary samples (n = 10; ages 43–73, mean 51.70 ± 9.673) provided by the Department of Pathology at UPR-MSC. The study was carried out with approval from the UPR-MSC Institutional Review Board (IRB protocol number A9180115; category 4 exemption; informed consent is not required). A pathologist manually delineated tumor tissue on a representative hematoxylin and eosin (H&E)-stained slide from each paraffin block. Briefly, sections were deparaffinized and rehydrated. After antigen retrieval (Vector Laboratories, Burlingame, CA, USA), endogenous peroxidase was blocked with 3% H2O2, followed by non-specific protein blocking (Dako, Carpinteria, CA, USA). Human sections were incubated with phospho-ILK (Ser 246; Abcam, Cambridge, MA, USA) or ILK (Cell Signaling) primary antibodies overnight at 4 °C. After washing with PBS, anti-rabbit EnVision+ System-HRP (Dako) was used as a secondary antibody. HRP was detected with 3,3′ diaminobenzidine (DAB; Dako), counterstained with Gill’s No.3 hematoxylin (American MasterTech Scientific, Lodi, CA, USA), and cover slipped with Permount (Fisher Scientific, Fair Lawn, NJ, USA). Scoring of p-ILK and ILK expression was based on the number of positive cells (DAB stained) in each group and quantified in 5 random fields at 20×. One slide per specimen and 10 specimens per group were examined.

4.4. Small-Interfering RNA (siRNA) and In Vitro siRNA Transfection

To target human ILK (NM_001014794.2), two siRNAs [5′-GTCAAGTTCTCTTTCCAAT-3′ (ILK-siRNA(1)), and 5′-CTCAATAGCCGTAGTGTAA-3′ (ILK-siRNA(2))] targeting ILK mRNA, and a non-silencing negative control siRNA (C-siRNA) were used (Sigma). For in vitro siRNA transfections, siRNAs were mixed with HiPerfect transfection reagent (Qiagen, Valencia, CA) at 1:2 ratio (siRNA: transfection reagent) in serum and antibiotic-free Opti-MEM medium (Gibco). Transfected cells were collected 24 h after treatment for assessment of ILK protein levels by Western blot analysis.

4.5. In Vitro Inhibitor Treatment

ILK inhibitor (Cpd22) was purchased from Millipore and dissolved in DMSO (Sigma). For in vitro inhibitor treatment, cells were treated with Cpd22 for 24 h and collected for assessment of p-ILK and ILK protein levels by Western blot analysis.

4.6. In Vitro Cell Viability and Cell Growth

For cell viability assays using siRNAs, A2780, A2780CP20, OVCAR3, OVCAR3CIS, and HEYA8 cells (2 × 10⁴ cells/mL, 3 × 10⁴ cells/mL, or 10 × 104 cells/mL) were seeded into 96-well plates. Twenty-four hours later, siRNA transfection was performed as described above. The transfection mix was replaced with CIS after 24 h of siRNA treatment. Forty-eight hours after CIS treatment, the medium was removed and Alamar blue dye (Invitrogen, Thermo Fisher Scientific, Eugene, OR, USA) was added following the manufacturer’s instructions. Optical density (OD) values were obtained using a plate reader (Bio-Rad) and percentages of cell viability were calculated after blank OD subtraction, taking the untreated cell values as 100% cell viability. For cell viability assays using ILK inhibitor (Cpd22), A2780, A2780CP20, OV90, OV90CIS, OVCAR3, OVCAR3CIS, and HEYA8 cells (2 × 10⁴ cells/mL or 3 × 10⁴ cells/mL) were seeded into 96-well plates. Twenty-four hours later, inhibitor treatment was performed as described above. Seventy-two hours after treatment, cell viability was assessed using Alamar blue dye.
For assessment of cell growth, colony formation assays were performed using Crystal violet dye (Sigma). Briefly, A2780, A2780CP20, OVCAR3, OVCAR3CIS, OV90, and OV90CIS cells (3 × 10⁴ cells/mL or 4.5 × 10⁴ cells/mL) were seeded into 6-well plates. Twenty-four hours later, siRNAs were added to the cells. After treatment, 1000 (A2780CP20) or 2500 (A2780, OVCAR3, OVCAR3CIS, OV90, and OV90CIS) cells were seeded into 10 cm Petri dishes. Seven (A2780, A2780CP20, OVCAR3, and OVCAR3CIS) or ten (OV90 and OV90CIS) days later, colonies were fixed and stained with 0.5% Crystal violet solution in methanol. Colonies of at least 50 cells were scored in five random fields using a light microscope (CKX41; Olympus, Center Valley, PA, USA) with a total magnification of 40×.

4.7. In Vitro Cell Invasion

Cell invasion was analyzed using the matrigel transwell method as previously described [38,79]. A2780CP20, OV90CIS, and OVCAR3CIS cells (3.5 × 10⁴ cells/mL) were seeded into 10 cm Petri dishes and transfected with siRNAs. The next day, matrigel (BD Biosciences, San Jose, CA, USA) in serum-free medium was added onto the upper chambers of 24-well transwell plates and incubated at 37 °C for polymerization. Transfected cells were collected and resuspended in serum-free medium and re-seeded onto the matrigel-coated chamber. Medium containing 10% FBS was added to the lower wells. After 48 h at 37 °C, medium was removed and cells that invaded through the matrigel were fixed and stained using the Protocol Hema 3 Stain Set (Fisher Scientific, Kalamazoo, MI, USA). The invading cells were counted at 20× resolution on an Olympus IX71 microscope equipped with a digital camera (Olympus DP26). Percentages of cell invasion were calculated taking the C-siRNA-transfected cell values as 100% cell invasion.

4.8. Caspase-3 Activity

Caspase-3 activity was quantified using the Caspase-3/CPP32 Fluorometric Assay Kit (BioVision, Milpitas, CA, USA) following the manufacturer’s instructions. A2780CP20 cells (2.0 × 10⁵ cells/mL) were seeded into 10 cm Petri dishes and transfected with C-siRNA or ILK-siRNA(2) for 24 h. Seventy-two hours after transfection, floating and attached cells were collected, pellets were lysed, and total protein concentration was determined. Equal amounts of protein were mixed with 2× Reaction Buffer and 1 mM DEVD-AFC substrate in a 96-well plate and incubated at 37 °C for 1 h. Fluorescence intensity at 400 nm excitation and 505 nm emission was measured on a Varioskan Flash reader from Thermo Scientific (Waltham, MA, USA).

4.9. RNA-Seq Analysis

For RNA-Seq analysis, total RNA was isolated from C-siRNA or ILK-siRNA(2)-transfected A2780CP20 cells using the mirVanaTM miRNA Isolation Kit (Invitrogen) following the manufacturer’s instructions. RNA quality was verified on all samples with High Sensitivity RNA system on an Agilent 2200 TapeStation instrument (Agilent Technologies, Santa Clara, CA, USA). mRNA was enriched and library was prepared using NEBNext® Poly(A) mRNA Magnetic Isolation and NEBNext® Ultra™ RNA Library Prep (New England Biolabs, Ipswich, MA, USA). Once library construction was complete, qPCR was performed with KAPA SYBR® FAST qPCR in a HiSeq 4000 system (Illumina, San Diego, CA, USA) with a 2 × 150 bp configuration.

4.10. KEGG Pathway Enrichment, Gene Ontology, and Network Analysis

Differentially expressed genes with a log2 fold change ≥1.5 and ≤−1.5 were enriched for their involvement in various biological pathways using KEGG (Kyoto Encyclopedia of Genes and Genomes) Pathway Enrichment. Ontological signatures, mainly biological processes, molecular functions, and cellular components were enriched based on STRING (Search Tool for the Retrieval of Interacting Genes/Proteins) integration of interaction data.
Ingenuity Pathway Analysis (IPA; Ingenuity Systems, Qiagen, Redwood City, CA, USA) software was used to determine the functional networks and pathways associated with differentially expressed genes using a p-value cutoff ≤0.001 and a log2 fold change >1.5 or <−1.5. Gene networks and canonical pathways enrichment analysis were performed filtering for all tissues, all cell lines and human species. For the identification of differentially expressed lncRNAs, a p-value cutoff ≤0.001 and a log2 fold change >1.0 or <−1.0 were used.

4.11. Survival Analysis

Kaplan–Meier survival analysis was performed using publicly available gene chip and RNA-Seq datasets in Kaplan–Meier (KM) plotter (www.kmplot.com) [25]. For each gene symbol, the probe ID was selected, and ovarian cancer patients were split into high and low expression groups by the median values of mRNA expression. For genes with multiple probes, the best probe was selected. All available datasets were used for survival analysis. Data from ovarian cancer patients, ovarian cancer patients treated with platin, serous ovarian cancer patients, and serous ovarian cancer patients treated with platin were evaluated. KM survival plots for overall survival (OS), progression-free survival (PFS), and relapse-free survival (RFS) were generated with their respective hazard ratios (HR), confidence intervals (CI), and p-values (log-rank). p-values < 0.05 were considered to be statistically significant.

4.12. SYBR-Green Based qRT-PCR Analysis

For validation of RNA-Seq data, qPCR was performed to assess expression levels of specific genes upon ILK targeting. A custom 96-well plate containing pre-designed primers was purchased from Bio-Rad. Total RNA was isolated from C-siRNA or ILK-siRNA(2)-transfected A2780CP20 cells using the GenElute Mammalian Total RNA Mini Kit (Sigma) following the manufacturer’s instructions, and reverse transcribed using the iScript™ cDNA Synthesis Kit (Bio-Rad). SYBR Green-based qPCR was conducted using SsoAdvanced™ Universal SYBR® Green Supermix (Bio-Rad) and StepOne Plus Real-Time PCR system with the suggested PrimePCR cycling protocol (activation at 95 °C for 2 min, and 40 cycles of 95 °C for 5 s and 60 °C for 30 s).

4.13. Statistical Analysis

Graphing and statistical analysis were performed using Student’s t test or ANOVA in GraphPad Prism (San Diego, CA, USA) software. p-values < 0.05 were considered to be statistically significant. Experiments were performed at least in triplicate.

5. Conclusions

Overall, this study provides further evidence that targeting ILK with siRNA is a plausible approach for ovarian cancer treatment and identifies ILK-regulated genes with potential prognostic and therapeutic value. Further studies are required to fully understand the contribution of ILK downstream effectors to cisplatin resistance in ovarian cancer.

Supplementary Materials

The following are available online at https://www.mdpi.com/2072-6694/12/4/880/s1, Figure S1: Expression of p-AKT and AKT in ovarian cancer cells, Figure S2: SiRNA-mediated ILK targeting in OV90CIS and HEYA8 cells, Figure S3: SiRNA-mediated ILK targeting in A2780, OVCAR3, and OV90 cells, Figure S4: Inhibitor-mediated ILK targeting in ovarian cancer cells, Figure S5: Effect of a small-molecule ILK inhibitor on p-ILK and ILK expression, Figure S6: Kaplan–Meier plots for gene expression-based overall survival analysis of ovarian cancer patients treated with platin, Figure S7: Kaplan–Meier plots for gene expression-based progression-free survival analysis of ovarian cancer patients treated with platin, Figure S8: Kaplan–Meier plots for gene expression-based overall survival analysis of serous ovarian cancer patients, Figure S9: Kaplan–Meier plots for gene expression-based progression-free survival analysis of serous ovarian cancer patients, Figure S10: Kaplan–Meier plots for gene expression-based overall survival analysis of serous ovarian cancer patients treated with platin, Figure S11: Kaplan–Meier plots for gene expression-based progression-free survival analysis of serous ovarian cancer patients treated with platin, Figure S12: Kaplan–Meier plots for lncRNA expression-based progression-free survival analysis of ovarian cancer patients treated with platin, Figure S13: Kaplan–Meier plots for lncRNA expression-based progression-free survival analysis of serous ovarian cancer patients, Figure S14: Kaplan–Meier plots for lncRNA expression-based progression-free survival analysis of serous ovarian cancer patients treated with platin, Figure S15: Western blot images, Table S1: Differentially expressed genes in ILK-siRNA(2) vs. C-siRNA, Table S2: Differentially expressed lncRNAs in ILK-siRNA(2) vs. C-siRNA, Table S3: Top 5 networks, Table S4: Hazard ratios for overall survival and progression-free survival of ovarian cancer patients based on differential gene expression upon ILK depletion, Table S5: Hazard ratios for overall survival and progression-free survival of ovarian cancer patients treated with platin based on differential gene expression upon ILK depletion, Table S6: Hazard ratios for overall survival and progression-free survival of serous ovarian cancer patients based on differential gene expression upon ILK depletion, Table S7: Hazard ratios for overall survival and progression-free survival of serous ovarian cancer patients treated with platin based on differential gene expression upon ILK depletion, Table S8: Hazard ratios for overall survival and progression-free survival of ovarian cancer patients based on differential lncRNA expression upon ILK depletion, Table S9: Hazard ratios for overall survival and progression-free survival of ovarian cancer patients treated with platin based on differential lncRNA expression upon ILK depletion, Table S10: Hazard ratios for overall survival and progression-free survival of serous ovarian cancer patients based on differential lncRNA expression upon ILK depletion, Table S11: Hazard ratios for overall survival and progression-free survival of serous ovarian cancer patients treated with platin based on differential lncRNA expression upon ILK depletion, and Table S12: Hazard ratios for overall survival and relapse-free survival of ovarian cancer patients based on differential gene expression upon ILK depletion.

Author Contributions

Conceptualization, P.E.V.-M.; Methodology, J.M.R.-G., P.M.B.-V., and P.E.V.-M.; Validation, J.M.R.-G, Y.S., P.M.B.-V., and F.V.; Formal Analysis, J.M.R.-G., B.I.Q.-D., Y.S., and P.M.B.-V.; Investigation, J.M.R.-G., B.I.Q.-D., Y.S., P.M.B.-V., D.S., F.V., M.J.M.-M., and R.J.F.-d.T.; Resources, M.J.M.-M. and P.E.V.-M.; Data Curation, J.M.R.-G. and P.E.V.-M.; Writing—Original Draft Preparation, J.M.R.-G.; Writing—Review and Editing, J.M.R.-G. and P.E.V.-M.; Visualization, J.M.R.-G., B.I.Q.-D., and Y.S.; Supervision, P.E.V.-M.; Project Administration, P.E.V.-M.; Funding Acquisition, J.M.R.-G., B.I.Q.-D., and P.E.V.-M. All authors have read and agreed to the published version of the manuscript.

Funding

This work was supported in part by the National Institute on Minority Health and Health Disparities (NIMHD) CCRHD (U54MD007600) and RTRN (U54MD008149); institutional seed funds from the UPR Comprehensive Cancer Center; the National Institute of General Medical Sciences (NIGMS) RISE (R25GM061838) Program; and the Puerto Rico Science Technology and Research Trust (PRSTRT).

Acknowledgments

We would like to thank Carlos Torres-Cintrón from the Puerto Rico Cancer Registry for providing demographics and clinical information of HGSOC patients.

Conflicts of Interest

The authors declare no conflict of interest. The funding sources had no role in study design, data collection, analysis and interpretation or in writing and submitting the manuscript.

References

  1. Siegel, R.L.; Miller, K.D.; Jemal, A. Cancer statistics, 2020. CA Cancer J. Clin. 2020, 70, 7–30. [Google Scholar] [CrossRef] [PubMed]
  2. Lengyel, E. Ovarian cancer development and metastasis. Am. J. Pathol. 2010, 177, 1053–1064. [Google Scholar] [CrossRef] [PubMed]
  3. Chen, V.W.; Ruiz, B.; Killeen, J.L.; Coté, T.R.; Wu, X.C.; Correa, C.N.; Howe, H.L. Pathology and Classification of Ovarian Tumors. Cancer 2003, 97, 2631–2642. [Google Scholar] [CrossRef] [PubMed]
  4. Cho, K.R.; Shih, I.-M. Ovarian cancer. Annu. Rev. Pathol. 2009, 4, 287–313. [Google Scholar] [CrossRef] [PubMed]
  5. Prat, J. New insights into ovarian cancer pathology. Ann. Oncol. 2012, 23, x111–x117. [Google Scholar] [CrossRef]
  6. Bowtell, D.D.; Böhm, S.; Ahmed, A.A.; Aspuria, P.-J.; Bast, R.C.; Beral, V.; Berek, J.S.; Birrer, M.J.; Blagden, S.; Bookman, M.A.; et al. Rethinking ovarian cancer II: Reducing mortality from high-grade serous ovarian cancer. Nat. Rev. Cancer 2015, 15, 668–679. [Google Scholar] [CrossRef]
  7. Gil, D.; Ciołczyk-Wierzbicka, D.; Dulińska-Litewka, J.; Zwawa, K.; McCubrey, J.A.; Laidler, P. The mechanism of contribution of integrin linked kinase (ILK) to epithelial-mesenchymal transition (EMT). Adv. Enzyme Regul. 2011, 51, 195–207. [Google Scholar] [CrossRef]
  8. Serrano, I.; McDonald, P.C.; Lock, F.E.; Dedhar, S. Role of the integrin-linked kinase (ILK)/Rictor complex in TGFβ-1-induced epithelial-mesenchymal transition (EMT). Oncogene 2013, 32, 50–60. [Google Scholar] [CrossRef] [Green Version]
  9. Hannigan, G.; Troussard, A.A.; Dedhar, S. Integrin-linked kinase: A cancer therapeutic target unique among its ILK. Nat. Rev. Cancer 2005, 5, 51–63. [Google Scholar] [CrossRef]
  10. Acconcia, F.; Barnes, C.J.; Singh, R.R.; Talukder, A.H.; Kumar, R. Phosphorylation-dependent regulation of nuclear localization and functions of integrin-linked kinase. Proc. Natl. Acad. Sci. USA 2007, 104, 6782–6787. [Google Scholar] [CrossRef] [Green Version]
  11. Alasseiri, M.; Ahmed, A.U.; Williams, B.R.G. Mechanisms and consequences of constitutive activation of integrin-linked kinase in acute myeloid leukemia. Cytokine Growth Factor Rev. 2018, 43, 1–7. [Google Scholar] [CrossRef] [PubMed]
  12. Yen, C.-F.; Wang, H.-S.; Lee, C.-L.; Liao, S.-K. Roles of integrin-linked kinase in cell signaling and its perspectives as a therapeutic target. Gynecol. Minim. Invasive Ther. 2014, 3, 67–72. [Google Scholar] [CrossRef] [Green Version]
  13. Persad, S.; Dedhar, S. The role of integrin-linked kinase (ILK) in cancer progression. Cancer Metastasis Rev. 2003, 22, 375–384. [Google Scholar] [CrossRef] [PubMed]
  14. Ahmed, N.; Riley, C.; Oliva, K.; Stutt, E.; Rice, G.E.; Quinn, M.A. Integrin-linked kinase expression increases with ovarian tumour grade and is sustained by peritoneal tumour fluid. J. Pathol. 2003, 201, 229–237. [Google Scholar] [CrossRef] [PubMed]
  15. Choi, Y.P.; Kim, B.G.; Gao, M.-Q.; Kang, S.; Cho, N.H. Targeting ILK and β4 integrin abrogates the invasive potential of ovarian cancer. Biochem. Biophys. Res. Commun. 2012, 427, 642–648. [Google Scholar] [CrossRef]
  16. Li, Q.; Li, C.; Zhang, Y.-Y.; Chen, W.; Lv, J.-L.; Sun, J.; You, Q.-S. Silencing of integrin-linked kinase suppresses in vivo tumorigenesis of human ovarian carcinoma cells. Mol. Med. Rep. 2013, 7, 1050–1054. [Google Scholar] [CrossRef]
  17. Bruney, L.; Liu, Y.; Grisoli, A.; Ravosa, M.J.; Stack, M.S. Integrin-linked kinase activity modulates the pro-metastatic behavior of ovarian cancer cells. Oncotarget 2016, 7, 21968. [Google Scholar] [CrossRef] [Green Version]
  18. Lin, S.-W.; Ke, F.-C.; Hsiao, P.-W.; Lee, P.-P.; Lee, M.-T.; Hwang, J.-J. Critical involvement of ILK in TGFβ1-stimulated invasion/migration of human ovarian cancer cells is associated with urokinase plasminogen activator system. Exp. Cell Res. 2007, 313, 602–613. [Google Scholar] [CrossRef]
  19. Lorenzato, A.; Torchiaro, E.; Olivero, M.; Di Renzo, M.F. The integrin-linked kinase-associated phosphatase (ILKAP) is a regulatory hub of ovarian cancer cell susceptibility to platinum drugs. Eur. J. Cancer 2016, 60, 59–68. [Google Scholar] [CrossRef]
  20. Liu, Q.; Xiao, L.; Yuan, D.; Shi, X.; Li, P. Silencing of the integrin-linked kinase gene induces the apoptosis in ovarian carcinoma. J. Recept. Signal Transduct. Res. 2012, 32, 120–127. [Google Scholar] [CrossRef]
  21. Liu, Q.; Tan, W.; Che, J.; Yuan, D.; Zhang, L.; Sun, Y.; Yue, X.; Xiao, L.; Jin, Y. 12-HETE facilitates cell survival by activating the integrin-linked kinase/NF-κB pathway in ovarian cancer. Cancer Manag. Res. 2018, 10, 5825–5838. [Google Scholar] [CrossRef] [PubMed] [Green Version]
  22. Yuan, D.; Zhao, Y.; Wang, Y.; Che, J.; Tan, W.; Jin, Y.; Wang, F.; Li, P.; Fu, S.; Liu, Q.; et al. Effect of integrin-linked kinase gene silencing on microRNA expression in ovarian cancer. Mol. Med. Rep. 2017, 16, 7267–7276. [Google Scholar] [CrossRef] [PubMed]
  23. Lee, S.L.; Hsu, E.C.; Chou, C.C.; Chuang, H.C.; Bai, L.Y.; Kulp, S.K.; Chen, C.S. Identification and characterization of a novel integrin-linked kinase inhibitor. J. Med. Chem. 2011, 54, 6364–6374. [Google Scholar] [CrossRef] [PubMed] [Green Version]
  24. Marín-Béjar, O.; Mas, A.M.; González, J.; Martinez, D.; Athie, A.; Morales, X.; Galduroz, M.; Raimondi, I.; Grossi, E.; Guo, S.; et al. The human lncRNA LINC-PINT inhibits tumor cell invasion through a highly conserved sequence element. Genome Biol. 2017, 18, 202. [Google Scholar] [CrossRef] [PubMed]
  25. Gyorffy, B.; Lánczky, A.; Szállási, Z. Implementing an online tool for genome-wide validation of survival-associated biomarkers in ovarian-cancer using microarray data from 1287 patients. Endocr. Relat. Cancer 2012, 19, 197–208. [Google Scholar] [CrossRef] [Green Version]
  26. Zhao, X.; Xu, Z.; Wang, Z.; Wu, Z.; Gong, Y.; Zhou, L.; Xiang, Y. RNA silencing of integrin-linked kinase increases the sensitivity of the A549 lung cancer cell line to cisplatin and promotes its apoptosis. Mol. Med. Rep. 2015, 12, 960–966. [Google Scholar] [CrossRef] [Green Version]
  27. Song, W.; Jiang, R.; Zhao, C.-M. Role of integrin-linked kinase in multi-drug resistance of human gastric carcinoma SGC7901/DDP cells. Asian Pac. J. Cancer Prev. 2012, 13, 5619–5625. [Google Scholar] [CrossRef] [Green Version]
  28. Tsoumas, D.; Nikou, S.; Giannopoulou, E.; Champeris Tsaniras, S.; Sirinian, C.; Maroulis, I.; Taraviras, S.; Zolota, V.; Kalofonos, H.P.; Bravou, V. ILK Expression in Colorectal Cancer Is Associated with EMT, Cancer Stem Cell Markers and Chemoresistance. Cancer Genom. Proteom. 2018, 15, 127–141. [Google Scholar]
  29. De la Puente, P.; Weisberg, E.; Muz, B.; Nonami, A.; Luderer, M.; Stone, R.M.; Melo, J.V.; Griffin, J.D.; Azab, A.K. Identification of ILK as a novel therapeutic target for acute and chronic myeloid leukemia. Leuk. Res. 2015, 39, 1299–1308. [Google Scholar] [CrossRef]
  30. Chen, X.; Mangala, L.S.; Rodriguez-Aguayo, C.; Kong, X.; Lopez-Berestein, G.; Sood, A.K. RNA interference-based therapy and its delivery systems. Cancer Metastasis Rev. 2018, 37, 107–124. [Google Scholar] [CrossRef]
  31. Luksch, H.; Uckermann, O.; Stepulak, A.; Hendruschk, S.; Marzahn, J.; Bastian, S.; Staufner, C.; Temme, A.; Ikonomidou, C. Silencing of selected glutamate receptor subunits modulates cancer growth. Anticancer Res. 2011, 31, 3181–3192. [Google Scholar] [PubMed]
  32. Choi, C.H.; Choi, J.-J.; Park, Y.-A.; Lee, Y.-Y.; Song, S.Y.; Sung, C.O.; Song, T.; Kim, M.-K.; Kim, T.-J.; Lee, J.-W.; et al. Identification of differentially expressed genes according to chemosensitivity in advanced ovarian serous adenocarcinomas: Expression of GRIA2 predicts better survival. Br. J. Cancer 2012, 107, 91–99. [Google Scholar] [CrossRef] [PubMed]
  33. Mercier, P.-L.; Bachvarova, M.; Plante, M.; Gregoire, J.; Renaud, M.-C.; Ghani, K.; Têtu, B.; Bairati, I.; Bachvarov, D. Characterization of DOK1, a candidate tumor suppressor gene, in epithelial ovarian cancer. Mol. Oncol. 2011, 5, 438–453. [Google Scholar] [CrossRef] [PubMed] [Green Version]
  34. Zhou, M.; Ye, Z.; Gu, Y.; Tian, B.; Wu, B.; Li, J. Genomic analysis of drug resistant pancreatic cancer cell line by combining long non-coding RNA and mRNA expression profling. Int. J. Clin. Exp. Pathol. 2015, 8, 38–52. [Google Scholar]
  35. Di Sario, A.; Bendia, E.; Omenetti, A.; De Minicis, S.; Marzioni, M.; Kleemann, H.W.; Candelaresi, C.; Saccomanno, S.; Alpini, G.; Benedetti, A. Selective inhibition of ion transport mechanisms regulating intracellular pH reduces proliferation and induces apoptosis in cholangiocarcinoma cells. Dig. Liver Dis. 2007, 39, 60–69. [Google Scholar] [CrossRef] [PubMed]
  36. Yang, Y.; Chen, L.; Gu, J.; Zhang, H.; Yuan, J.; Lian, Q.; Lv, G.; Wang, S.; Wu, Y.; Yang, Y.-C.T.; et al. Recurrently deregulated lncRNAs in hepatocellular carcinoma. Nat. Commun. 2017, 8, 14421. [Google Scholar] [CrossRef] [Green Version]
  37. Vivas-Mejia, P.; Benito, J.M.; Fernandez, A.; Han, H.-D.; Mangala, L.; Rodriguez-Aguayo, C.; Chavez-Reyes, A.; Lin, Y.G.; Carey, M.S.; Nick, A.M.; et al. c-Jun-NH2-kinase-1 inhibition leads to antitumor activity in ovarian cancer. Clin. Cancer Res. 2010, 16, 184–194. [Google Scholar] [CrossRef] [Green Version]
  38. Echevarría-Vargas, I.M.; Valiyeva, F.; Vivas-Mejía, P.E. Upregulation of miR-21 in cisplatin resistant ovarian cancer via JNK-1/c-Jun pathway. PLoS ONE 2014, 9, e97094. [Google Scholar] [CrossRef]
  39. Smeeton, J.; Dhir, P.; Hu, D.; Feeney, M.M.; Chen, L.; Rosenblum, N.D. Integrin-linked Kinase Controls Renal Branching Morphogenesis via Dual Specificity Phosphatase 8. J. Am. Soc. Nephrol. 2016, 27, 1465–1477. [Google Scholar] [CrossRef] [Green Version]
  40. Kondoh, K.; Nishida, E. Regulation of MAP kinases by MAP kinase phosphatases. Biochim. Biophys. Acta Mol. Cell Res. 2007, 1773, 1227–1237. [Google Scholar] [CrossRef] [Green Version]
  41. Muda, M.; Theodosiou, A.; Rodrigues, N.; Boschert, U.; Camps, M.; Gillieron, C.; Davies, K.; Ashworth, A.; Arkinstall, S. The dual specificity phosphatases M3/6 and MKP-3 are highly selective for inactivation of distinct mitogen-activated protein kinases. J. Biol. Chem. 1996, 271, 27205–27208. [Google Scholar] [CrossRef] [PubMed] [Green Version]
  42. Mercado-Pimentel, M.; Ly, N.; Smith, B.; Retana, C.; Pizarro, J.; Rolph, D.; Almario, R.; Wang, S.; Jacob, A. ILK/AKT Signaling Regulates miR-21 Expression in Vestibular Schwannoma and Meningioma. Austin J. Med. Oncol. 2018, 5, 1039. [Google Scholar]
  43. Ding, T.; Cui, P.; Zhou, Y.; Chen, C.; Zhao, J.; Wang, H.; Guo, M.; He, Z.; Xu, L. Antisense Oligonucleotides against miR-21 Inhibit the Growth and Metastasis of Colorectal Carcinoma via the DUSP8 Pathway. Mol. Ther. Nucleic Acids 2018, 13, 244–255. [Google Scholar] [CrossRef] [PubMed] [Green Version]
  44. Steed, E.; Rodrigues, N.T.; Balda, M.S.; Matter, K. Identification of MarvelD3 as a tight junction-associated transmembrane protein of the occludin family. BMC Cell Biol. 2009, 10, 95. [Google Scholar] [CrossRef] [PubMed] [Green Version]
  45. Raleigh, D.R.; Marchiando, A.M.; Zhang, Y.; Shen, L.; Sasaki, H.; Wang, Y.; Long, M.; Turner, J.R. Tight Junction–associated MARVEL Proteins MarvelD3, Tricellulin, and Occludin Have Distinct but Overlapping Functions. Mol. Biol. Cell 2010, 21, 1200–1213. [Google Scholar] [CrossRef] [Green Version]
  46. Steed, E.; Elbediwy, A.; Vacca, B.; Dupasquier, S.; Hemkemeyer, S.A.; Suddason, T.; Costa, A.C.; Beaudry, J.-B.; Zihni, C.; Gallagher, E.; et al. MarvelD3 couples tight junctions to the MEKK1-JNK pathway to regulate cell behavior and survival. J. Cell Biol. 2014, 204, 821–838. [Google Scholar] [CrossRef] [Green Version]
  47. Kojima, T.; Takasawa, A.; Kyuno, D.; Ito, T.; Yamaguchi, H.; Hirata, K.; Tsujiwaki, M.; Murata, M.; Tanaka, S.; Sawada, N. Downregulation of tight junction-associated MARVEL protein marvelD3 during epithelial–mesenchymal transition in human pancreatic cancer cells. Exp. Cell Res. 2011, 317, 2288–2298. [Google Scholar] [CrossRef]
  48. Tessema, M.; Yingling, C.M.; Liu, Y.; Tellez, C.S.; Van Neste, L.; Baylin, S.S.; Belinsky, S.A. Genome-wide unmasking of epigenetically silenced genes in lung adenocarcinoma from smokers and never smokers. Carcinogenesis 2014, 35, 1248–1257. [Google Scholar] [CrossRef] [Green Version]
  49. Lankat-Buttgereit, B.; Göke, R. The tumour suppressor Pdcd4: Recent advances in the elucidation of function and regulation. Biol. Cell 2009, 101, 309–317. [Google Scholar] [CrossRef]
  50. Bitomsky, N.; Böhm, M.; Klempnauer, K.-H. Transformation suppressor protein Pdcd4 interferes with JNK-mediated phosphorylation of c-Jun and recruitment of the coactivator p300 by c-Jun. Oncogene 2004, 23, 7484–7493. [Google Scholar] [CrossRef] [Green Version]
  51. Wei, N.; Liu, S.S.; Leung, T.H.; Tam, K.F.; Liao, X.Y.; Cheung, A.N.; Chan, K.K.; Ngan, H.Y. Loss of Programmed cell death 4 (Pdcd4) associates with the progression of ovarian cancer. Mol. Cancer 2009, 8, 70. [Google Scholar] [CrossRef] [PubMed] [Green Version]
  52. Zhang, X.; Wang, X.; Song, X.; Liu, C.; Shi, Y.; Wang, Y.; Afonja, O.; Ma, C.; Chen, Y.H.; Zhang, L. Programmed cell death 4 enhances chemosensitivity of ovarian cancer cells by activating death receptor pathway in vitro and in vivo. Cancer Sci. 2010, 101, 2163–2170. [Google Scholar] [CrossRef] [PubMed]
  53. Liu, J.; Zhai, R.; Zhao, J.; Kong, F.; Wang, J.; Jiang, W.; Xin, Q.; Xue, X.; Luan, Y. Programmed cell death 4 overexpression enhances sensitivity to cisplatin via the JNK/c-Jun signaling pathway in bladder cancer. Int. J. Oncol. 2018, 52, 1633–1642. [Google Scholar] [CrossRef] [PubMed] [Green Version]
  54. Whitmarsh, A.J. The JIP family of MAPK scaffold proteins. Biochem. Soc. Trans. 2006, 34, 828–832. [Google Scholar] [CrossRef] [PubMed]
  55. Lu, Y.; Wei, G.; Liu, L.; Mo, Y.; Chen, Q.; Xu, L.; Liao, R.; Zeng, D.; Zhang, K. Direct targeting of MAPK8IP1 by miR-10a-5p is a major mechanism for gastric cancer metastasis. Oncol. Lett. 2017, 13, 1131–1136. [Google Scholar] [CrossRef] [PubMed] [Green Version]
  56. Dickens, M.; Rogers, J.S.; Cavanagh, J.; Raitano, A.; Xia, Z.; Halpern, J.R.; Greenberg, M.E.; Sawyers, C.L.; Davis, R.J. A cytoplasmic inhibitor of the JNK signal transduction pathway. Science 1997, 277, 693–696. [Google Scholar] [CrossRef] [Green Version]
  57. Rochat-Steiner, V.; Becker, K.; Micheau, O.; Schneider, P.; Burns, K.; Tschopp, J. FIST/HIPK3: A Fas/FADD-interacting serine/threonine kinase that induces FADD phosphorylation and inhibits fas-mediated Jun NH(2)-terminal kinase activation. J. Exp. Med. 2000, 192, 1165–1174. [Google Scholar] [CrossRef]
  58. Sampson, K.E.; McCroskey, M.C.; Abraham, I. Identification of a 170 kDa membrane kinase with increased activity in KB-V1 multidrug resistant cells. J. Cell. Biochem. 1993, 52, 384–395. [Google Scholar] [CrossRef]
  59. Begley, D.A.; Berkenpas, M.B.; Sampson, K.E.; Abraham, I. Identification and sequence of human PKY, a putative kinase with increased expression in multidrug-resistant cells, with homology to yeast protein kinase Yak1. Gene 1997, 200, 35–43. [Google Scholar] [CrossRef]
  60. Xu, M.; Jin, H.; Xu, C.-X.; Sun, B.; Mao, Z.; Bi, W.-Z.; Wang, Y. miR-382 inhibits tumor growth and enhance chemosensitivity in osteosarcoma. Oncotarget 2014, 5, 9472–9483. [Google Scholar] [CrossRef] [Green Version]
  61. Curtin, J.F.; Cotter, T.G. JNK Regulates HIPK3 Expression and Promotes Resistance to Fas-mediated Apoptosis in DU 145 Prostate Carcinoma Cells. J. Biol. Chem. 2004, 279, 17090–17100. [Google Scholar] [CrossRef] [Green Version]
  62. Vafaee, F.; Colvin, E.K.; Mok, S.C.; Howell, V.M.; Samimi, G. Functional prediction of long non-coding RNAs in ovarian cancer-associated fibroblasts indicate a potential role in metastasis. Sci. Rep. 2017, 7, 10374. [Google Scholar] [CrossRef] [PubMed] [Green Version]
  63. Capizzi, M.; Strappazzon, F.; Cianfanelli, V.; Papaleo, E.; Cecconi, F. MIR7–3HG, a MYC-dependent modulator of cell proliferation, inhibits autophagy by a regulatory loop involving AMBRA1. Autophagy 2017, 13, 554–566. [Google Scholar] [CrossRef] [PubMed] [Green Version]
  64. Liu, W. LncRNA LINC-PINT Inhibits Cancer Cell Proliferation, Invasion, and Migration in Osteosarcoma by Downregulating miRNA-21. Cancer Biother. Radiopharm. 2019, 34, 258–263. [Google Scholar] [CrossRef] [PubMed]
  65. Feng, H.; Zhang, J.; Shi, Y.; Wang, L.; Zhang, C.; Wu, L. Long noncoding RNA LINC-PINT is inhibited in gastric cancer and predicts poor survival. J. Cell. Biochem. 2019, 120, 9594–9600. [Google Scholar] [CrossRef] [PubMed]
  66. Gao, C.; Zhao, D.; Zhao, Q.; Dong, D.; Mu, L.; Zhao, X.; Guo, M.; Xu, A.; Fang, L.; Liu, Q.; et al. Microarray profiling and co-expression network analysis of lncRNAs and mRNAs in ovarian cancer. Cell Death Discov. 2019, 5, 93. [Google Scholar] [CrossRef] [PubMed] [Green Version]
  67. Wang, Y.; Yang, X.; Yuan, M.; Xian, S.; Zhang, L.; Yang, D.; Cheng, Y. Promotion of ovarian cancer cell invasion, migration and colony formation by the miR-21/Wnt/CD44v6 pathway. Oncol. Rep. 2019, 42, 91–102. [Google Scholar] [CrossRef]
  68. Mahata, S.K.; Corti, A. Chromogranin A and its fragments in cardiovascular, immunometabolic, and cancer regulation. Ann. N. Y. Acad. Sci. 2019, 1455, 34. [Google Scholar] [CrossRef] [Green Version]
  69. Proulx, M.; Cayer, M.-P.; Drouin, M.; Laroche, A.; Jung, D. Overexpression of PAX5 induces apoptosis in multiple myeloma cells. Int. J. Hematol. 2010, 92, 451–462. [Google Scholar] [CrossRef]
  70. Kurimoto, K.; Hayashi, M.; Guerrero-Preston, R.; Koike, M.; Kanda, M.; Hirabayashi, S.; Tanabe, H.; Takano, N.; Iwata, N.; Niwa, Y.; et al. PAX5 gene as a novel methylation marker that predicts both clinical outcome and cisplatin sensitivity in esophageal squamous cell carcinoma. Epigenetics 2017, 12, 865–874. [Google Scholar] [CrossRef] [Green Version]
  71. Chmelařová, M.; Křepinská, E.; Spaček, J.; Laco, J.; Nekvindová, J.; Palička, V. Methylation analysis of tumour suppressor genes in ovarian cancer using MS-MLPA. Folia Biol. 2012, 58, 246–250. [Google Scholar]
  72. Brait, M.; Maldonado, L.; Noordhuis, M.G.; Noordhuis, M.; Begum, S.; Loyo, M.; Poeta, M.L.; Barbosa, A.; Fazio, V.M.; Angioli, R.; et al. Association of promoter methylation of VGF and PGP9.5 with ovarian cancer progression. PLoS ONE 2013, 8, e70878. [Google Scholar] [CrossRef]
  73. Yu, R.; Ma, L.; Li, J.; Gu, J.; Shi, Q.; Yu, R. Effects of SEMA3G on migration and invasion of glioma cells. Oncol. Rep. 2012, 28, 269–275. [Google Scholar] [CrossRef] [PubMed]
  74. Gao, H.-F.; Chen, L.-Y.; Cheng, C.-S.; Chen, H.; Meng, Z.-Q.; Chen, Z. SLC5A1 promotes growth and proliferation of pancreatic carcinoma via glucose-dependent AMPK/mTOR signaling. Cancer Manag. Res. 2019, 11, 3171–3185. [Google Scholar] [CrossRef] [Green Version]
  75. Lai, B.; Xiao, Y.; Pu, H.; Cao, Q.; Jing, H.; Liu, X. Overexpression of SGLT1 is correlated with tumor development and poor prognosis of ovarian carcinoma. Arch. Gynecol. Obstet. 2012, 285, 1455–1461. [Google Scholar] [CrossRef] [PubMed]
  76. Yin, J.; Fu, W.; Dai, L.; Jiang, Z.; Liao, H.; Chen, W.; Pan, L.; Zhao, J. ANKRD22 promotes progression of non-small cell lung cancer through transcriptional up-regulation of E2F1. Sci. Rep. 2017, 7, 4430. [Google Scholar] [CrossRef] [PubMed] [Green Version]
  77. Qiu, Y.; Yang, S.; Pan, T.; Yu, L.; Liu, J.; Zhu, Y.; Wang, H. ANKRD22 is involved in the progression of prostate cancer. Oncol. Lett. 2019, 18, 4106–4113. [Google Scholar] [CrossRef] [Green Version]
  78. Vivas-Mejia, P.E.; Rodriguez-Aguayo, C.; Han, H.-D.; Shahzad, M.M.K.; Valiyeva, F.; Shibayama, M.; Chavez-Reyes, A.; Sood, A.K.; Lopez-Berestein, G. Silencing survivin splice variant 2B leads to antitumor activity in taxane--resistant ovarian cancer. Clin. Cancer Res. 2011, 17, 3716–3726. [Google Scholar] [CrossRef] [Green Version]
  79. Báez-Vega, P.M.; Echevarría Vargas, I.M.; Valiyeva, F.; Encarnación-Rosado, J.; Roman, A.; Flores, J.; Marcos-Martínez, M.J.; Vivas-Mejía, P.E. Targeting miR-21-3p inhibits proliferation and invasion of ovarian cancer cells. Oncotarget 2016, 7, 36321–36337. [Google Scholar] [CrossRef]
Figure 1. Expression of p-ILK and ILK in ovarian cancer cells and ovarian tumor samples. Western blot analysis and immunohistochemical (IHC) staining were performed. (A) Representative Western blots showing the phosphorylated form of ILK (p-ILK) and total ILK protein levels in a panel of ovarian cancer cell lines. (B) Densitometric analysis of the band intensities shown in Figure 1A plotted as mean ± SEM (** p < 0.01 and *** p < 0.001). Phosphorylated ILK/total ILK (p-ILK/ILK) was calculated relative to parental cell lines for each group. (C) Representative IHC of p-ILK and ILK protein levels in normal ovary and tumor samples from ovarian cancer patients. (D) Expression of p-ILK and (E) ILK (positive staining) plotted as mean ±SEM (**** p < 0.0001).
Cancers 12 00880 g001
Figure 2. SiRNA-mediated ILK targeting in A2780CP20 cells. SiRNAs were transiently transfected into ovarian cancer cells. A reduction in (A,B) ILK protein levels, (C) colony formation, (D) invasion ability, and (E) cell viability was observed following ILK-siRNA transfection into A2780CP20 cells. Attached and floating cells were collected 72 h after transfection. (F) Protein extracts from siRNA-transfected cells were used to assess caspase-3 activity (DEVD-AFC cleavage). Increased caspase-3 activity was observed upon ILK-siRNA transfection. (G) Representative Western blot showing full caspase-3 and its cleavage product. (H) Densitometric analysis of the band intensities shown in Figure 2G. Mean ± SEM is shown relative to C-siRNA (* p < 0.05, ** p < 0.01, *** p < 0.001, and **** p < 0.0001) or C-siRNA + CIS (### p < 0.001).
Cancers 12 00880 g002
Figure 3. SiRNA-mediated ILK targeting in OVCAR3CIS cells. SiRNAs were transiently transfected into ovarian cancer cells. A reduction in (A,B) ILK protein levels, (C) colony formation, (D) invasion ability, and (E) cell viability was observed following ILK-siRNA transfection into OVCAR3CIS cells. Mean ± SEM is shown relative to C-siRNA (* p < 0.05 and ** p < 0.01).
Cancers 12 00880 g003
Figure 4. Network analysis by Ingenuity Pathway Analysis (IPA). The top two altered networks following siRNA-mediated ILK targeting are shown. (A) The top network includes molecules associated with nervous system development and function, organ morphology, and organismal development. (B) The second top network includes molecules associated with cell death and survival, cancer, and immunological disease. Green and red symbols denote downregulated and upregulated genes, respectively.
Cancers 12 00880 g004
Figure 5. Kaplan–Meier plots for gene expression-based overall survival analysis. Survival plots of ovarian cancer patients were generated using Kaplan–Meier plotter (KM plotter). Overall survival (OS) of patients with ovarian cancer stratified by expression levels of (A) CHGA, (B) SLC5A1, (C) MAPK8IP2, (D) NMNAT2, (E) PLA2G4C, and (F) ARHGAP23 is shown based on gene chip data. p-values < 0.05 were considered to be statistically significant.
Cancers 12 00880 g005aCancers 12 00880 g005b
Figure 6. Kaplan–Meier plots for gene expression-based progression-free survival analysis. Survival plots of ovarian cancer patients were generated using Kaplan–Meier plotter (KM plotter). Progression-free survival (PFS) of patients with ovarian cancer stratified by expression levels of (A) CHGA, (B) BSN, (C) SEMA3G, (D) ARHGAP23, (E) SAG, and (F) SLC4A8 are shown based on gene chip data. p-values < 0.05 were considered to be statistically significant.
Cancers 12 00880 g006aCancers 12 00880 g006b
Figure 7. Kaplan–Meier plots for lncRNA expression-based overall survival and progression-free survival analysis. Survival plots of ovarian cancer patients were generated using Kaplan–Meier plotter (KM plotter). Overall survival (OS) of patients with ovarian cancer stratified by expression levels of (A) HAR1A is shown based on gene chip data. Progression-free survival (PFS) of patients with ovarian cancer stratified by expression levels of (B) MIR7-3HG, (C) LINC01134, (D) HAR1A, (E) LINC01139, (F) LINC-PINT, and (G) DNM3OS are shown based on gene chip data. p-values < 0.05 were considered to be statistically significant.
Cancers 12 00880 g007aCancers 12 00880 g007b
Figure 8. Kaplan–Meier plots for gene expression-based overall survival and relapse-free survival analysis. Survival plots of ovarian cancer patients were generated using Kaplan–Meier plotter (KM plotter). Overall survival (OS) of patients with ovarian cancer stratified by expression levels of (A) MARVELD3 is shown based on RNA-Seq data. Relapse-free survival (RFS) of patients with ovarian cancer stratified by expression levels of (B) PAX5, (C) COL13A1, and (D) ANKRD22 is shown based on RNA-Seq data. p-values < 0.05 were considered to be statistically significant.
Cancers 12 00880 g008
Table 1. KEGG pathway enrichment analysis.
KEGG Term DescriptionTerm IDProteinsHitsp-ValueFDR
Metabolic Pathways11001161100400
Olfactory Transduction47403913782.00 × 10 −1912.87 × 10 −189
Pathways in Cancer52003203051.73 × 10 −1481.66 × 10 −146
PI3K-AKT Signaling Pathway41513363061.26 × 10 −1339.05 × 10 −132
MAPK Signaling Pathway40102512365.65 × 10 −1113.24 × 10 −109
Neuroactive Ligand–Receptor Interaction40802692462.28 × 10 −1081.09 × 10 −106
HTLV-I Infection51662502292.90 × 10 −1011.19 × 10 −99
Cytokine–Cytokine Receptor Interaction40602602312.21 × 10 −957.92 × 10 −94
Proteoglycans in Cancer52052182047.37 × 10 −952.35 × 10 −93
Focal Adhesion45102021901.79 × 10 −895.13 × 10 −88
Table 2. Gene ontology analysis.
GO Term DescriptionTerm IDProteinsHitsp-ValueFDR
Biological Processes
Tissue DevelopmentGO:0009888141613302.69 × 10 −1343.62 × 10 −130
Positive Regulation of Macromolecule Biosynthetic ProcessGO:0010557146713605.37 × 10 −1243.61 × 10 −120
Cell DevelopmentGO:0048468147013571.28 × 10 −1195.72 × 10 −116
Positive Regulation of RNA Metabolic ProcessGO:0051254135112593.20 × 10 −1191.08 × 10 −115
Regulation of Multicellular Organismal DevelopmentGO:2000026140012961.43 × 10 −1163.84 × 10 −113
Positive Regulation of RNA Biosynthetic ProcessGO:1902680131712265.28 × 10 −1151.18 × 10 −111
Positive Regulation of Transcription, DNA-TemplatedGO:0045893129412041.97 × 10 −1123.31 × 10 −109
Positive Regulation of Nucleic Acid-Templated TranscriptionGO:1903508129412041.97 × 10 −1123.31 × 10 −109
Positive Regulation of Cell CommunicationGO:0010647143913199.10 × 10 −1101.36 × 10 −106
Neurological System ProcessGO:0050877111610511.72 × 10 −1072.31 × 10 −104
Molecular Functions
Adenyl Nucleotide BindingGO:0030554145613398.45 × 10 −1743.16 × 10 −170
Adenyl Ribonucleotide BindingGO:0032559145013341.60 × 10 −1733.16 × 10 −170
ATP BindingGO:0005524141513012.12 × 10 −1682.79 × 10 −165
Signal Transducer ActivityGO:0004871143613095.75 × 10 −1615.67 × 10 −158
Transition Metal Ion BindingGO:0046914135512363.37 × 10 −1522.66 × 10 −149
Receptor ActivityGO:0004872131211936.41 × 10 −1444.22 × 10 −141
RNA BindingGO:0003723147013061.75 × 10 −1379.87 × 10 −135
Zinc Ion BindingGO:0008270112710381.56 × 10 −1347.70 × 10 −132
Signaling Receptor ActivityGO:0038023114610437.17 × 10 −1263.14 × 10 −123
Enzyme BindingGO:0019899125511278.41 × 10 −1263.32 × 10 −123
Cellular Components
Intrinsic Component of Plasma MembraneGO:0031226147113354.72 × 10 −687.28 × 10 −65
Integral Component of Plasma MembraneGO:0005887141912892.85 × 10 −661.89 × 10 −63
Neuron PartGO:009745810269603.67 × 10 −661.89 × 10 −63
Golgi ApparatusGO:0005794130311832.41 × 10 −609.28 × 10 −58
Cell JunctionGO:003005410319547.29 × 10 −592.25 × 10 −56
Membrane RegionGO:00985899919201.24 × 10 −583.19 × 10 −56
Endoplasmic ReticulumGO:0005783146612961.30 × 10 −492.86 × 10 −47
Neuron ProjectionGO:00430058037467.36 × 10 −481.42 × 10 −45
Plasma Membrane RegionGO:00985908277661.06 × 10 −471.82 × 10 −45
Extracellular SpaceGO:0005615119410696.36 × 10 −479.81 × 10 −45
Table 3. Top 10 upregulated and downregulated genes in ILK-siRNA(2) vs. C-siRNA.
Gene SymbolGene NameBiological RoleLog2 FCp-ValueFDR
Upregulated
GRIA4Glutamate ionotropic receptor AMPA type subunit 4Excitatory synaptic transmission9.4690.000050.00101
SCG3Secretogranin IIIPlatelet degranulation6.0340.000050.00101
CHRNB2Cholinergic receptor nicotinic beta 2 subunitSynaptic transmission4.6010.000050.00101
XKR7XK related 7Blood group precursor4.4830.000050.00101
TOMM40LTranslocase of outer mitochondrial membrane 40 likeProtein import into mitochondria4.2720.000050.00101
Downregulated
ILKIntegrin linked kinaseIntegrin-mediated signal transduction, epithelial to mesenchymal transition, metastasis−1.8530.000050.00101
SAGS-antigen visual arrestinVisual perception and surface receptor signaling−2.0740.000200.00334
SLC4A8Solute carrier family 4 member 8pH regulation, bicarbonate exchange and cell survival−2.1470.000250.00403
TEX41Testis expressed 41 (non-protein coding)Non-coding RNA−2.8950.000050.00101
NSG1Neuronal vesicle trafficking associated 1Receptor recycling, protein trafficking, synaptic transmission, apoptosis−3.2290.000750.01030
Table 4. Top 10 upregulated and downregulated lncRNAs in ILK-siRNA(2) vs. C-siRNA.
LNC IDLog2 FCp-ValueFDR
Upregulated
MIR7-3HG2.3750.000100.00230
LINC011341.9070.000350.00628
RP11-64K12.41.8180.000100.00230
RP11-799D4.41.6460.001000.01455
RP11-618K13.21.5360.000050.00128
RP11-380L11.41.4700.000050.00128
Downregulated
RP11-474G23.2−1.0290.000050.00128
RP11-20G6.3−1.0560.000050.00128
RP11-732A19.8−1.5760.000050.00128
ARHGEF26-AS1−2.0020.000050.00128
Table 5. Canonical pathways.
Ingenuity Canonical Pathways−Log p-ValueRatioMolecules
SAPK/JNK Signaling2.220.0291DUSP8, MAPK8IP2, MAPK8IP1
NAD Biosynthesis III1.850.2500NMNAT2
Phototransduction Pathway1.840.0392RGS9, SAG
NAD Salvage Pathway III1.750.2000NMNAT2
NAD Biosynthesis from 2-amino-3-carboxymuconate Semialdehyde1.670.1670NMNAT2
VDR/RXR Activation1.510.0260COL13A1, CALB1
Reelin Signaling in Neurons1.370.0217MAPK8IP2, MAPK8IP1
Role of IL-17A in Psoriasis1.340.0769CCL20
NAD Biosynthesis II (from tryptophan)1.340.0769NMNAT2
Table 6. Top 5 molecular and cellular functions.
Molecular and Cellular FunctionsFocus Molecules
Cell Death and SurvivalLTF, ILK, STK31, CALB1
Cell MorphologyPAX5, SLC4A8, ILK, LSP1
Cellular Assembly and OrganizationGFAP, STON2, GOLGA2, AP3B2, ACTL6B, NPM2, ILK, CPLX1, COL13A1, LMOD1, DCC
Cellular DevelopmentAPLN, CDK5R2, FOXP1, CCL20, DCC, ILK, MARVELD3
Cellular Function and MaintenanceILK, SLC4A8, CCL20, CPLX1, EXOC3L1, CHGA, STON2, GFAP, GOLGA2, DCC
Table 7. Validation of target genes by qRT-PCR analysis in ILK-siRNA(2) vs. C-siRNA.
Gene SymbolFCp-Value
Upregulated
ACTL6B29.310.0112
CHGA7.884<0.0001
SLC5A16.524<0.0001
PAX55.9450.0010
VGF5.6920.0008
ANKRD223.7650.0056
BSN3.7290.0171
COL13A12.7650.0724
MAPK8IP22.4030.0044
MARVELD32.3180.0001
NMNAT22.283<0.0001
CAMKV2.2380.0057
Downregulated
NKAIN1−0.7110.1225
ARHGAP23−0.94260.4016
ILK−2.539<0.0001
SLC4A8−2.7060.0381
SEMA3G−2.8220.0155

