Procedural Requirements and Recommendations for Multiplex Immunofluorescence Tyramide Signal Amplification Assays to Support Translational Oncology Studies

 ,
, 
 , and
, and
Abstract
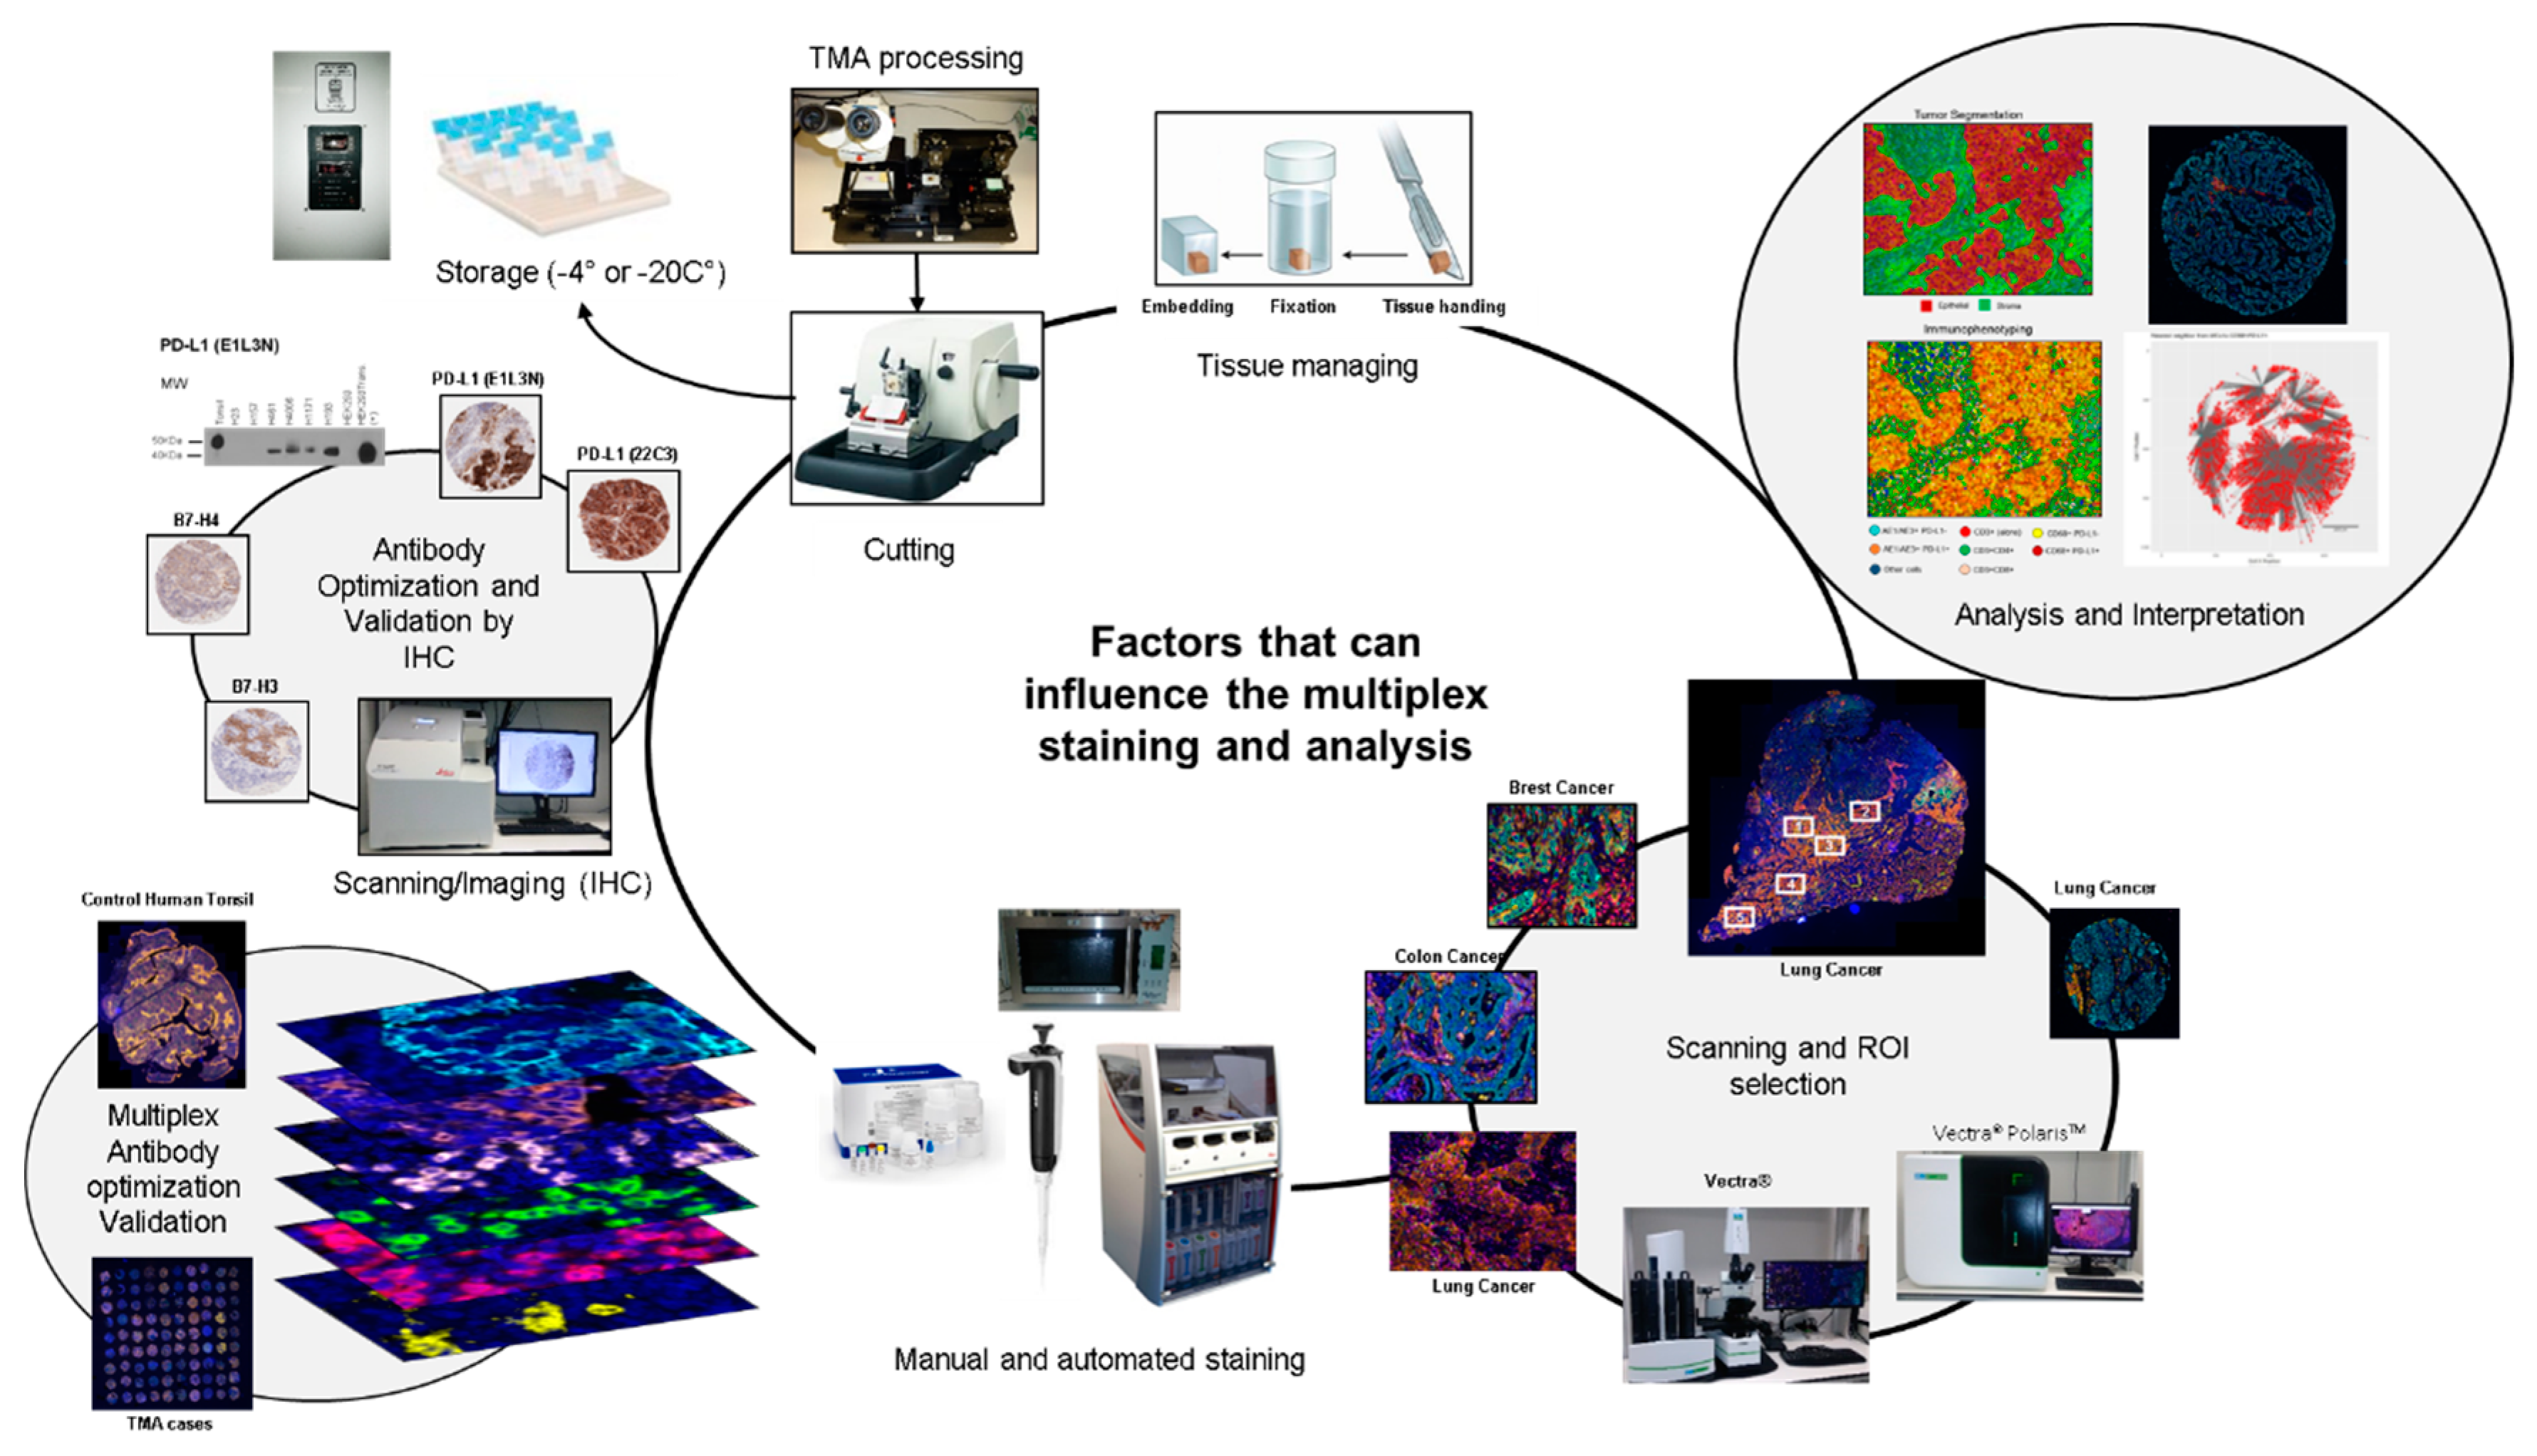
1. Introduction
2. New Panel Design of the Study
3. Tissue Control Selection
4. Antibody Optimization and Validation
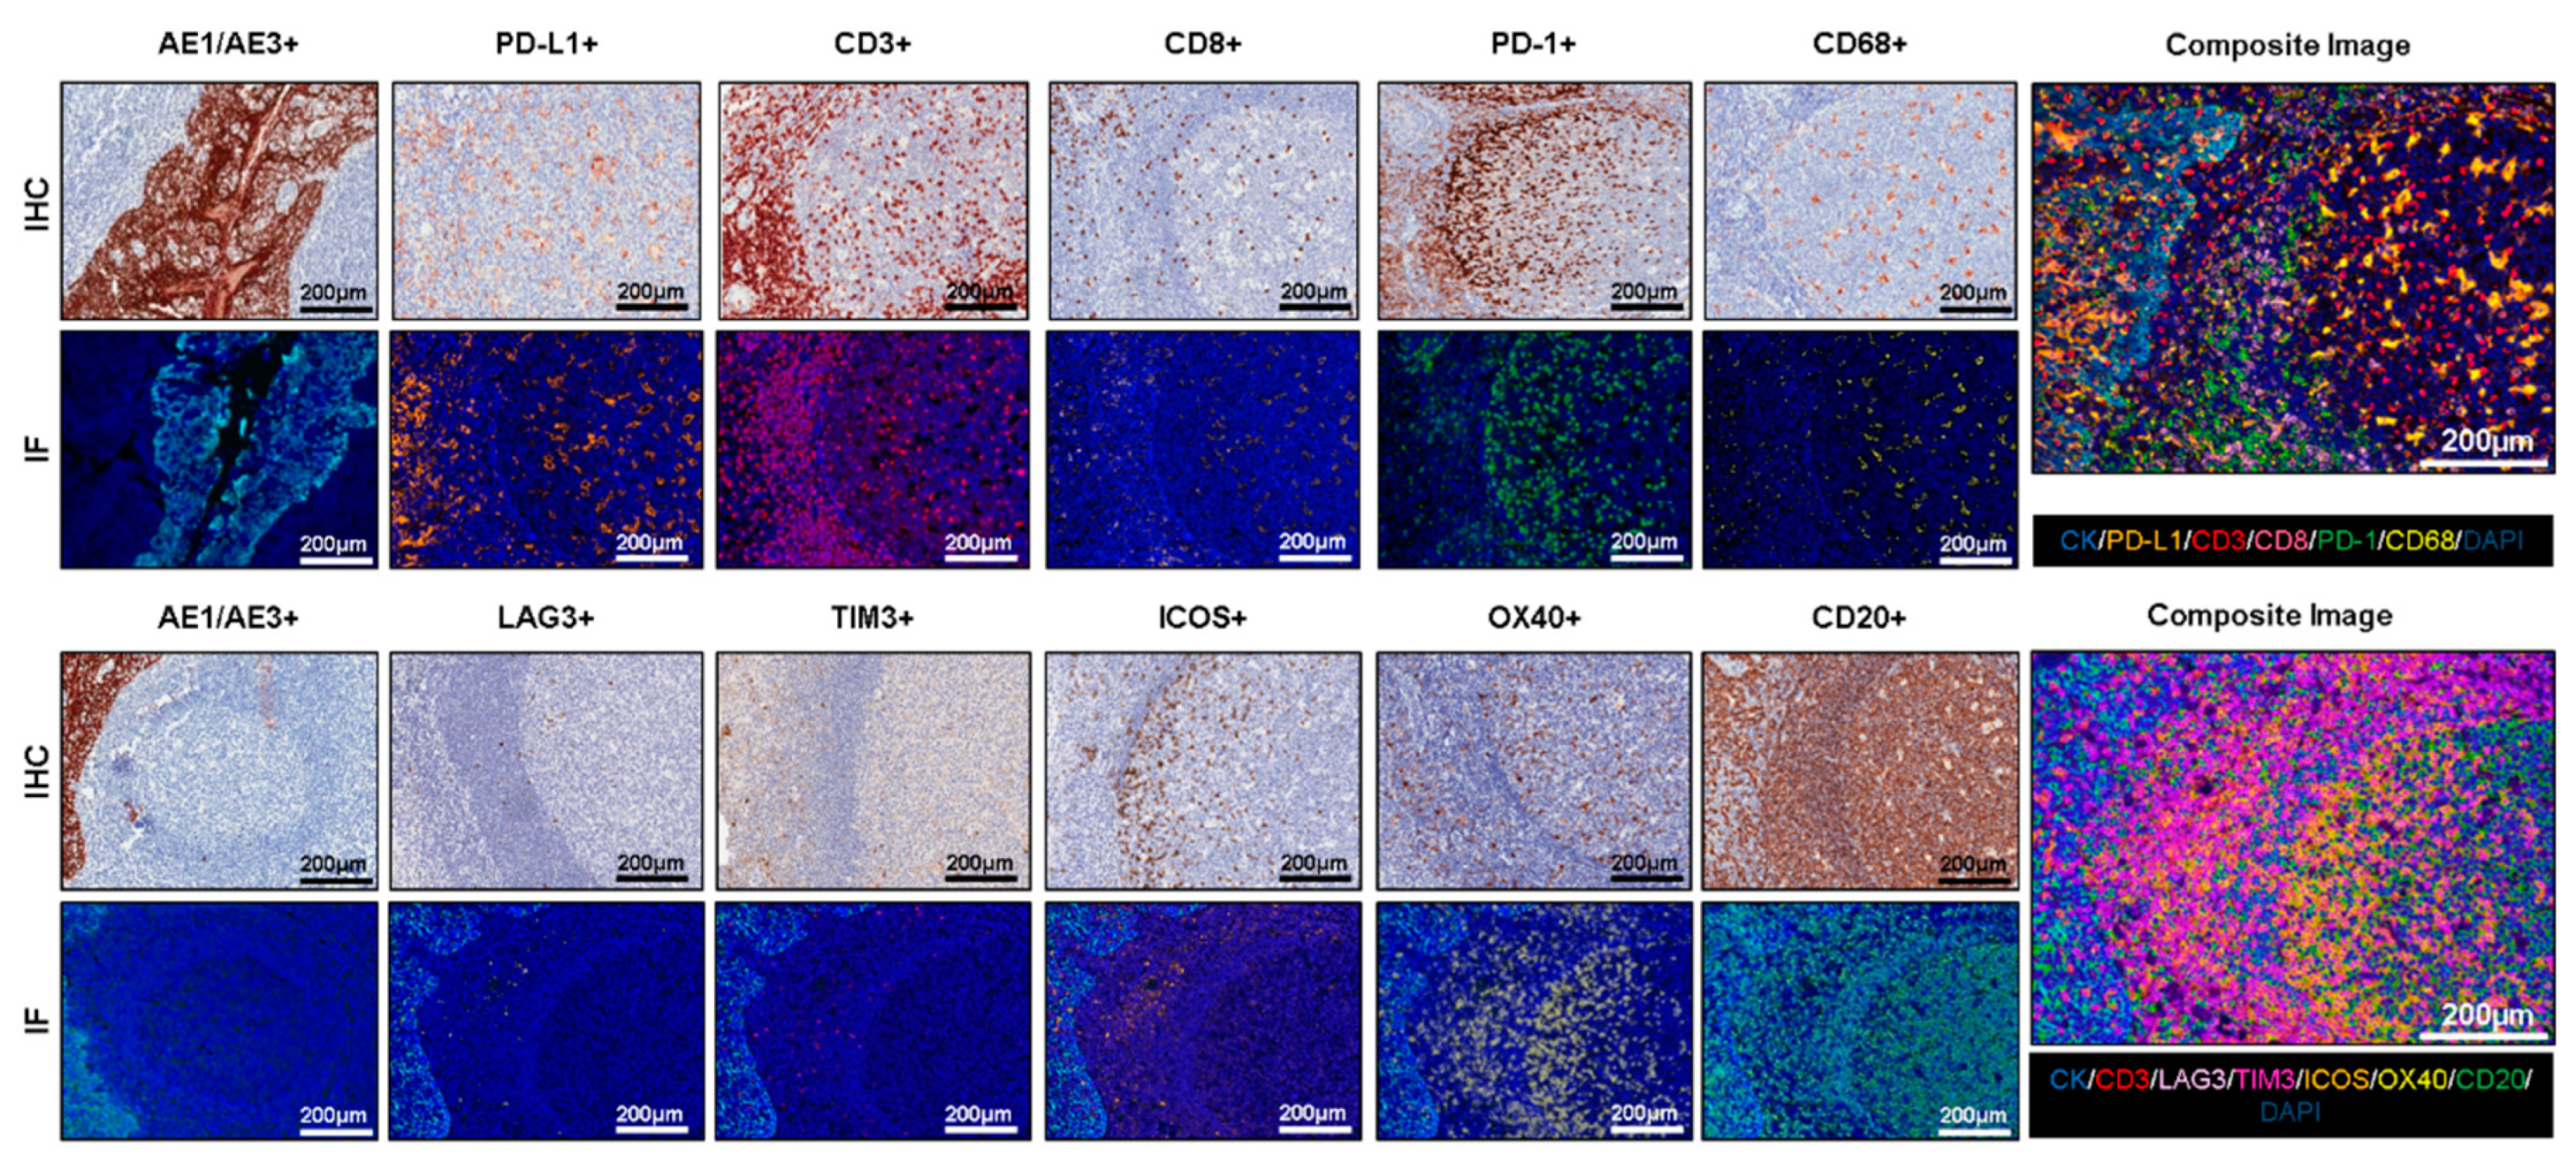
4.1. Uniplex IF Antibody Optimization
4.2. Multiplex IF Optimization
4.3. Staining Interferences
5. Spectral Library
6. Pre-Analytical Interference
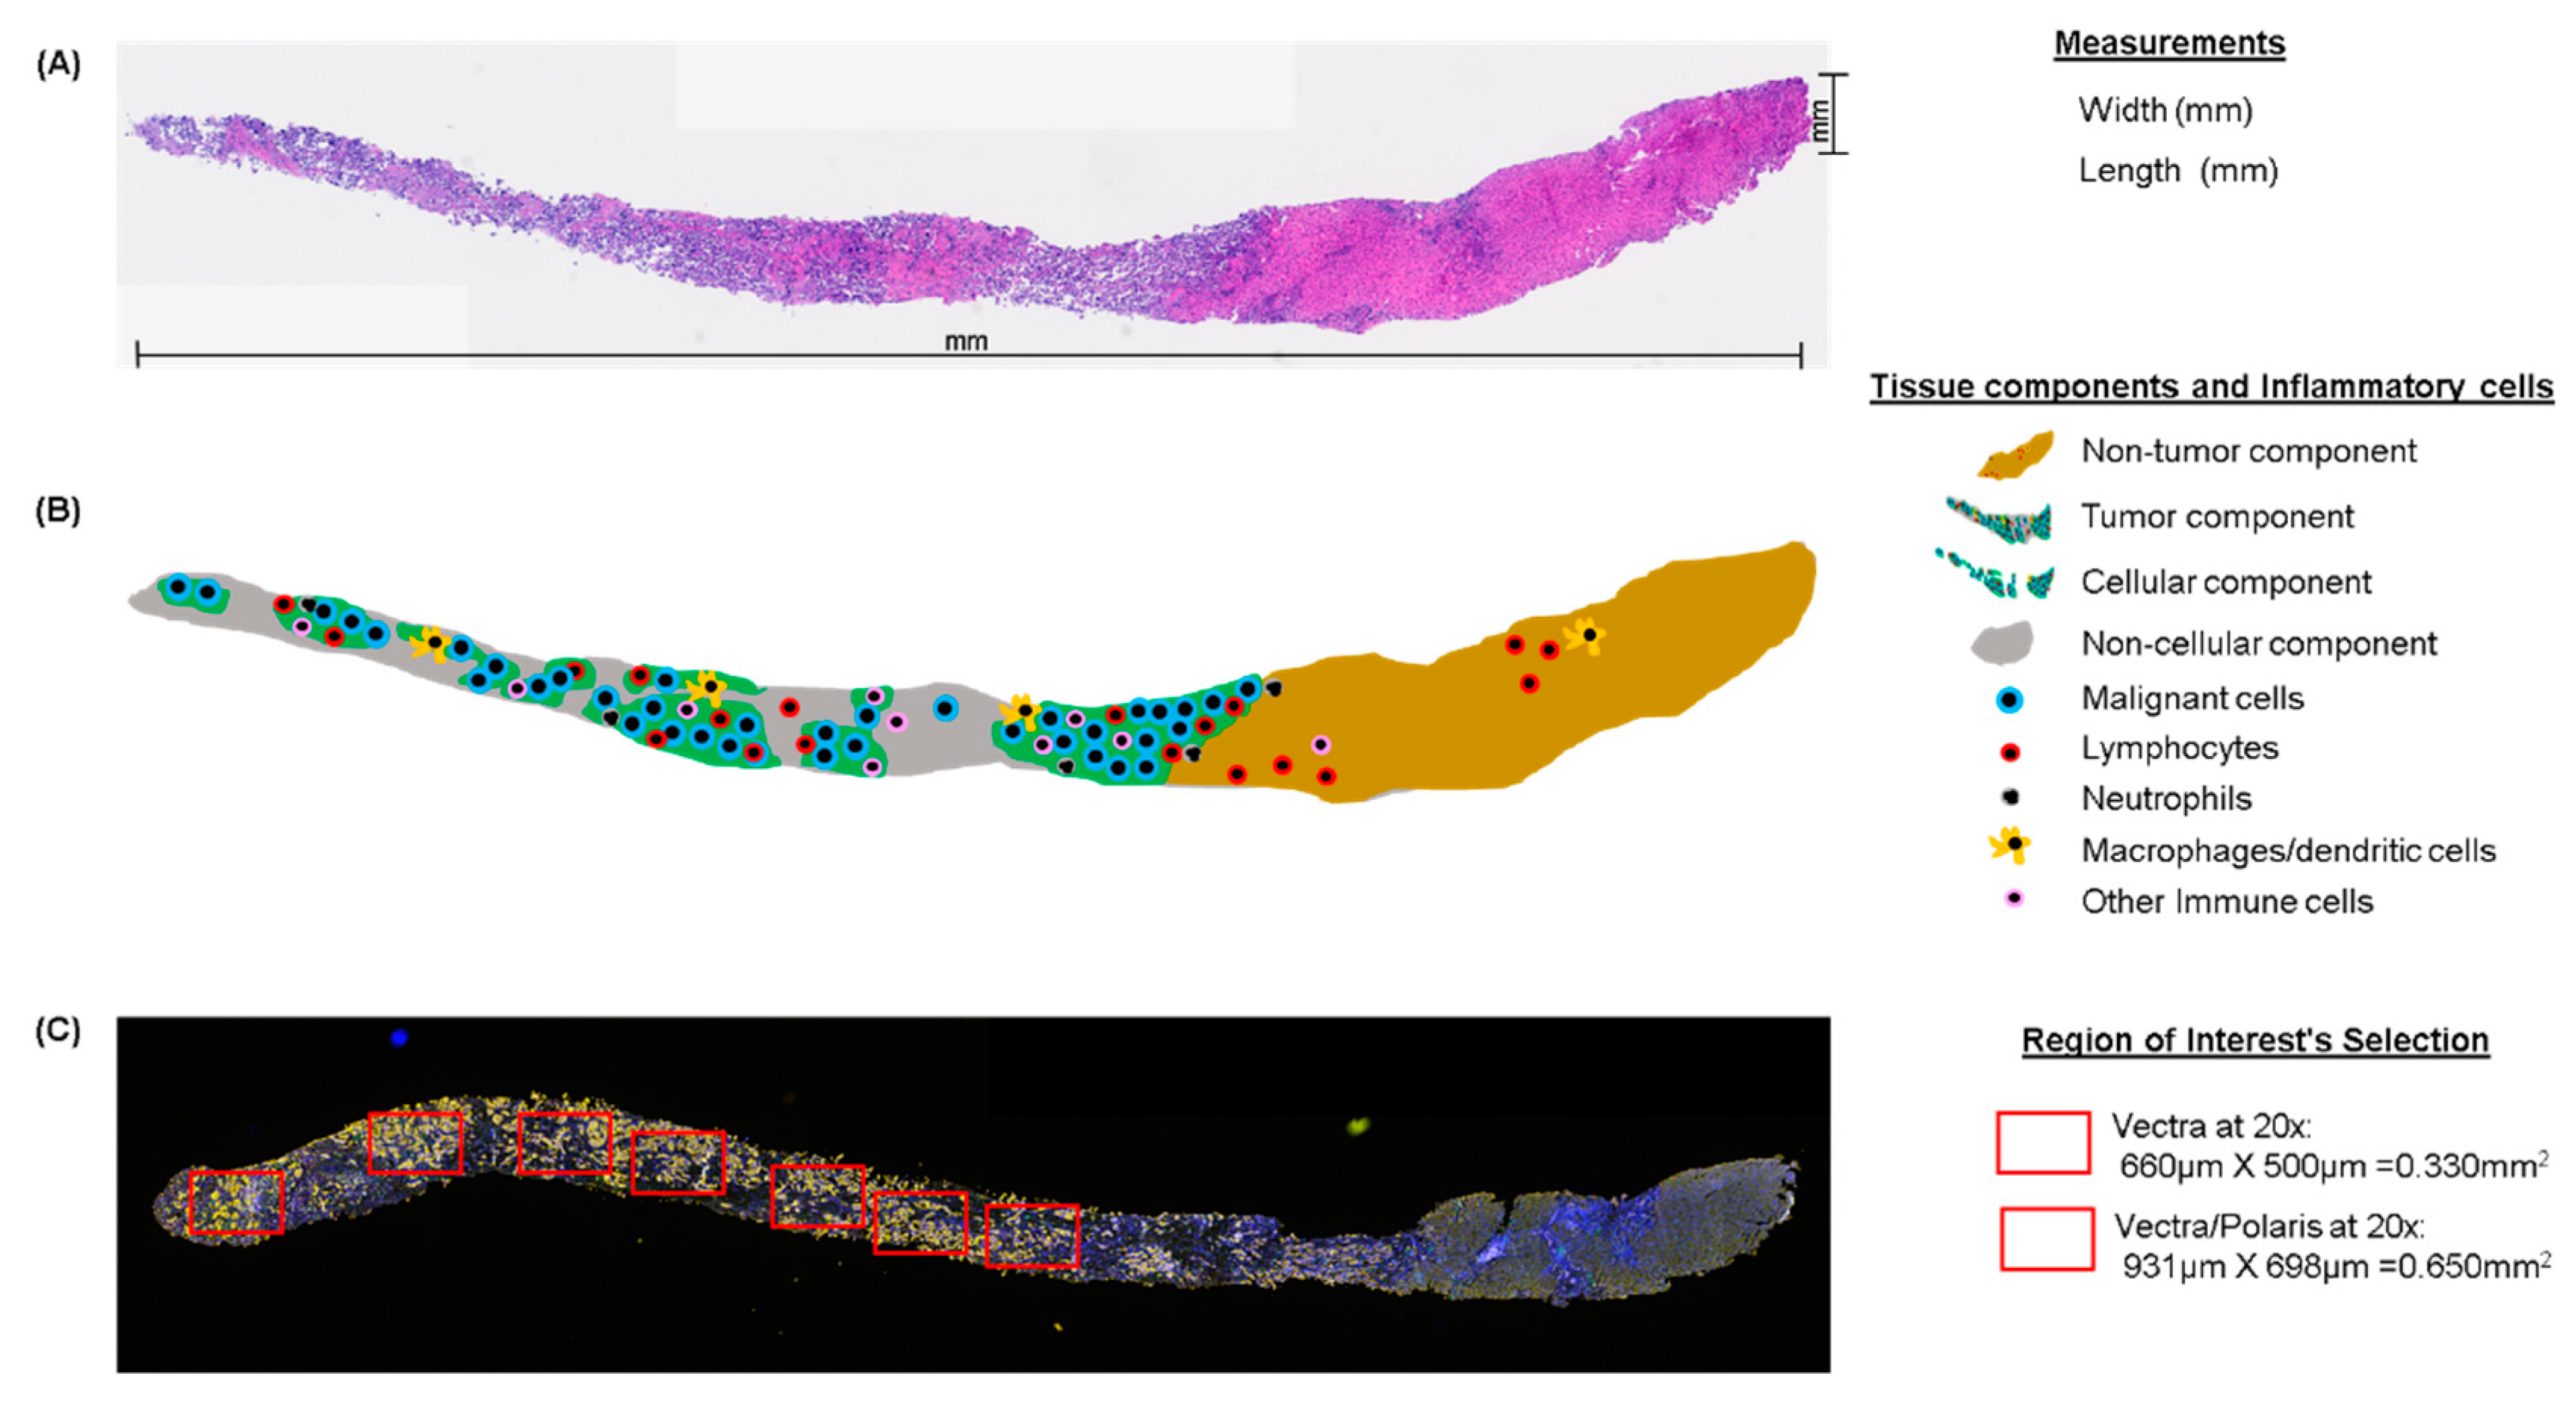
7. Tissue Quality Components
8. Pathology Quality Control for Selection of Oncology Samples
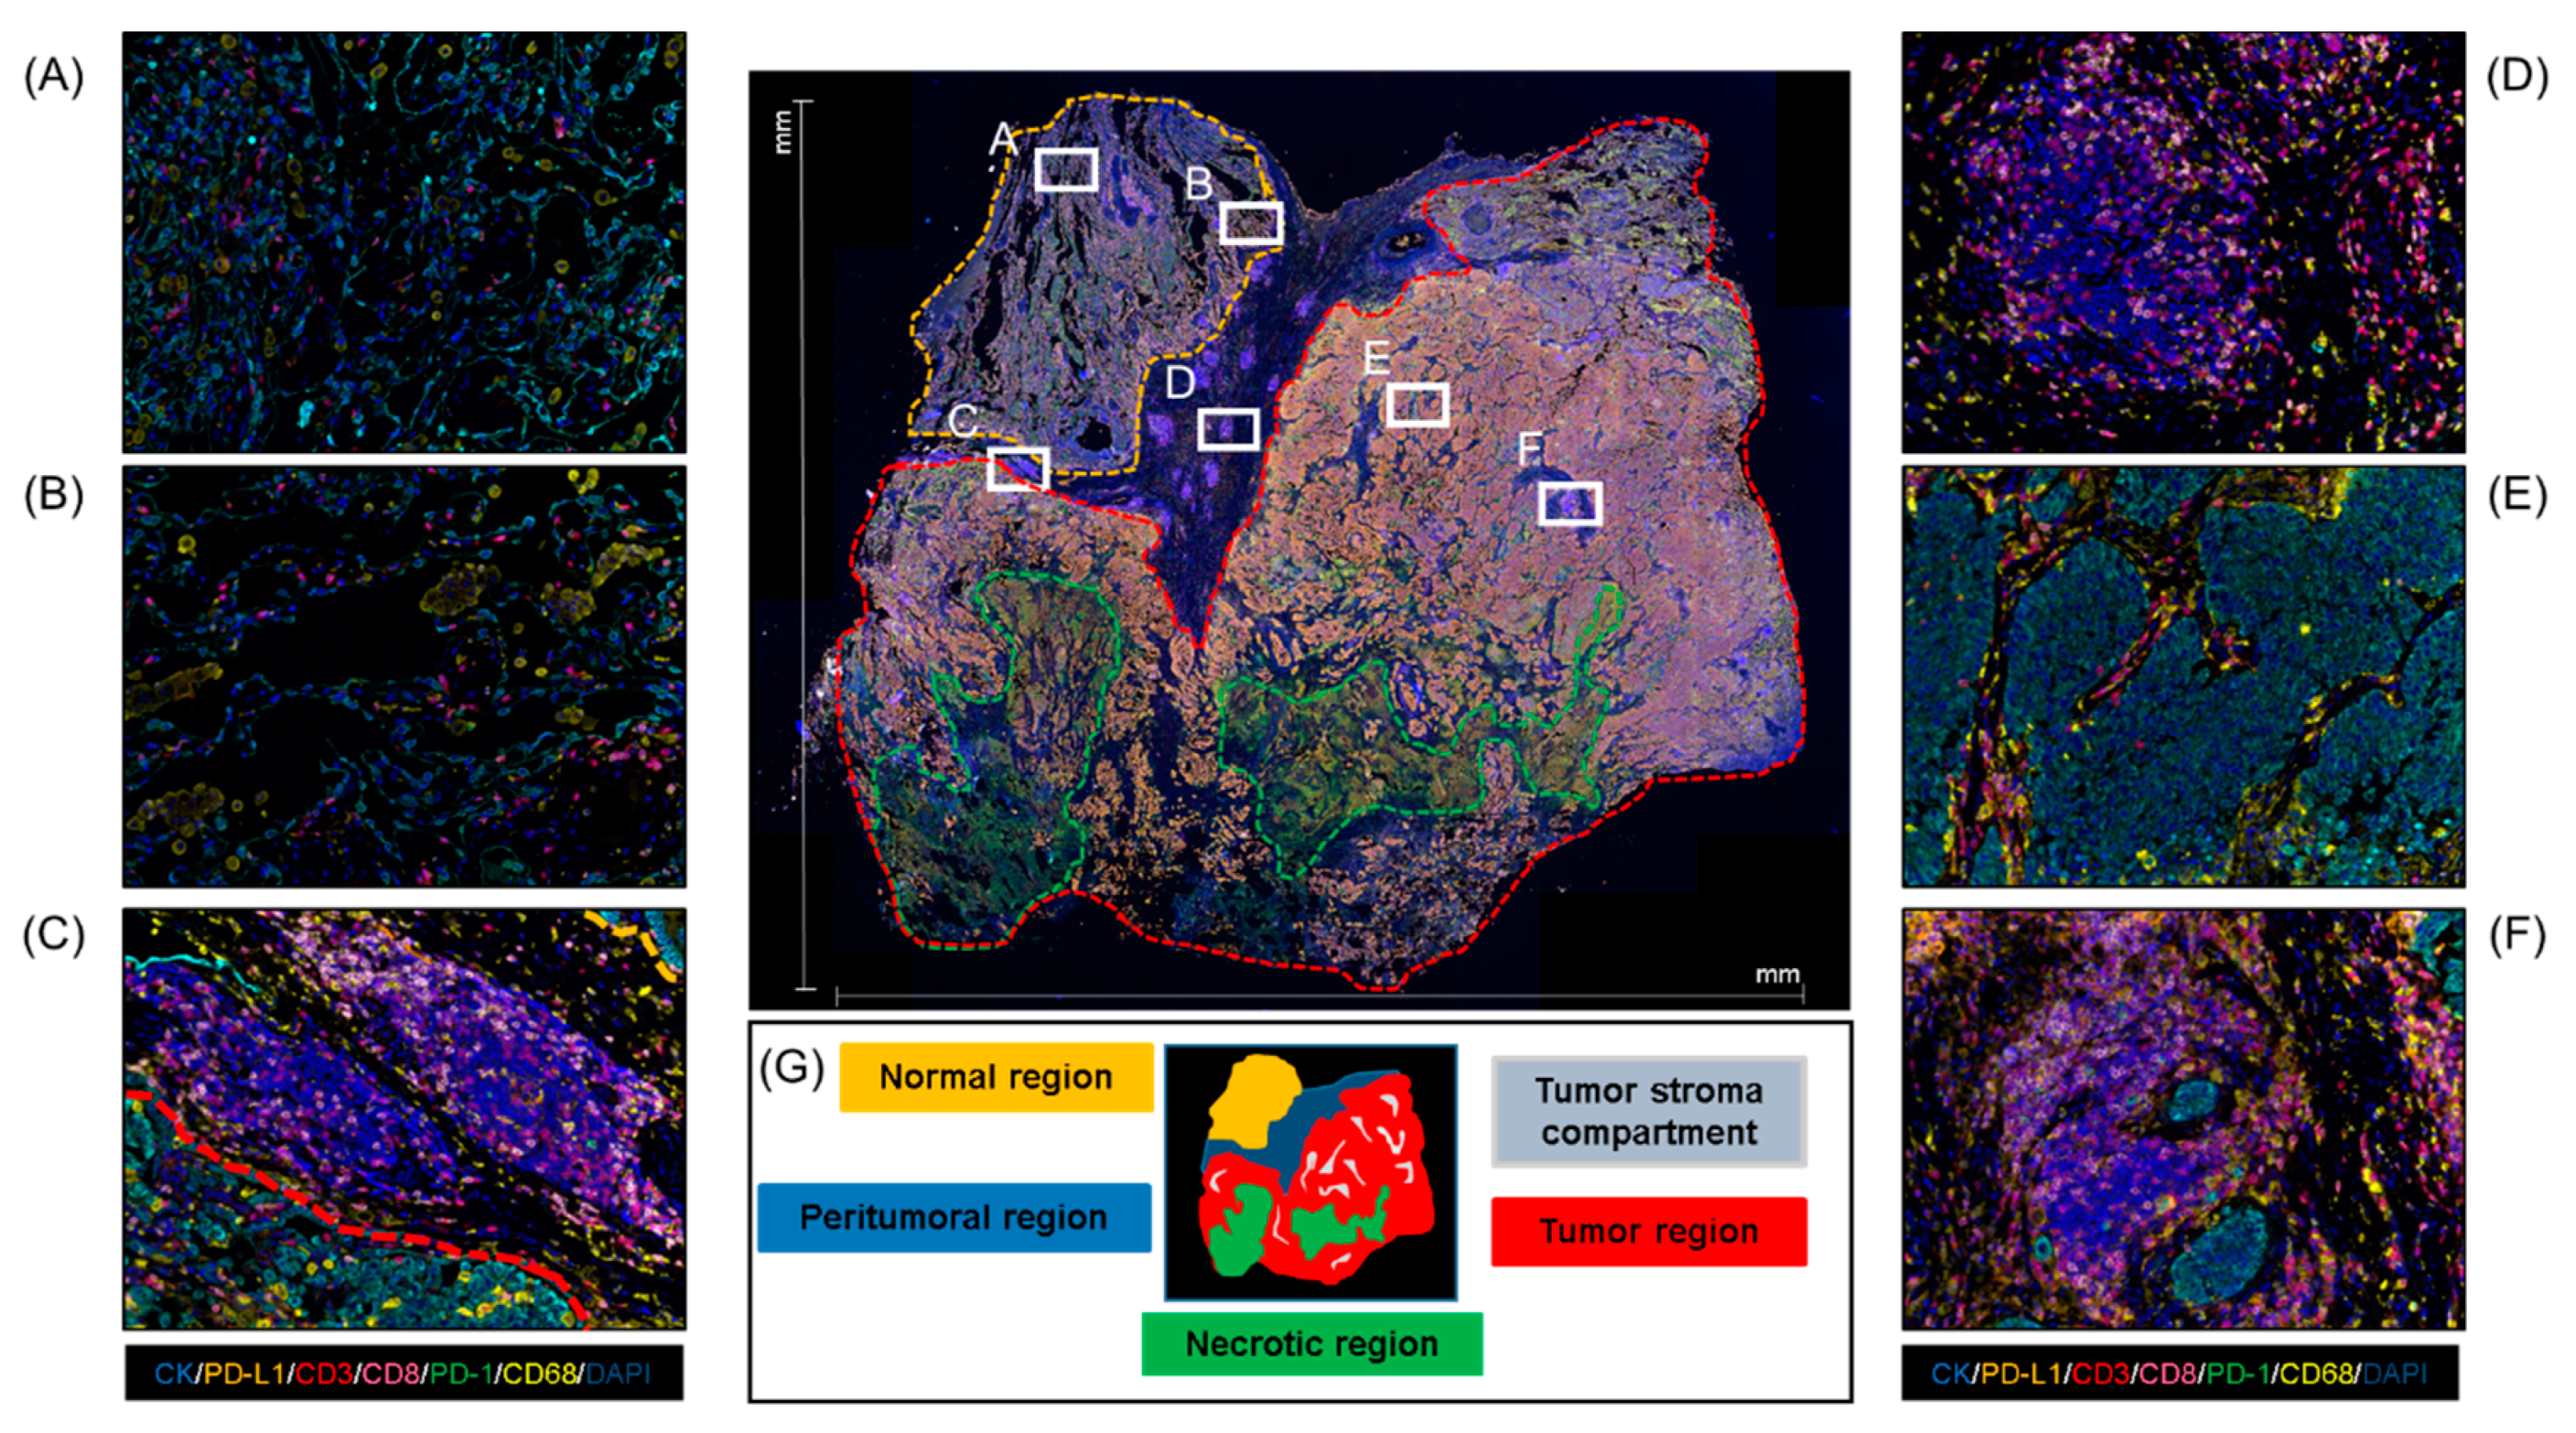
9. Area Selection for Multiplex IF Analysis
10. Data Report
11. Quality Control Assessment and Analytical Validation
12. Data Interpretation
13. Conclusions
Supplementary Materials
Author Contributions
Funding
Acknowledgments
Conflicts of Interest
References
- Devaud, C.; John, L.B.; Westwood, J.A.; Darcy, P.K.; Kershaw, M.H. Immune modulation of the tumor microenvironment for enhancing cancer immunotherapy. Oncoimmunology 2013, 2, e25961. [Google Scholar] [CrossRef] [PubMed]
- Tang, H.; Qiao, J.; Fu, Y.X. Immunotherapy and tumor microenvironment. Cancer Lett. 2016, 370, 85–90. [Google Scholar] [CrossRef] [PubMed]
- Dougan, M.; Dougan, S.K. Targeting Immunotherapy to the Tumor Microenvironment. J. Cell Biochem. 2017, 118, 3049–3054. [Google Scholar] [CrossRef] [PubMed]
- Frankel, T.; Lanfranca, M.P.; Zou, W. The Role of Tumor Microenvironment in Cancer Immunotherapy. Adv. Exp. Med. Biol. 2017, 1036, 51–64. [Google Scholar]
- Gajewski, T.F.; Corrales, L.; Williams, J.; Horton, B.; Sivan, A.; Spranger, S. Cancer Immunotherapy Targets Based on Understanding the T Cell-Inflamed Versus Non-T Cell-Inflamed Tumor Microenvironment. Adv. Exp. Med. Biol. 2017, 1036, 19–31. [Google Scholar]
- Cauwels, A.; Van Lint, S.; Garcin, G.; Bultinck, J.; Paul, F.; Gerlo, S.; Van der Heyden, J.; Bordat, Y.; Catteeuw, D.; De Cauwer, L.; et al. A safe and highly efficient tumor-targeted type I interferon immunotherapy depends on the tumor microenvironment. Oncoimmunology 2018, 7, e1398876. [Google Scholar] [CrossRef]
- Dixon, A.R.; Bathany, C.; Tsuei, M.; White, J.; Barald, K.F.; Takayama, S. Recent developments in multiplexing techniques for immunohistochemistry. Expert Rev. Mol. Diagn. 2015, 15, 1171–1186. [Google Scholar] [CrossRef]
- Blom, S.; Paavolainen, L.; Bychkov, D.; Turkki, R.; Maki-Teeri, P.; Hemmes, A.; Valimaki, K.; Lundin, J.; Kallioniemi, O.; Pellinen, T. Systems pathology by multiplexed immunohistochemistry and whole-slide digital image analysis. Sci. Rep. 2017, 7, 15580. [Google Scholar] [CrossRef]
- Surace, M.; DaCosta, K.; Huntley, A.; Zhao, W.; Bagnall, C.; Brown, C.; Wang, C.; Roman, K.; Cann, J.; Lewis, A.; et al. Automated Multiplex Immunofluorescence Panel for Immuno-oncology Studies on Formalin-fixed Carcinoma Tissue Specimens. J. Vis. Exp. 2019. [Google Scholar] [CrossRef]
- Parra, E.R. Novel Platforms of Multiplexed Immunofluorescence for Study of Paraffin Tumor Tissues. J. Cancer Treat. Diagn. 2018, 2, 43–53. [Google Scholar] [CrossRef]
- Steiner, C.; Ducret, A.; Tille, J.C.; Thomas, M.; McKee, T.A.; Rubbia-Brandt, L.; Scherl, A.; Lescuyer, P.; Cutler, P. Applications of mass spectrometry for quantitative protein analysis in formalin-fixed paraffin-embedded tissues. Proteomics 2014, 14, 441–451. [Google Scholar] [CrossRef] [PubMed]
- Stauber, J.; MacAleese, L.; Franck, J.; Claude, E.; Snel, M.; Kaletas, B.K.; Wiel, I.M.; Wisztorski, M.; Fournier, I.; Heeren, R.M. On-tissue protein identification and imaging by MALDI-ion mobility mass spectrometry. J. Am. Soc. Mass Spectrom. 2010, 21, 338–347. [Google Scholar] [CrossRef]
- Sood, A.; Miller, A.M.; Brogi, E.; Sui, Y.; Armenia, J.; McDonough, E.; Santamaria-Pang, A.; Carlin, S.; Stamper, A.; Campos, C.; et al. Multiplexed immunofluorescence delineates proteomic cancer cell states associated with metabolism. JCI Insight 2016, 1. [Google Scholar] [CrossRef] [PubMed]
- Gorris, M.A.J.; Halilovic, A.; Rabold, K.; van Duffelen, A.; Wickramasinghe, I.N.; Verweij, D.; Wortel, I.M.N.; Textor, J.C.; de Vries, I.J.M.; Figdor, C.G. Eight-Color Multiplex Immunohistochemistry for Simultaneous Detection of Multiple Immune Checkpoint Molecules within the Tumor Microenvironment. J. Immunol. 2018, 200, 347–354. [Google Scholar] [CrossRef] [PubMed]
- Rost, S.; Giltnane, J.; Bordeaux, J.M.; Hitzman, C.; Koeppen, H.; Liu, S.D. Multiplexed ion beam imaging analysis for quantitation of protein expresssion in cancer tissue sections. Lab. Investig. 2017, 97, 1263. [Google Scholar] [CrossRef] [PubMed]
- Hofman, P.; Badoual, C.; Henderson, F.; Berland, L.; Hamila, M.; Long-Mira, E.; Lassalle, S.; Roussel, H.; Hofman, V.; Tartour, E.; et al. Multiplexed Immunohistochemistry for Molecular and Immune Profiling in Lung Cancer-Just About Ready for Prime-Time? Cancers 2019, 11. [Google Scholar] [CrossRef]
- Shipitsin, M.; Small, C.; Giladi, E.; Siddiqui, S.; Choudhury, S.; Hussain, S.; Huang, Y.E.; Chang, H.; Rimm, D.L.; Berman, D.M.; et al. Automated quantitative multiplex immunofluorescence in situ imaging identifies phospho-S6 and phospho-PRAS40 as predictive protein biomarkers for prostate cancer lethality. Proteome Sci. 2014, 12, 40. [Google Scholar] [CrossRef]
- Xie, R.; Chung, J.Y.; Ylaya, K.; Williams, R.L.; Guerrero, N.; Nakatsuka, N.; Badie, C.; Hewitt, S.M. Factors influencing the degradation of archival formalin-fixed paraffin-embedded tissue sections. J. Histochem. Cytochem. 2011, 59, 356–365. [Google Scholar] [CrossRef]
- Bobrow, M.N.; Harris, T.D.; Shaughnessy, K.J.; Litt, G.J. Catalyzed reporter deposition, a novel method of signal amplification. Application to immunoassays. J. Immunol. Methods 1989, 125, 279–285. [Google Scholar] [CrossRef]
- Bobrow, M.N.; Shaughnessy, K.J.; Litt, G.J. Catalyzed reporter deposition, a novel method of signal amplification. II. Application to membrane immunoassays. J. Immunol. Methods 1991, 137, 103–112. [Google Scholar] [CrossRef]
- Parra, E.R.; Uraoka, N.; Jiang, M.; Cook, P.; Gibbons, D.; Forget, M.A.; Bernatchez, C.; Haymaker, C.; Wistuba, I.I.; Rodriguez-Canales, J. Validation of multiplex immunofluorescence panels using multispectral microscopy for immune-profiling of formalin-fixed and paraffin-embedded human tumor tissues. Sci. Rep. 2017, 7, 13380. [Google Scholar] [CrossRef] [PubMed]
- Lin, F.; Prichard, J. (Eds.) Handbook of Practical Immunohistochemistry: Frequently Asked Questions, 2nd ed.; Springer: New York, NY, USA; Heidelberg, Germany; Dordrecht, The Netherlands; London, UK, 2015; p. 764. [Google Scholar]
- Parra, E.R.; Villalobos, P.; Mino, B.; Rodriguez-Canales, J. Comparison of Different Antibody Clones for Immunohistochemistry Detection of Programmed Cell Death Ligand 1 (PD-L1) on Non-Small Cell Lung Carcinoma. Appl. Immunohistochem. Mol. Morphol. 2018, 26, 83–93. [Google Scholar] [CrossRef] [PubMed]
- Acharya, P.; Quinlan, A.; Neumeister, V. The ABCs of finding a good antibody: How to find a good antibody, validate it, and publish meaningful data. F1000Research 2017, 6, 851. [Google Scholar] [CrossRef] [PubMed]
- O’Hurley, G.; Sjostedt, E.; Rahman, A.; Li, B.; Kampf, C.; Ponten, F.; Gallagher, W.M.; Lindskog, C. Garbage in, garbage out: A critical evaluation of strategies used for validation of immunohistochemical biomarkers. Mol. Oncol. 2014, 8, 783–798. [Google Scholar] [CrossRef]
- Wolff, A.C.; Hammond, M.E.H.; Allison, K.H.; Harvey, B.E.; Mangu, P.B.; Bartlett, J.M.S.; Bilous, M.; Ellis, I.O.; Fitzgibbons, P.; Hanna, W.; et al. Human Epidermal Growth Factor Receptor 2 Testing in Breast Cancer: American Society of Clinical Oncology/College of American Pathologists Clinical Practice Guideline Focused Update. Arch. Pathol. Lab. Med. 2018, 142, 1364–1382. [Google Scholar] [CrossRef]
- Hammond, M.; Hayes, D.; Dowsett, M. Pathologists’ Guideline Recommendations for Immunohistochemical Testing of Estrogen and Progesterone Receptors in Breast Cancer. Breast Care 2010, 5, 185–187. [Google Scholar]
- Bordeaux, J.; Welsh, A.; Agarwal, S.; Killiam, E.; Baquero, M.; Hanna, J.; Anagnostou, V.; Rimm, D. Antibody validation. Biotechniques 2010, 48, 197–209. [Google Scholar] [CrossRef]
- Parra, E.R.; Villalobos, P.; Rodriguez-Canales, J. The Multiple Faces of Programmed Cell Death Ligand 1 Expression in Malignant and Nonmalignant Cells. Appl. Immunohistochem. Mol. Morphol. 2019, 27, 287–294. [Google Scholar] [CrossRef]
- Carvajal-Hausdorf, D.E.; Schalper, K.A.; Neumeister, V.M.; Rimm, D.L. Quantitative measurement of cancer tissue biomarkers in the lab and in the clinic. Lab. Investig. 2015, 95, 385–396. [Google Scholar] [CrossRef]
- Fitzgibbons, P.L.; Bradley, L.A.; Fatheree, L.A.; Alsabeh, R.; Fulton, R.S.; Goldsmith, J.D.; Haas, T.S.; Karabakhtsian, R.G.; Loykasek, P.A.; Marolt, M.J.; et al. Principles of analytic validation of immunohistochemical assays: Guideline from the College of American Pathologists Pathology and Laboratory Quality Center. Arch. Pathol. Lab. Med. 2014, 138, 1432–1443. [Google Scholar] [CrossRef]
- Parra, E.R.; Francisco-Cruz, A.; Wistuba, I.I. State-of-the-Art of Profiling Immune Contexture in the Era of Multiplexed Staining and Digital Analysis to Study Paraffin Tumor Tissues. Cancers 2019, 11. [Google Scholar] [CrossRef] [PubMed]
- Francisco-Cruz, A.; Parra, E.R.; Tetzlaff, M.T.; Wistuba, I.I. Multiplex Immunofluorescence Assays. Methods Mol. Biol. 2020, 2055, 467–495. [Google Scholar] [CrossRef] [PubMed]
- Gown, A.M. Unmasking the mysteries of antigen or epitope retrieval and formalin fixation. Am. J. Clin. Pathol. 2004, 121, 172–174. [Google Scholar] [CrossRef]
- Machaalani, R.; Radford, J.L.; Waters, K.A. Tissue fixation effects on immunohistochemical staining of caspase-3 in brain tissue. Appl. Immunohistochem. Mol. Morphol. 2007, 15, 463–470. [Google Scholar] [CrossRef]
- Yildiz-Aktas, I.Z.; Dabbs, D.J.; Bhargava, R. The effect of cold ischemic time on the immunohistochemical evaluation of estrogen receptor, progesterone receptor, and HER2 expression in invasive breast carcinoma. Mod. Pathol. 2012, 25, 1098–1105. [Google Scholar] [CrossRef]
- Apple, S.; Pucci, R.; Lowe, A.C.; Shintaku, I.; Shapourifar-Tehrani, S.; Moatamed, N. The effect of delay in fixation, different fixatives, and duration of fixation in estrogen and progesterone receptor results in breast carcinoma. Am. J. Clin. Pathol. 2011, 135, 592–598. [Google Scholar] [CrossRef]
- Hammond, M.E.; Hayes, D.F.; Wolff, A.C.; Mangu, P.B.; Temin, S. American society of clinical oncology/college of american pathologists guideline recommendations for immunohistochemical testing of estrogen and progesterone receptors in breast cancer. J. Oncol. Pract. 2010, 6, 195–197. [Google Scholar] [CrossRef]
- Parra, E.R. Immune Cell Profiling in Cancer Using Multiplex Immunofluorescence and Digital Analysis Approaches; Streckfus, C.F., Ed.; IntechOpen: London, UK, 2018; pp. 1–13. [Google Scholar]
- Aeffner, F.; Zarella, M.D.; Buchbinder, N.; Bui, M.M.; Goodman, M.R.; Hartman, D.J.; Lujan, G.M.; Molani, M.A.; Parwani, A.V.; Lillard, K.; et al. Introduction to Digital Image Analysis in Whole-slide Imaging: A White Paper from the Digital Pathology Association. J. Pathol. Inform. 2019, 10, 9. [Google Scholar] [CrossRef]
- Pell, R.; Oien, K.; Robinson, M.; Pitman, H.; Rajpoot, N.; Rittscher, J.; Snead, D.; Verrill, C.; UK National Cancer Research Institute (NCRI) Cellular-Molecular Pathology (CM-Path) Quality Assurance Working Group. The use of digital pathology and image analysis in clinical trials. J. Pathol. Clin. Res. 2019, 5, 81–90. [Google Scholar] [CrossRef]
- Stack, E.C.; Wang, C.; Roman, K.A.; Hoyt, C.C. Multiplexed immunohistochemistry, imaging, and quantitation: A review, with an assessment of Tyramide signal amplification, multispectral imaging and multiplex analysis. Methods 2014, 70, 46–58. [Google Scholar] [CrossRef]
- Werner, M.; Chott, A.; Fabiano, A.; Battifora, H. Effect of formalin tissue fixation and processing on immunohistochemistry. Am. J. Surg. Pathol. 2000, 24, 1016–1019. [Google Scholar] [CrossRef] [PubMed]
- Mirlacher, M.; Kasper, M.; Storz, M.; Knecht, Y.; Durmuller, U.; Simon, R.; Mihatsch, M.J.; Sauter, G. Influence of slide aging on results of translational research studies using immunohistochemistry. Mod. Pathol. 2004, 17, 1414–1420. [Google Scholar] [CrossRef] [PubMed]
- Grillo, F.; Bruzzone, M.; Pigozzi, S.; Prosapio, S.; Migliora, P.; Fiocca, R.; Mastracci, L. Immunohistochemistry on old archival paraffin blocks: Is there an expiry date? J. Clin. Pathol. 2017, 70, 988–993. [Google Scholar] [CrossRef]
- Hewitt, S.M.; Lewis, F.A.; Cao, Y.; Conrad, R.C.; Cronin, M.; Danenberg, K.D.; Goralski, T.J.; Langmore, J.P.; Raja, R.G.; Williams, P.M.; et al. Tissue handling and specimen preparation in surgical pathology: Issues concerning the recovery of nucleic acids from formalin-fixed, paraffin-embedded tissue. Arch. Pathol. Lab. Med. 2008, 132, 1929–1935. [Google Scholar] [CrossRef] [PubMed]
- Parra, E.R.; Villalobos, P.; Behrens, C.; Jiang, M.; Pataer, A.; Swisher, S.G.; William, W.N., Jr.; Zhang, J.; Lee, J.; Cascone, T.; et al. Effect of neoadjuvant chemotherapy on the immune microenvironment in non-small cell lung carcinomas as determined by multiplex immunofluorescence and image analysis approaches. J. Immunother. Cancer 2018, 6, 48. [Google Scholar] [CrossRef]
- Barua, S.; Solis, L.; Parra, E.R.; Uraoka, N.; Jiang, M.; Wang, H.; Rodriguez-Canales, J.; Wistuba, I.; Maitra, A.; Sen, S.; et al. A Functional Spatial Analysis Platform for Discovery of Immunological Interactions Predictive of Low-Grade to High-Grade Transition of Pancreatic Intraductal Papillary Mucinous Neoplasms. Cancer Inform. 2018, 17. [Google Scholar] [CrossRef]
- Huang, W.; Hennrick, K.; Drew, S. A colorful future of quantitative pathology: Validation of Vectra technology using chromogenic multiplexed immunohistochemistry and prostate tissue microarrays. Hum. Pathol. 2013, 44, 29–38. [Google Scholar] [CrossRef]
- Nederlof, M.; Watanabe, S.; Burnip, B.; Taylor, D.L.; Critchley-Thorne, R. High-throughput profiling of tissue and tissue model microarrays: Combined transmitted light and 3-color fluorescence digital pathology. J. Pathol. Inform. 2011, 2, 50. [Google Scholar] [CrossRef]
- Hoyt, C.; Roman, K.; Engle, L.; Wang, C.; Ballesteros-Merino, C.; Jensen, S.; McGuire, J.; Zheng, Y.; Coltharp, C.; Jiang, M.; et al. Abstract LB-318: Multi-institutional TSA-amplified Multiplexed Immunofluorescence Reproducibility Evaluation (MITRE study): Reproducibility assessment of an automated multiplexed immunofluorescence slide staining, imaging, and analysis workflow. Cancer Res. 2019, LB-318. [Google Scholar] [CrossRef]
- Roy, S.; Axelrod, H.D.; Valkenburg, K.C.; Amed, S.; Pienta, K.J. Optimization of prostate cancer cell detection using multiplex tyramide signal amplification. J. Cell Biochem. 2019, 120, 4804–4812. [Google Scholar] [CrossRef]


| Properties | Monoclonal Antibody | Polyclonal Antibody | Recombinant Antibody |
|---|---|---|---|
| Epitope selectivity | Generated by a single B-cell line and thus recognize only a single epitope of a protein of interest | Mixture of antibodies that all recognize different epitopes of the protein of interest | Antibodies created to recognize a specific epitope of a protein of interest |
| Source | Mouse or rabbit | Variety of species including mouse, rabbit, goat, sheep, and donkey | Entirely animal-free production process |
| Reproducibility | More reproducible generated immortal B-cell hybridomas | Prone to batch-to-batch variability (produced from animal sera) | High reproducibility and guaranteed continuity of availability without any dependence on animal immunization |
| Cross-reactivity | Less likely to cross-react with other proteins and lower background staining | May contain non-specific antibodies and background staining | No background staining |
| Specificity/sensitivity | Highly specific owing to single target epitope but less sensitive because often unable to detect masked antigen | More sensitive owing to targeting of multiple epitopes of an antigen but less specific than monoclonal antibodies | Highly specific and sensitive |
| Challenges | More challenging to work with when looking at low-abundance proteins or proteins with high variability | Poor choice for long-running studies | Last resort owing to higher cost |
| Tissue Characteristic | Hematoxylin and Eosin |
|---|---|
| Size | Less than 2 × 2 mm |
| Fragmentation | Multi-fragmentation |
| Tumor content | Non-malignant cells or fewer than 100 malignant cells in the sample* |
| Fibrosis | Fibrotic tissue without inflammatory cells |
| Necrosis | Necrotic tissue or malignant cells surrounding with necrosis with any parenchymal sustentation |
| Previous procedures | Decalcification procedures that can alter the quality of the staining** |
| Preservation | Staining artifact of oxidation/desiccation |
| Cellular characteristics | Crushed cells artifact |
| Multiplex immunofluorescence | |
| Size (vectra) ‡ | Minimum total area of five regions of interest (each 660 × 500 µm, at 20×) or 1.65 mm2 of total area analyzed*** |
| Tumor content | Non-malignant cells or fewer than 100 malignant cells in the total area of analysis |
| Inflammation | Non-inflammatory cells or fewer than 10 cells expressing the principal marker in the entire area analyzed (e.g., CD3) |
| Fibrosis/necrosis | Exclusion’s criteria when interfere in the analysis. |
| Tissue/cellular characteristics | Several folds, crushed cells, overlapping, or mucinous tumoral secretion † |
© 2020 by the authors. Licensee MDPI, Basel, Switzerland. This article is an open access article distributed under the terms and conditions of the Creative Commons Attribution (CC BY) license (http://creativecommons.org/licenses/by/4.0/).
Share and Cite
Parra, E.R.; Jiang, M.; Solis, L.; Mino, B.; Laberiano, C.; Hernandez, S.; Gite, S.; Verma, A.; Tetzlaff, M.; Haymaker, C.; et al. Procedural Requirements and Recommendations for Multiplex Immunofluorescence Tyramide Signal Amplification Assays to Support Translational Oncology Studies. Cancers 2020, 12, 255. https://doi.org/10.3390/cancers12020255
Parra ER, Jiang M, Solis L, Mino B, Laberiano C, Hernandez S, Gite S, Verma A, Tetzlaff M, Haymaker C, et al. Procedural Requirements and Recommendations for Multiplex Immunofluorescence Tyramide Signal Amplification Assays to Support Translational Oncology Studies. Cancers. 2020; 12(2):255. https://doi.org/10.3390/cancers12020255
Chicago/Turabian StyleParra, Edwin Roger, Mei Jiang, Luisa Solis, Barbara Mino, Caddie Laberiano, Sharia Hernandez, Swati Gite, Anuj Verma, Michael Tetzlaff, Cara Haymaker, and et al. 2020. "Procedural Requirements and Recommendations for Multiplex Immunofluorescence Tyramide Signal Amplification Assays to Support Translational Oncology Studies" Cancers 12, no. 2: 255. https://doi.org/10.3390/cancers12020255
APA StyleParra, E. R., Jiang, M., Solis, L., Mino, B., Laberiano, C., Hernandez, S., Gite, S., Verma, A., Tetzlaff, M., Haymaker, C., Tamegnon, A., Rodriguez-Canales, J., Hoyd, C., Bernachez, C., & Wistuba, I. (2020). Procedural Requirements and Recommendations for Multiplex Immunofluorescence Tyramide Signal Amplification Assays to Support Translational Oncology Studies. Cancers, 12(2), 255. https://doi.org/10.3390/cancers12020255