Deep Learning Prediction of Cancer Prevalence from Satellite Imagery


Abstract
:Simple Summary
Abstract
1. Introduction
2. Results
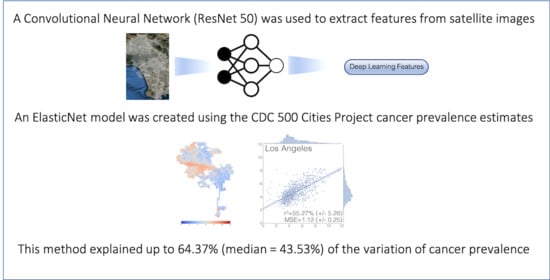
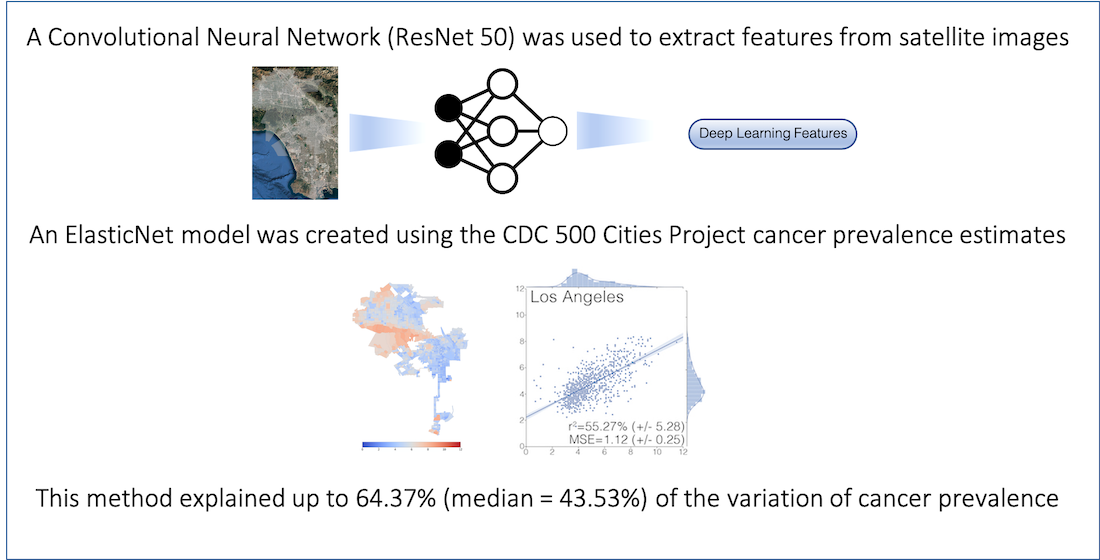
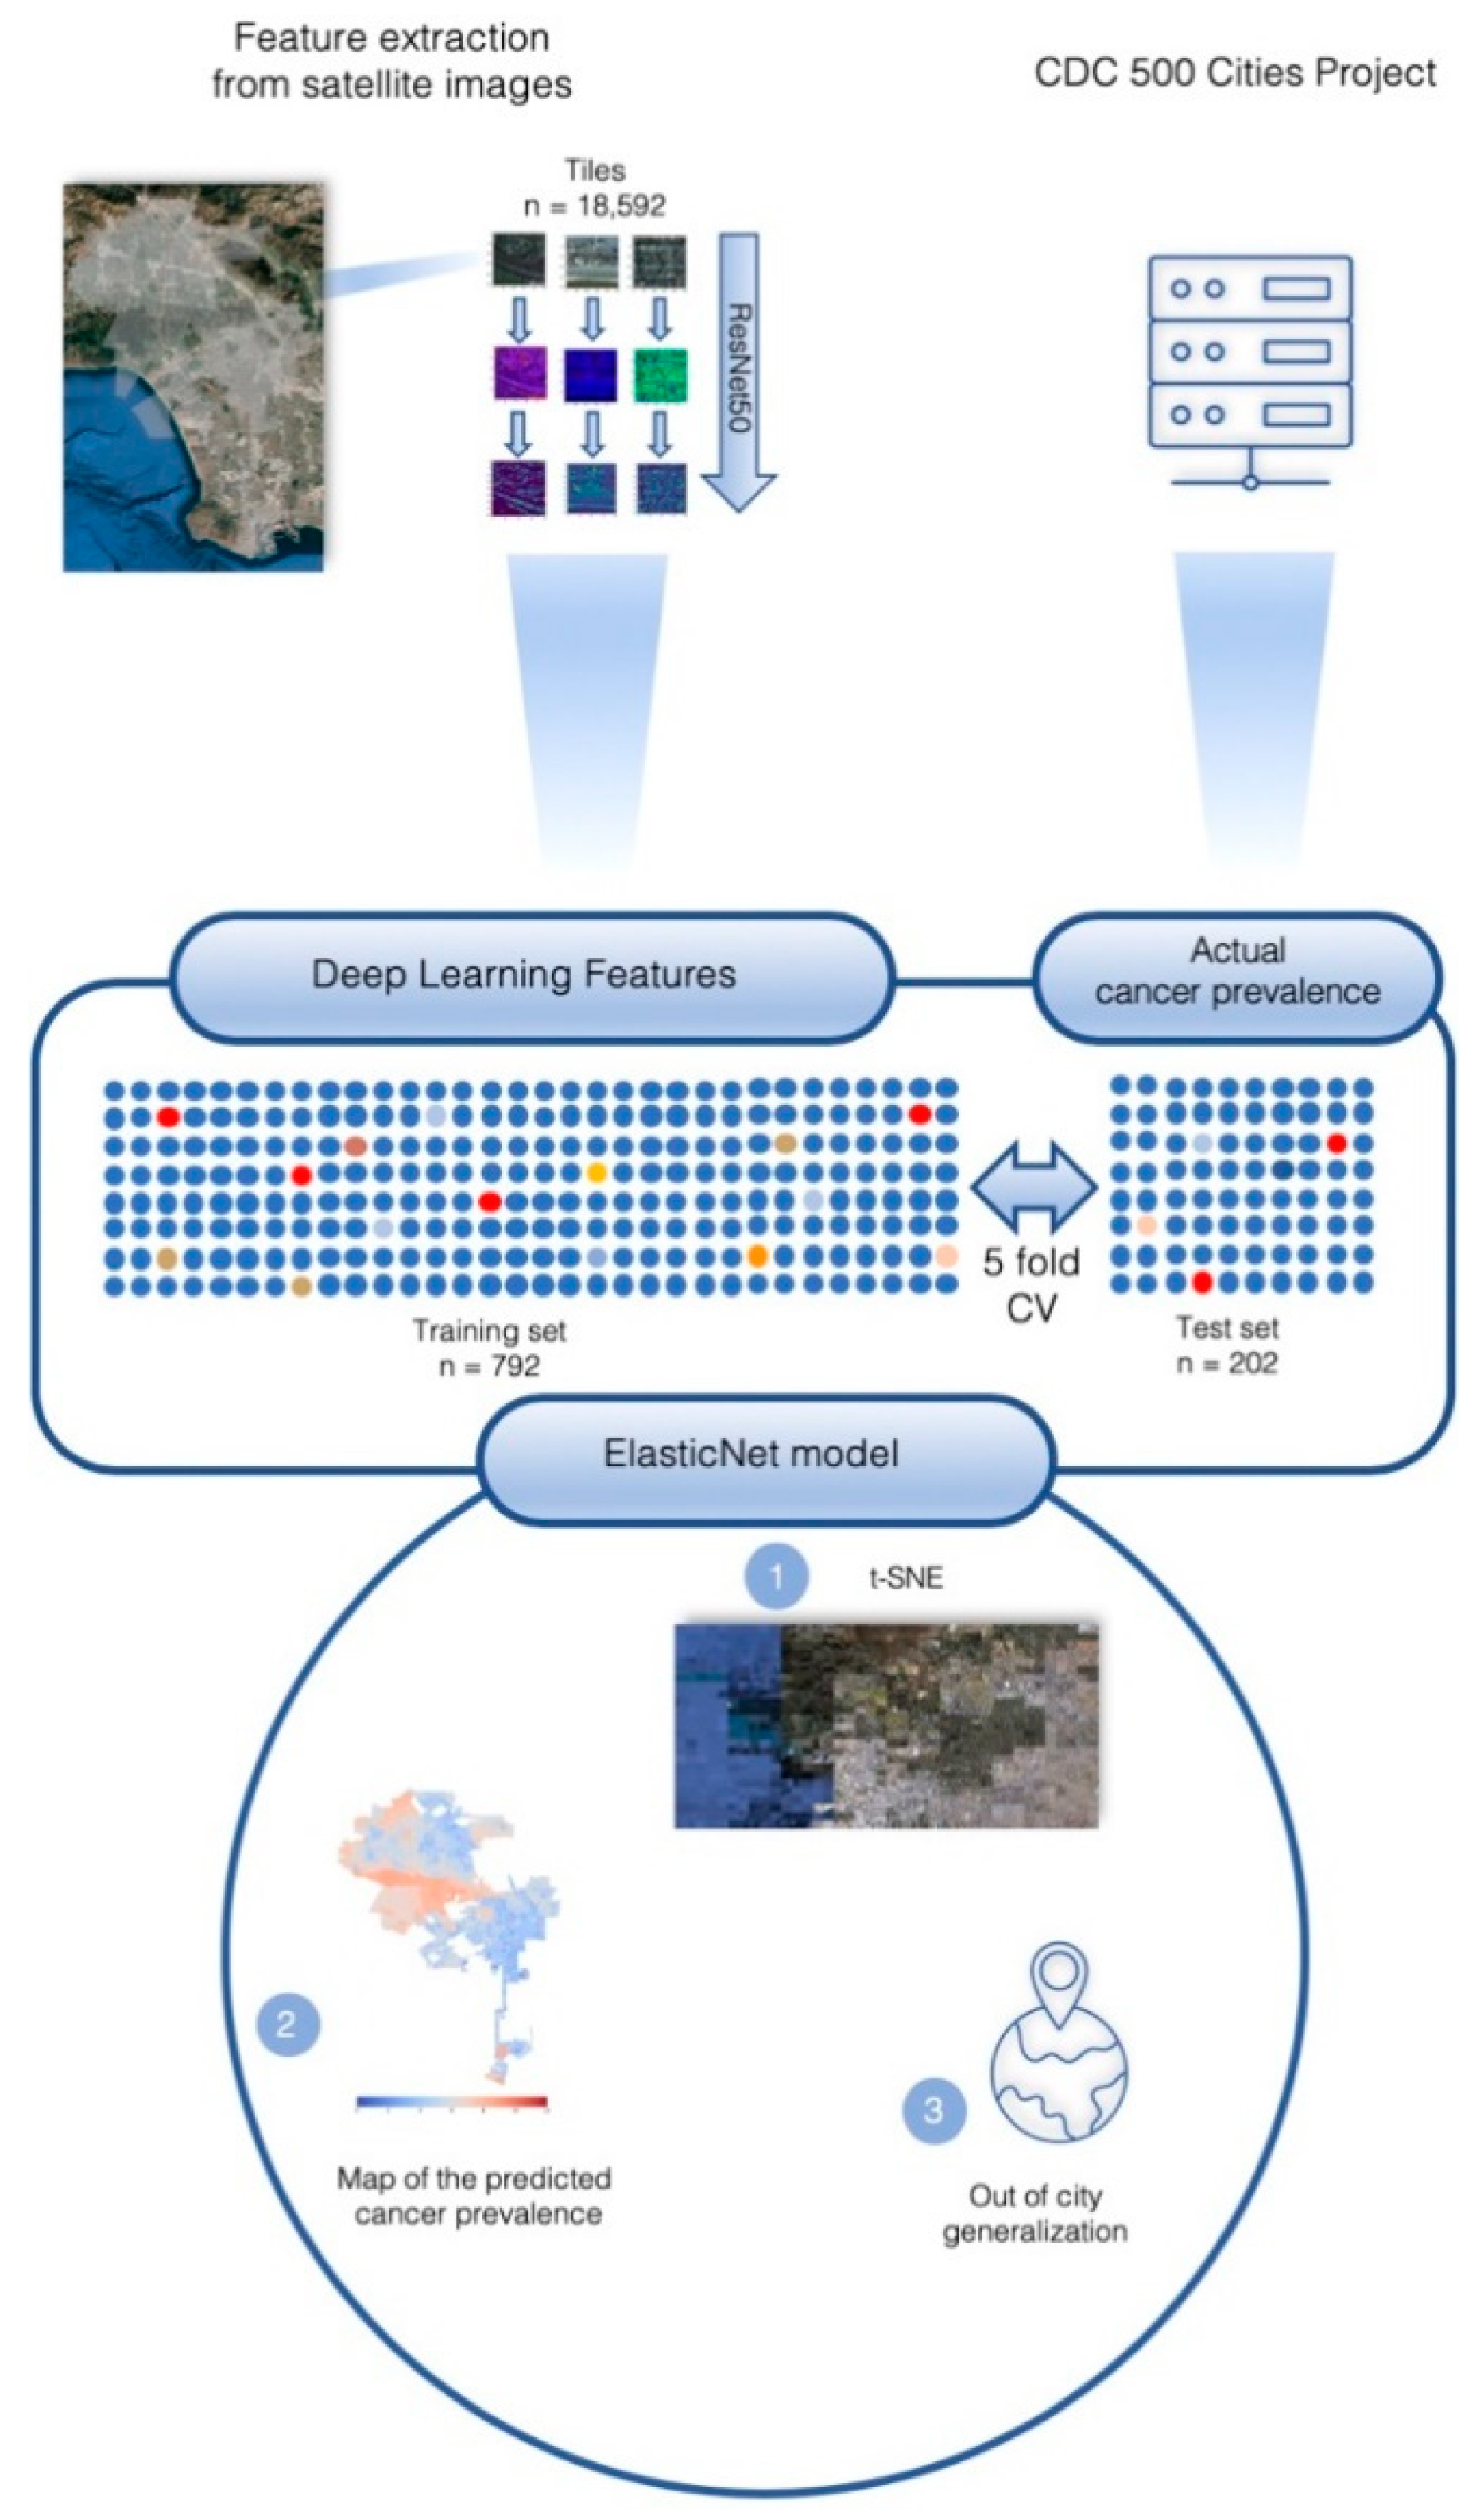
2.1. City Characteristics and Feature Extraction
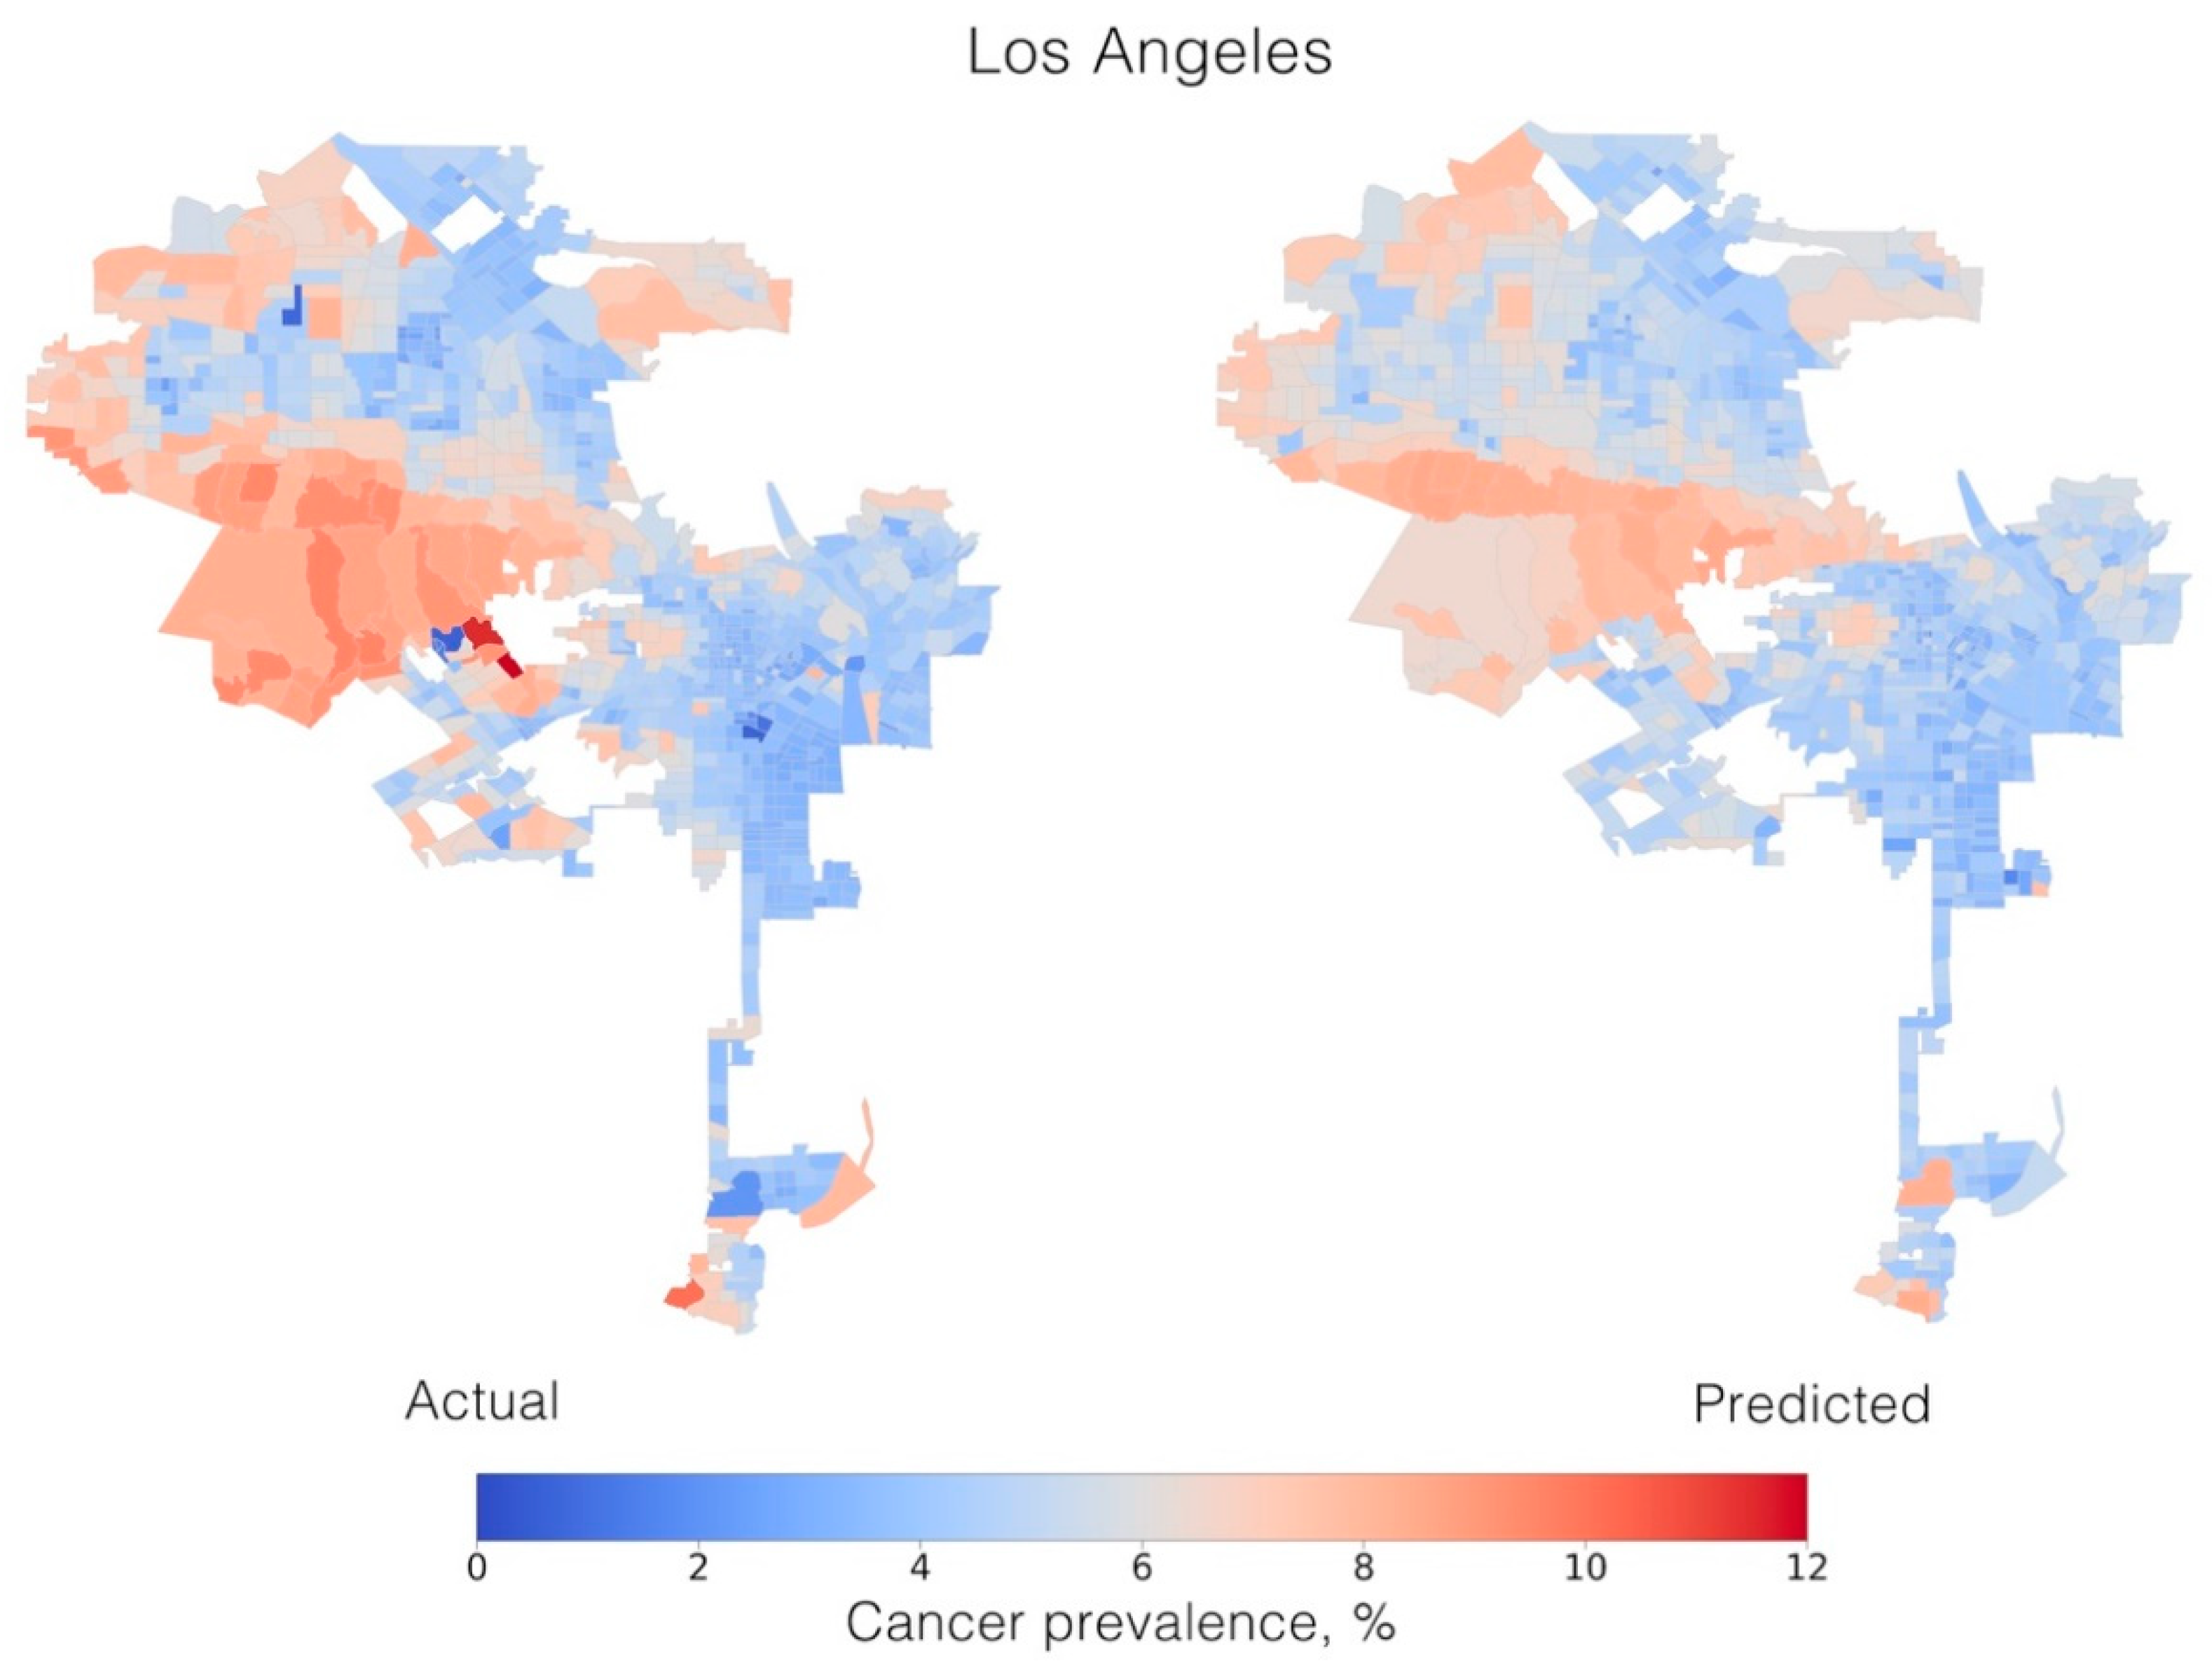
2.2. Optimization of ElasticNet
2.3. Model Generalization and Environment Similarities
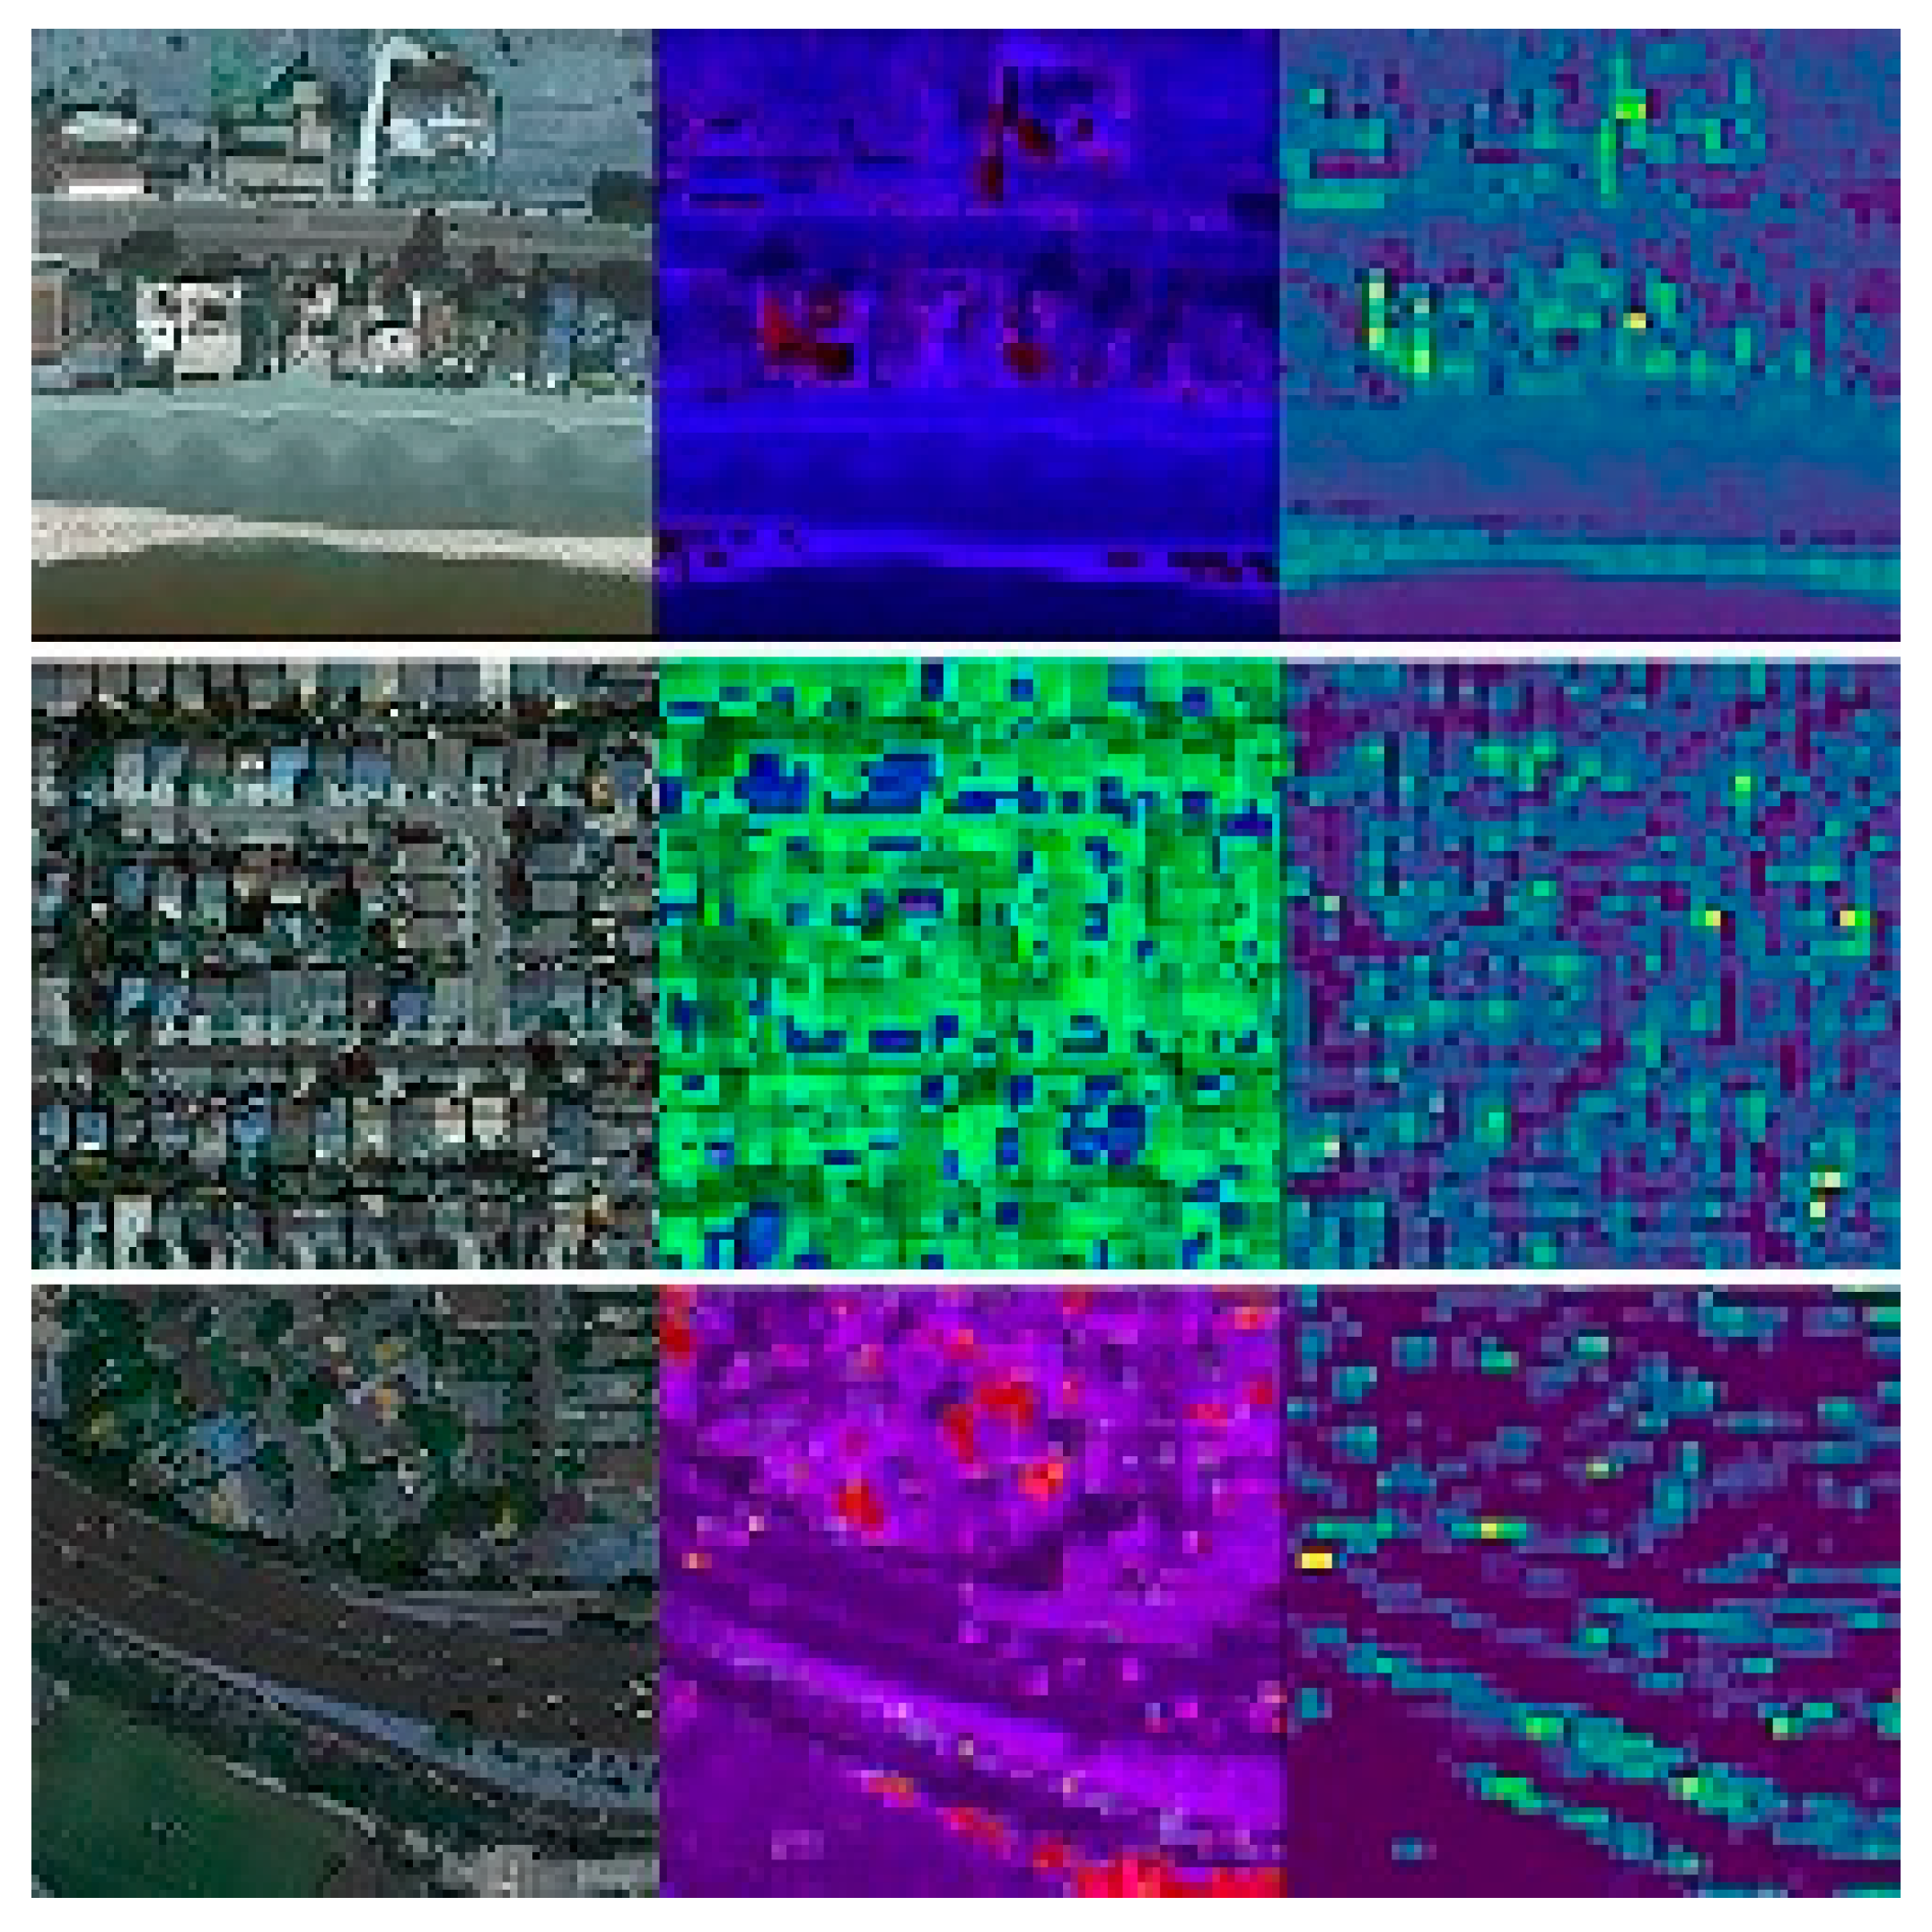
2.4. Model Interpretability
3. Discussion
4. Materials and Methods
4.1. Cancer Prevalence Data
4.2. Satellite Imagery
4.3. Image Features Extraction
4.4. Grid t-Distributed Stochastic Neighbor Embedding (t-SNE)
4.5. ElasticNet Regression Hyperparameters Tuning
4.6. Model Generalization and Environment Similarities
4.7. Model Interpretability
- -
- Socioeconomic (from the 2018 ACS):
- ○
- Age
- ○
- Sex (reference: female)
- ○
- Race (reference: non-Hispanic white)
- ○
- Educational attainment (reference: high school diploma)
- ○
- Median per capita income
- -
- Health (from the CDC 500 cities project):
- ○
- Smoking status
- ○
- Binge drinking status
- ○
- Obesity
- ○
- Diabetes
- ○
- Physical activity
4.8. Software Packages
5. Conclusions
Supplementary Materials
Author Contributions
Funding
Conflicts of Interest
References
- Bray, F.; Ferlay, J.; Soerjomataram, I.; Siegel, R.L.; Torre, L.A.; Jemal, A. Global cancer statistics 2018: GLOBOCAN estimates of incidence and mortality worldwide for 36 cancers in 185 countries. CA Cancer J. Clin. 2018, 68, 394–424. [Google Scholar] [CrossRef] [PubMed] [Green Version]
- US Census Bureau Budget, Fiscal Year 2019 As Presented to the Congress February 2018. Available online: https://www2.census.gov/about/budget/FY-2019-Congressional-Budget-Submission.pdf (accessed on 9 December 2020).
- US Census Bureau American Community Survey (ACS). Available online: https://www.census.gov/programs-surveys/acs (accessed on 24 September 2019).
- Mantey, J.; Ruterbusch, J.; Meza, R.; Schwartz, K. Cancer incidence trends using American Community Survey estimates are not consistent with SEER for small populations. Cancer Epidemiol. 2016, 43, 87–91. [Google Scholar] [CrossRef] [PubMed]
- National Cancer Institute Surveillance, Epidemiology, and End Results Program. Available online: https://seer.cancer.gov/index.html (accessed on 24 September 2019).
- Jean, N.; Burke, M.; Xie, M.; Davis, W.M.; Lobell, D.B.; Ermon, S. Combining satellite imagery and machine learning to predict poverty. Science 2016, 353, 790–794. [Google Scholar] [CrossRef] [PubMed] [Green Version]
- Maharana, A.; Nsoesie, E.O. Use of Deep Learning to Examine the Association of the Built Environment with Prevalence of Neighborhood Adult Obesity. JAMA Netw. Open 2018, 1, e181535. [Google Scholar] [CrossRef] [PubMed]
- Burkitt, D.P. Some Neglected Leads to Cancer Causation. J. Natl. Cancer Inst. 1971, 47, 913–919. [Google Scholar] [CrossRef] [PubMed]
- Armstrong, B.; Doll, R. Environmental factors and cancer incidence and mortality in different countries, with special reference to dietary practices. Int. J. Cancer 1975, 15, 617–631. [Google Scholar] [CrossRef] [PubMed]
- Wiklund, K.; Einhorn, J.; Wennström, G.; Rapaport, E. A Swedish cancer-environment register available for research. Scand. J. Work Environ. Health 1981, 7, 64–67. [Google Scholar] [CrossRef] [PubMed]
- Vagero, D.; Olin, R. Incidence of cancer in the electronics industry: Using the new Swedish Cancer Environment Registry as a screening instrument. Occup. Environ. Med. 1983, 40, 188–192. [Google Scholar] [CrossRef] [PubMed] [Green Version]
- Wiklund, K. Swedish agricultural workers: A group with a decreased risk of cancer. Cancer 1983, 51, 566–568. [Google Scholar] [CrossRef]
- Lichtenstein, P.; Holm, N.V.; Verkasalo, P.K.; Iliadou, A.; Kaprio, J.; Koskenvuo, M.; Pukkala, E.; Skytthe, A.; Hemminki, K. Environmental and Heritable Factors in the Causation of Cancer—Analyses of Cohorts of Twins from Sweden, Denmark, and Finland. N. Engl. J. Med. 2000, 343, 78–85. [Google Scholar] [CrossRef] [PubMed]
- Epidemiology Research Program|American Cancer Society. Available online: https://www.cancer.org/research/we-conduct-cancer-research/epidemiology.html (accessed on 27 September 2019).
- Hammond, E.C.; Horn, D. The Relationship between Human Smoking Habits and Death Rates. J. Am. Med. Assoc. 1954, 155, 1316. [Google Scholar] [CrossRef] [PubMed]
- 500 Cities Project: Local Data for Better Health|Home Page|CDC. Available online: https://www.cdc.gov/500cities/index.htm (accessed on 24 September 2019).
- The Strengthening the Reporting of Observational Studies in Epidemiology (STROBE) Statement: Guidelines for Reporting Observational Studies|The EQUATOR Network. Available online: https://www.strobe-statement.org/index.php?id=strobe-home (accessed on 9 December 2020).
- Overview|Maps Static API. Available online: https://developers.google.com/maps/documentation/maps-static/intro (accessed on 24 September 2019).
- FCC Area API. Available online: https://geo.fcc.gov/api/census/#!/block/ (accessed on 24 September 2019).
- Krizhevsky, A.; Sutskever, I.; Hinton, G.E. Imagenet classification with deep convolutional neural networks. In Proceedings of the Advances in Neural Information Processing Systems, Lake Tahoe, NV, USA, December 3–6 2012; pp. 1097–1105. [Google Scholar]
- Esteva, A.; Kuprel, B.; Novoa, R.A.; Ko, J.; Swetter, S.M.; Blau, H.M.; Thrun, S. Dermatologist-level classification of skin cancer with deep neural networks. Nature 2017, 542, 115–118. [Google Scholar] [CrossRef] [PubMed]
- Kalchbrenner, N.; Grefenstette, E.; Blunsom, P. A Convolutional Neural Network for Modelling Sentences. arXiv 2014, arXiv:1404.2188. [Google Scholar]
- Carta, S.; Corriga, A.; Ferreira, A.; Podda, A.S.; Recupero, D.R. A multi-layer and multi-ensemble stock trader using deep learning and deep reinforcement learning. Appl. Intell. 2020, 1–17. [Google Scholar] [CrossRef]
- He, K.; Zhang, X.; Ren, S.; Sun, J. Deep Residual Learning for Image Recognition. arXiv 2015, arXiv:1512.03385. [Google Scholar]
- Chollet, F. Keras; Github: Seattle, WA, USA, 2015. [Google Scholar]
- McKinney, W. Data Structures for Statistical Computing in Python. In Proceedings of the 9th Python in Science Conference, Austin, TX, USA, 28 June–3 July 2010; pp. 51–56. [Google Scholar]
- GeoPandas 0.5.1—GeoPandas 0.5.1 Documentation. Available online: http://geopandas.org/ (accessed on 25 September 2019).
- Van Der Walt, S.; Colbert, S.C.; Varoquaux, G. The NumPy Array: A Structure for Efficient Numerical Computation. Comput. Sci. Eng. 2011, 13, 22–30. [Google Scholar] [CrossRef] [Green Version]
- Pedregosa, F.; Varoquaux, G.; Gramfort, A.; Michel, V.; Thirion, B.; Grisel, O.; Blondel, M.; Prettenhofer, P.; Weiss, R.; Dubourg, V.; et al. Scikit-learn: Machine Learning in Python. J. Mach. Learn. Res. 2011, 12, 2825–2830. [Google Scholar]
- Hunter, J.D. Matplotlib: A 2D Graphics Environment. Comput. Sci. Eng. 2007, 9, 90–95. [Google Scholar] [CrossRef]
- Waskom, M.; Botvinnik, O.; Hobson, P.; Cole, J.B.; Halchenko, Y.; Hoyer, S.; Miles, A.; Augspurger, T.; Yarkoni, T.; Megies, T. Seaborn: v0. 5.0 (November 2014). Zenodo 2014, 10. [Google Scholar]


| Variable | Chicago | Dallas | Houston | Los Angeles | Phoenix | San Diego | San Jose |
|---|---|---|---|---|---|---|---|
| Population | 2,705,994 | 1,345,047 | 2,325,502 | 3,990,456 | 1,660,272 | 1,425,976 | 1,030,119 |
| Land area (square miles) | 588.7 | 882.90 | 1651.10 | 1213.90 | 1340.60 | 842.30 | 459.70 |
| Population density (person/square miles) | 4596.56 | 1523.44 | 1408.46 | 3287.30 | 1238.45 | 1692.96 | 2240.85 |
| Number of census | 794 | 304 | 553 | 994 | 356 | 286 | 213 |
| Actual cancer prevalence (%) | 5.0 | 4.8 | 4.8 | 4.9 | 5.2 | 5.0 | 4.9 |
| r2 (%) | 40.19 (±.23) | 41.17 (±20.77) | 44.39 (±9.60) | 55.27 (±5.28) | 64.37 (±6.05) | 43.53 (±9.74) | 41.54 (±15.23) |
| Mean squared error | 1.17 (±.13) | 2.56 (±1.97) | 1.36 (±0.28) | 1.12 (±0.25) | 0.96 (±0.23) | 2.30 (±1.27) | 1.16 (±0.52) |
| Mean absolute error | 0.81 (±.02) | 1.06 (±0.16) | 0.88 (±0.10) | 0.76 (±0.05) | 0.73 (±0.07) | 1.03 (±0.14) | 0.79 (±0.10) |
| Variable | r2 Score (%) |
|---|---|
| Age | 78.7 |
| Sex (ref: female) | 65.5 |
| Race (ref: non-Hispanic white) | 69.7 |
| Education attainment (ref: high school diploma) | 72.5 |
| Median per capita income | 88.7 |
| Smoking status | 89.5 |
| Binge drinking status | 85.3 |
| Obesity | 91 |
| Diabetes | 86.7 |
| Physical activity | 89.8 |
Publisher’s Note: MDPI stays neutral with regard to jurisdictional claims in published maps and institutional affiliations. |
© 2020 by the authors. Licensee MDPI, Basel, Switzerland. This article is an open access article distributed under the terms and conditions of the Creative Commons Attribution (CC BY) license (http://creativecommons.org/licenses/by/4.0/).
Share and Cite
Bibault, J.-E.; Bassenne, M.; Ren, H.; Xing, L. Deep Learning Prediction of Cancer Prevalence from Satellite Imagery. Cancers 2020, 12, 3844. https://doi.org/10.3390/cancers12123844
Bibault J-E, Bassenne M, Ren H, Xing L. Deep Learning Prediction of Cancer Prevalence from Satellite Imagery. Cancers. 2020; 12(12):3844. https://doi.org/10.3390/cancers12123844
Chicago/Turabian StyleBibault, Jean-Emmanuel, Maxime Bassenne, Hongyi Ren, and Lei Xing. 2020. "Deep Learning Prediction of Cancer Prevalence from Satellite Imagery" Cancers 12, no. 12: 3844. https://doi.org/10.3390/cancers12123844
APA StyleBibault, J.-E., Bassenne, M., Ren, H., & Xing, L. (2020). Deep Learning Prediction of Cancer Prevalence from Satellite Imagery. Cancers, 12(12), 3844. https://doi.org/10.3390/cancers12123844