Effect of Body Weight and Other Metabolic Factors on Risk of Non-Small Cell Lung Cancer among Veterans with HIV and a History of Smoking

 , and
, and
Abstract
:Simple Summary
Abstract
1. Introduction
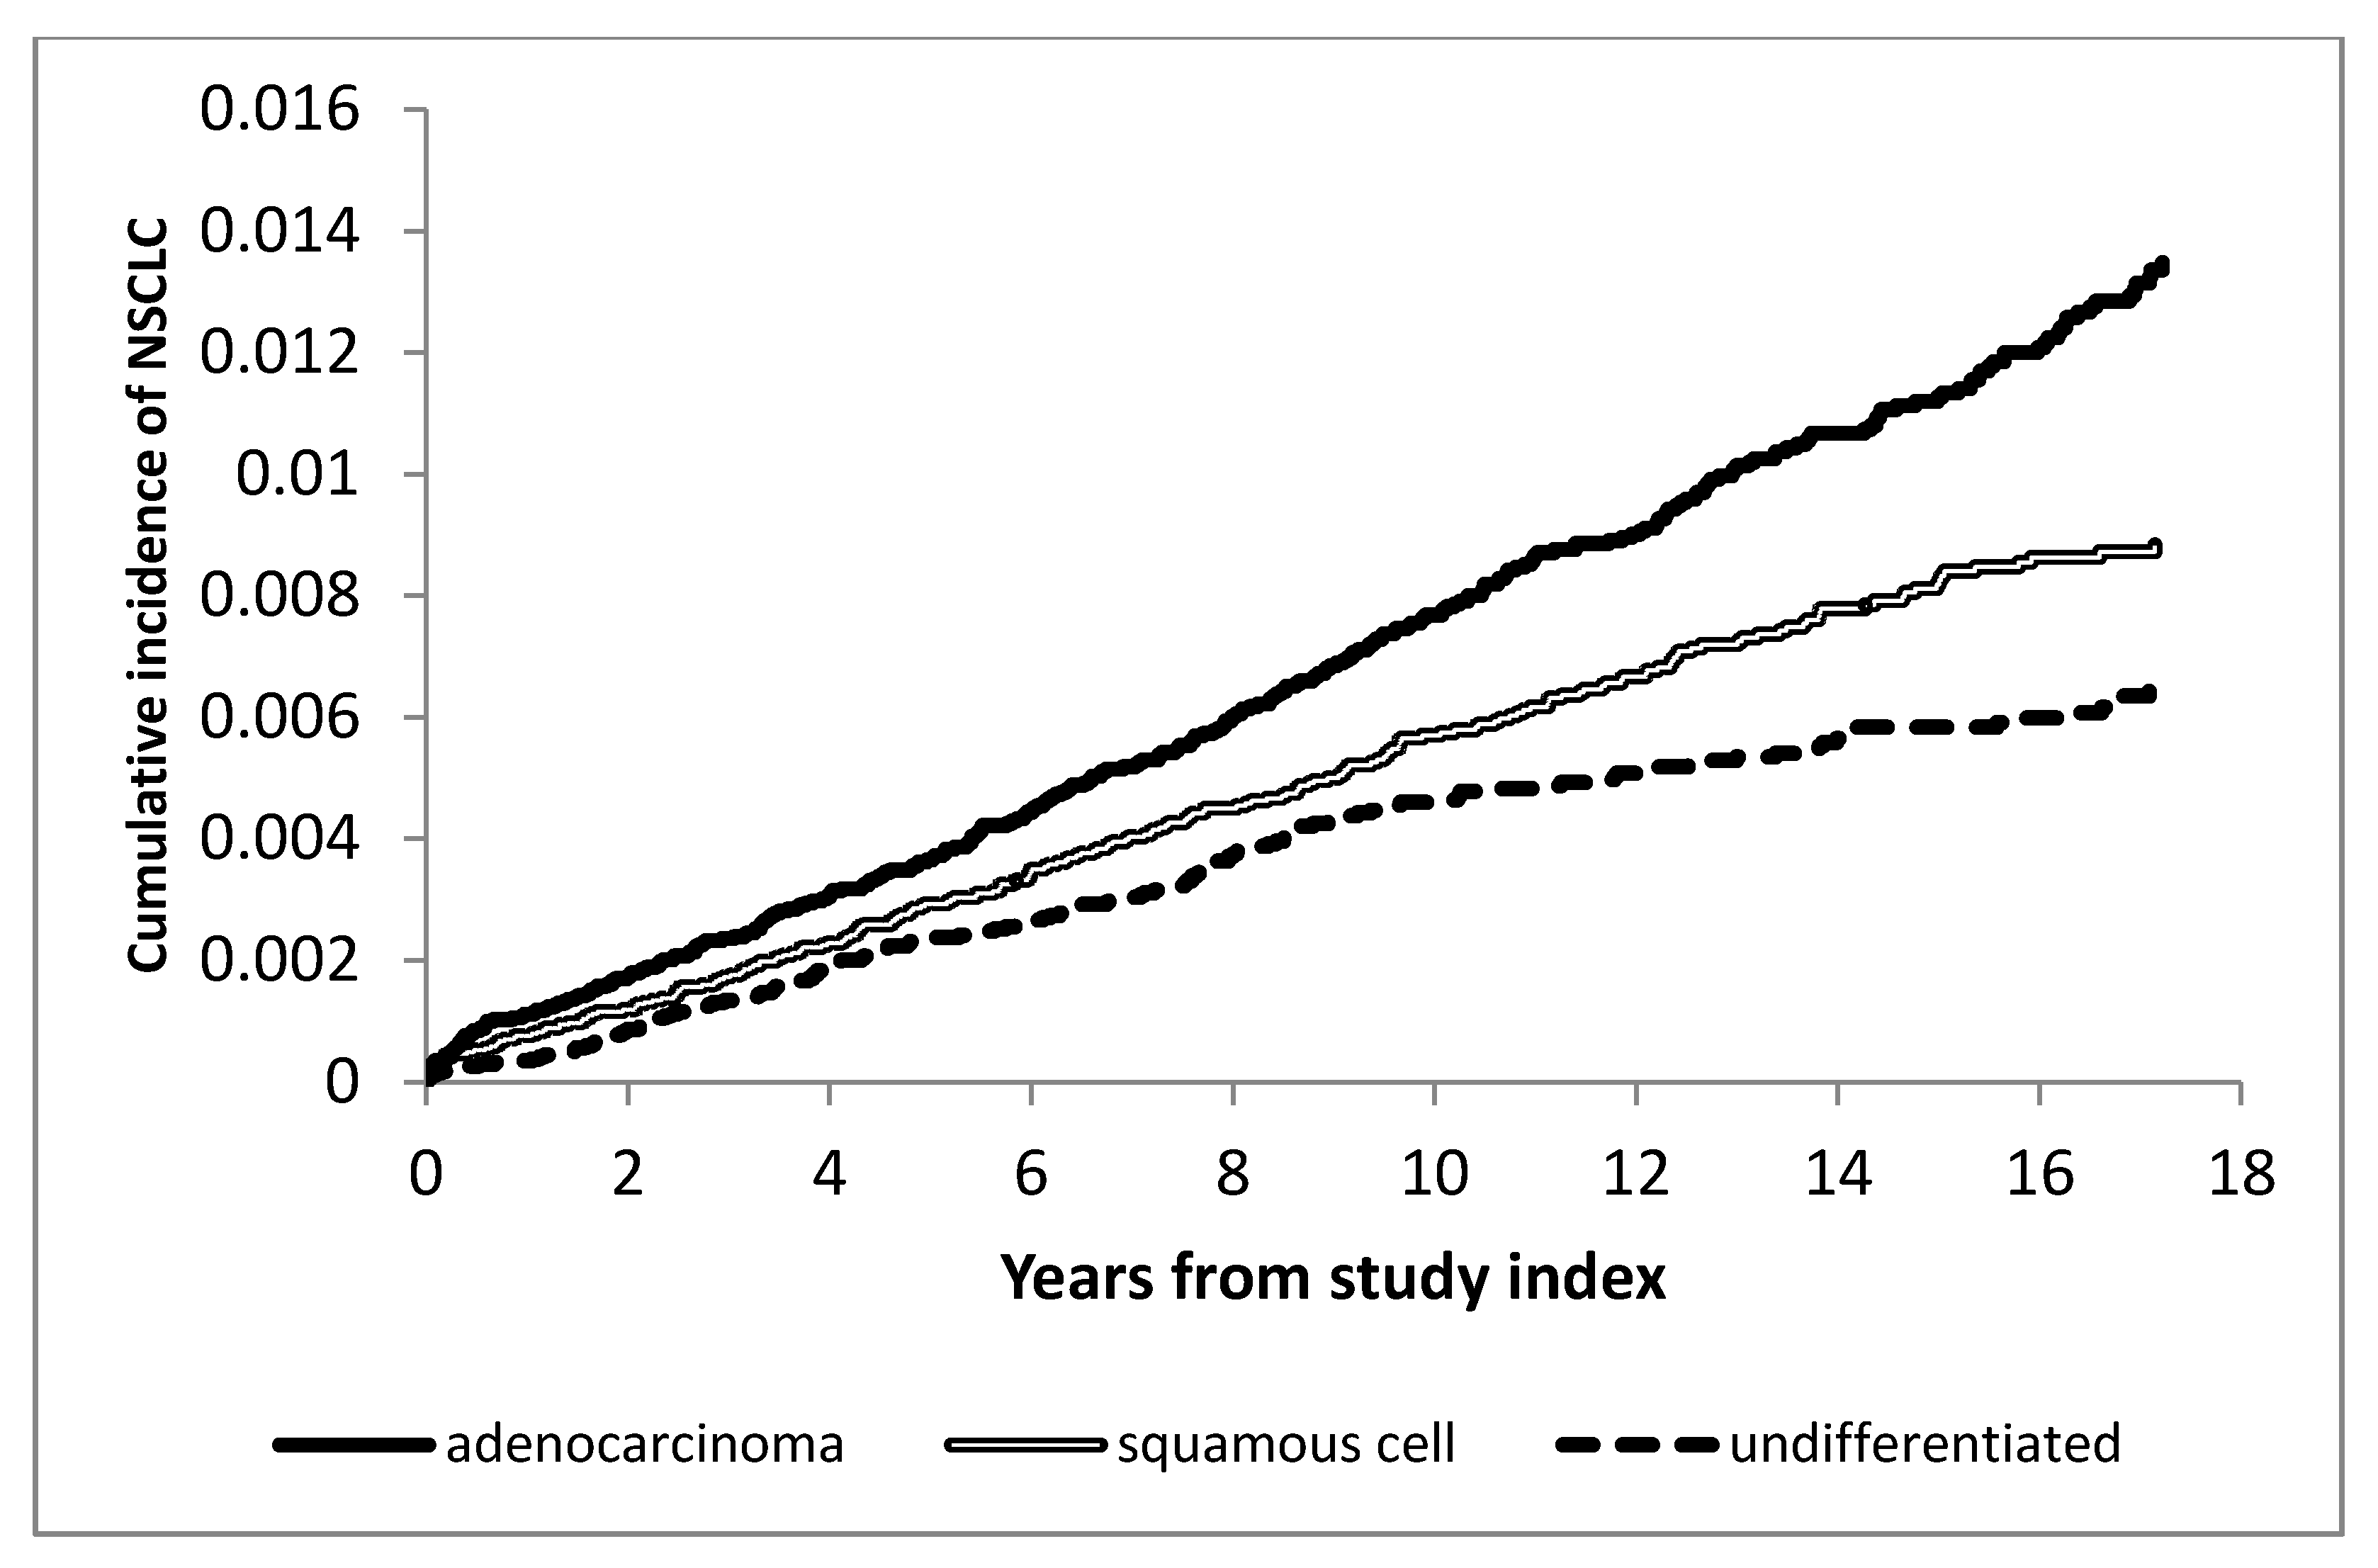
2. Results
2.1. Risk Factors for NSCLC among Veterans with HIV
Univariate Analyses
2.2. Multivariable Analyses
3. Discussion
4. Materials and Methods
4.1. Methods
4.1.1. Study Population and Design
4.1.2. HIV-Positive Cohort
4.1.3. Smoking Cohort
4.1.4. Variable Specification
Outcomes
Covariates
Baseline Covariates
Time-Updated Covariates
Statistical Analysis
5. Conclusions
Supplementary Materials
Author Contributions
Funding
Acknowledgments
Conflicts of Interest
References
- Schneider, M.F.; Gange, S.J.; Williams, C.M.; Anastos, K.; Greenblatt, R.M.; Kingsley, L.; Detels, R.; Muñoz, A. Patterns of the hazard of death after AIDS through the evolution of antiretroviral therapy: 1984–2004. Aids 2005, 19, 2009–2018. [Google Scholar] [CrossRef] [PubMed]
- Palella, F.J., Jr.; Delaney, K.M.; Moorman, A.C.; Loveless, M.O.; Fuhrer, J.; Satten, G.A.; Aschman, D.J.; Holmberg, S.D. Declining morbidity and mortality among patients with advanced human immunodeficiency virus infection. HIV Outpatient Study Investigators. N. Engl. J. Med. 1998, 338, 853–860. [Google Scholar] [CrossRef]
- Winstone, T.A.; Man, S.F.P.; Hull, M.; Montaner, J.S.; Sin, D.D. Epidemic of lung cancer in patients with HIV infection. Chest 2013, 143, 305–314. [Google Scholar] [CrossRef] [PubMed] [Green Version]
- De Wit, S.; Sabin, C.A.; Weber, R.; Worm, S.W.; Reiss, P.; Cazanave, C.; El-Sadr, W.; d’Arminio Monforte, A.; Fontas, E.; Law, M.G.; et al. Incidence and risk factors for new-onset diabetes in HIV-infected patients: The Data Collection on Adverse Events of Anti-HIV Drugs (D:A:D) study. Diabetes Care 2008, 31, 1224–1229. [Google Scholar] [CrossRef] [PubMed] [Green Version]
- Calle, E.E.; Rodriquez, C.; Walker-Thurmond, K.; Thun, M.J. Overweight, obesity, and mortality from cancer in a prospectively studied cohort of U.S. adults. N. Engl. J. Med. 2003, 348, 1625–1638. [Google Scholar] [CrossRef] [PubMed] [Green Version]
- Yang, R.; Cheung, M.C.; Pedroso, F.E.; Byrne, M.M.; Koniaris, L.G.; Zimmers, T.A. Obesity and weight loss at presentation of lung cancer are associated with opposite effects on survival. J. Surg. Res. 2011, 170, e75–e83. [Google Scholar] [CrossRef] [Green Version]
- Yang, Y.; Dong, J.; Sun, K.; Zhao, L.; Zhao, F.; Wang, L.; Jiao, Y. Obesity and incidence of lung cancer: A meta-analysis. Int. J. Cancer 2013, 132, 1162–1169. [Google Scholar] [CrossRef]
- Wang, Z.; Bao, C.; Su, C.; Xu, W.; Luo, H.; Chen, L.; Qi, X. Association between diabetes or antidiabetic therapy and lung cancer: A meta-analysis. J. Diabetes Investig. 2013, 4, 659–666. [Google Scholar] [CrossRef] [Green Version]
- Hall, G.C.; Roberts, C.M.; Boulis, M.; Mo, J.; MacRae, K.D. Diabetes and the risk of lung cancer. Diabetes Care 2005, 28, 590–594. [Google Scholar] [CrossRef] [Green Version]
- Chandler, P.D.; Song, Y.; Lin, J.; Zhang, S.; Sesso, H.D.; Mora, S.; Giovannucci, E.L.; Rexrode, K.E.; Moorthy, M.V.; Li, C.; et al. Lipid biomarkers and long-term risk of cancer in the Women’s Health Study. Am. J. Clin. Nutr. 2016, 103, 1397–1407. [Google Scholar] [CrossRef] [Green Version]
- Ahn, J.; Lim, U.; Weinstein, S.J.; Schatzkin, A.; Hayes, R.B.; Virtamo, J.; Albanes, D. Prediagnostic total and high-density lipoprotein cholesterol and risk of cancer. Cancer Epidemiol. Biomark. Prev. 2009, 18, 2814–2821. [Google Scholar] [CrossRef] [PubMed] [Green Version]
- Kitahara, C.M.; Berrington de Gonzalez, A.; Freedman, N.D.; Huxley, R.; Mok, Y.; Jee, S.H.; Samet, J.M. Total cholesterol and cancer risk in a large prospective study in Korea. J. Clin. Oncol. 2011, 29, 1592–1598. [Google Scholar] [CrossRef] [PubMed] [Green Version]
- Lin, X.; Lu, L.; Liu, L.; Wei, S.; He, Y.; Chang, J.; Lian, X. Blood lipids profile and lung cancer risk in a meta-analysis of prospective cohort studies. J. Clin. Lipidol. 2017, 11, 1073–1081. [Google Scholar] [CrossRef] [PubMed]
- Tan, M.; Song, X.; Zhang, G.; Peng, A.; Li, X.; Li, M.; Liu, Y.; Wang, C. Statins and the risk of lung cancer: A meta-analysis. PLoS ONE 2013, 8, e57349. [Google Scholar] [CrossRef]
- Bedimo, R.; Shebl, F.; Sigel, K.M.; Brown, S.T.; Crothers, K.; Goetz, M.B.; Justice, A.C.; Tate, J. Statin exposure is associated with decreased risk of cancer. In Proceedings of the CROI, Boston, MA, USA, 4–7 March 2018. [Google Scholar]
- Coghill, A.E.; Pfeiffer, R.M.; Shiels, M.S.; Engels, E.A. Excess Mortality among HIV-Infected Individuals with Cancer in the United States. Cancer Epidemiol. Biomark. Prev. 2017, 26, 1027–1033. [Google Scholar] [CrossRef] [Green Version]
- Sohn, M.W.; Arnold, N.; Maynard, C.; Hynes, D.M. Accuracy and completeness of mortality data in the Department of Veterans Affairs. Popul. Health Metr. 2006, 4, 2. [Google Scholar] [CrossRef] [Green Version]
- Patel, P.; Hanson, D.L.; Sullivan, P.S.; Novak, R.M.; Moorman, A.C.; Tong, T.C.; Holmberg, S.D.; Brooks, J.T. Incidence of types of cancer among HIV-infected persons compared with the general population in the United States, 1992–2003. Ann. Intern. Med. 2008, 148, 728–736. [Google Scholar] [CrossRef]
- Shiels, M.S.; Kirk, G.D.; Drummond, B.; Dhillon, D.; Hanash, S.M.; Taguchi, A.; Engels, E.A. HIV Infection and Circulating Levels of Prosurfactant Protein B and Surfactant Protein D. J. Infect. Dis. 2017, 217, 413–417. [Google Scholar] [CrossRef]
- Smith, L.; Brinton, L.A.; Spitz, M.R.; Lam, T.K.; Park, Y.; Hollenbeck, A.R.; Freedman, N.D.; Gierach, G.L. Body mass index and risk of lung cancer among never, former, and current smokers. J. Natl. Cancer Inst. 2012, 104, 778–789. [Google Scholar] [CrossRef] [Green Version]
- Martin, L.; Birdsell, L.; Macdonald, N.; Reiman, T.; Clandinin, M.T.; McCargar, L.J.; Murphy, R.; Ghosh, S.; Sawyer, M.B.; Baracos, V.E. Cancer cachexia in the age of obesity: Skeletal muscle depletion is a powerful prognostic factor, independent of body mass index. J. Clin. Oncol. 2013, 31, 1539–1547. [Google Scholar] [CrossRef]
- Feeney, E.R.; Mallon, P.W. HIV and HAART-Associated Dyslipidemia. Open Cardiovasc. Med. J. 2011, 5, 49–63. [Google Scholar] [CrossRef] [PubMed]
- Pujari, S.N.; Dravid, A.; Naik, E.; Bhagat, S.; Tash, K.; Nadler, J.P.; Sinnott, J.T. Lipodystrophy and dyslipidemia among patients taking first-line, World Health Organization-recommended highly active antiretroviral therapy regimens in Western India. JAIDS 2005, 39, 199–202. [Google Scholar] [PubMed]
- Zullig, L.L.; Jackson, G.L.; Dorn, R.A.; Provenzale, D.T.; McNeil, R.; Thomas, C.M.; Kelley, M.J. Cancer incidence among patients of the U.S. Veterans Affairs Health Care System. Mil. Med 2012, 177, 693–701. [Google Scholar] [CrossRef] [Green Version]
- Jackson, G.L.; Melton, L.D.; Abbott, D.H.; Zullig, L.L.; Ordin, D.L.; Grambow, S.C.; Hamilton, N.S.; Zafar, S.Y.; Gellad, Z.F.; Kelley, M.J.; et al. Quality of nonmetastatic colorectal cancer care in the Department of Veterans Affairs. J. Clin. Oncol. 2010, 28, 3176–3181. [Google Scholar] [CrossRef] [Green Version]
- Kramer, J.R.; Hartman, C.; White, D.L.; Royse, K.; Richardson, P.; Thrift, A.P.; Raychaudhury, S.; Desiderio, R.; Sanchez, D.; Chiao, E.Y. Validation of HIV-infected cohort identification using automated clinical data in the Department of Veterans Affairs. HIV Med. 2019, 20, 567–570. [Google Scholar] [CrossRef] [PubMed]
- McGinnis, K.A.; Brandt, C.A.; Skanderson, M.; Justice, A.C.; Shahrir, S.; Butt, A.A.; Brown, S.T.; Freiberg, M.S.; Gibert, C.L.; Bidwell Goetz, M.; et al. Validating smoking data from the Veteran’s Affairs Health Factors dataset, an electronic data source. Nicotine Tob. Res. 2011, 13, 1233–1239. [Google Scholar] [CrossRef] [PubMed]
- Kanwal, F.; Kramer, J.R.; Mapakshi, S.; Natarajan, Y.; Chayanupatkul, M.; Richardson, P.A.; Li, L.; Desiderio, R.; Thrift, A.P.; Asch, S.M.; et al. Risk of Hepatocellular Cancer in Patients with Non-alcoholic Fatty Liver Disease. Gastroenterology 2018, 155, 1828–1837.e2. [Google Scholar] [CrossRef] [PubMed] [Green Version]
- Fontas, E.; van Leth, F.; Sabin, C.A.; Friis-Moller, N.; Rickenbach, M.; d’Arminio Monforte, A.; Kirk, O.; Dupon, M.; Morfeldt, L.; Mateu, S.; et al. Lipid profiles in HIV-infected patients receiving combination antiretroviral therapy: Are different antiretroviral drugs associated with different lipid profiles? J. Infect. Dis. 2004, 189, 1056–1074. [Google Scholar] [CrossRef]

| Variable | Levels | Well-Controlled HIV | Total (n = 33,351) | |
|---|---|---|---|---|
| Yes | No | |||
| (n = 13,301) | (n = 20,050) | |||
| n (%) | n (%) | n (%) | ||
| Age at Index date, years | <50 | 7010 (52.7%) | 12,453 (62.1%) | 19,463 (58.4%) |
| 50–59 | 4418 (33.2%) | 5626 (28.1%) | 10,044 (30.1%) | |
| 60+ | 1873 (14.1%) | 1971 (9.8%) | 3844 (11.5%) | |
| Gender | Female | 332 (2.5%) | 536 (2.7%) | 868 (2.6%) |
| Male | 12,969 (97.5%) | 19,514 (97.3%) | 32,483 (97.4%) | |
| Race/Ethnicity | Black | 6204 (46.6%) | 11,552 (57.6%) | 17,756 (53.2%) |
| Hispanic | 803 (6.0%) | 1002 (5.0%) | 1805 (5.4%) | |
| Other | 127 (1.0%) | 176 (0.9%) | 303 (0.9%) | |
| Unreported | 347 (2.6%) | 550 (2.7%) | 897 (2.7%) | |
| White | 5820 (43.8%) | 6770 (33.8%) | 12,590 (37.7%) | |
| BMI at Index date, kg/m2 | <18.5 | 219 (1.6%) | 366 (1.8%) | 585 (1.8%) |
| 18.5–25 | 4723 (35.5%) | 5418 (27.0%) | 10,141 (30.4%) | |
| 25–30 | 3991 (30.0%) | 3855 (19.2%) | 7846 (23.5%) | |
| 30+ | 1798 (13.5%) | 1688 (8.4%) | 3486 (10.5%) | |
| unmeasured | 2570 (19.3%) | 8723 (43.5%) | 11,293 (33.9%) | |
| LDL-C at Index date, mg/dL | <100 | 3573 (26.9%) | 4487 (22.4%) | 8060 (24.2%) |
| 100–129 | 2129 (16.0%) | 2383 (11.9%) | 4512 (13.5%) | |
| 130–159 | 1088 (8.2%) | 1141 (5.7%) | 2229 (6.7%) | |
| 160+ | 502 (3.8%) | 527 (2.6%) | 1029 (3.1%) | |
| unmeasured | 6009 (45.2%) | 11,512 (57.4%) | 17,521 (52.5%) | |
| HDL-C at Index date, mg/dL | <40 | 4106 (30.9%) | 4622 (23.1%) | 8728 (26.2%) |
| 40–60 | 2712 (20.4%) | 3309 (16.5%) | 6021 (18.1%) | |
| >60 | 725 (5.5%) | 899 (4.5%) | 1624 (4.9%) | |
| unmeasured | 5758 (43.3%) | 11,220 (56.0%) | 16,978 (50.9%) | |
| Triglycerides at Index date, mg/dL | <150 | 4220 (31.7%) | 5590 (27.9%) | 9810 (29.4%) |
| 150+ | 3709 (27.9%) | 3801 (19.0%) | 7510 (22.5%) | |
| unmeasured | 5372 (40.4%) | 10,659 (53.2%) | 16,031 (48.1%) | |
| History of statin use at Index date | Yes | 999 (7.5%) | 988 (4.9%) | 1987 (6.0%) |
| History of diabetes at Index date | Yes | 780 (5.9%) | 1017 (5.1%) | 1797 (5.4%) |
| History of COPD at Index date | Yes | 938 (7.1%) | 1178 (5.9%) | 2116 (6.3%) |
| HIV diagnosis date, years | <2001 | 5117 (38.5%) | 9428 (47.0%) | 14,545 (43.6%) |
| 2001–2009 | 5399 (40.6%) | 6263 (31.2%) | 11,662 (35.0%) | |
| 2010+ | 2785 (20.9%) | 4359 (21.7%) | 7144 (21.4%) | |
| Statin exposure * | Yes | 6736 (50.6%) | 6299 (31.4%) | 13,035 (39.1%) |
| Nadir CD4 * | <200 | 5095 (38.3%) | 8729 (43.5%) | 13,824 (41.5%) |
| 200–500 | 5175 (38.9%) | 5170 (25.8%) | 10,345 (31.0%) | |
| >500 | 1782 (13.4%) | 1400 (7.0%) | 3182 (9.5%) | |
| unmeasured | 1249 (9.4%) | 4751 (23.7%) | 6000 (18.0%) | |
| ART (% time) * | <50% | 2558 (19.2%) | 9480 (47.3%) | 12,038 (36.1%) |
| 50–80% | 4327 (32.5%) | 5241 (26.1%) | 9568 (28.7%) | |
| 80%+ | 6416 (48.2%) | 2421 (12.1%) | 8837 (26.5%) | |
| Non-cannabis substance abuse * | Yes | 5389 (40.5%) | 9878 (49.3%) | 15,267 (45.8%) |
| Alcohol abuse * | Yes | 6418 (48.3%) | 10,547 (52.6%) | 16,965 (50.9%) |
| Variable | Levels | All | Well-Controlled HIV | ||||
|---|---|---|---|---|---|---|---|
| Yes | No | ||||||
| HR and 95% CI | p-Value | HR and 95% CI | p-Value | HR and 95% CI | p-Value | ||
| Age at Index date, years | <50 | 1.0 (reference) | 1.0 (reference) | 1.0 (reference) | |||
| 50–59 | 3.25 (2.75–3.84) | <0.0001 | 2.85 (2.12–3.83) | <0.0001 | 3.65 (2.97–4.48) | <0.0001 | |
| 60+ | 4.36 (3.49–5.45) | <0.0001 | 4.28 (2.97–6.16) | <0.0001 | 5.11 (3.82–6.85) | <0.0001 | |
| Gender | F vs. M | 0.82 (0.492–1.369) | 0.45 | 0.72 (0.27–1.94) | 0.52 | 0.84 (0.45–1.58) | 0.59 |
| Race/ethnicity | White | 1.0 (reference) | 1.0 (reference) | 1.0 (reference) | |||
| Black | 0.96 (0.82–1.12) | 0.58 | 0.95 (0.73–1.23) | 0.67 | 0.93 (0.76–1.13) | 0.43 | |
| Hispanic | 0.34 (0.19–0.58) | 0.0001 | 0.32 (0.13–0.79) | 0.01 | 0.33 (0.16–0.67) | 0.002 | |
| Other | 0.20 (0.03–1.45) | 0.11 | 0.57 (0.08–4.09) | 0.578 | 0.000 (0.000–Infty) | 0.96 | |
| Unreported | 0.48 (0.22–1.08) | 0.07 | 0.44 (0.11–1.79) | 0.25 | 0.55 (0.20–1.49) | 0.24 | |
| HIV diagnosis date, years | pre 2001 | 1.0 (reference) | 1.0 (reference) | 1.0 (reference) | |||
| 2001–2009 | 1.19 (1.01–1.39) | 0.04 | 1.15 (0.87–1.51) | 0.33 | 1.27 (1.03–1.56) | 0.02 | |
| 2010+ | 1.11 (0.82–1.51) | 0.50 | 0.73 (0.37–1.43) | 0.35 | 1.34 (0.94–1.91) | 0.11 | |
| Cachexia * | none | 1.0 (reference) | 1.0 (reference) | 1.0 (reference) | |||
| current cachexia | 6.01 (4.91–7.35) | <0.0001 | 7.18 (5.15–9.99) | <0.0001 | 5.27 (4.06–6.84) | <0.0001 | |
| recent cachexia | 1.36 (0.89–2.08) | 0.16 | 1.49 (0.72–3.06) | 0.28 | 1.20 (0.69–2.08) | 0.51 | |
| distant past or rebounded | 1.28 (1.05–1.57) | 0.01 | 1.44 (1.04–1.98) | 0.02 | 1.14 (0.87–1.49) | 0.35 | |
| undefined/first year after index | 1.08 (0.77–1.50) | 0.67 | 0.81 (0.32–2.04) | 0.65 | 0.96 (0.65–1.40) | 0.82 | |
| BMI at Index date, kg/m2 | <18.5 | 2.06 (1.36–3.13) | 0.0007 | 2.29 (1.16–4.53) | 0.02 | 1.84 (1.06–3.17) | 0.03 |
| 18.5–25 | 1.0 (reference) | 1.0 (reference) | 1.0 (reference) | ||||
| 25–30 | 0.63 (0.51–0.78) | <0.0001 | 0.71 (0.51–0.97) | 0.03 | 0.58 (0.44–0.76) | 0.0002 | |
| 30+ | 0.47 (0.34–0.66) | <0.0001 | 0.53 (0.32–0.88) | 0.01 | 0.45 (0.29–0.70) | 0.0004 | |
| missing | 0.85 (0.71–1.01) | 0.07 | 0.77 (0.54–1.09) | 0.15 | 0.79 (0.64–0.98) | 0.03 | |
| Nadir CD4 cell count, cells/mm3 * | <200 | 1.0 (reference) | 1.0 (reference) | 1.0 (reference) | |||
| 200–500 | 0.88 (0.73–1.05) | 0.15 | 0.85 (0.64–1.14) | 0.27 | 0.91 (0.72–1.15) | 0.42 | |
| >500 | 0.81 (0.62–1.06) | 0.13 | 0.64 (0.41–1.01) | 0.05 | 0.94 (0.66–1.35) | 0.75 | |
| missing | 1.02 (0.80–1.29) | 0.88 | 0.92 (0.58–1.45) | 0.71 | 0.95 (0.71–1.28) | 0.73 | |
| % Time with undetectable VL * | <50% | 1.0 (reference) | |||||
| 50–80% | 0.94 (0.76–1.16) | 0.54 | --- | --- | --- | --- | |
| 80%+ | 1.01 (0.85–1.20) | 0.91 | --- | --- | --- | --- | |
| H/O COPD at Index date | Y/N | 2.19 (1.69–2.85) | <0.0001 | 2.21 (1.41–3.48) | 0.0006 | 2.19 (1.55–3.10) | <0.0001 |
| Current HDL-C, mg/dL * | <40 | 1.0 (reference) | 1.0 (reference) | 1.0 (reference) | |||
| 40–60 | 0.84 (0.69–1.01) | 0.06 | 0.85 (0.63–1.15) | 0.30 | 0.86 (0.67–1.09) | 0.21 | |
| >60 | 0.98 (0.75–1.27) | 0.85 | 0.99 (0.66–1.50) | 0.97 | 0.99 (0.70–1.42) | 0.99 | |
| missing | 0.64 (0.52–0.79) | <0.0001 | 0.61 (0.40–0.91) | 0.01 | 0.57 (0.44–0.73) | <0.0001 | |
| Current LDL-C, mg/dL * | <100 | 1.0 (reference) | 1.0 (reference) | 1.0 (reference) | |||
| 100–129 | 0.90 (0.74–1.09) | 0.29 | 0.89 (0.64–1.22) | 0.46 | 0.89 (0.69–1.15) | 0.38 | |
| 130–159 | 0.77 (0.58–1.02) | 0.06 | 0.92 (0.60–1.41) | 0.71 | 0.68 (0.46–1.01) | 0.05 | |
| 160+ | 0.69 (0.45–1.08) | 0.10 | 0.49 (0.22–1.13) | 0.09 | 0.83 (0.48–1.43) | 0.50 | |
| missing | 0.65 (0.53–0.79) | <0.0001 | 0.67 (0.46–0.99) | 0.04 | 0.54 (0.43–0.69) | <0.0001 | |
| Current Triglycerides, mg/dL * | <150 | 1.0 (reference) | 1.0 (reference) | 1.0 (reference) | |||
| 150+ | 0.67 (0.56–0.79) | <0.0001 | 0.77 (0.58–1.01) | 0.06 | 0.63 (0.49–0.79) | <0.0001 | |
| missing | 0.55 (0.45–0.68) | <0.0001 | 0.56 (0.37–0.84) | 0.005 | 0.48 (0.38–0.61) | <0.0001 | |
| % Time on statins* | none | 1.0 (reference) | 1.0 (reference) | 1.0 (reference) | |||
| <50% | 1.28 (1.05–1.55) | 0.01 | 1.04 (0.75–1.44) | 0.81 | 1.49 (1.16–1.92) | 0.001 | |
| 50–80% | 1.31 (0.97–1.77) | 0.07 | 1.39 (0.93–2.08) | 0.11 | 1.51 (0.95–2.42) | 0.08 | |
| 80%+ | 1.75 (1.25–2.44) | 0.001 | 1.64 (1.03–2.61) | 0.03 | 2.46 (1.48–4.07) | 0.0005 | |
| Current diabetes* | Y/N | 1.07 (0.87–1.32) | 0.52 | 1.17 (0.85–1.62) | 0.33 | 1.07 (0.81–1.41) | 0.64 |
| COPD history (so far) * | Y/N | 2.57 (2.19–3.00) | <0.0001 | 2.43 (1.87–3.17) | <0.0001 | 2.72 (2.22–3.32) | <0.0001 |
| Pneumonia episodes (so far) * | 0 | 1.0 (reference) | 1.0 (reference) | 1.0 (reference) | |||
| 1 | 1.80 (1.49–2.17) | <0.0001 | 1.83 (1.34–2.49) | 0.0001 | 1.77 (1.40–2.24) | <0.0001 | |
| 2+ | 2.18 (1.66–2.84) | <0.0001 | 2.56 (1.68–3.99) | <0.0001 | 2.01 (1.43–2.83) | <0.0001 | |
| % Time on metformin (from diabetes) * | no metformin | 1.0 (reference) | 1.0 (reference) | 1.0 (reference) | |||
| <50% | 0.88 (0.57–1.38) | 0.58 | 0.99 (0.50–1.98) | 0.99 | 0.82 (0.45–1.49) | 0.51 | |
| 50–80% | 1.32 (0.76–2.27) | 0.32 | 1.45 (0.66–3.18) | 0.35 | 1.12 (0.49–2.56) | 0.79 | |
| 80%+ | 0.68 (0.32–1.43) | 0.30 | 0.49 (0.14–1.68) | 0.26 | 0.78 (0.27–2.22) | 0.64 | |
| no DM | 0.88 (0.66–1.19) | 0.41 | 0.82 (0.49–1.35) | 0.43 | 0.87 (0.59–1.27) | 0.46 | |
| Alcohol abuse (so far) * | Y/N | 1.29 (1.11–1.51) | 0.0010 | 1.28 (0.99–1.66) | 0.06 | 1.28 (1.05–1.56) | 0.01 |
| Non-cannabis substance use (so far) * | Y/N | 1.14 (0.98–1.33) | 0.09 | 1.04 (0.79–1.36) | 0.76 | 1.17 (0.96–1.42) | 0.12 |
| Variable | Levels | Well-Controlled HIV | |||
|---|---|---|---|---|---|
| Yes | No | ||||
| HR and 95% CI | p-Value | HR and 95% CI | p-Value | ||
| Age at Index date, years | <50 | 1.0 (reference) | 1.0 (reference) | ||
| 50–59 | 2.55 (1.88–3.46) | <0.0001 | 3.29 (2.66–4.06) | <0.0001 | |
| 60+ | 3.79 (2.56–5.62) | <0.0001 | 4.44 (3.25–6.08) | <0.0001 | |
| Race | White | 1.0 (reference) | 1.0 (reference) | ||
| Black | 0.98 (0.74–1.30) | 0.89 | 0.94 (0.76–1.16) | 0.53 | |
| Hispanic | 0.35 (0.14–0.86) | 0.02 | 0.37 (0.18–0.75) | 0.006 | |
| Other | 0.83 (0.12–5.98) | 0.85 | 0.00 (0.00–Infty) | 0.96 | |
| Unreported | 0.49 (0.12–2.01) | 0.32 | 0.56 (0.21–1.51) | 0.24 | |
| Gender | F vs. M | 0.89 (0.33–2.43) | 0.82 | 0.99 (0.53–1.88) | 0.98 |
| COPD history (so far) * | Y/N | 1.87 (1.42–2.47) | <0.0001 | 2.07 (1.68–2.56) | <0.0001 |
| HIV diagnosis date, years | pre 2001 | 1.0 (reference) | 1.0 (reference) | ||
| 2001–2009 | 0.98 (0.73–1.31) | 0.89 | 1.07 (0.86–1.32) | 0.56 | |
| 2010+ | 0.54 (0.27–1.08) | 0.08 | 0.93 (0.64–1.37) | 0.72 | |
| Nadir CD4 cell count, cell/mm3 * | <200 | 1.0 (reference) | 1.0 (reference) | ||
| 200–500 | 0.99 (0.74–1.33) | 0.95 | 1.02 (0.80–1.29) | 0.88 | |
| >500 | 0.89 (0.56–1.42) | 0.61 | 1.17 (0.81–1.69) | 0.39 | |
| BMI at Index date, kg/m2 | <18.5 | 1.73 (0.87–3.44) | 0.11 | 1.25 (0.72–2.16) | 0.43 |
| 18.5–25 | 1.0 (reference) | 1.0 (reference) | |||
| 25–30 | 0.75 (0.54–1.04) | 0.08 | 0.61 (0.46–0.81) | 0.0006 | |
| 30+ | 0.52 (0.31–0.86) | 0.01 | 0.40 (0.26–0.63) | <0.0001 | |
| Cachexia * | none | 1.0 (reference) | 1.0 (reference) | ||
| current cachexia | 6.34 (4.52–8.88) | <0.0001 | 4.42 (3.39–5.77) | <0.0001 | |
| recent cachexia | 1.37 (0.66–2.83) | 0.39 | 1.06 (0.61–1.83) | 0.84 | |
| distant past or rebounded | 1.39 (1.01–1.93) | 0.04 | 1.07 (0.81–1.40) | 0.64 | |
| undefined/first year after index | 1.04 (0.39–2.78) | 0.93 | 1.23 (0.80–1.88) | 0.34 | |
| Current LDL-C, mg/dL * | <100 | 1.0 (reference) | 1.0 (reference) | ||
| 100–129 | 1.05 (0.76–1.45) | 0.78 | 1.01 (0.78–1.31) | 0.93 | |
| 130–159 | 1.18 (0.77–1.82) | 0.44 | 0.83 (0.56–1.24) | 0.36 | |
| 160+ | 0.67 (0.29–1.53) | 0.33 | 1.08 (0.62–1.88) | 0.79 | |
| Current HDL-C, mg/dL * | <40 | 1.0 (reference) | 1.0 (reference) | ||
| 40–60 | 0.79 (0.56–1.08) | 0.13 | 0.77 (0.59–0.99) | 0.03 | |
| > 60 | 0.77 (0.49–1.19) | 0.24 | 0.76 (0.53–1.09) | 0.13 | |
| Current Triglycerides, mg/dL * | <150 | 1.0 (reference) | 1.0 (reference) | ||
| 150+ | 0.80 (0.60–1.08) | 0.14 | 0.65 (0.51–0.84) | 0.0007 | |
| Pneumonia episodes (so far) * | 0 | 1.0 (reference) | 1.0 (reference) | ||
| 1 | 1.41 (1.02–1.95) | 0.03 | 1.34 (1.05–1.71) | 0.02 | |
| 2+ | 1.64 (1.05–2.58) | 0.03 | 1.23 (0.86–1.75) | 0.25 | |
| Alcohol (so far) * | Y/N | 1.22 (0.90–1.64) | 0.19 | 1.11 (0.88–1.40) | 0.36 |
| % Time on statins * | none | 1.0 (reference) | 1.0 (reference) | ||
| <50% | 0.91 (0.65–1.28) | 0.58 | 1.23 (0.95–1.59) | 0.12 | |
| 50–80% | 1.14 (0.75–1.75) | 0.53 | 1.04 (0.64–1.69) | 0.86 | |
| 80%+ | 1.27 (0.77–2.09) | 0.34 | 1.59 (0.94–2.69) | 0.08 | |
| Non-cannabis substance use (so far) * | Y/N | 0.91 (0.66–1.25) | 0.56 | 1.01 (0.80–1.28) | 0.92 |
Publisher’s Note: MDPI stays neutral with regard to jurisdictional claims in published maps and institutional affiliations. |
© 2020 by the authors. Licensee MDPI, Basel, Switzerland. This article is an open access article distributed under the terms and conditions of the Creative Commons Attribution (CC BY) license (http://creativecommons.org/licenses/by/4.0/).
Share and Cite
Garcia, J.M.; Kramer, J.R.; Richardson, P.A.; Ahmed, S.; Royse, K.E.; White, D.L.; Raychaudhury, S.; Chang, E.; Hartman, C.M.; Silverberg, M.J.; et al. Effect of Body Weight and Other Metabolic Factors on Risk of Non-Small Cell Lung Cancer among Veterans with HIV and a History of Smoking. Cancers 2020, 12, 3809. https://doi.org/10.3390/cancers12123809
Garcia JM, Kramer JR, Richardson PA, Ahmed S, Royse KE, White DL, Raychaudhury S, Chang E, Hartman CM, Silverberg MJ, et al. Effect of Body Weight and Other Metabolic Factors on Risk of Non-Small Cell Lung Cancer among Veterans with HIV and a History of Smoking. Cancers. 2020; 12(12):3809. https://doi.org/10.3390/cancers12123809
Chicago/Turabian StyleGarcia, Jose M., Jennifer R. Kramer, Peter A. Richardson, Sarah Ahmed, Kathryn E. Royse, Donna L. White, Suchismita Raychaudhury, Elaine Chang, Christine M. Hartman, Michael J. Silverberg, and et al. 2020. "Effect of Body Weight and Other Metabolic Factors on Risk of Non-Small Cell Lung Cancer among Veterans with HIV and a History of Smoking" Cancers 12, no. 12: 3809. https://doi.org/10.3390/cancers12123809
APA StyleGarcia, J. M., Kramer, J. R., Richardson, P. A., Ahmed, S., Royse, K. E., White, D. L., Raychaudhury, S., Chang, E., Hartman, C. M., Silverberg, M. J., & Chiao, E. Y. (2020). Effect of Body Weight and Other Metabolic Factors on Risk of Non-Small Cell Lung Cancer among Veterans with HIV and a History of Smoking. Cancers, 12(12), 3809. https://doi.org/10.3390/cancers12123809