Prior PSMA PET-CT Imaging and Hounsfield Unit Impact on Tumor Yield and Success of Molecular Analyses from Bone Biopsies in Metastatic Prostate Cancer

 , , ,
, , ,
Abstract
:Simple Summary
Abstract
1. Introduction
2. Results
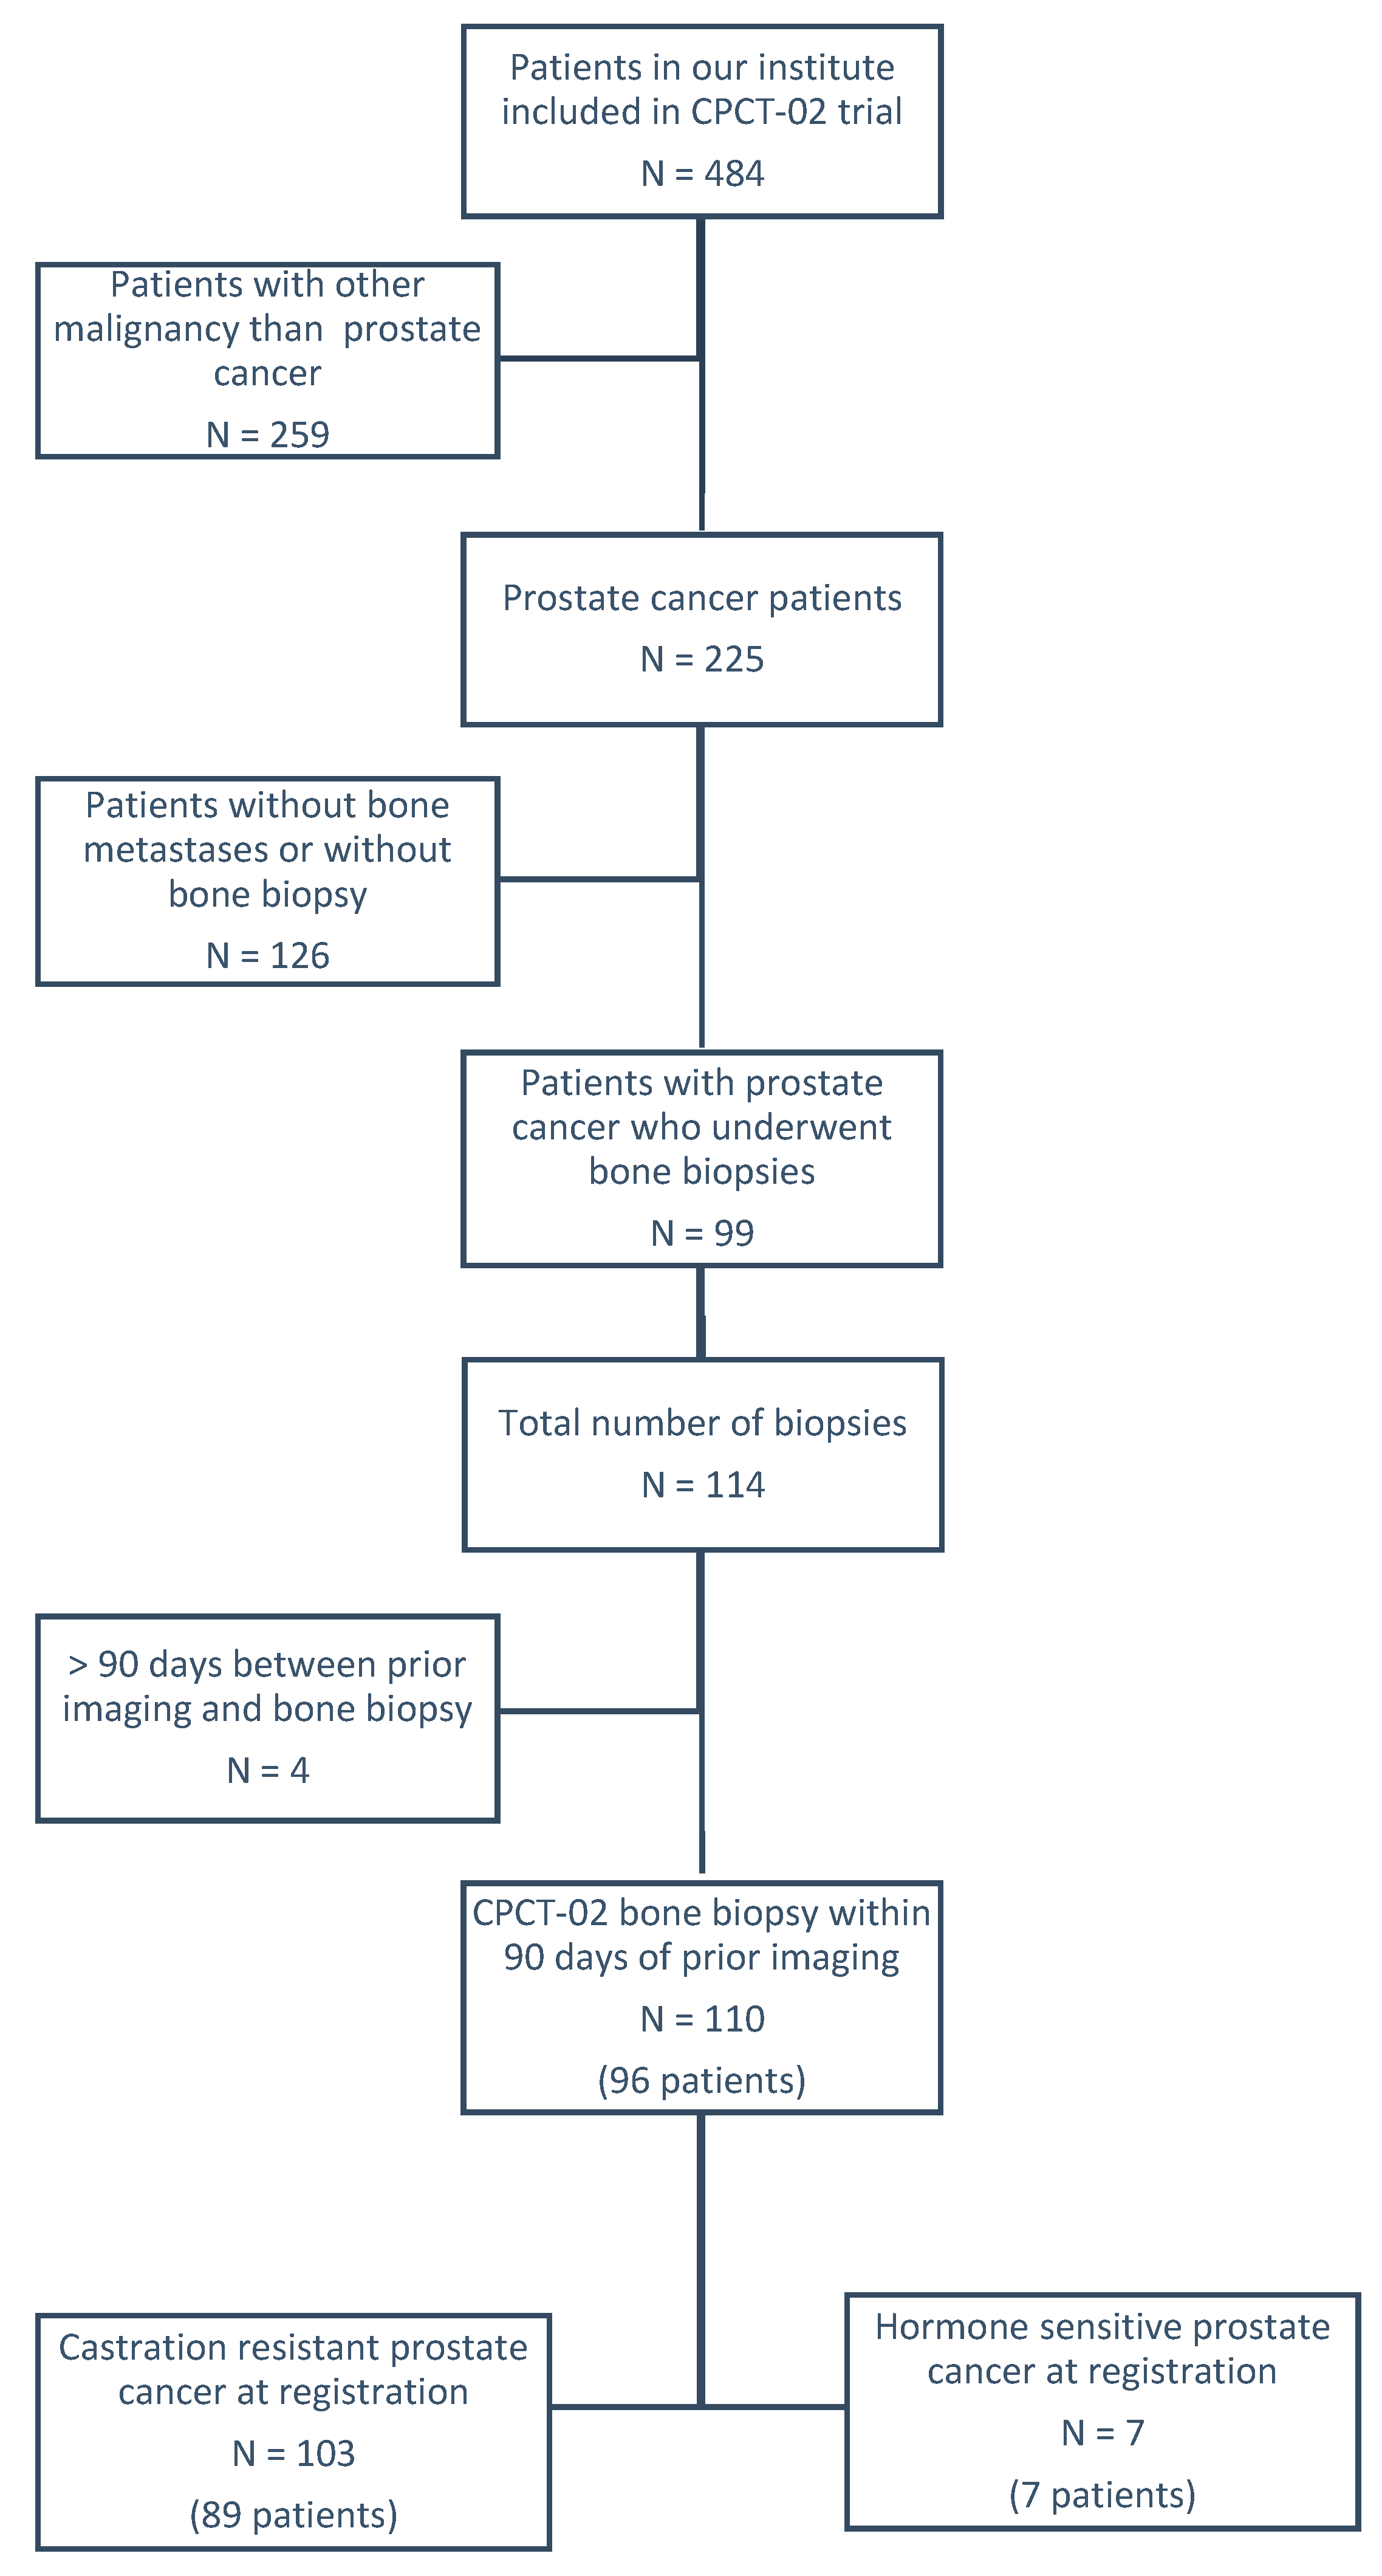
2.1. Study Population
2.2. Clinical Parameters
2.3. Imaging and Procedural Characteristics
2.4. Uni- and Multivariable Analyses
2.5. Imaging Prediction Model
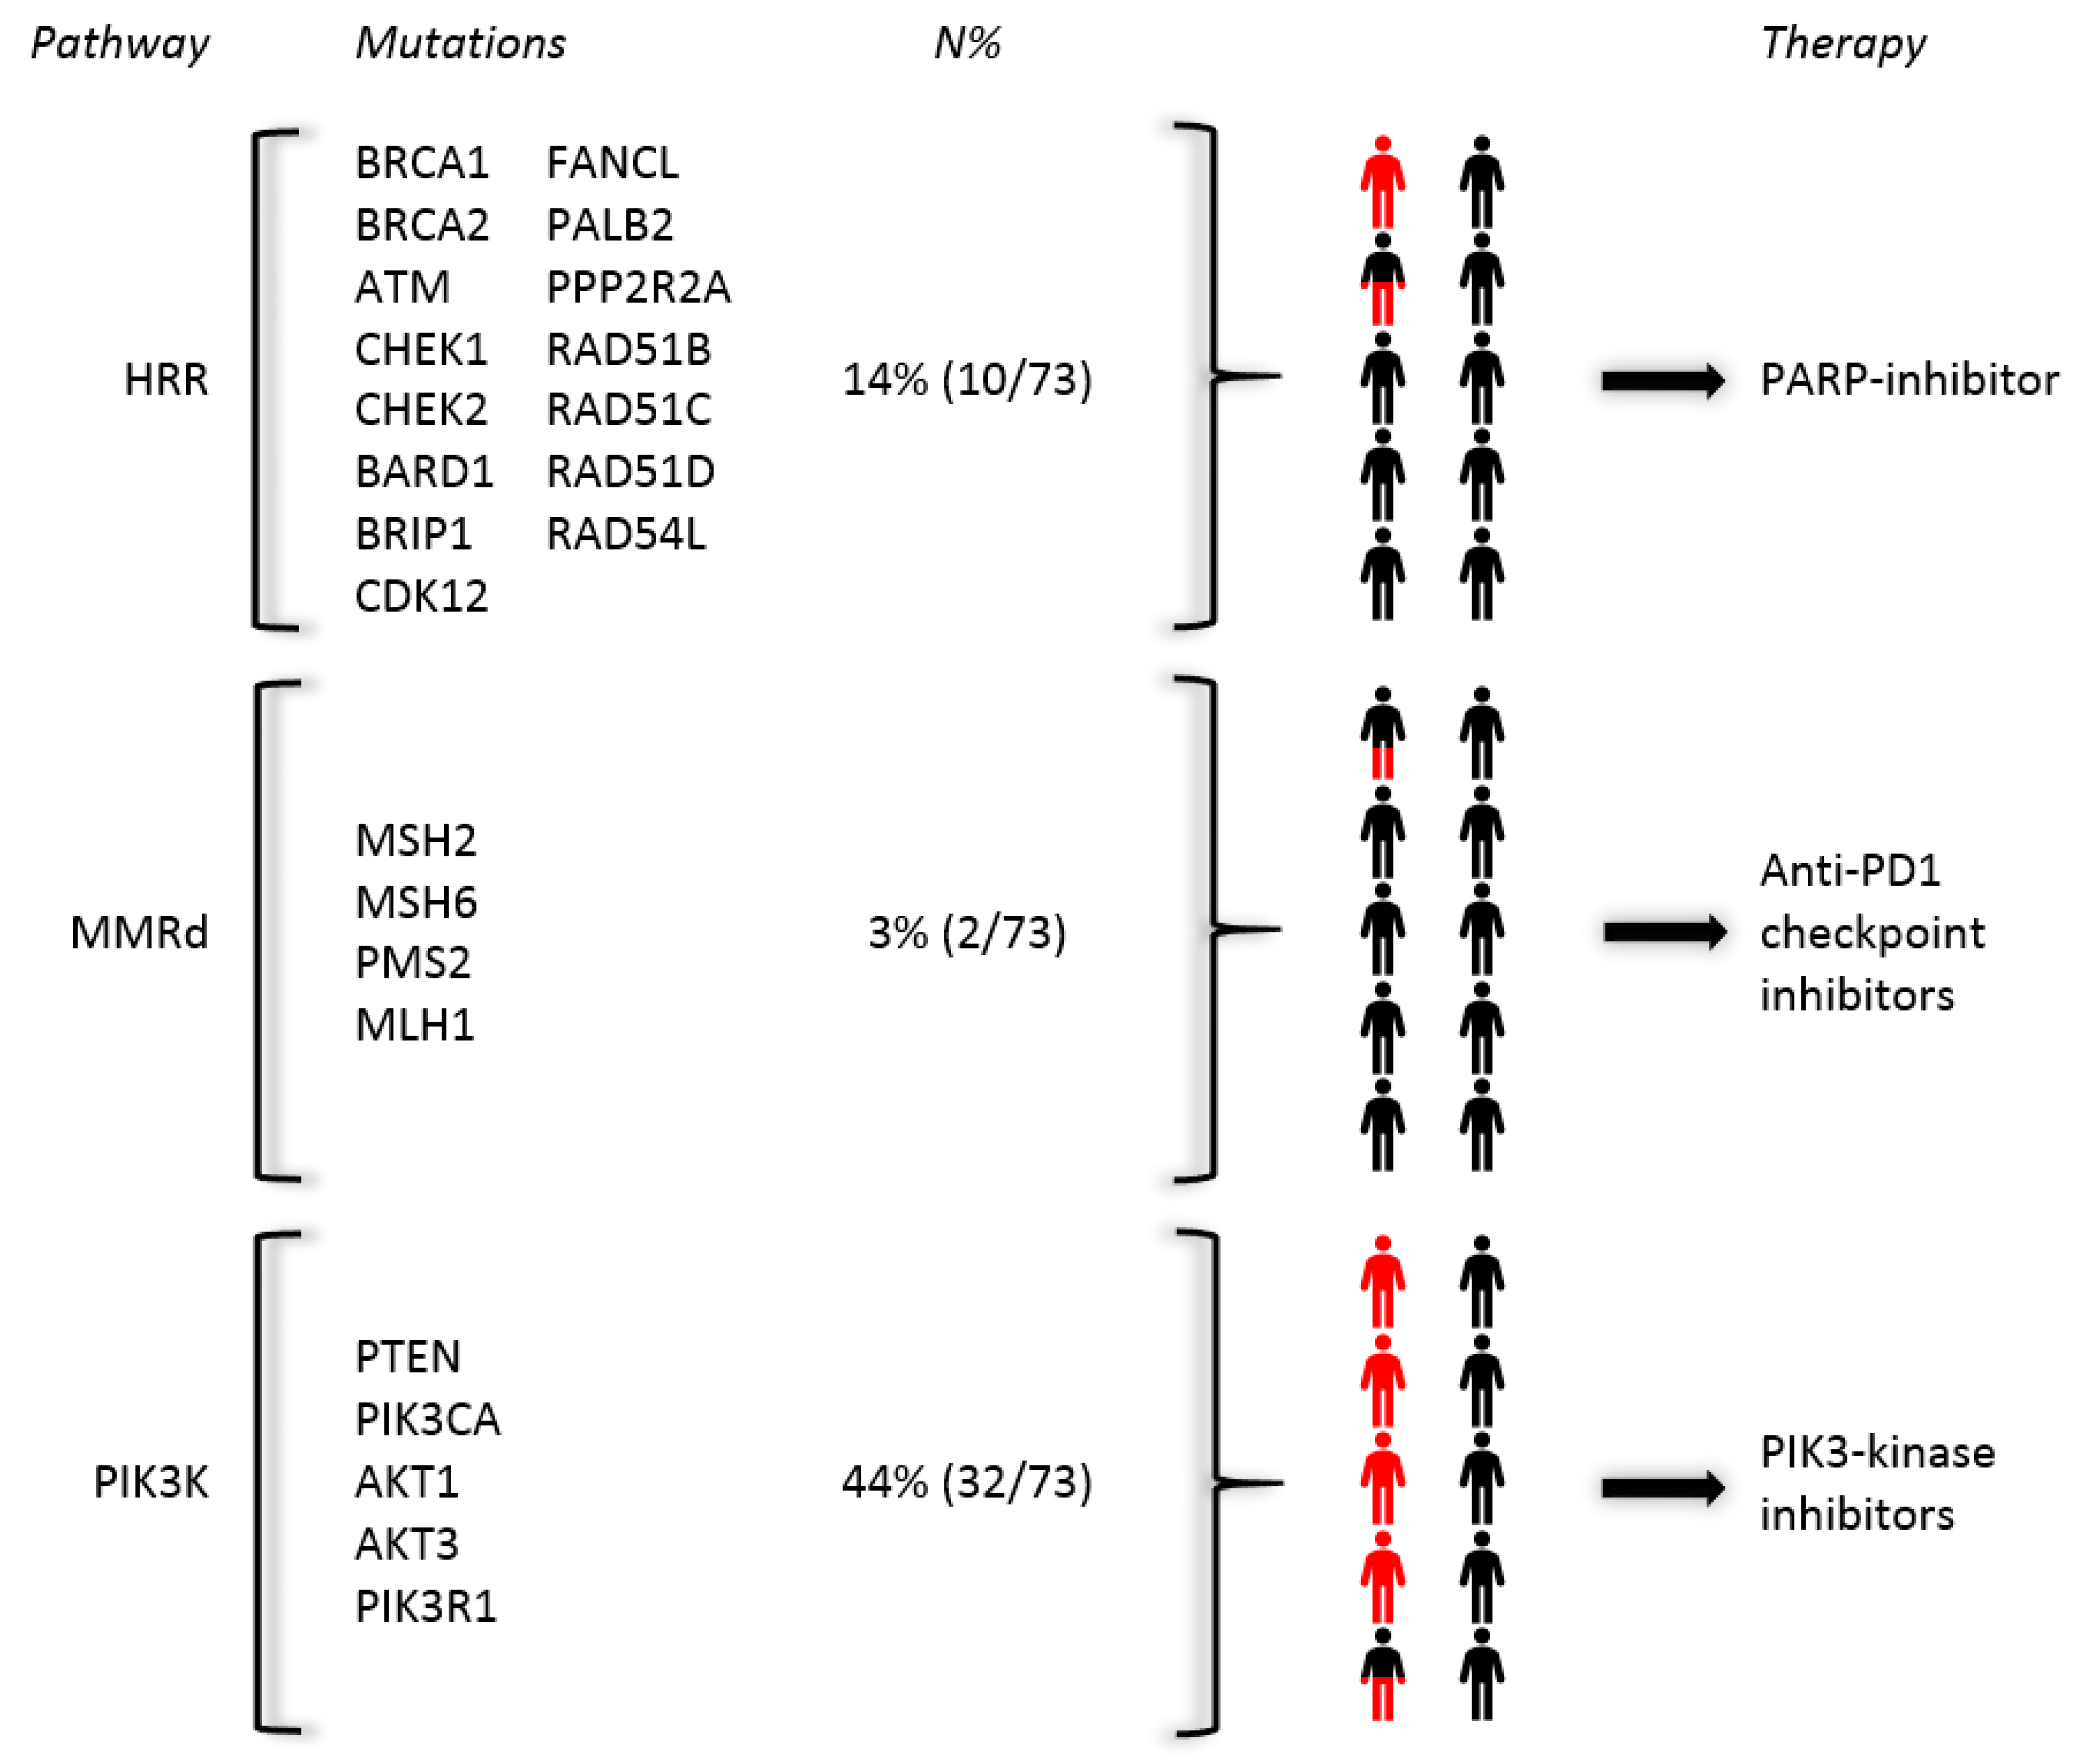
2.6. Druggable Pathogenic Mutations within a Bone-Predominant Cohort
3. Discussion
4. Materials and Methods
4.1. Study Population
4.2. Variable Definition
4.3. Sample Collection, DNA Extraction and Molecular Analysis
4.4. Outcomes
4.5. Statistical Analysis
5. Conclusions
Author Contributions
Funding
Acknowledgments
Conflicts of Interest
References
- Bray, F.; Ferlay, J.; Soerjomataram, I.; Siegel, R.L.; Torre, L.A.; Jemal, A. Global cancer statistics 2018: GLOBOCAN estimates of incidence and mortality worldwide for 36 cancers in 185 countries. CA Cancer J. Clin. 2018, 68, 394–424. [Google Scholar] [CrossRef] [PubMed] [Green Version]
- Pienta, K.J.; Bradley, D. Mechanisms underlying the development of androgen-independent prostate cancer. Clin. Cancer Res. 2006, 12, 1665–1671. [Google Scholar] [CrossRef] [PubMed] [Green Version]
- Huggins, C. Endocrine-induced regression of cancers. Cancer Res. 1967, 27, 1925–1930. [Google Scholar] [CrossRef] [PubMed]
- Shah, R.B.; Mehra, R.; Chinnaiyan, A.M.; Shen, R.; Ghosh, D.; Zhou, M.; Macvicar, G.R.; Varambally, S.; Harwood, J.; Bismar, T.A.; et al. Androgen-independent prostate cancer is a heterogeneous group of diseases: Lessons from a rapid autopsy program. Cancer Res. 2004, 64, 9209–9216. [Google Scholar] [CrossRef] [PubMed] [Green Version]
- Kumar, A.; Coleman, I.; Morrissey, C.; Zhang, X.; True, L.D.; Gulati, R.; Etzioni, R.; Bolouri, H.; Montgomery, B.; White, T.; et al. Substantial interindividual and limited intraindividual genomic diversity among tumors from men with metastatic prostate cancer. Nat. Med. 2016, 22, 369–378. [Google Scholar] [CrossRef] [PubMed]
- Gillessen, S.; Attard, G.; Beer, T.M.; Beltran, H.; Bossi, A.; Bristow, R.; Carver, B.; Castellano, D.; Chung, B.H.; Clarke, N.; et al. Management of Patients with Advanced Prostate Cancer: The Report of the Advanced Prostate Cancer Consensus Conference APCCC 2017. Eur. Urol. 2018, 73, 178–211. [Google Scholar] [CrossRef] [PubMed] [Green Version]
- Bubendorf, L.; Schopfer, A.; Wagner, U.; Sauter, G.; Moch, H.; Willi, N.; Gasser, T.C.; Mihatsch, M.J. Metastatic patterns of prostate cancer: An autopsy study of 1589 patients. Hum. Pathol. 2000, 31, 578–583. [Google Scholar] [CrossRef]
- Halabi, S.; Kelly, W.K.; Ma, H.; Zhou, H.; Solomon, N.C.; Fizazi, K.; Tangen, C.M.; Rosenthal, M.; Petrylak, D.P.; Hussain, M.; et al. Meta-Analysis Evaluating the Impact of Site of Metastasis on Overall Survival in Men With Castration-Resistant Prostate Cancer. J. Clin. Oncol. 2016, 34, 1652–1659. [Google Scholar] [CrossRef]
- McKay, R.R.; Zukotynski, K.A.; Werner, L.; Voznesensky, O.; Wu, J.S.; Smith, S.E.; Jiang, Z.; Melnick, K.; Yuan, X.; Kantoff, P.W.; et al. Imaging, procedural and clinical variables associated with tumor yield on bone biopsy in metastatic castration-resistant prostate cancer. Prostate Cancer Prostatic Dis. 2014, 17, 325–331. [Google Scholar] [CrossRef] [Green Version]
- Mehra, R.; Kumar-Sinha, C.; Shankar, S.; Lonigro, R.J.; Jing, X.; Philips, N.E.; Siddiqui, J.; Han, B.; Cao, X.; Smith, D.C.; et al. Characterization of bone metastases from rapid autopsies of prostate cancer patients. Clin. Cancer Res. 2011, 17, 3924–3932. [Google Scholar] [CrossRef] [Green Version]
- Suprun, H.; Rywlin, A.M. Metastatic carcinoma in histologic sections of aspirated bone marrow: A comparative autopsy study. South. Med. J. 1976, 69, 438–439. [Google Scholar] [CrossRef] [PubMed]
- Viswanathan, S.R.; Ha, G.; Hoff, A.M.; Wala, J.A.; Carrot-Zhang, J.; Whelan, C.W.; Haradhvala, N.J.; Freeman, S.S.; Reed, S.C.; Rhoades, J.; et al. Structural Alterations Driving Castration-Resistant Prostate Cancer Revealed by Linked-Read Genome Sequencing. Cell 2018, 174, 433–447.e419. [Google Scholar] [CrossRef] [PubMed] [Green Version]
- Quigley, D.A.; Dang, H.X.; Zhao, S.G.; Lloyd, P.; Aggarwal, R.; Alumkal, J.J.; Foye, A.; Kothari, V.; Perry, M.D.; Bailey, A.M.; et al. Genomic Hallmarks and Structural Variation in Metastatic Prostate Cancer. Cell 2018, 174, 758–769.e759. [Google Scholar] [CrossRef] [PubMed] [Green Version]
- Robinson, D.; Van Allen, E.M.; Wu, Y.M.; Schultz, N.; Lonigro, R.J.; Mosquera, J.M.; Montgomery, B.; Taplin, M.E.; Pritchard, C.C.; Attard, G.; et al. Integrative clinical genomics of advanced prostate cancer. Cell 2015, 161, 1215–1228. [Google Scholar] [CrossRef] [Green Version]
- Holmes, M.G.; Foss, E.; Joseph, G.; Foye, A.; Beckett, B.; Motamedi, D.; Youngren, J.; Thomas, G.V.; Huang, J.; Aggarwal, R.; et al. CT-Guided Bone Biopsies in Metastatic Castration-Resistant Prostate Cancer: Factors Predictive of Maximum Tumor Yield. J. Vasc. Interv. Radiol. 2017, 28, 1073–1081.e1071. [Google Scholar] [CrossRef] [Green Version]
- Lorente, D.; Omlin, A.; Zafeiriou, Z.; Nava-Rodrigues, D.; Perez-Lopez, R.; Pezaro, C.; Mehra, N.; Sheridan, E.; Figueiredo, I.; Riisnaes, R.; et al. Castration-Resistant Prostate Cancer Tissue Acquisition From Bone Metastases for Molecular Analyses. Clin. Genitourin. Cancer 2016, 14, 485–493. [Google Scholar] [CrossRef] [Green Version]
- Perez-Lopez, R.; Nava Rodrigues, D.; Figueiredo, I.; Mateo, J.; Collins, D.J.; Koh, D.M.; de Bono, J.S.; Tunariu, N. Multiparametric Magnetic Resonance Imaging of Prostate Cancer Bone Disease: Correlation With Bone Biopsy Histological and Molecular Features. Investig. Radiol. 2018, 53, 96–102. [Google Scholar] [CrossRef]
- Ross, R.W.; Halabi, S.; Ou, S.S.; Rajeshkumar, B.R.; Woda, B.A.; Vogelzang, N.J.; Small, E.J.; Taplin, M.E.; Kantoff, P.W.; Cancer and Leukemia Group B. Predictors of prostate cancer tissue acquisition by an undirected core bone marrow biopsy in metastatic castration-resistant prostate cancer—A Cancer and Leukemia Group B study. Clin. Cancer Res. 2005, 11, 8109–8113. [Google Scholar] [CrossRef] [Green Version]
- Sailer, V.; Schiffman, M.H.; Kossai, M.; Cyrta, J.; Beg, S.; Sullivan, B.; Pua, B.B.; Lee, K.S.; Talenfeld, A.D.; Nanus, D.M.; et al. Bone biopsy protocol for advanced prostate cancer in the era of precision medicine. Cancer 2018, 124, 1008–1015. [Google Scholar] [CrossRef] [Green Version]
- Spritzer, C.E.; Afonso, P.D.; Vinson, E.N.; Turnbull, J.D.; Morris, K.K.; Foye, A.; Madden, J.F.; Roy Choudhury, K.; Febbo, P.G.; George, D.J. Bone marrow biopsy: RNA isolation with expression profiling in men with metastatic castration-resistant prostate cancer—Factors affecting diagnostic success. Radiology 2013, 269, 816–823. [Google Scholar] [CrossRef]
- de Jong, A.C.; Smits, M.; van Riet, J.; Futterer, J.J.; Brabander, T.; Hamberg, P.; van Oort, I.M.; de Wit, R.; Lolkema, M.P.; Mehra, N.; et al. (68)Ga-PSMA guided bone biopsies for molecular diagnostics in metastatic prostate cancer patients. J. Nucl. Med. 2020. [Google Scholar] [CrossRef] [PubMed]
- Mateo, J.; Carreira, S.; Sandhu, S.; Miranda, S.; Mossop, H.; Perez-Lopez, R.; Nava Rodrigues, D.; Robinson, D.; Omlin, A.; Tunariu, N.; et al. DNA-Repair Defects and Olaparib in Metastatic Prostate Cancer. N. Engl. J. Med. 2015, 373, 1697–1708. [Google Scholar] [CrossRef] [PubMed]
- Cheng, H.H.; Pritchard, C.C.; Boyd, T.; Nelson, P.S.; Montgomery, B. Biallelic Inactivation of BRCA2 in Platinum-sensitive Metastatic Castration-resistant Prostate Cancer. Eur. Urol. 2016, 69, 992–995. [Google Scholar] [CrossRef] [PubMed] [Green Version]
- Abida, W.; Cheng, M.L.; Armenia, J.; Middha, S.; Autio, K.A.; Vargas, H.A.; Rathkopf, D.; Morris, M.J.; Danila, D.C.; Slovin, S.F.; et al. Analysis of the Prevalence of Microsatellite Instability in Prostate Cancer and Response to Immune Checkpoint Blockade. JAMA Oncol. 2019, 5, 471–478. [Google Scholar] [CrossRef] [PubMed]
- De Bono, J.S.; De Giorgi, U.; Rodrigues, D.N.; Massard, C.; Bracarda, S.; Font, A.; Arranz Arija, J.A.; Shih, K.C.; Radavoi, G.D.; Xu, N.; et al. Randomized Phase II Study Evaluating Akt Blockade with Ipatasertib, in Combination with Abiraterone, in Patients with Metastatic Prostate Cancer with and without PTEN Loss. Clin. Cancer Res. 2019, 25, 928–936. [Google Scholar] [CrossRef] [Green Version]
- Van Steenbergen, T.R.F.; Smits, M.; Scheenen, T.W.J.; van Oort, I.M.; Nagarajah, J.; Rovers, M.M.; Mehra, N.; Futterer, J.J. (68)Ga-PSMA-PET/CT and Diffusion MRI Targeting for Cone-Beam CT-Guided Bone Biopsies of Castration-Resistant Prostate Cancer Patients. Cardiovasc. Interv. Radiol. 2019. [Google Scholar] [CrossRef] [Green Version]
- Hussain, M.; Mateo, J.; Fizazi, K.; Saad, F.; Shore, N.; Sandhu, S.; Chi, K.; Sartor, O.; Agarwal, N.; Olmos, D.; et al. LBA12_PRPROfound: Phase III study of olaparib versus enzalutamide or abiraterone for metastatic castration-resistant prostate cancer (mCRPC) with homologous recombination repair (HRR) gene alterations. Ann. Oncol. 2019, 30. [Google Scholar] [CrossRef]
- Bono, J.; Fizazi, K.; Saad, F.; Shore, N.; Sandhu, S.; Mehra, N.; Kolinsky, M.; Roubaud, G.; ÖZgÜRoĞLu, M.; Matsubara, N.; et al. 847PDCentral, prospective detection of homologous recombination repair gene mutations (HRRm) in tumour tissue from >4000 men with metastatic castration-resistant prostate cancer (mCRPC) screened for the PROfound study. Ann. Oncol. 2019, 30. [Google Scholar] [CrossRef]
- Pritchard, C.C.; Morrissey, C.; Kumar, A.; Zhang, X.; Smith, C.; Coleman, I.; Salipante, S.J.; Milbank, J.; Yu, M.; Grady, W.M.; et al. Complex MSH2 and MSH6 mutations in hypermutated microsatellite unstable advanced prostate cancer. Nat. Commun. 2014, 5, 4988. [Google Scholar] [CrossRef] [Green Version]
- Nghiem, B.; Zhang, X.; Lam, H.M.; True, L.D.; Coleman, I.; Higano, C.S.; Nelson, P.S.; Pritchard, C.C.; Morrissey, C. Mismatch repair enzyme expression in primary and castrate resistant prostate cancer. Asian J. Urol. 2016, 3, 223–228. [Google Scholar] [CrossRef] [Green Version]
- Wu, Y.M.; Cieslik, M.; Lonigro, R.J.; Vats, P.; Reimers, M.A.; Cao, X.; Ning, Y.; Wang, L.; Kunju, L.P.; de Sarkar, N.; et al. Inactivation of CDK12 Delineates a Distinct Immunogenic Class of Advanced Prostate Cancer. Cell 2018, 173, 1770–1782.e1714. [Google Scholar] [CrossRef] [PubMed] [Green Version]
- Abida, W.; Armenia, J.; Gopalan, A.; Brennan, R.; Walsh, M.; Barron, D.; Danila, D.; Rathkopf, D.; Morris, M.; Slovin, S.; et al. Prospective Genomic Profiling of Prostate Cancer Across Disease States Reveals Germline and Somatic Alterations That May Affect Clinical Decision Making. JCO Precis. Oncol. 2017, 2017. [Google Scholar] [CrossRef] [PubMed]
- Van Dessel, L.F.; van Riet, J.; Smits, M.; Zhu, Y.; Hamberg, P.; van der Heijden, M.S.; Bergman, A.M.; van Oort, I.M.; de Wit, R.; Voest, E.E.; et al. The genomic landscape of metastatic castration-resistant prostate cancers reveals multiple distinct genotypes with potential clinical impact. Nat. Commun. 2019, 10, 5251. [Google Scholar] [CrossRef] [PubMed] [Green Version]
- Scher, H.I.; Morris, M.J.; Stadler, W.M.; Higano, C.; Basch, E.; Fizazi, K. Trial Design and Objectives for Castration-Resistant Prostate Cancer: Updated Recommendations From the Prostate Cancer Clinical Trials Working Group 3. J. Clin. Oncol. 2016, 34, 1402–1418. [Google Scholar] [CrossRef] [Green Version]
- Priestley, P.; Baber, J.; Lolkema, M.P.; Steeghs, N.; de Bruijn, E.; Shale, C. Pan-cancer whole-genome analyses of metastatic solid tumours. Nature 2019, 575, 210–216. [Google Scholar] [CrossRef] [Green Version]
- Kroeze, L.I.; de Voer, R.M.; Kamping, E.J.; von Rhein, D.; Jansen, E.A.M.; Hermsen, M.J.W. Evaluation of a Hybrid Capture-Based Pan-Cancer Panel for Analysis of Treatment Stratifying Oncogenic Aberrations and Processes. J. Mol. Diagn. 2020, 22, 757–769. [Google Scholar] [CrossRef]


| Clinical Characteristics | No Tumor Cells Detected | Tumor Cells Present Median (q1–q3) or Percent | p-Value * | Insufficient Tumor Yield (<30%) | Sufficient Tumor Yield for Molecular Analysis (≥30%) Median (q1–q3) or Percent | p-Value * |
|---|---|---|---|---|---|---|
| Total | 76.4% (84/110) | 66.4% (73/110) 86.9% (73/84) | ||||
| Age at the time of biopsy (years) | 65.0 (58.0–72.3) | 68.0 (62.0–73.0) | p = 0.281 | 65.0 (59.5–71.0) | 69.0 (62.0–74.0) | p = 0.137 |
| Hormone status at the time of biopsy | p = 0.751 | p = 0.769 | ||||
| HSPC † | 28.6% (N = 2) | 71.4% (N = 5) | 28.6% (N = 2) | 71.4% (N = 5) | ||
| CRPC ‡ | 23.3% (N = 24) | 76.7% (N = 79) | 34.0% (N = 35) | 66.0% (N = 68) | ||
| Prior radiotherapy on biopsied metastasis | p = 0.751 | p = 0.769 | ||||
| Yes | 28.6% (N = 2) | 71.4% (N = 5) | 28.6% (N = 2) | 71.4% (N = 5) | ||
| No | 23.3% (N = 24) | 76.7% (N = 79) | 34.0% (N = 35) | 66.0% (N = 68) | ||
| Gleason score at primary diagnosis | p = 0.948 | p = 0.437 | ||||
| <8 | 22/28 (78.6%) | 18/28 (64.3%) | ||||
| ≥8 | 57/72 (79.2%) | 52/72 (72.2%) | ||||
| Laboratory values | ||||||
| PSA (µg/L) | 38.0 (9.4–110.0) | 98.0 (20.5–245.0) | p = 0.029 | 54.0 (12.0–147.5) | 95.5 (21.3–315.0) | p = 0.126 |
| Alkaline phosphatase (U/L) | 109.0 (78.5–140.3) | 117.0 (87.0–224.5) | p = 0.376 | 105.0 (78.0–138.0) | 128.0 (87.5–232.8) | p = 0.100 |
| Albumin (g/L) | 34.0 (33.0–36.0) | 36.0 (34.0–38.3) | p = 0.040 | 34.0 (33.0–39.0) | 36.0 (34.0–38.0) | p = 0.567 |
| LDH (U/L) | 221.0 (197.8–264.3) | 220.0 (180.0–249.0) | p = 0.636 | 220.5 (201.5–264.8) | 220.0 (179.0–247.0) | p = 0.768 |
| Hemoglobin (mmol/L0) | 7.9 (7.4–8.3) | 7.7 (6.8–8.3) | p = 0.376 | 7.9 (7.1–8.4) | 7.7 (6.9–8.3) | p = 0.795 |
| Leukocytes (×109/L) | 6.6 (5.5–7.9) | 6.1 (4.8–7.9) | p = 0.340 | 6.0 (5.2–7.4) | 6.1 (4.8–8.2) | p = 0.910 |
| Thrombocytes (×109/L) | 236.0 (202.5–287.5) | 234.0 (171.3–284.0) | p = 0.550 | 228.5 (180.5–286.3) | 238.0 (184.0–286.0) | p = 0.448 |
| Imaging and Procedural Characteristics | Tumor Cells Present (N = 84) | p-Value * | Sufficient Tumor Yield for Molecular Analysis (≥30%) | p-Value * | ||
|---|---|---|---|---|---|---|
| (N = 73) | ||||||
| Median (q1–q3) or Number (Percent) | Median (q1–q3) or Number (Percent) | |||||
| Imaging characteristics | ||||||
| Imaging type | p = 0.037 | p = 0.292 | ||||
| CT | 23/36 (63.9%) | 21/36 (58.3%) | ||||
| MRI | 8/12 (66.7%) | 7/12 (58.3%) | ||||
| PSMA PET-CT ¥ | 53/62 (85.5%) | 45/62 (72.6%) | ||||
| (68Ga-PSMA N = 52; F18-PSMA N = 10) | ||||||
| Biopsy location | p = 0.027 | p = 0.012 | ||||
| Pelvis | 57/79 (72.2%) | 47/79 (59.5%) | ||||
| Spine | 23/24 (95.8%) | 22/24 (91.7%) | ||||
| Other (3 rib,3 extremity, 1 scapula) | 4/7 (57.1%) | 4/7 (57.1%) | ||||
| Procedural characteristics | ||||||
| Radiologist/fellow Radiologist | 56/73 (76.7%) | p = 0.942 | 51/73 (69.9%) | p = 0.268 | ||
| Fellow | 17/23 (73.9%) | 12/23 (52.2%) | ||||
| Internist | 11/14 (78.6%) | 10/14 (71.4%) | ||||
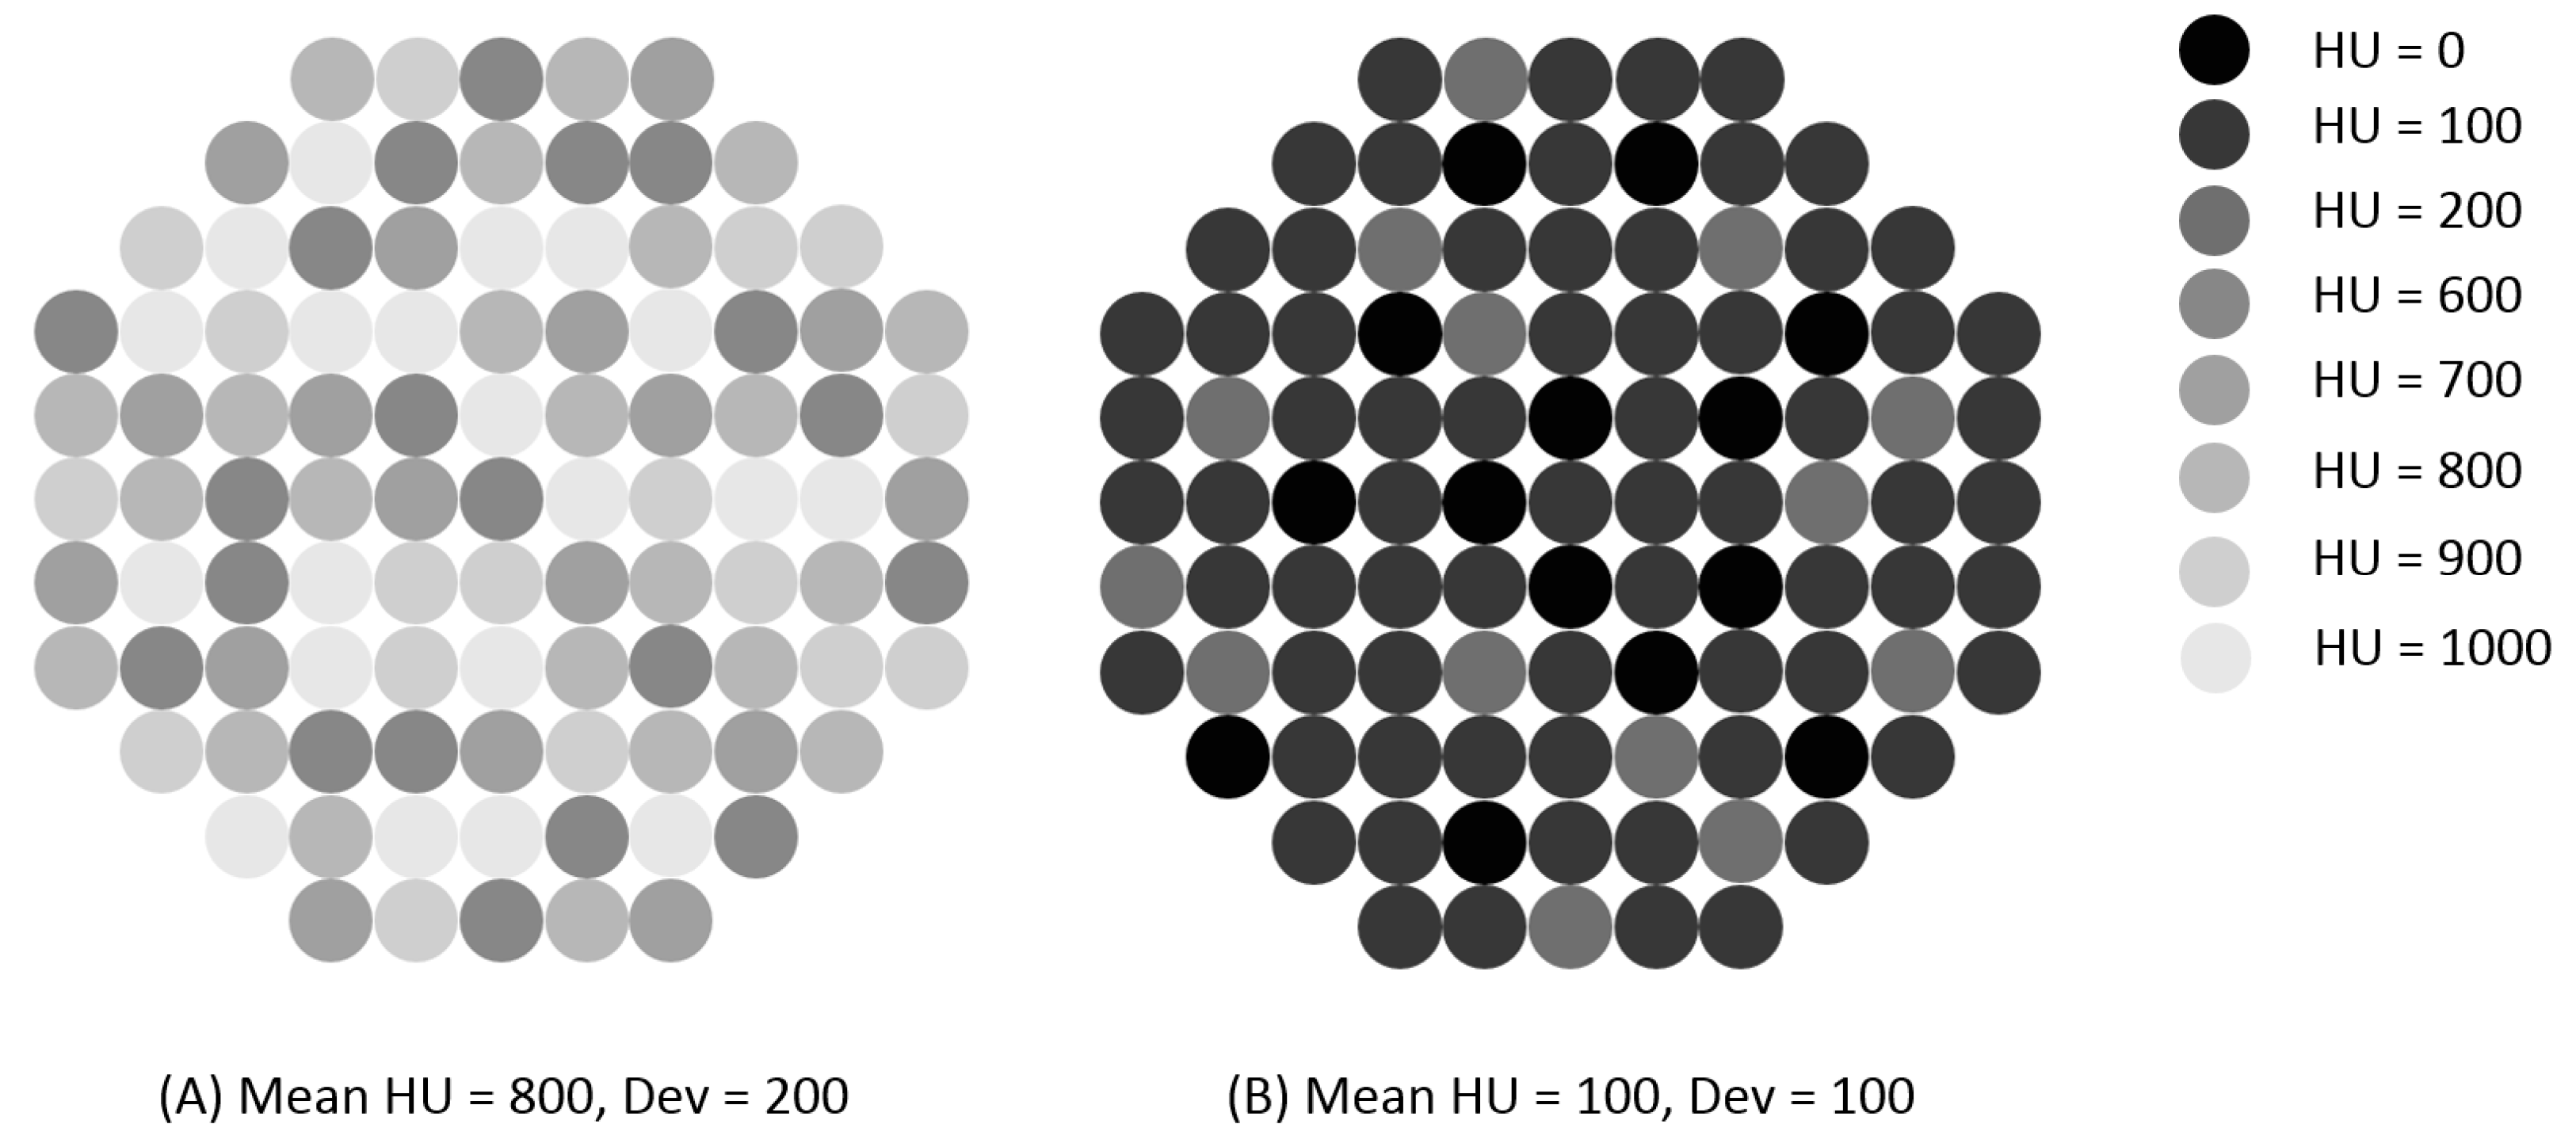
| Quantitative attenuation | No tumor cells | Tumor cells present | p-Value | Insufficient tumor yield | Sufficient tumor yield | p-Value |
| HU † | 597.6 (327.4–824.9) | 447.4 (206.4–579.1) | p = 0.025 | 581.9 (333.0–807.2) | 445.8 (182.7–553.1) | p = 0.010 |
| Dev ‡ | 174.4 (102.3–223.8) | 119.3 (72.0–154.7) | p = 0.023 | 174.6 (104.4–220.7) | 111.3 (71.6–147.1) | p = 0.006 |
| ROI ± | 39.6 (33.6–45.0) | 34.0 (26.5–41.6) | p = 0.108 | 38.6 (32.3–44.7) | 34.0 (26.0–41.8) | p = 0.193 |
| Variable | Successful Histology OR † (95% CI) | p-Value | Successful Genetic Analysis OR † (95% CI) | p-Value |
|---|---|---|---|---|
| Imaging Type | ||||
| CT | A | A | ||
| MRI | 1.13 (0.29–4.49) | p = 0.862 | 1.00 (0.27–3.76) | p = 1.000 |
| PSMA PET-CT | 3.33 (1.25–8.88) | p = 0.016 | 1.89 (0.795–4.496) | p = 0.150 |
| Biopsy location | ||||
| Pelvis | B | B | ||
| Spine | 8.88 (1.13–69.77) | p = 0.038 | 7.49 (1.65–34.09) | p = 0.009 |
| Other | 0.52 (0.11–2.49) | p = 0.409 | 0.91 (0.19–4.33) | p = 0.903 |
| HU | 0.998 (0.996–1.000) | p = 0.034 | 0.998 (0.996–1.000) | p = 0.016 |
| Dev | 0.990 (0.983–0.998) | p = 0.017 | 0.989 (0.981–0.997) | p = 0.008 |
| ROI | 0.986 (0.953–1.020) | p = 0.420 | 0.992 (0.960–1.025) | p = 0.639 |
| ROI log 10 | 0.110 (0.003–3.797) | p = 0.222 | 0.186 (0.006–5.365) | p = 0.327 |
| Groups Categorized by HU and Dev | Tumor Cells Present | Odds Ratio | Successful Molecular Analysis (≥30%) | Odds Ratio |
|---|---|---|---|---|
| Group 1 HU < 713.50 and Dev < 178.90 | 36/44 (81.8%) | A | 34/44 (77.3%) | A |
| Group 2 HU ≥ 713.50 or Dev ≥ 178.90 | 10/18 (55.6%) | 0.278 (p = 0.037) | 8/18 (44.4%) | 0.235 (p = 0.235) |
| Group 3 HU ≥ 713.50 and Dev ≥ 178.90 | 4/9 (44.4%) | 0.178 (p = 0.026) | 3/9 (33.3%) | 0.147 (p = 0.016) |
| Reference | N | Imaging | Diagnostic Yield | Sufficiency for Molecular Analysis | Type of Molecular Analysis |
|---|---|---|---|---|---|
| [15] | 80 | CT-guided | 69% | 64% | RNA NGS ‡ |
| [16] | 115 | Unguided | 62.% | Not performed | |
| [9] | 39 | CT-guided | 77% | Not performed | |
| [17] | 43 | MRI | 72.1% | Not performed | |
| [18] | 184 | Unguided | 25.5% | Not performed | |
| [19] | 70 | CT-guided | 85.7% | WES † 81.7% ➔ RNA-seq 33.3% | DNA WES † |
| [20] | 54 | CT-guided | 67% | 39% | RNA microarray analysis |
| [26] | 10 | CBCT- Guided * | 90% | 80% | Single molecular inversion probe and WES † |
| Current study | 110 | 76.4% | 66.4% of total; 86.8% of biopsies with histological documentation of tumor cells | WES † and/or targeted NGS ‡ (possible when ≥30% tumor cells are available) |
Publisher’s Note: MDPI stays neutral with regard to jurisdictional claims in published maps and institutional affiliations. |
© 2020 by the authors. Licensee MDPI, Basel, Switzerland. This article is an open access article distributed under the terms and conditions of the Creative Commons Attribution (CC BY) license (http://creativecommons.org/licenses/by/4.0/).
Share and Cite
Smits, M.; Ekici, K.; Pamidimarri Naga, S.; van Oort, I.M.; Sedelaar, M.J.P.; Schalken, J.A.; Nagarajah, J.; Scheenen, T.W.J.; Gerritsen, W.R.; Fütterer, J.J.; et al. Prior PSMA PET-CT Imaging and Hounsfield Unit Impact on Tumor Yield and Success of Molecular Analyses from Bone Biopsies in Metastatic Prostate Cancer. Cancers 2020, 12, 3756. https://doi.org/10.3390/cancers12123756
Smits M, Ekici K, Pamidimarri Naga S, van Oort IM, Sedelaar MJP, Schalken JA, Nagarajah J, Scheenen TWJ, Gerritsen WR, Fütterer JJ, et al. Prior PSMA PET-CT Imaging and Hounsfield Unit Impact on Tumor Yield and Success of Molecular Analyses from Bone Biopsies in Metastatic Prostate Cancer. Cancers. 2020; 12(12):3756. https://doi.org/10.3390/cancers12123756
Chicago/Turabian StyleSmits, Minke, Kamer Ekici, Samhita Pamidimarri Naga, Inge M. van Oort, Michiel J. P. Sedelaar, Jack A. Schalken, James Nagarajah, Tom W. J. Scheenen, Winald R. Gerritsen, Jurgen J. Fütterer, and et al. 2020. "Prior PSMA PET-CT Imaging and Hounsfield Unit Impact on Tumor Yield and Success of Molecular Analyses from Bone Biopsies in Metastatic Prostate Cancer" Cancers 12, no. 12: 3756. https://doi.org/10.3390/cancers12123756