Divergent Resistance Mechanisms to Immunotherapy Explain Responses in Different Skin Cancers

 , and
, and 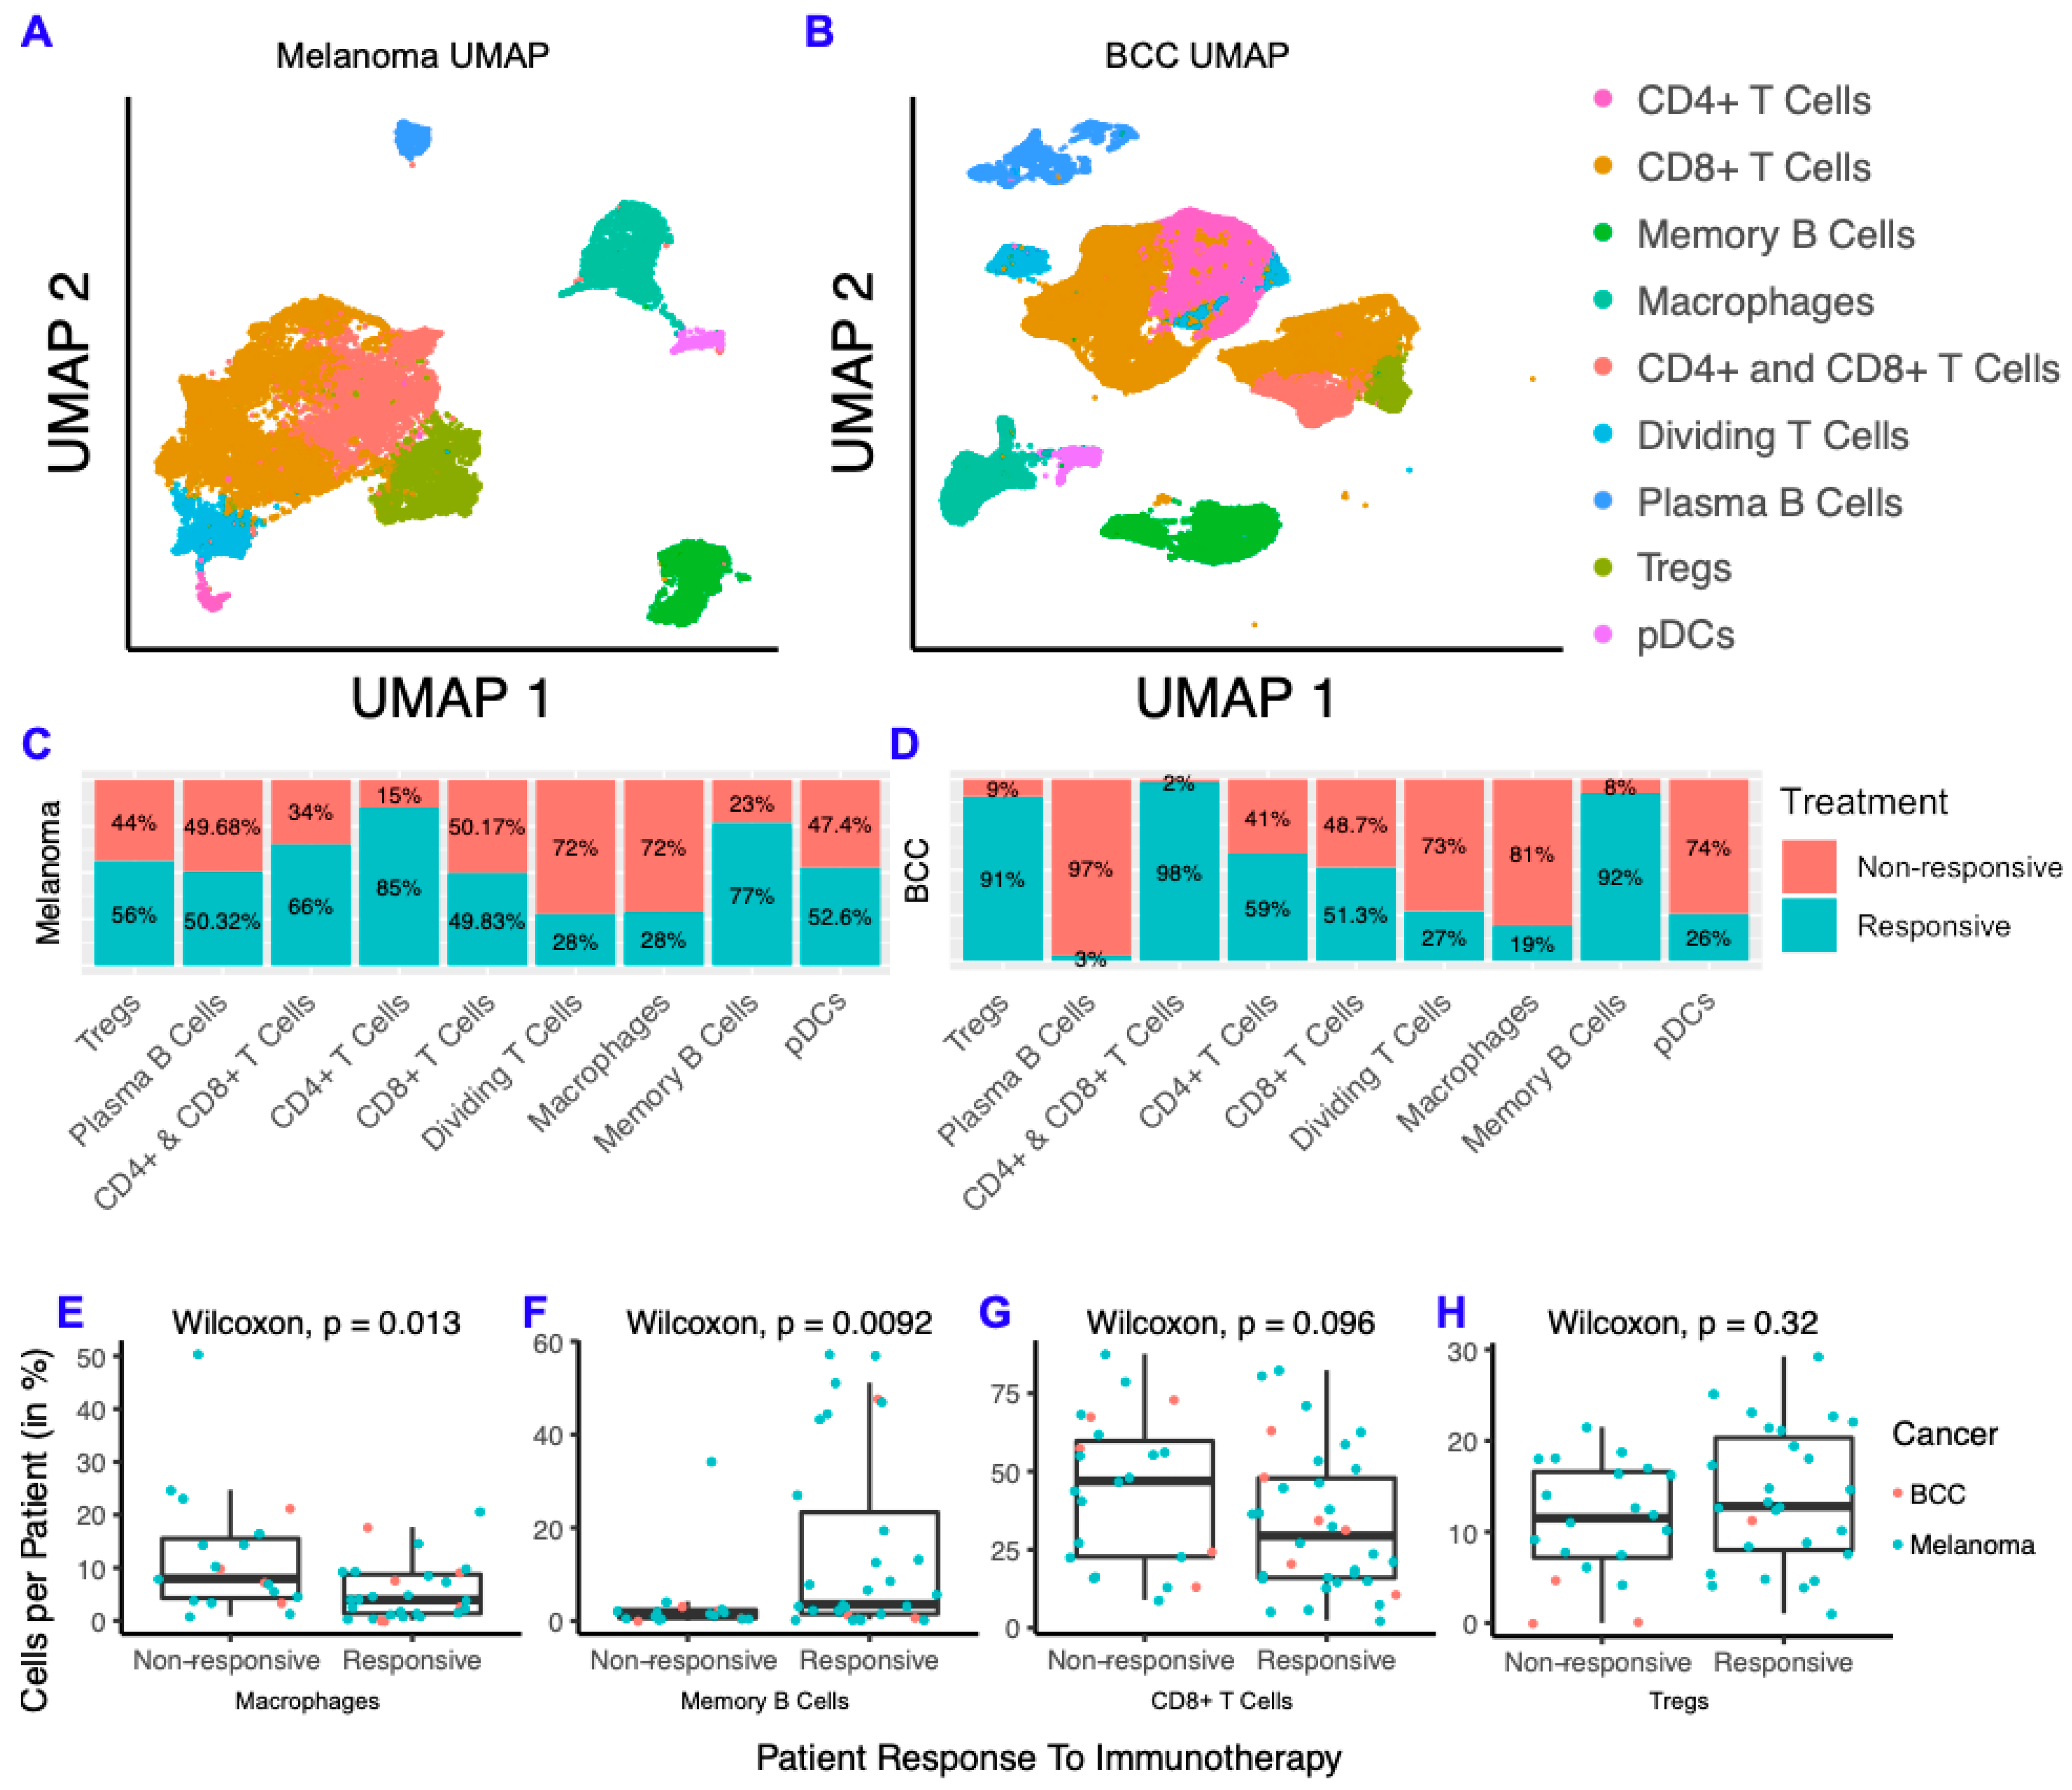
Simple Summary
Abstract
1. Introduction
2. Results
2.1. BCC and Melanoma Exhibit Similar Responses to Checkpoint Immunotherapy
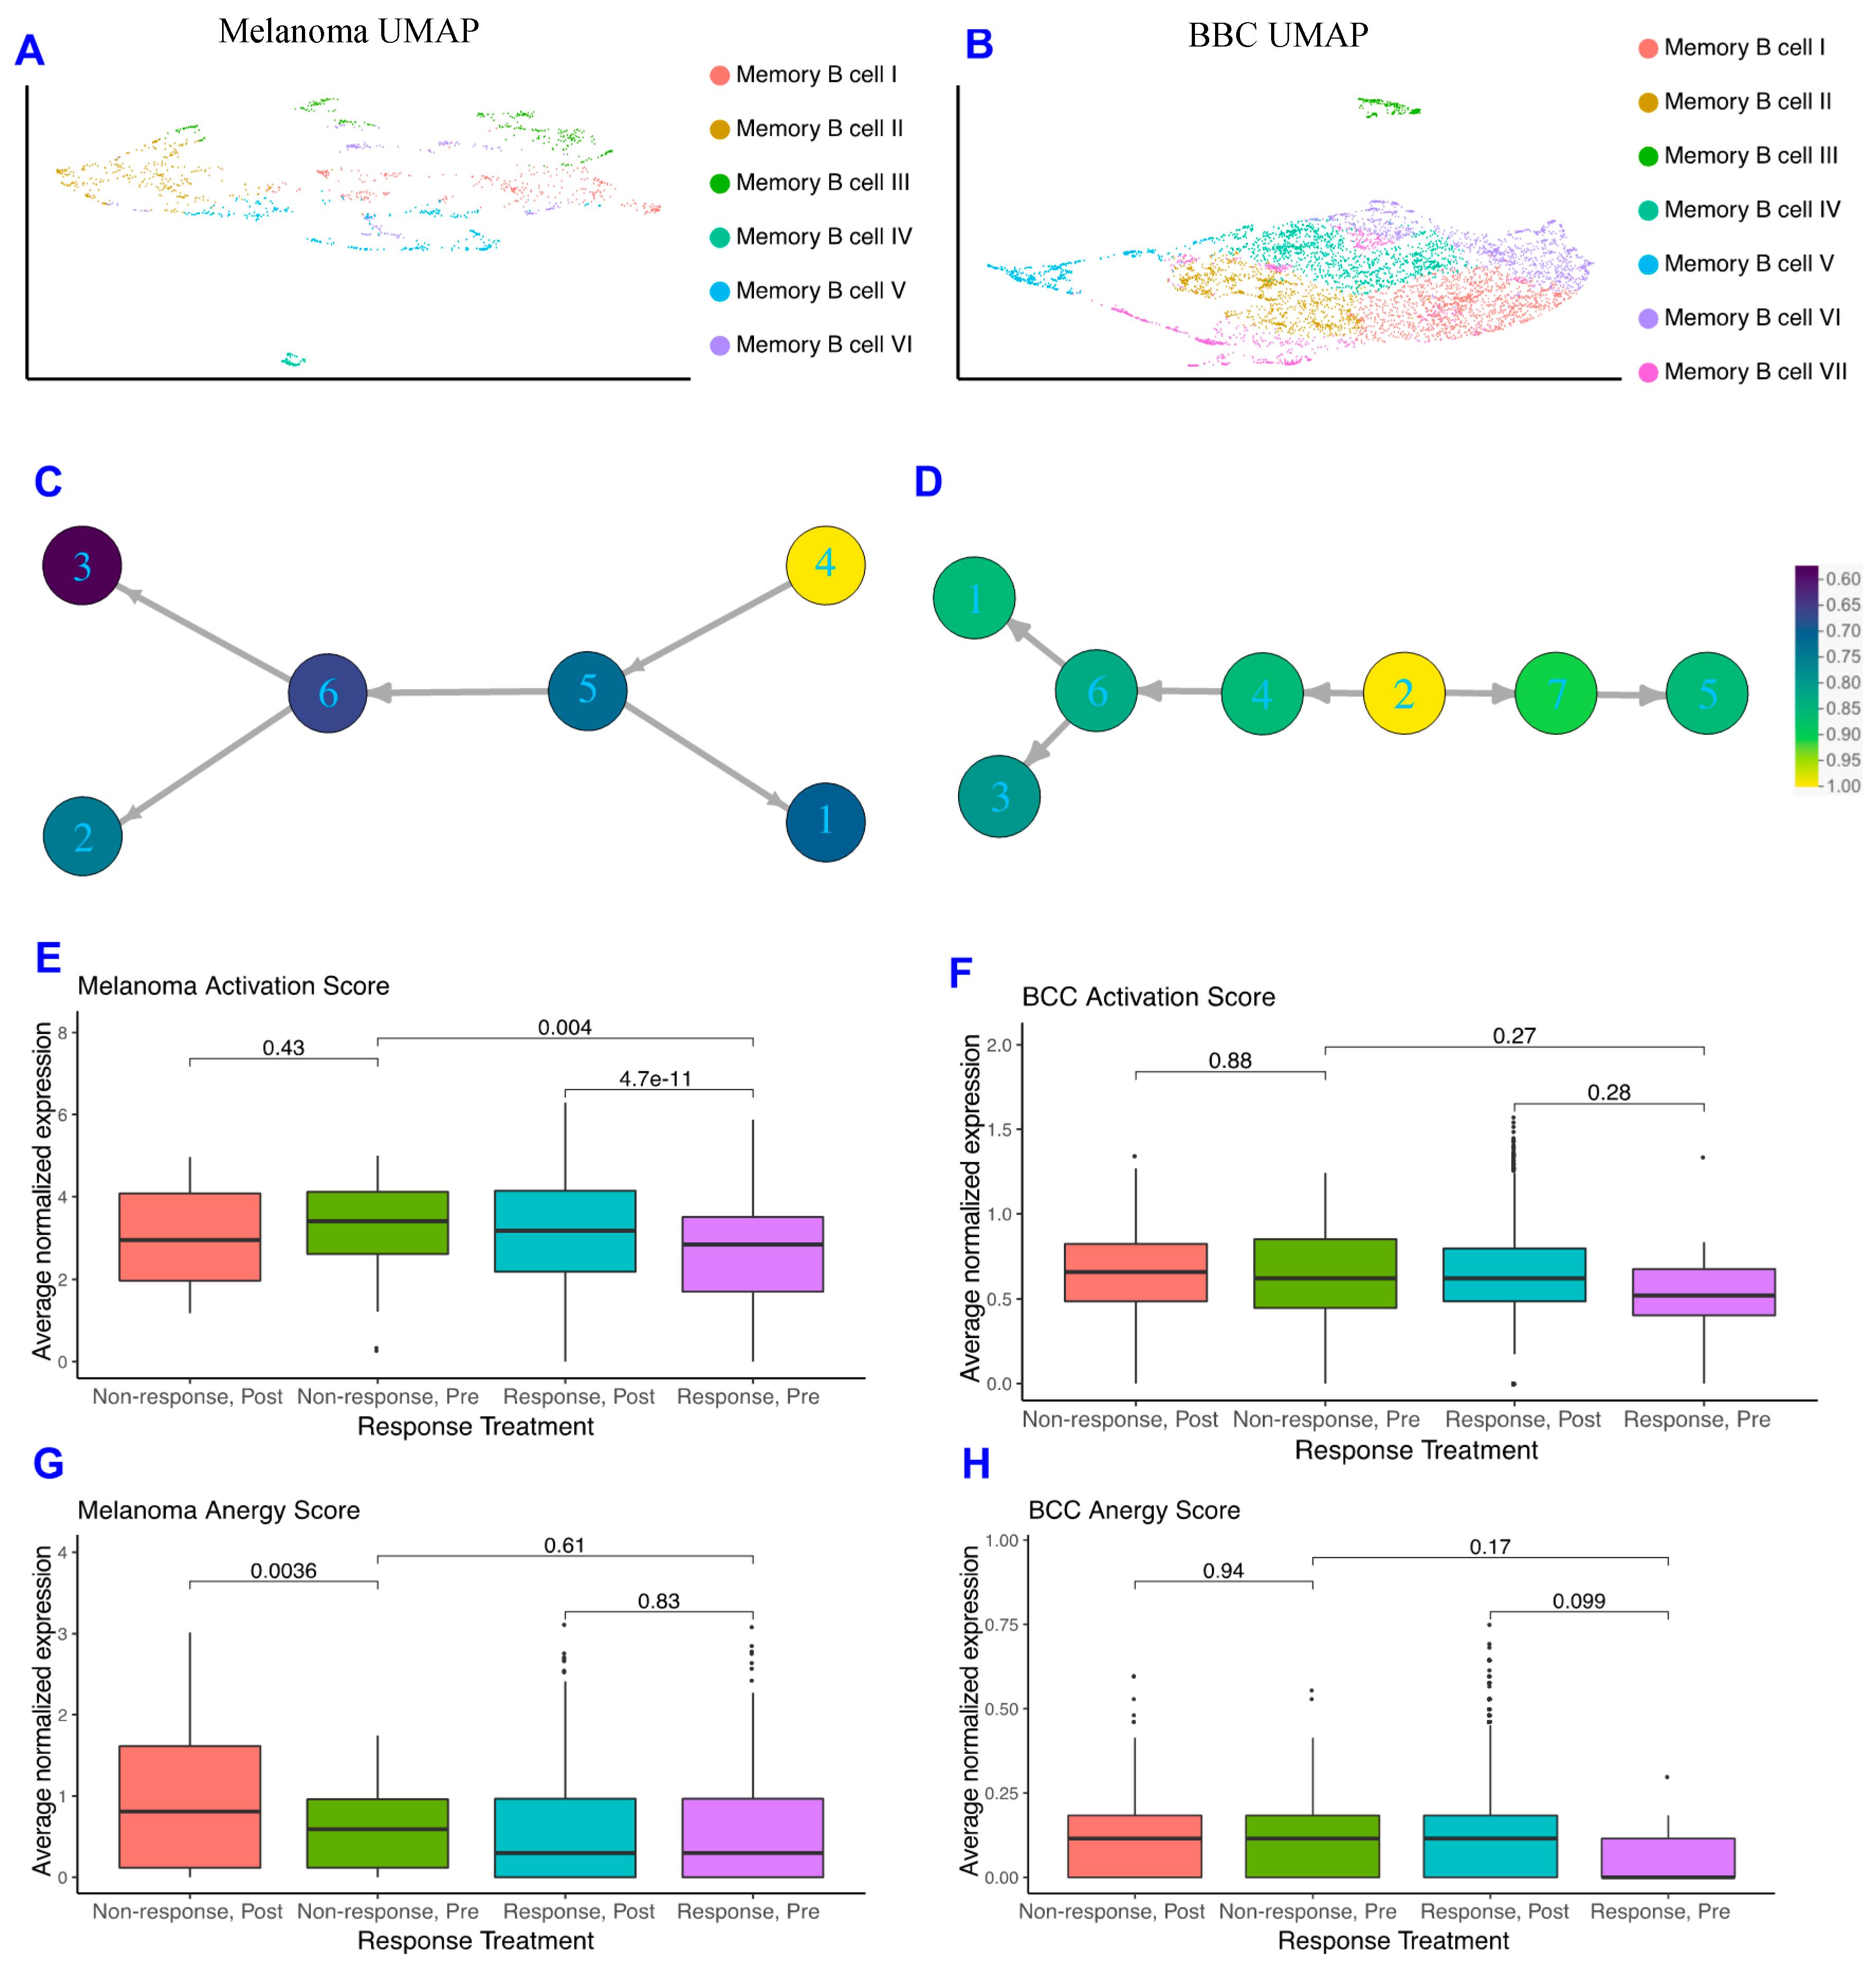
2.2. Memory B Cells Are More Active in Post-Treatment Responders and Anergic in Post-Treatment Non-Responders
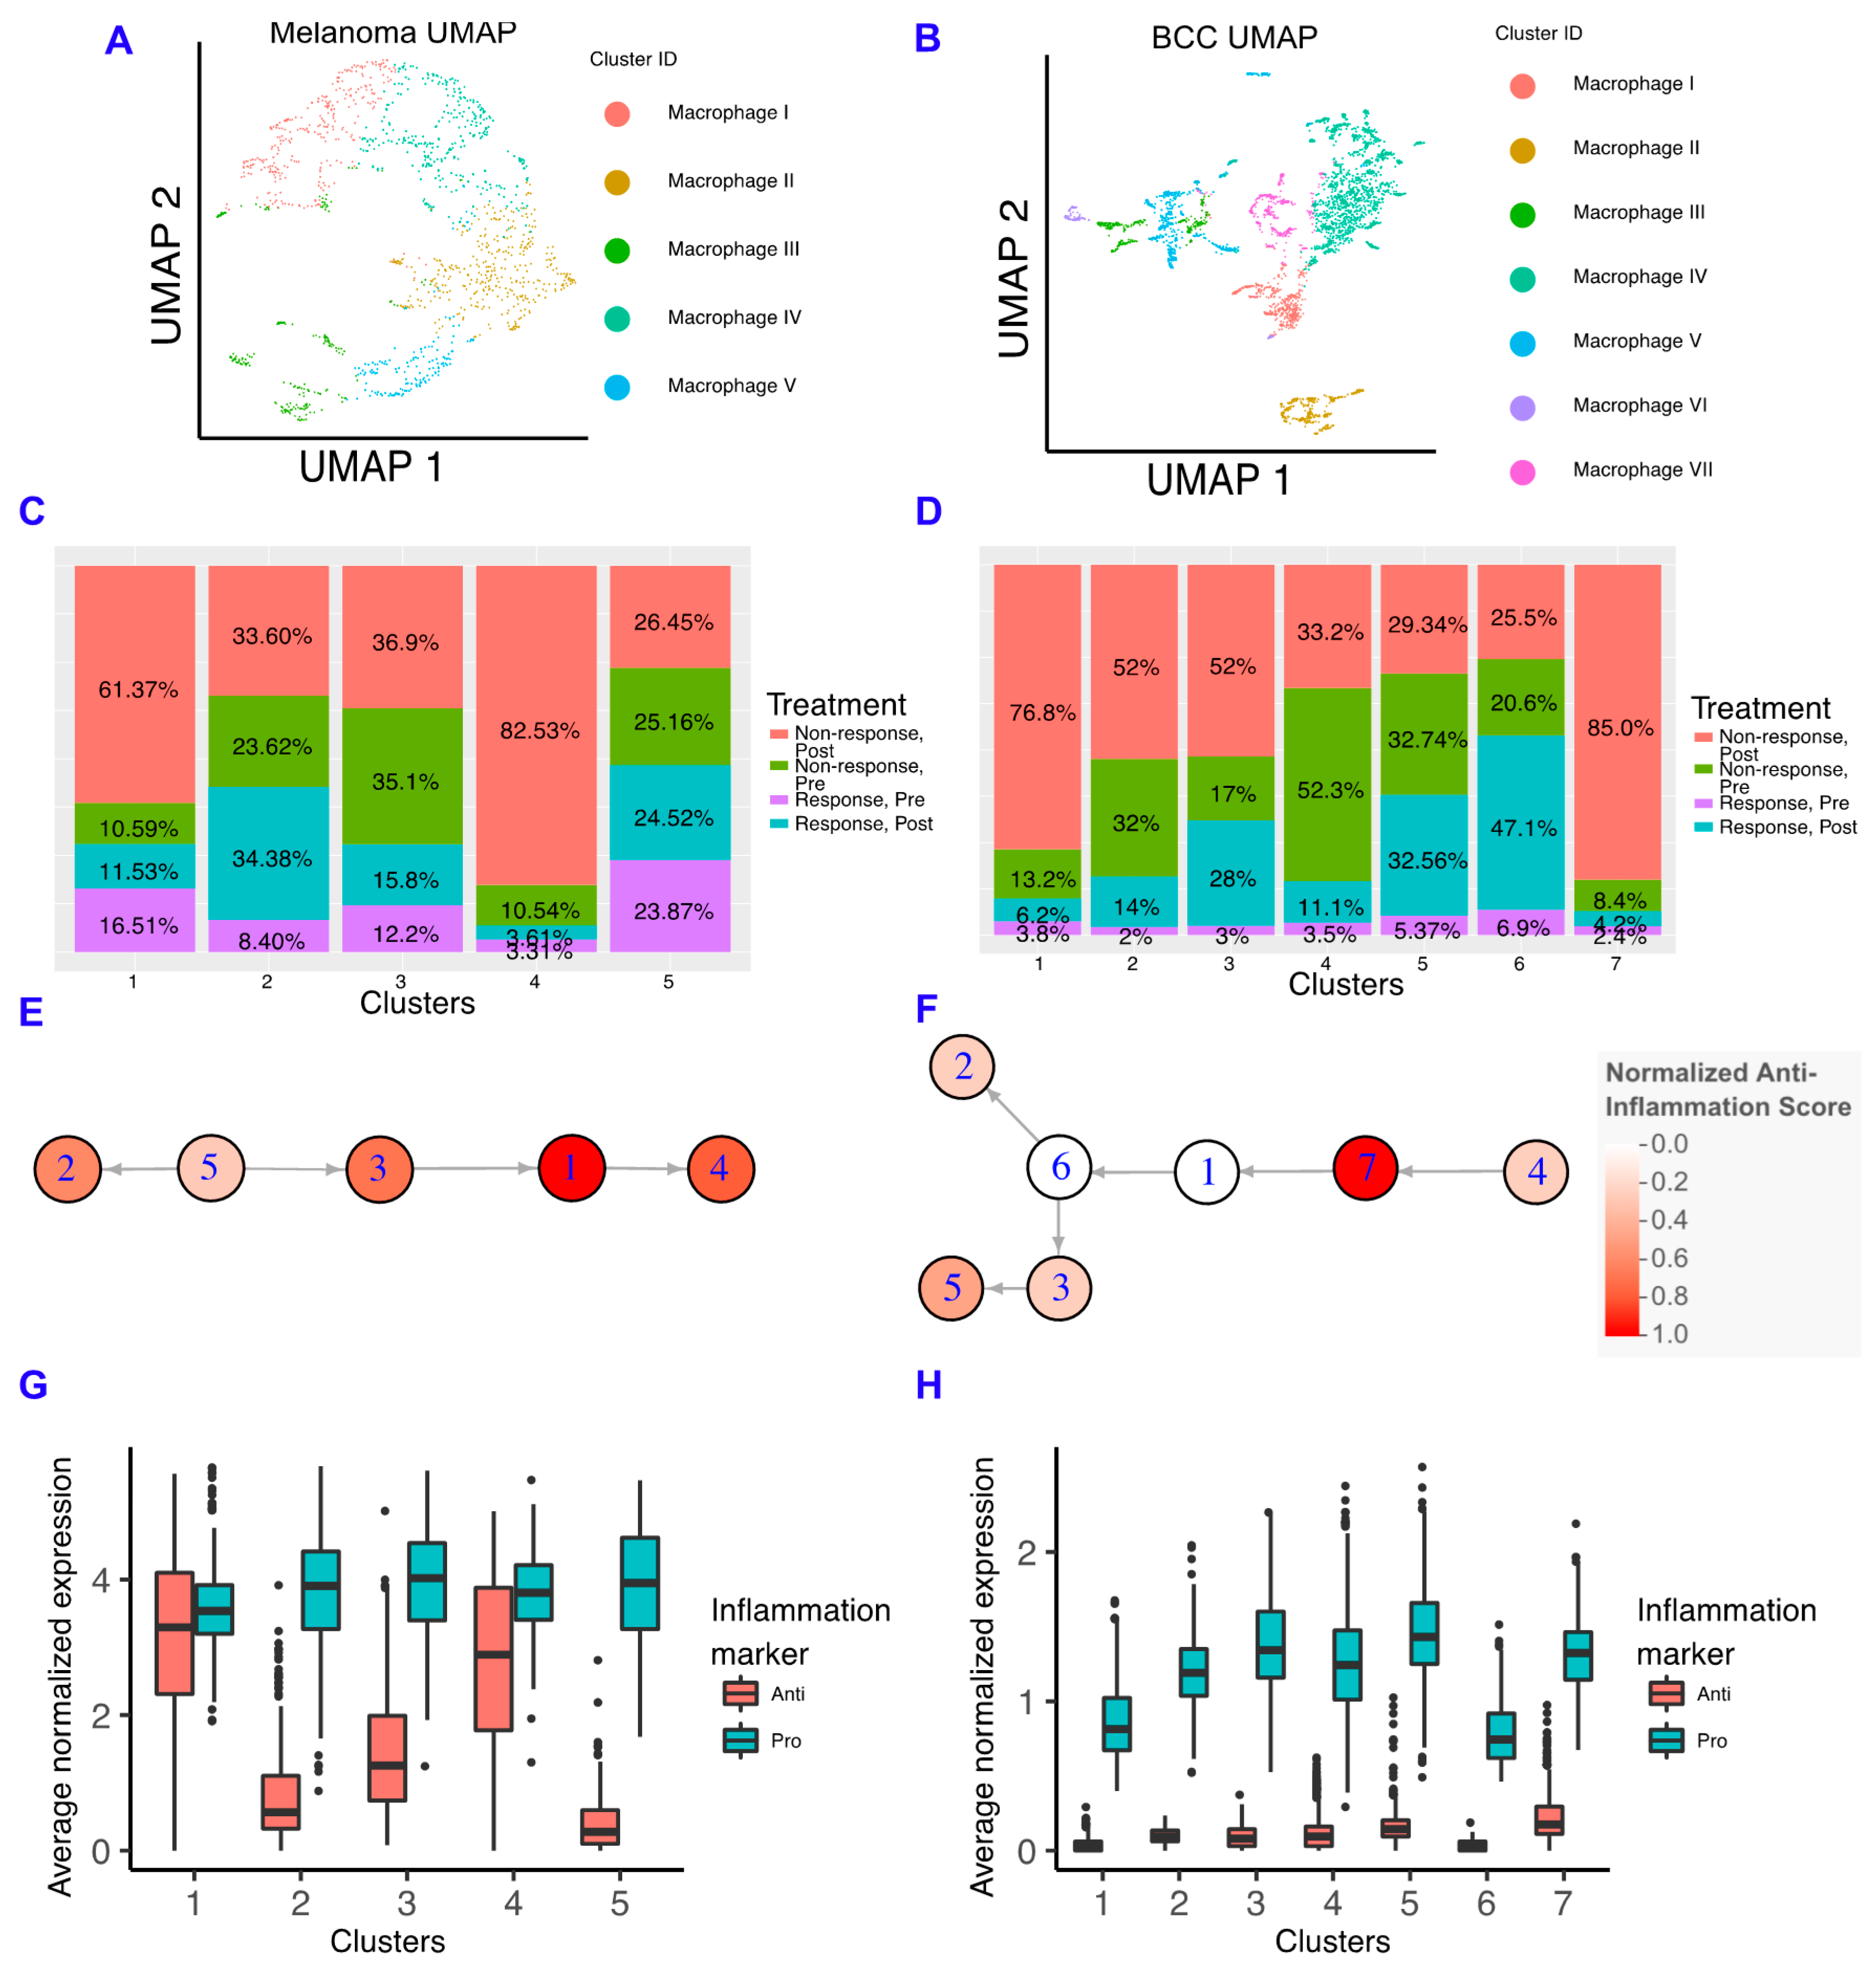
2.3. Macrophages in BCC Have a Pro-inflammatory Genotype, Regardless of Responder Status
2.4. Anti-Inflammatory Signaling Is Reduced in Melanoma Responders and Increased in BCC Responders
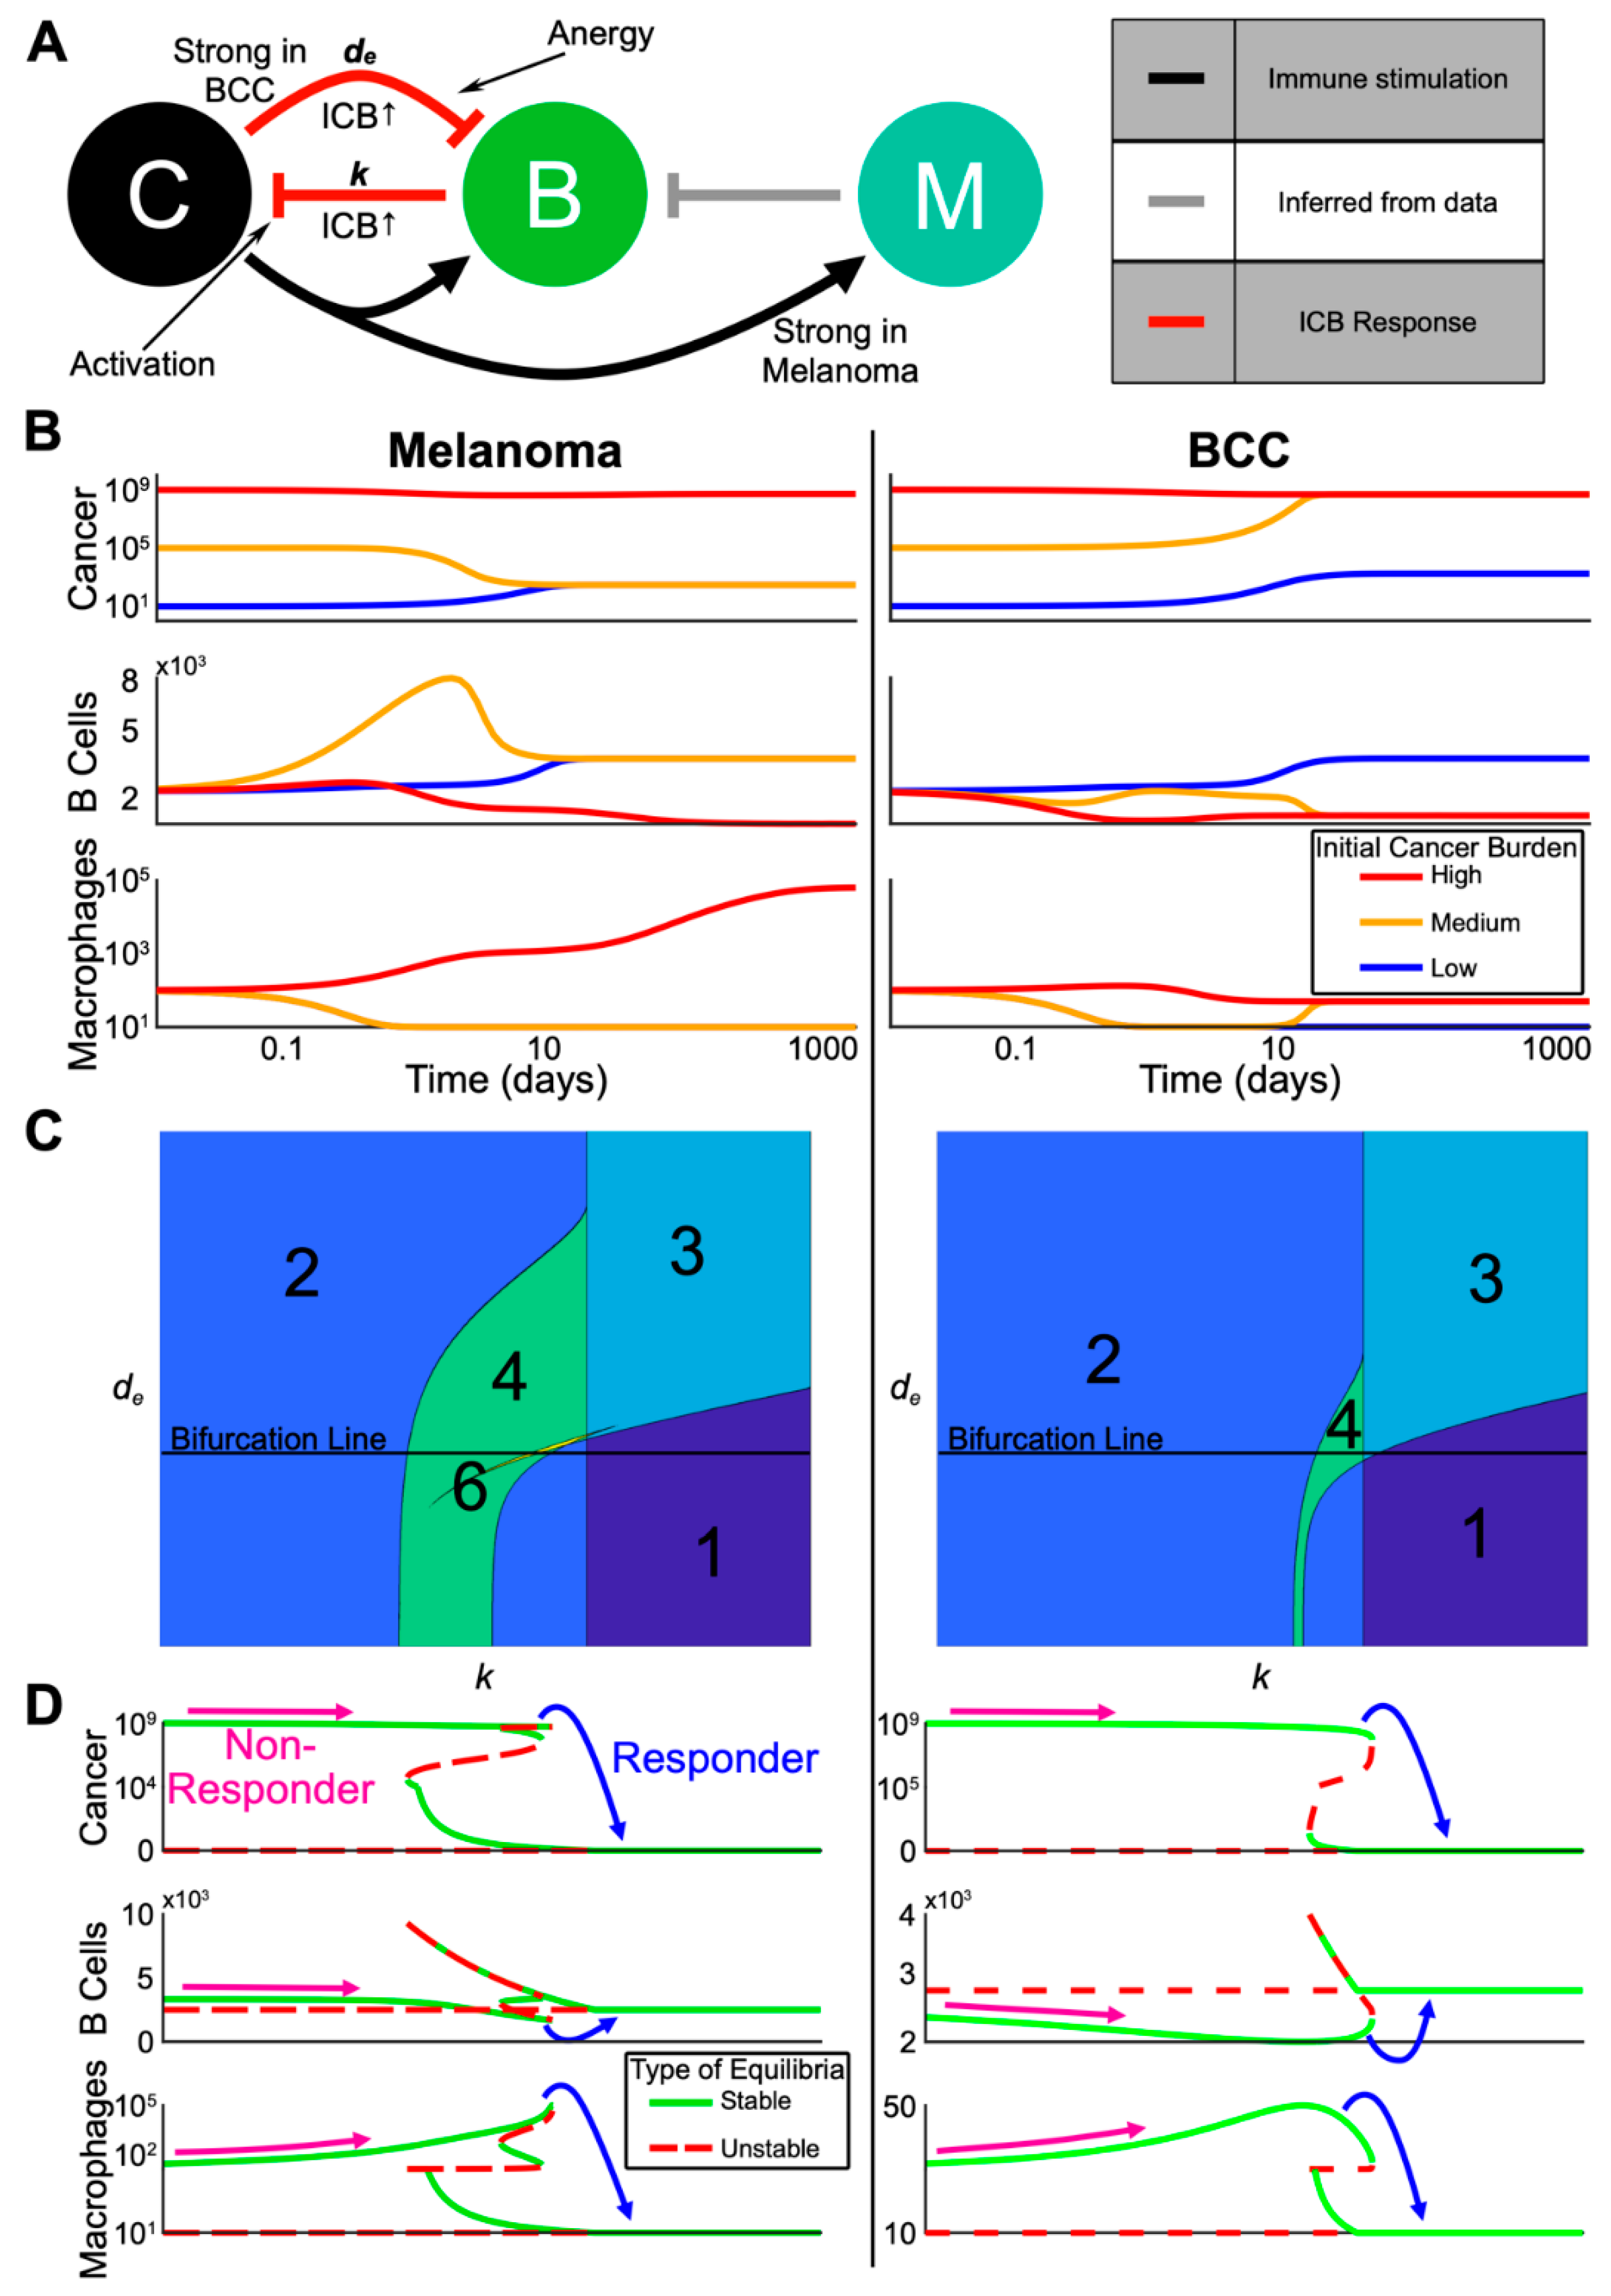
2.5. A Dynamical Model on Interactions Among Memory B Cells, Macrophages and Skin Tumors
2.6. The Model Predicts the Most Likely Immune Cell Composition for Responders and Shows BCC Is Less Likely to Respond to Treatment
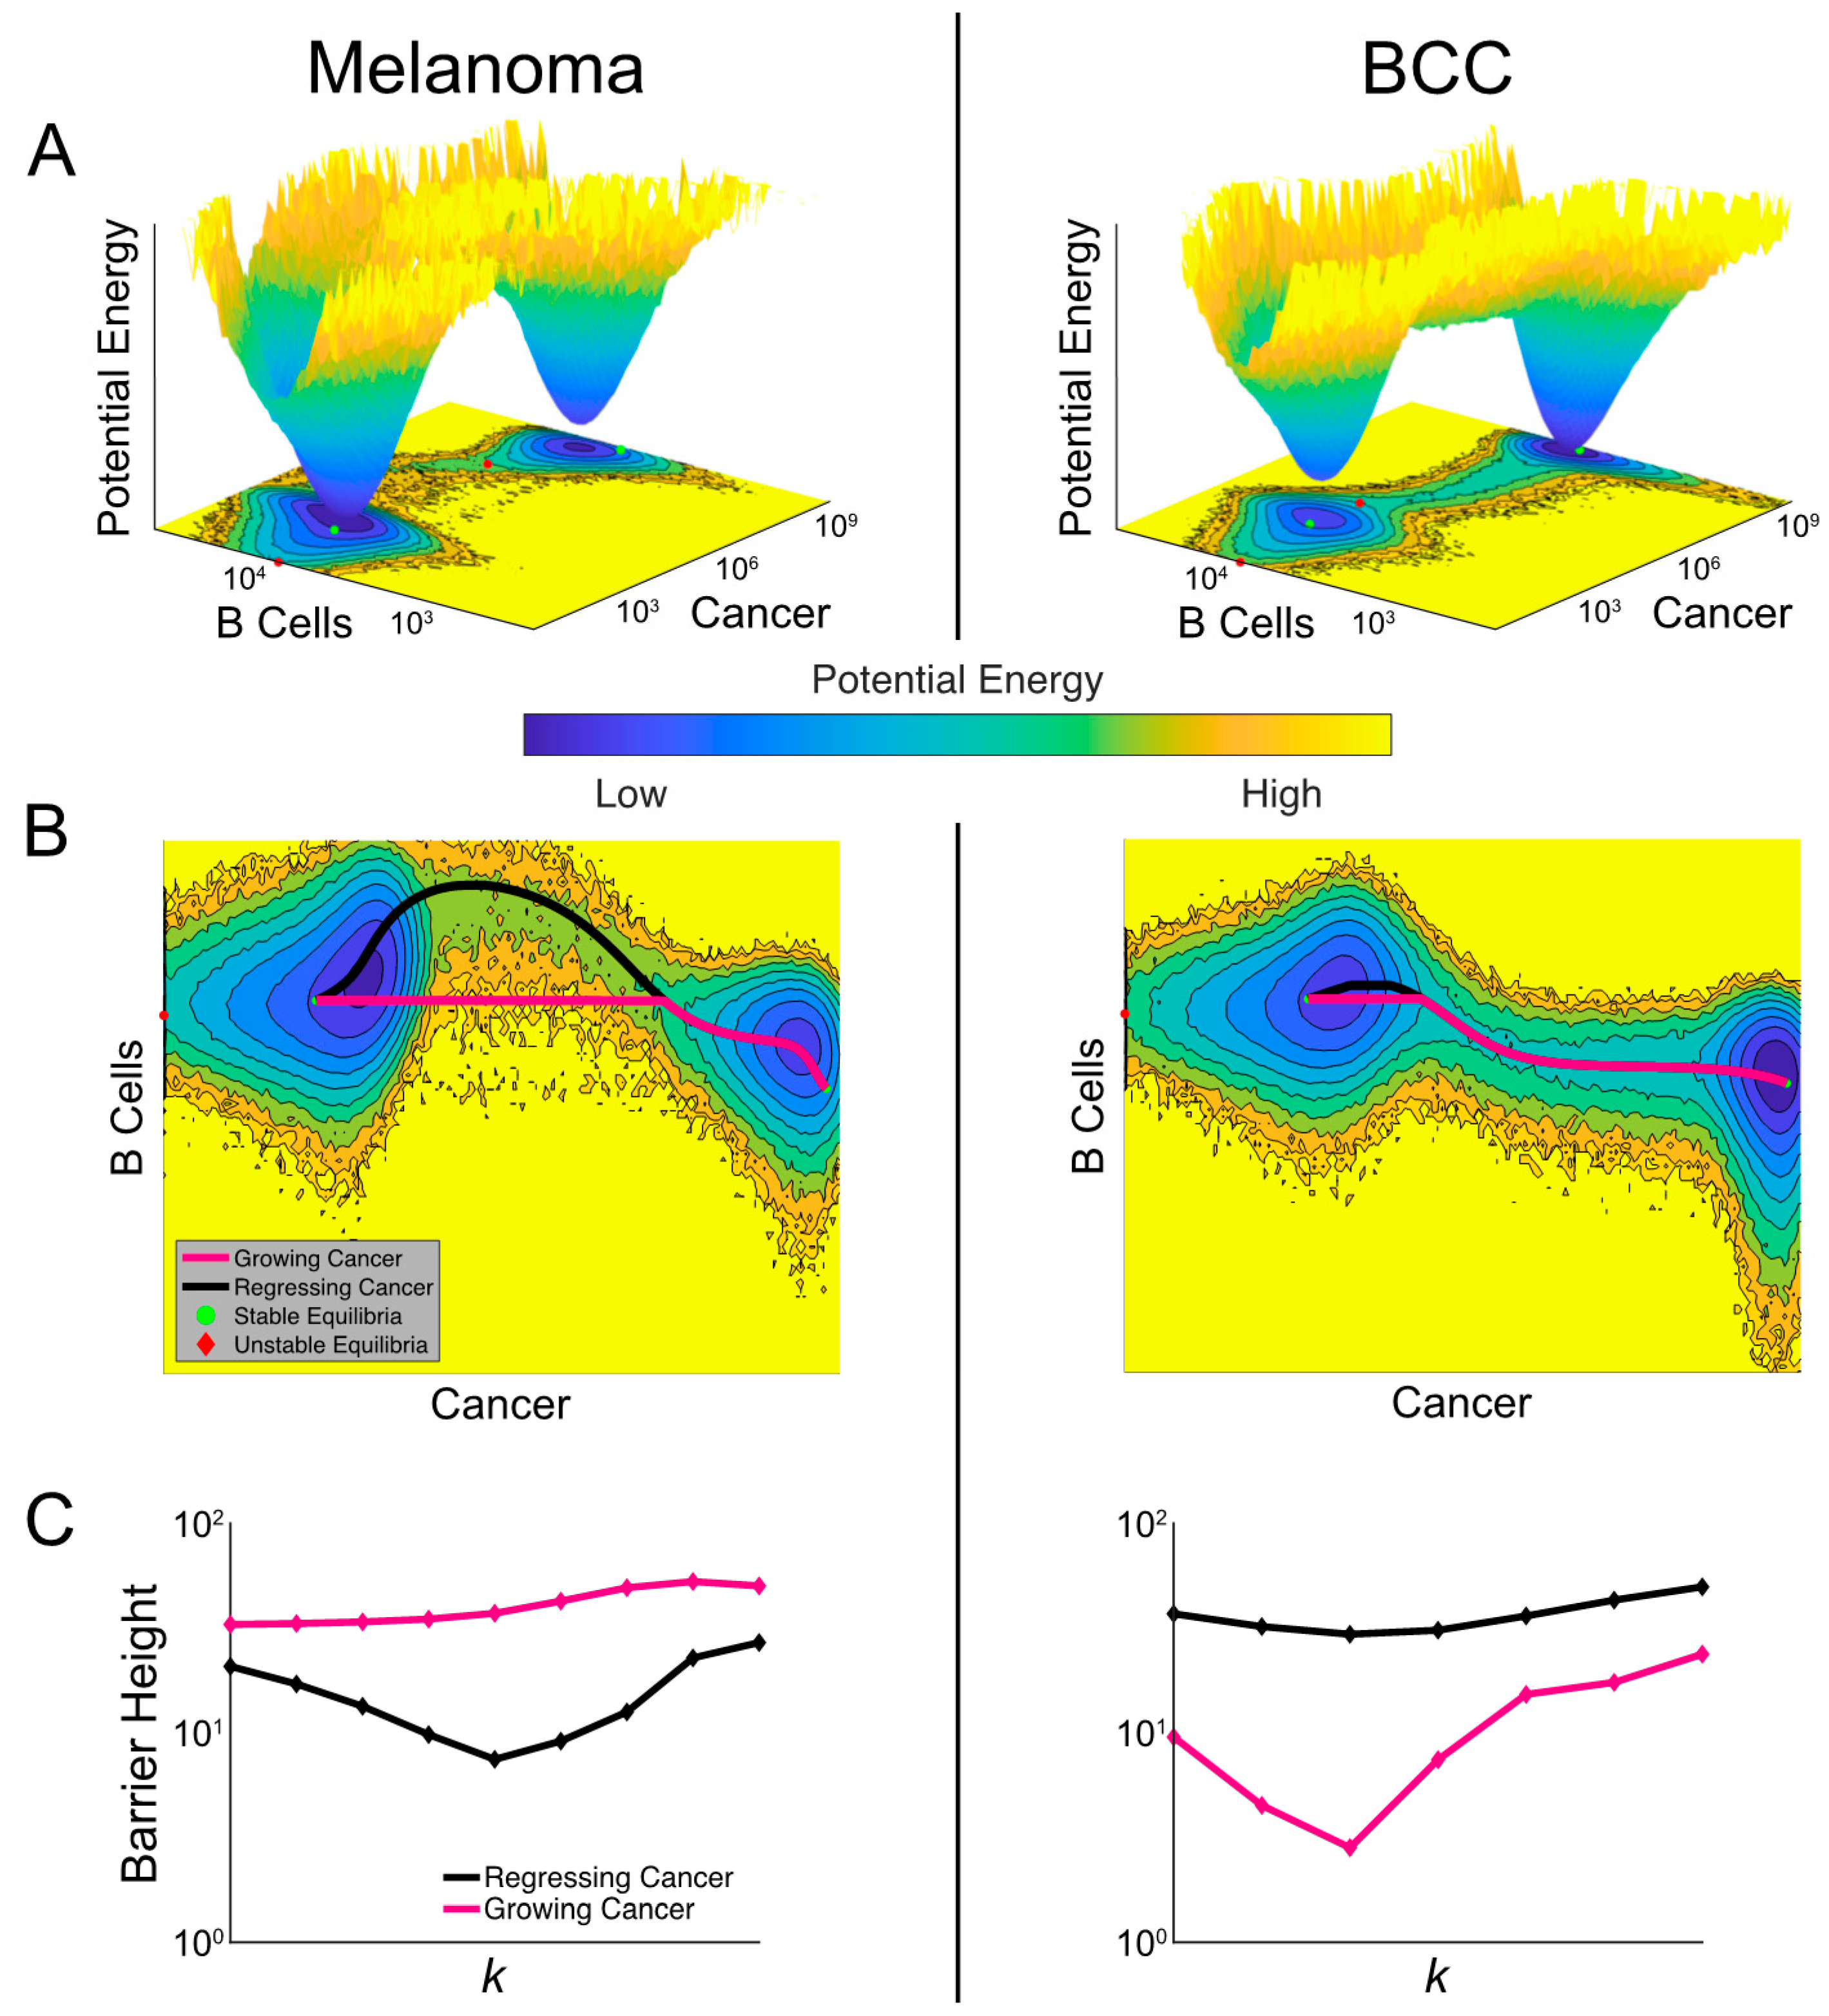
2.7. Noise-Induced Cancer Progression and Regression Potentially Account for Therapy-Resistance in BCC
3. Discussion
4. Materials and Methods
4.1. Clustering
4.2. Lineage Analysis and Cell–Cell Signaling Inference
4.3. Heatmaps, Dotplot, Barcharts and Box-and-Whisker Plots
4.4. Analysis of Immune System in Primary and Metastatic Melanoma
4.5. The Three-Component Dynamical Model
4.6. Cancer-State Landscape and Transition Paths
4.7. Code and Data Availability
5. Conclusions
Supplementary Materials
Author Contributions
Funding
Acknowledgments
Conflicts of Interest
References
- Ribas, A.; Wolchok, J.D. Cancer immunotherapy using checkpoint blockade. Science 2018, 359, 1350–1355. [Google Scholar] [CrossRef] [PubMed]
- Topalian, S.L.; Drake, C.G.; Pardoll, D.M. Immune checkpoint blockade: A common denominator approach to cancer therapy. Cancer Cell 2015, 27, 450–461. [Google Scholar] [CrossRef] [PubMed]
- Sharma, P.; Hu-Lieskovan, S.; Wargo, J.A.; Ribas, A. Primary, Adaptive, and Acquired Resistance to Cancer Immunotherapy. Cell 2017, 168, 707–723. [Google Scholar] [CrossRef]
- Linardou, H.; Gogas, H. Toxicity management of immunotherapy for patients with metastatic melanoma. Ann. Transl. Med. 2016, 4, 272. [Google Scholar] [CrossRef] [PubMed]
- Liu, Y.; Cheng, Y.; Xu, Y.; Wang, Z.; Du, X.; Li, C.; Peng, J.; Gao, L.; Liang, X.; Ma, C. Increased expression of programmed cell death protein 1 on NK cells inhibits NK-cell-mediated anti-tumor function and indicates poor prognosis in digestive cancers. Oncogene 2017, 36, 6143–6153. [Google Scholar] [CrossRef] [PubMed]
- Postow, M.A.; Callahan, M.K.; Wolchok, J.D. Immune checkpoint blockade in cancer therapy. J. Clin. Oncol. 2015, 33, 1974–1982. [Google Scholar] [CrossRef] [PubMed]
- Sharpe, A.H. Introduction to checkpoint inhibitors and cancer immunotherapy. Immunol. Rev. 2017, 276, 5–8. [Google Scholar] [CrossRef]
- Yost, K.E.; Satpathy, A.T.; Wells, D.K.; Qi, Y.; Wang, C.; Kageyama, R.; McNamara, K.L.; Granja, J.M.; Sarin, K.Y.; Brown, R.A.; et al. Clonal replacement of tumor-specific T cells following PD-1 blockade. Nat. Med. 2019, 25, 1251–1259. [Google Scholar] [CrossRef]
- Sade-Feldman, M.; Yizhak, K.; Bjorgaard, S.L.; Ray, J.P.; de Boer, C.G.; Jenkins, R.W.; Lieb, D.J.; Chen, J.H.; Frederick, D.T.; Barzily-Rokni, M.; et al. Defining T Cell States Associated with Response to Checkpoint Immunotherapy in Melanoma. Cell 2018, 175, 998–1013.e20. [Google Scholar] [CrossRef]
- Helmink, B.A.; Reddy, S.M.; Gao, J.; Zhang, S.; Basar, R.; Thakur, R.; Yizhak, K.; Sade-Feldman, M.; Blando, J.; Han, G.; et al. B cells and tertiary lymphoid structures promote immunotherapy response. Nature 2020, 577, 549–555. [Google Scholar] [CrossRef]
- Brahmer, J.R.; Drake, C.G.; Wollner, I.; Powderly, J.D.; Picus, J.; Sharfman, W.H.; Stankevich, E.; Pons, A.; Salay, T.M.; McMiller, T.L.; et al. Phase I study of single-agent anti-programmed death-1 (MDX-1106) in refractory solid tumors: Safety, clinical activity, pharmacodynamics, and immunologic correlates. J. Clin. Oncol. 2010, 28, 3167–3175. [Google Scholar] [CrossRef] [PubMed]
- Petitprez, F.; de Reyniès, A.; Keung, E.Z.; Chen, T.W.W.; Sun, C.M.; Calderaro, J.; Jeng, Y.M.; Hsiao, L.P.; Lacroix, L.; Bougoüin, A.; et al. B cells are associated with survival and immunotherapy response in sarcoma. Nature 2020, 577, 556–560. [Google Scholar] [CrossRef] [PubMed]
- Damsky, W.; Jilaveanu, L.; Turner, N.; Perry, C.; Zito, C.; Tomayko, M.; Leventhal, J.; Herold, K.; Meffre, E.; Bosenberg, M.; et al. B cell depletion or absence does not impede anti-tumor activity of PD-1 inhibitors. J. Immunother. Cancer 2019, 7, 1–7. [Google Scholar] [CrossRef] [PubMed]
- Palucka, A.K.; Coussens, L.M. The Basis of Oncoimmunology. Cell 2016, 164, 1233–1247. [Google Scholar] [CrossRef] [PubMed]
- Ruffell, B.; Coussens, L.M. Macrophages and therapeutic resistance in cancer. Cancer Cell 2015, 27, 462–472. [Google Scholar] [CrossRef]
- Zhu, Y.; Knolhoff, B.L.; Meyer, M.A.; Nywening, T.M.; West, B.L.; Luo, J.; Wang-Gillam, A.; Goedegebuure, S.P.; Linehan, D.C.; De Nardo, D.G. CSF1/CSF1R blockade reprograms tumor-infiltrating macrophages and improves response to T-cell checkpoint immunotherapy in pancreatic cancer models. Cancer Res. 2014, 74, 5057–5069. [Google Scholar] [CrossRef]
- Guerrero-Juarez, C.F.; Dedhia, P.H.; Jin, S.; Ruiz-Vega, R.; Ma, D.; Liu, Y.; Yamaga, K.; Shestova, O.; Gay, D.L.; Yang, Z.; et al. Single-cell analysis reveals fibroblast heterogeneity and myeloid-derived adipocyte progenitors in murine skin wounds. Nat. Commun. 2019, 10, 650. [Google Scholar] [CrossRef]
- Tang, F.; Barbacioru, C.; Wang, Y.; Nordman, E.; Lee, C.; Xu, N.; Wang, X.; Bodeau, J.; Tuch, B.B.; Siddiqui, A.; et al. mRNA-Seq whole-transcriptome analysis of a single cell. Nat. Methods 2009, 6, 377–382. [Google Scholar] [CrossRef]
- Trapnell, C.; Cacchiarelli, D.; Grimsby, J.; Pokharel, P.; Li, S.; Morse, M.; Lennon, N.J.; Livak, K.J.; Mikkelsen, T.S.; Rinn, J.L. The dynamics and regulators of cell fate decisions are revealed by pseudotemporal ordering of single cells. Nat. Biotechnol. 2014, 32, 381–386. [Google Scholar] [CrossRef]
- Shaffer, S.M.; Dunagin, M.C.; Torborg, S.R.; Torre, E.A.; Emert, B.; Krepler, C.; Beqiri, M.; Sproesser, K.; Brafford, P.A.; Xiao, M.; et al. Rare cell variability and drug-induced reprogramming as a mode of cancer drug resistance. Nature 2017, 546, 431–435. [Google Scholar] [CrossRef]
- Hwang, B.; Lee, J.H.; Bang, D. Single-cell RNA sequencing technologies and bioinformatics pipelines. Exp. Mol. Med. 2018, 50, 1–14. [Google Scholar] [CrossRef]
- Potter, S.S. Single-cell RNA sequencing for the study of development, physiology and disease. Nat. Rev. Nephrol. 2018, 14, 479–492. [Google Scholar] [CrossRef] [PubMed]
- Huang, S.; Ernberg, I.; Kauffman, S. Cancer attractors: A systems view of tumors from a gene network dynamics and developmental perspective. In Seminars in Cell & Developmental Biology; Academic Press: Cambridge, MA, USA, 2009. [Google Scholar]
- De Pillis, L.G.; Radunskaya, A.E. Modeling tumor–immune dynamics. In Mathematical Models of Tumor-Immune System Dynamics; Springer: New York, NY, USA, 2014. [Google Scholar]
- Huang, S.; Kauffman, S. How to escape the cancer attractor: Rationale and limitations of multi-target drugs. In Seminars in Cancer Biology; Academic Press: Cambridge, MA, USA, 2013. [Google Scholar]
- Mahlbacher, G.E.; Reihmer, K.C.; Frieboes, H.B. Mathematical modeling of tumor-immune cell interactions. J. Theor. Biol. 2019, 469, 47–60. [Google Scholar] [CrossRef] [PubMed]
- Raskin, L.; Shah, S.; Braunlin, M.; Buchanan, J.; Cohan, D. Treatment patterns of melanoma by BRAF mutation status in the US in 2011–2017: A retrospective cohort study. Ann. Oncol. 2018, 29, viii456–viii457. [Google Scholar] [CrossRef]
- Bhatia, P.; Friedlander, P.; Zakaria, E.A.; Kandil, E. Impact of BRAF mutation status in the prognosis of cutaneous melanoma: An area of ongoing research. Ann. Transl. Med. 2015, 3, 24. [Google Scholar] [PubMed]
- Wang, S.; Karikomi, M.; Maclean, A.L.; Nie, Q. Cell lineage and communication network inference via optimization for single-cell transcriptomics. Nucleic Acids Res. 2019, 47, e66. [Google Scholar] [CrossRef] [PubMed]
- Gu, Z.; Gu, L.; Eils, R.; Schlesner, M.; Brors, B. circlize implements and enhances circular visualization in R. Bioinformatics 2014, 30, 2811–2812. [Google Scholar] [CrossRef] [PubMed]
- Ashburner, M.; Ball, C.A.; Blake, J.A.; Botstein, D.; Butler, H.; Cherry, J.M.; Davis, A.P.; Dolinski, K.; Dwight, S.S.; Eppig, J.T.; et al. Gene ontology: Tool for the unification of biology. Nat. Genet. 2000, 25, 25–29. [Google Scholar] [CrossRef] [PubMed]
- Carbon, S.; Douglass, E.; Dunn, N.; Good, B.; Harris, N.L.; Lewis, S.E.; Mungall, C.J.; Basu, S.; Chisholm, R.L.; Dodson, R.J.; et al. The Gene Ontology Resource: 20 years and still GOing strong. Nucleic Acids Res. 2019, 47, D330–D338. [Google Scholar] [CrossRef]
- Jayasingam, S.D.; Citartan, M.; Thang, T.H.; Mat Zin, A.A.; Ang, K.C.; Ch’ng, E.S. Evaluating the Polarization of Tumor-Associated Macrophages Into M1 and M2 Phenotypes in Human Cancer Tissue: Technicalities and Challenges in Routine Clinical Practice. Front. Oncol. 2020, 9, 1512. [Google Scholar] [CrossRef]
- Martinez, F.O.; Gordon, S. The M1 and M2 paradigm of macrophage activation: Time for reassessment. F1000Prime Rep. 2014, 6, 13. [Google Scholar] [CrossRef]
- Lin, J.D.; Nishi, H.; Poles, J.; Niu, X.; Mccauley, C.; Rahman, K.; Brown, E.J.; Yeung, S.T.; Vozhilla, N.; Weinstock, A.; et al. Single-cell analysis of fate-mapped macrophages reveals heterogeneity, including stem-like properties, during atherosclerosis progression and regression. JCI Insight 2019, 4. [Google Scholar] [CrossRef]
- Mosser, D.M.; Edwards, J.P. Exploring the full spectrum of macrophage activation. Nat. Rev. Immunol. 2008, 8, 958–969. [Google Scholar] [CrossRef] [PubMed]
- Jerby-Arnon, L.; Shah, P.; Cuoco, M.S.; Rodman, C.; Su, M.J.; Melms, J.C.; Leeson, R.; Kanodia, A.; Mei, S.; Lin, J.R.; et al. A Cancer Cell Program Promotes T Cell Exclusion and Resistance to Checkpoint Blockade. Cell 2018, 175, 984–997.e24. [Google Scholar] [CrossRef] [PubMed]
- Smith, K.G.C.; Clatworthy, M.R. FcγRIIB in autoimmunity and infection: Evolutionary and therapeutic implications. Nat. Rev. Immunol. 2010, 10, 328–343. [Google Scholar] [CrossRef] [PubMed]
- Peng, B.; Ming, Y.; Yang, C. Regulatory B cells: The cutting edge of immune tolerance in kidney transplantation review-Article. Cell Death Dis. 2018, 9, 109. [Google Scholar] [CrossRef] [PubMed]
- Sarvaria, A.; Madrigal, J.A.; Saudemont, A. B cell regulation in cancer and anti-tumor immunity. Cell. Mol. Immunol. 2017, 14, 662–674. [Google Scholar] [CrossRef] [PubMed]
- Johnson, D.E.; O’Keefe, R.A.; Grandis, J.R. Targeting the IL-6/JAK/STAT3 signalling axis in cancer. Nat. Rev. Clin. Oncol. 2018, 15, 234. [Google Scholar] [CrossRef]
- Tsukamoto, H.; Fujieda, K.; Miyashita, A.; Fukushima, S.; Ikeda, T.; Kubo, Y.; Senju, S.; Ihn, H.; Nishimura, Y.; Oshiumi, H. Combined blockade of IL6 and PD-1/PD-L1 signaling abrogates mutual regulation of their immunosuppressive effects in the tumor microenvironment. Cancer Res. 2018, 78, 5011–5022. [Google Scholar] [CrossRef]
- Jiang, X.; Wang, M.; Cyrus, N.; Yanez, D.A.; Lacher, R.K.; Rhebergen, A.M.; Brokowski, C.; Galan, A.; Book, S.; Colegio, O.R. Human keratinocyte carcinomas have distinct differences in their tumor-associated macrophages. Heliyon 2019, 5, e02273. [Google Scholar] [CrossRef]
- Salmi, S.; Siiskonen, H.; Sironen, R.; Tyynelä-Korhonen, K.; Hirschovits-Gerz, B.; Valkonen, M.; Auvinen, P.; Pasonen-Seppänen, S. The number and localization of CD68+ and CD163+ macrophages in different stages of cutaneous melanoma. Melanoma Res. 2019, 29, 237–247. [Google Scholar] [CrossRef] [PubMed]
- Blank, C.U.; Haanen, J.B.; Ribas, A.; Schumacher, T.N. The “cancer immunogram”. Science 2016, 352, 658–660. [Google Scholar] [CrossRef]
- Kucerova, P.; Cervinkova, M. Spontaneous regression of tumour and the role of microbial infection—possibilities for cancer treatment. Anticancer Drugs 2016, 27, 269–277. [Google Scholar] [CrossRef] [PubMed]
- Sabbatino, F.; Marra, A.; Liguori, L.; Scognamiglio, G.; Fusciello, C.; Botti, G.; Ferrone, S.; Pepe, S. Resistance to anti-PD-1-based immunotherapy in basal cell carcinoma: A case report and review of the literature. J. Immunother. Cancer 2018, 6, 126. [Google Scholar] [CrossRef] [PubMed]
- Lipson, E.J.; Lilo, M.T.; Ogurtsova, A.; Esandrio, J.; Xu, H.; Brothers, P.; Schollenberger, M.; Sharfman, W.H.; Taube, J.M. Basal cell carcinoma: PD-L1/PD-1 checkpoint expression and tumor regression after PD-1 blockade. J. Immunother. Cancer 2017, 5, 1–5. [Google Scholar] [CrossRef] [PubMed]
- Li, C.; Wang, J. Quantifying Cell Fate Decisions for Differentiation and Reprogramming of a Human Stem Cell Network: Landscape and Biological Paths. PLoS Comput. Biol. 2013, 9, e1003165. [Google Scholar] [CrossRef] [PubMed]
- Freidlin, M.I.; Wentzell, A.D. Random Perturbations of Dynamical Systems; Springer: Berlin/Heidelberg, Germany, 2012; ISBN 9783642446870. [Google Scholar]
- Winkler, J.K.; Schneiderbauer, R.; Bender, C.; Sedlaczek, O.; Fröhling, S.; Penzel, R.; Enk, A.; Hassel, J.C. Anti-programmed cell death-1 therapy in nonmelanoma skin cancer. Br. J. Dermatol. 2017, 176, 498–502. [Google Scholar] [CrossRef]
- Ikeda, S.; Goodman, A.M.; Cohen, P.R.; Jensen, T.J.; Ellison, C.K.; Frampton, G.; Miller, V.; Patel, S.P.; Kurzrock, R. Metastatic basal cell carcinoma with amplification of PD-L1: Exceptional response to anti-PD1 therapy. NPJ Genomic Med. 2016, 1, 16037. [Google Scholar] [CrossRef]
- Falchook, G.S.; Leidner, R.; Stankevich, E.; Piening, B.; Bifulco, C.; Lowy, I.; Fury, M.G. Responses of metastatic basal cell and cutaneous squamous cell carcinomas to anti-PD1 monoclonal antibody REGN2810. J. Immunother. Cancer 2016, 4, 70. [Google Scholar] [CrossRef]
- Terry, S.; Savagner, P.; Ortiz-Cuaran, S.; Mahjoubi, L.; Saintigny, P.; Thiery, J.P.; Chouaib, S. New insights into the role of EMT in tumor immune escape. Mol. Oncol. 2017, 11, 824–846. [Google Scholar] [CrossRef]
- Proverb, G. B Cell Development, Activation and Effector Functions; Elsevier: Burlington, MA, USA, 2014; ISBN 9780123852458. [Google Scholar]
- Hafemeister, C.; Satija, R. Normalization and variance stabilization of single-cell RNA-seq data using regularized negative binomial regression. Genome Biol. 2019, 20, 1–15. [Google Scholar] [CrossRef] [PubMed]
- Stuart, T.; Butler, A.; Hoffman, P.; Hafemeister, C.; Papalexi, E.; Mauck, W.M.; Hao, Y.; Stoeckius, M.; Smibert, P.; Satija, R. Comprehensive Integration of Single-Cell Data. Cell 2019, 177, 1888–1902.e21. [Google Scholar] [CrossRef] [PubMed]
- Kuleshov, M.V.; Jones, M.R.; Rouillard, A.D.; Fernandez, N.F.; Duan, Q.; Wang, Z.; Koplev, S.; Jenkins, S.L.; Jagodnik, K.M.; Lachmann, A.; et al. Enrichr: A comprehensive gene set enrichment analysis web server 2016 update. Nucleic Acids Res. 2016, 44, W90–W97. [Google Scholar] [CrossRef] [PubMed]
- Murdoch, C.; Muthana, M.; Coffelt, S.B.; Lewis, C.E. The role of myeloid cells in the promotion of tumour angiogenesis. Nat. Rev. Cancer 2008, 8, 618–631. [Google Scholar] [CrossRef] [PubMed]
- Zhou, P.; Li, T. Construction of the landscape for multi-stable systems: Potential landscape, quasi-potential, A-type integral and beyond. J. Chem. Phys. 2016, 144, 094109. [Google Scholar] [CrossRef] [PubMed]
- Wang, J.; Zhang, K.; Xu, L.; Wang, E. Quantifying the Waddington landscape and biological paths for development and differentiation. Proc. Natl. Acad. Sci. USA 2011, 108, 8257–8262. [Google Scholar] [CrossRef]
- Grafke, T.; Schäfer, T.; Vanden-Eijnden, E. Long term effects of small random perturbations on dynamical systems: Theoretical and computational tools. In Fields Institute Communications; Springer: New York, NY, USA, 2017. [Google Scholar]


© 2020 by the authors. Licensee MDPI, Basel, Switzerland. This article is an open access article distributed under the terms and conditions of the Creative Commons Attribution (CC BY) license (http://creativecommons.org/licenses/by/4.0/).
Share and Cite
Dollinger, E.; Bergman, D.; Zhou, P.; Atwood, S.X.; Nie, Q. Divergent Resistance Mechanisms to Immunotherapy Explain Responses in Different Skin Cancers. Cancers 2020, 12, 2946. https://doi.org/10.3390/cancers12102946
Dollinger E, Bergman D, Zhou P, Atwood SX, Nie Q. Divergent Resistance Mechanisms to Immunotherapy Explain Responses in Different Skin Cancers. Cancers. 2020; 12(10):2946. https://doi.org/10.3390/cancers12102946
Chicago/Turabian StyleDollinger, Emmanuel, Daniel Bergman, Peijie Zhou, Scott X. Atwood, and Qing Nie. 2020. "Divergent Resistance Mechanisms to Immunotherapy Explain Responses in Different Skin Cancers" Cancers 12, no. 10: 2946. https://doi.org/10.3390/cancers12102946
APA StyleDollinger, E., Bergman, D., Zhou, P., Atwood, S. X., & Nie, Q. (2020). Divergent Resistance Mechanisms to Immunotherapy Explain Responses in Different Skin Cancers. Cancers, 12(10), 2946. https://doi.org/10.3390/cancers12102946