Circulatory miRNA as a Biomarker for Therapy Response and Disease-Free Survival in Hepatocellular Carcinoma

 , and
, and 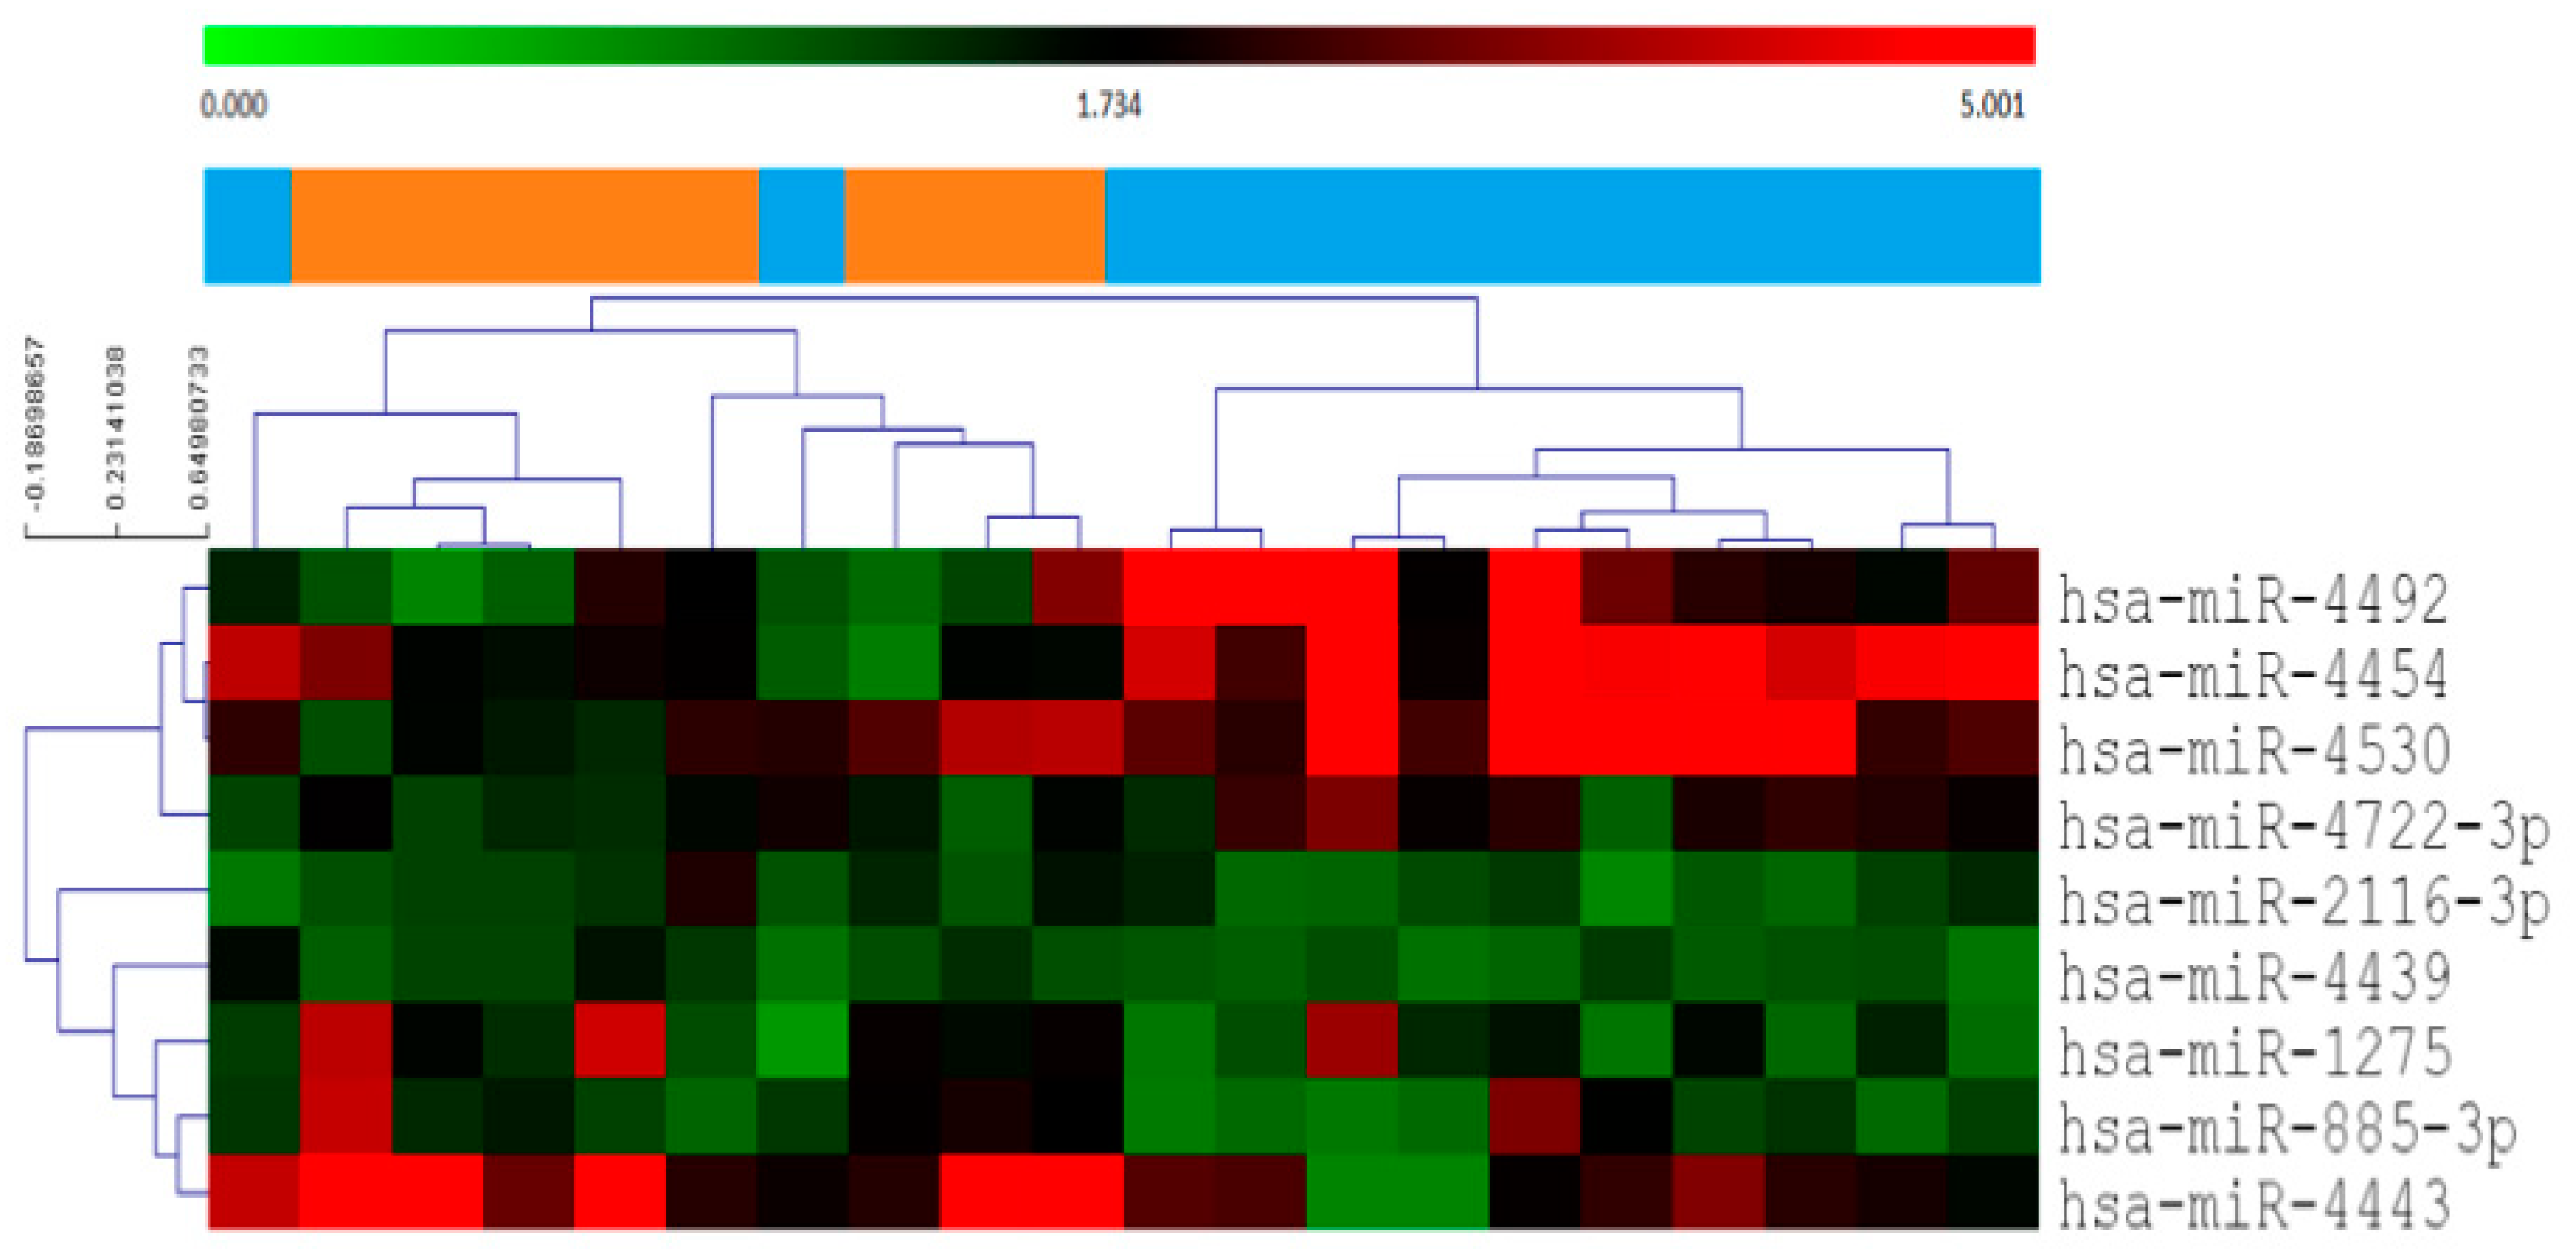
Abstract
Simple Summary
Abstract
1. Introduction
2. Results
2.1. Characteristics of the Study Population
2.2. Identification of Circulating miRNA Biomarkers Associated to Therapy Response and DSF
2.3. Predictive miRNA Biomarkers for Therapy Response
2.4. MiR-4443, miR-4454, and miR-4530 as Predictive miRNA Biomarkers for Therapy Response in Curative Therapies
2.5. Higher Levels of miR-4454 and miR-4530 Predict Longer Survival in HCC Patients
2.6. MiR-4454 and miR-4530 are Predictors for Longer DFS for Curative Treatments
2.7. MiR-4492 as a Predictive miRNA Biomarker for Therapy Response to TACE
2.8. Proposed Model of Serum miRNAs as Predictive Biomarker in Clinical Setting
3. Discussion
4. Materials and Methods
4.1. Patients
4.2. Study Design
4.3. Serum Samples Collection and RNA Isolation
4.4. Microarray Profiling and Data Analysis
4.5. qRT-PCR Validation
4.6. Statistical Methods
5. Conclusions
Supplementary Materials
Author Contributions
Funding
Conflicts of Interest
Ethics approval and consent to participate
References
- Global Cancer Statistics 2018: Globocan Estimates of Incidence and Mortality Worldwide for 36 Cancers in 185 Countries-Bray-2018-CA: A Cancer Journal for Clinicians—Wiley Online Library. Available online: https://onlinelibrary.wiley.com/doi/full/10.3322/caac.21492 (accessed on 4 April 2019).
- Spearman, C.W.; Afihene, M.; Ally, R.; Apica, B.; Awuku, Y.; Cunha, L.; Dusheiko, G.; Gogela, N.; Kassianides, C.; Kew, M.; et al. Hepatitis B in sub-Saharan Africa: Strategies to achieve the 2030 elimination targets. Lancet Gastroenterol. Hepatol. 2017, 2, 900–909. [Google Scholar] [CrossRef]
- Goutté, N.; Sogni, P.; Bendersky, N.; Barbare, J.C.; Falissard, B.; Farges, O. Geographical variations in incidence, management and survival of hepatocellular carcinoma in a Western country. J. Hepatol. 2017, 66, 537–544. [Google Scholar] [CrossRef] [PubMed]
- Axley, P.; Ahmed, Z.; Ravi, S.; Singal, A.K. Hepatitis C Virus and Hepatocellular Carcinoma: A Narrative Review. J. Clin. Transl. Hepatol. 2018, 6, 79–84. [Google Scholar] [CrossRef]
- Reeves, H.L.; Zaki, M.Y.W.; Day, C.P. Hepatocellular Carcinoma in Obesity, Type 2 Diabetes, and NAFLD. Dig. Dis. Sci. 2016, 61, 1234–1245. [Google Scholar] [CrossRef]
- Zhang, X.-F.; Wei, T.; Liu, X.-M.; Liu, C.; Lv, Y. Impact of Cigarette Smoking on Outcome of Hepatocellular Carcinoma after Surgery in Patients with Hepatitis B. PLoS ONE 2014, 9. [Google Scholar] [CrossRef]
- Liu, C.-Y.; Chen, K.-F.; Chen, P.-J. Treatment of Liver Cancer. Cold Spring Harb. Perspect. Med. 2015, 5. [Google Scholar] [CrossRef]
- Crissien, A.M.; Frenette, C. Current Management of Hepatocellular Carcinoma. Gastroenterol. Hepatol. (N Y) 2014, 10, 153–161. [Google Scholar]
- Kim, K.H.; Choi, Y.-K. Long-term survival after resection of hepatocellular carcinoma. Korean J. Hepatobiliary Pancreat. Surg. 2012, 16, 98–104. [Google Scholar] [CrossRef]
- Poon, R.T.; Fan, S.T.; Lo, C.M.; Liu, C.L.; Ng, I.O.; Wong, J. Long-term prognosis after resection of hepatocellular carcinoma associated with hepatitis B-related cirrhosis. J. Clin. Oncol. 2000, 18, 1094–1101. [Google Scholar] [CrossRef]
- Liu, W.; Wang, K.; Bao, Q.; Sun, Y.; Xing, B.-C. Hepatic resection provided long-term survival for patients with intermediate and advanced-stage resectable hepatocellular carcinoma. World J. Surg. Oncol. 2016, 14, 62. [Google Scholar] [CrossRef]
- Galle, P.R.; Forner, A.; Llovet, J.M.; Mazzaferro, V.; Piscaglia, F.; Raoul, J.-L.; Schirmacher, P.; Vilgrain, V. EASL Clinical Practice Guidelines: Management of hepatocellular carcinoma. J. Hepatol. 2018, 69, 182–236. [Google Scholar] [CrossRef] [PubMed]
- Kong, J.-Y.; Li, S.-M.; Fan, H.-Y.; Zhang, L.; Zhao, H.-J.; Li, S.-M. Transarterial chemoembolization extends long-term survival in patients with unresectable hepatocellular carcinoma. Medicine 2018, 97. [Google Scholar] [CrossRef] [PubMed]
- Lopez, P.M.; Villanueva, A.; Llovet, J.M. Systematic review: Evidence-based management of hepatocellular carcinoma—An updated analysis of randomized controlled trials. Aliment. Pharmacol. Ther. 2006, 23, 1535–1547. [Google Scholar] [CrossRef] [PubMed]
- Lencioni, R.; Chen, X.-P.; Dagher, L.; Venook, A.P. Treatment of Intermediate/Advanced Hepatocellular Carcinoma in the Clinic: How Can Outcomes Be Improved? Oncologist 2010, 15, 42–52. [Google Scholar] [CrossRef]
- Lee, R.C.; Feinbaum, R.L.; Ambros, V. The C. elegans heterochronic gene lin-4 encodes small RNAs with antisense complementarity to lin-14. Cell 1993, 75, 843–854. [Google Scholar] [CrossRef]
- Lopez-Serra, P.; Esteller, M. DNA methylation-associated silencing of tumor-suppressor microRNAs in cancer. Oncogene 2012, 31, 1609–1622. [Google Scholar] [CrossRef]
- Kawaguchi, T.; Komatsu, S.; Ichikawa, D.; Tsujiura, M.; Takeshita, H.; Hirajima, S.; Miyamae, M.; Okajima, W.; Ohashi, T.; Imamura, T.; et al. Circulating MicroRNAs: A Next-Generation Clinical Biomarker for Digestive System Cancers. Int. J. Mol. Sci. 2016, 17, 1459. [Google Scholar] [CrossRef]
- Wang, H.; Peng, R.; Wang, J.; Qin, Z.; Xue, L. Circulating microRNAs as potential cancer biomarkers: The advantage and disadvantage. Clin. Epigenetics 2018, 10, 59. [Google Scholar] [CrossRef]
- Pascut, D.; Krmac, H.; Gilardi, F.; Patti, R.; Calligaris, R.; Crocè, L.S.; Tiribelli, C. A comparative characterization of the circulating miRNome in whole blood and serum of HCC patients. Sci. Rep. 2019, 9, 8265. [Google Scholar] [CrossRef]
- Latchana, N.; DiVincenzo, M.J.; Regan, K.; Abrams, Z.; Zhang, X.; Jacob, N.K.; Gru, A.A.; Fadda, P.; Markowitz, J.; Howard, J.H.; et al. Alterations in patient plasma microRNA expression profiles following resection of metastatic melanoma. J. Surg. Oncol. 2018, 118, 501–509. [Google Scholar] [CrossRef]
- Armstrong, D.A.; Green, B.B.; Seigne, J.D.; Schned, A.R.; Marsit, C.J. MicroRNA molecular profiling from matched tumor and bio-fluids in bladder cancer. Mol. Cancer. 2015, 14. [Google Scholar] [CrossRef] [PubMed]
- Chen, X.; Zhong, S.-L.; Lu, P.; Wang, D.-D.; Zhou, S.-Y.; Yang, S.-J.; Shen, H.-Y.; Zhang, L.; Zhang, X.-H.; Zhao, J.-H.; et al. miR-4443 Participates in the Malignancy of Breast Cancer. PLoS ONE 2016, 11, e0160780. [Google Scholar] [CrossRef] [PubMed]
- Ebrahimi, S.O.; Reiisi, S. Downregulation of miR-4443 and miR-5195-3p in ovarian cancer tissue contributes to metastasis and tumorigenesis. Arch. Gynecol. Obstet. 2019, 299, 1453–1458. [Google Scholar] [CrossRef] [PubMed]
- Wang, J.; Zhang, Q.; Wang, D.; Yang, S.; Zhou, S.; Xu, H.; Zhang, H.; Zhong, S.; Feng, J. Microenvironment-induced TIMP2 loss by cancer-secreted exosomal miR-4443 promotes liver metastasis of breast cancer. J. Cell. Physiol. 2020, 235, 5722–5735. [Google Scholar] [CrossRef]
- Wang, X.-X.; Ye, F.-G.; Zhang, J.; Li, J.-J.; Chen, Q.-X.; Lin, P.-Y.; Song, C.-G. Serum miR-4530 sensitizes breast cancer to neoadjuvant chemotherapy by suppressing RUNX2. Cancer Manag. Res. 2018, 10, 4393–4400. [Google Scholar] [CrossRef]
- Wang, Y.; Chen, Y.; Ge, N.; Zhang, L.; Xie, X.; Zhang, J.; Chen, R.; Wang, Y.; Zhang, B.; Xia, J.; et al. Prognostic significance of alpha-fetoprotein status in the outcome of hepatocellular carcinoma after treatment of transarterial chemoembolization. Ann. Surg. Oncol. 2012, 19, 3540–3546. [Google Scholar] [CrossRef]
- Lee, Y.K.; Kim, S.U.; Kim, D.Y.; Ahn, S.H.; Lee, K.H.; Lee, D.Y.; Han, K.-H.; Chon, C.Y.; Park, J.Y. Prognostic value of α-fetoprotein and des-γ-carboxy prothrombin responses in patients with hepatocellular carcinoma treated with transarterial chemoembolization. BMC Cancer 2013, 13, 5. [Google Scholar] [CrossRef]
- Lu, S.-R.; Li, Q.; Lu, J.-L.; Liu, C.; Xu, X.; Li, J.-Z. Long non-coding RNA LINC01503 promotes colorectal cancer cell proliferation and invasion by regulating miR-4492/FOXK1 signaling. Exp. Ther. Med. 2018, 16, 4879–4885. [Google Scholar] [CrossRef]


© 2020 by the authors. Licensee MDPI, Basel, Switzerland. This article is an open access article distributed under the terms and conditions of the Creative Commons Attribution (CC BY) license (http://creativecommons.org/licenses/by/4.0/).
Share and Cite
Pratama, M.Y.; Visintin, A.; Crocè, L.S.; Tiribelli, C.; Pascut, D. Circulatory miRNA as a Biomarker for Therapy Response and Disease-Free Survival in Hepatocellular Carcinoma. Cancers 2020, 12, 2810. https://doi.org/10.3390/cancers12102810
Pratama MY, Visintin A, Crocè LS, Tiribelli C, Pascut D. Circulatory miRNA as a Biomarker for Therapy Response and Disease-Free Survival in Hepatocellular Carcinoma. Cancers. 2020; 12(10):2810. https://doi.org/10.3390/cancers12102810
Chicago/Turabian StylePratama, Muhammad Yogi, Alessia Visintin, Lory Saveria Crocè, Claudio Tiribelli, and Devis Pascut. 2020. "Circulatory miRNA as a Biomarker for Therapy Response and Disease-Free Survival in Hepatocellular Carcinoma" Cancers 12, no. 10: 2810. https://doi.org/10.3390/cancers12102810
APA StylePratama, M. Y., Visintin, A., Crocè, L. S., Tiribelli, C., & Pascut, D. (2020). Circulatory miRNA as a Biomarker for Therapy Response and Disease-Free Survival in Hepatocellular Carcinoma. Cancers, 12(10), 2810. https://doi.org/10.3390/cancers12102810