Article

The Association of Residential Altitude on the Molecular Profile and Survival of Melanoma: Results of an Interreg Study

1
DSM-Department of Medical Sciences, University of Trieste, 34149 Trieste, Italy
2
Pathology Unit, IRCCS CRO Aviano-National Cancer Institute, 33081 Aviano, Italy
3
ASU GI-Azienda sanitaria universitaria Giuliano Isontina, 34128 Trieste, Italy
4
Azienda Sanitaria dell’Alto Adige, 39100 Bolzano, Italy
5
Institute for Human Genetics, Medical University of Innsbruck, 6020 Innsbruck, Austria
6
Department of Dermatology, Venereology and Allergology, Medical University of Innsbruck, 6020 Innsbruck, Austria
*
Author to whom correspondence should be addressed.
Cancers 2020, 12(10), 2796; https://doi.org/10.3390/cancers12102796
Submission received: 14 July 2020 / Revised: 4 September 2020 / Accepted: 22 September 2020 / Published: 29 September 2020
(This article belongs to the Section Cancer Causes, Screening and Diagnosis)

Abstract

:

Simple Summary

Environmental factors such as UVR exposure and altitude of residence can contribute to the development of cutaneous melanoma. We hereby report that altitude of residence significantly associates with the molecular profiling of CM and melanoma specific survival. The fact that different miRNAs and transcriptomic profile vary with different geographical areas and residences altitude could support for possible regulatory mechanisms induced by environmental conditions, such as hypoxic environment and/or higher UVR exposure.

Abstract

Cutaneous melanoma (CM) incidence is rising worldwide and is the primary cause of death from skin disease in the Western world. Personal risk factors linked to environmental ultraviolet radiation (UVR) are well-known etiological factors contributing to its development. Nevertheless, UVR can contribute to the development of CM in different patterns and to varying degrees. The present study aimed at investigating whether altitude of residence can contribute to the development of specific types of CM and/or influence its progression. To this aim, 306 formalin-fixed and paraffin-embedded (FFPE) tissues from primary CM diagnosed in different geographical areas were submitted to B-RAF proto-oncogene serine/threonine kinase (BRAF) and N-RAS proto-oncogene GTPase (NRAS) mutational status detection and mRNA and miRNA profiling by qPCR. Genes were chosen for their functions in specific processes, such as immune response (CD2, PDL1, or CD274) and pigmentation (MITF, TYRP1, and TRPM1). Furthermore, four microRNAs, namely miR-150-5p, miR-155-5p, miR-204-5p, and miR-211-5p, were included in the profiling. Our results highlight differences in the gene expression profile of primary CM with respect to the geographical area and the altitude of residence. Melanoma-specific survival was influenced by the gene expression of mRNA and miRNAs and varied with the altitude of patients’ residence. In detail, TYRP1 and miR-204-5p were highly expressed in patients living at higher altitudes, unlike miR-150-5p, miR-155-5p, and miR-211-5p. Since miRNAs are highly regulated by reactive oxygen species, it is possible that different regulatory mechanisms characterize CMs at different altitudes due to the different environment and UVR intensity.

Graphical Abstract

1. Introduction

Cutaneous melanoma (CM) incidence is rising worldwide and continues to be the primary cause of death from skin disease in the Western world [1]. Personal risk factors, including family history, multiple moles, fair skin, blue eyes, red hair, and freckles, together with environmental UV exposure are well-known etiological factors contributing to the development of CM [2,3]. Nevertheless, CM is not a homogeneous disease; there are different types of CM and UV radiation (UVR) can contribute to the development of melanoma in different ways and to varying degrees [2]. The same UVR that reaches the Earth’s surface can vary according to different variables. Well-known factors influencing UVR emissions are the ozone layer, the time of the day, the period of the year, and the latitude, with increasing UVR emission closer to the equator. Altitude is a further contributing factor, with an emission increment of 10−12% for every 1000 m elevation [4].
CM has been molecularly classified both at the genomic and at the transcriptomic levels [5]. At the genomic level, three subtypes have been identified: the BRAF subtype, the most common one, characterized by V600 amino acid residue mutations and the RAS subtype identified by the presence of RAS hot-spot mutations (N-, K-, H-RAS). The most frequent RAS mutations involve the N-RAS, especially the Q61 amino acid residue. Usually, BRAF and NRAS mutations are mutually exclusive [6]. The third group was defined by NF1 mutations, which downregulate the RAS function through GTPase activity. A fourth group has been identified by the lack of hot-spot mutations in the above-mentioned genes; therefore, it has been named Triple Wild-Type [5]. At the transcriptomic level, three clusters of CM were recognized: the “immune” cluster, which includes CMs with high expression of immune cell-associated genes, immune signaling molecules, and receptors. The “keratin” subtype, which is the main representative group in primary melanomas, is characterized by high expression of genes associated with keratins, pigmentation, epithelium, and neuronal development. On the contrary, the last cluster called “MITF-low” is characterized by low expression of genes involved in pigmentation, epithelial, and several MITF gene targets [5]. Among all, the “keratin” cluster subtype appears to be worst one in terms of prognosis, while the “immune” group has been linked to improved survival [5].
Additionally, at the molecular level, microRNAs have been shown to be related to clinical variables, including CM outcome [7,8,9,10,11].
The objective of the present study was to investigate whether environmental variables, such as the altitude of residence, could contribute to the development of specific types of cutaneous melanomas, could promote it, and whether they can be linked to CM progression and/or survival.
To this aim, we selected primary CM cases of neighboring geographical regions that differed with respect to residential altitudes. In particular, we selected CM cases from patients living both at sea level (Trieste) and in mountainous areas (North and South Tyrol) and characterized these cases at the molecular level. With respect to patients living at sea level, we recruited residents of the province of Trieste with a diagnosis of cutaneous melanoma from both the University Hospital of Trieste and the National Cancer Institute of Aviano. Residents of the province of Bolzano (Bozen), Innsbruck, and Innsbruck-Land made up the group of mountainous area patients. Transcriptomic classification of the immune cluster was achieved by the quantification of CD2 and PDL1 mRNAs, while for keratin and MITF low clusters, the expression level of three pigmentation genes was analyzed, namely MITF, TYRP1, and TRPM1 because of their different expression in “keratin” and “MITF-low” groups [5]. Furthermore, four microRNAs were also investigated for their possible association with clinical features, prognosis and survival [7,8,11,12,13,14,15], and transcriptomic analyses. In detail, miR-150-5p was linked with the tumor-infiltrated lymphocytes (TILSs) and with the proto-oncogene MYB, which plays a role in the regulation of hematopoiesis and tumorigenesis [8,11,15]. miR-155-5p, as a typical multifunctional microRNA, seems to modulate the immune response and, on the other hand, it interplays with miR-16 in TYRP1 regulation [16]. Consequently, miR-150-5p and miR-155-5p are physiologically involved in immunological processes. Both were reported to be potential biomarkers and targets for immunotherapies. The other two microRNAs, miR-204-5p and miR-211-5p, belong to the same family of miRNA (miR204/211 family) and act as tumor suppressors. They have already been linked with cancer features and tumor progression [7,12,13,14]. In addition, miR-211-5p acts as a metabolic switch, sensitizing melanocyte to oxygen deprivation, a lost mechanism in melanoma cells [17].

2. Results

The International Classification of Disease of Oncology (ICD-O) was applied to define the anatomical sites and the histopathological CM subtypes. In our cohort, only nodular, superficial spreading, and acral subtypes were numerically well represented; therefore, amelanotic, lentigo maligna, desmoplastic, spindle cell blue nevus-like, and epithelioid cell melanoma were merged in one group named “others”.
The cohort was subdivided into 3 different geographical areas of residence, namely the area of South Tyrol (BZ), the province of Trieste (TS), and the city of Innsbruck and Innsbruck-Land district (I/IL). Patients diagnosed at the National Cancer Institute of Aviano (CRO- Italy) were assigned to the group of Trieste (TS) residents.

2.1. Patients’ Features

Overall, 306 patients with a diagnosis of CM were included in the study: 107 (35%) cases were recruited from the Central Hospital of Bozen (Italy); 94 (31%) from the University Hospital of Trieste (Italy), 74 (24%) patients from the Medical University of Innsbruck (MUI-Austria), and 31 (10%) from the National Cancer Institute of Aviano (CRO-Italy).
Patients’ details are reported in Table 1. Women and men were equally represented (Chi-square test, p = 0.9), and there was no difference in gender distribution concerning altitude of residence (p = 0.5), tumor stage (p = 0.7), presence of lymph nodes (p = 0.5), Breslow’s thickness (p = 0.1), ulceration (p = 0.3), and histotype (p = 0.5). With respect to age, women were significantly older than men as shown in Figure S1 (p = 0.03).
Average patients’ age was 69 years (range 16–101 years) and average Breslow’s thickness was 4.6 mm (range 1.8−30 mm). Among the three cohorts, there was no significant difference between tumor features, even if stage II tumor was more represented in our dataset (p = 0.003) and nodular melanoma was the most frequent histotype in the group of TS and BZ (p < 0.0001 Table 1).

2.2. Mutational Characterization

Sample slides were tested for BRAF V600E and for NRAS Q61R mutations by immunohistochemistry. Samples with positive or doubtful staining were subjected to ddPCR analysis. Eighteen specimens were excluded from the mutation characterization because of lack of material. The resulting 288 of the 306 specimens were analyzed for BRAF and NRAS mutations: 96 (33.3%) patients were BRAF mutated (V600E or V600K), while 62 (21.5%) patients had mutations in the NRAS gene (Q61R, Q61K, Q61L, or Q61H). One sample with double positivity at the IHC was excluded from further analyses. All results are reported in Table 2.
Associations of the mutational status with patients’ CM features are listed in Table 3. Hereafter, only statistically significant results are reported. BRAF mutations were more frequent in men (p = 0.04), in CM located on the trunk (p = 0.02) and in younger patients (p = 0.0001). At the time of CM diagnosis, patients with BRAF V600 mutations were younger than wild type and NRAS Q61-mutated patients, (p = 0.0005 and p = 0.0001, respectively). In detail, age at diagnosis differed significantly with respect to the mutation burden: the mean age of BRAF-mutated patients was 62 years, which was lower than wild type (average age 71 years) and NRAS-mutated (average age 73 years) patients (p = 0.0001) (Table 3).
In our cohort, the rate of BRAF-mutated CM in patients with positive LN involvement at diagnosis was significantly different in comparison with patients who did not have LN involvement (p = 0.02). The percentage of patients with positive lymph nodes was higher in BRAF-mutated patients (n = 25 of 96, 26%) than in wild type ones (n = 16 of 164, 12.9%). On the contrary, among LN-negative CMs, 81.5% of patients (n = 101 of 124) were wild type and 74% (n = 71 of 96) were BRAF mutated. In the primary logistic regression model (n = 288), age (years), sex, geographical area, altitude of residence, anatomical site of the CM, Breslow’s depth, presence of ulceration, and lymph node involvement were covariates investigated to affect the mutational status. Anatomical site (p = 0.011) and lymph node involvement (p = 0.049) had a statistically significant influence on the detected BRAF and NRAS mutation rate (overall regression p = 0.04- post estimation by Pearson χ2 goodness-of-fit test p = 0.3). The same analysis was repeated for the BRAF and NRAS mutations separately. BRAF mutation burden (p = 0.001- post estimation by Pearson χ2 goodness-of-fit test p = 0.4) depended significantly on age at diagnosis (p = 0.001) and in borderline significance on the anatomical site where CM developed (p = 0.05). For NRAS mutations, the regression results were not statistically significant (p =0.5).

2.3. Molecular Results and Geographic Features

Molecular results were compared with the environmental characteristics, namely the patients’ area of residence, which was subdivided into three groups, as described above, and the altitude of residence. Patients’ residence altitudes were significantly different between geographical areas (p < 0.0001), with a mean altitude of 53 m for Trieste (TS), 884 m for South Tyrol (BZ), and 699 m for Innsbruck and Innsbruck-Land (I/IL) (Table 1). Stage at diagnosis was different between geographical areas (p = 0.003, Table 1), because I/IL provided a minor number of cases due to the absence of informed consent from patients. By comparing stages between TS and BZ, no differences were found in CM stage distribution (p = 0.3).
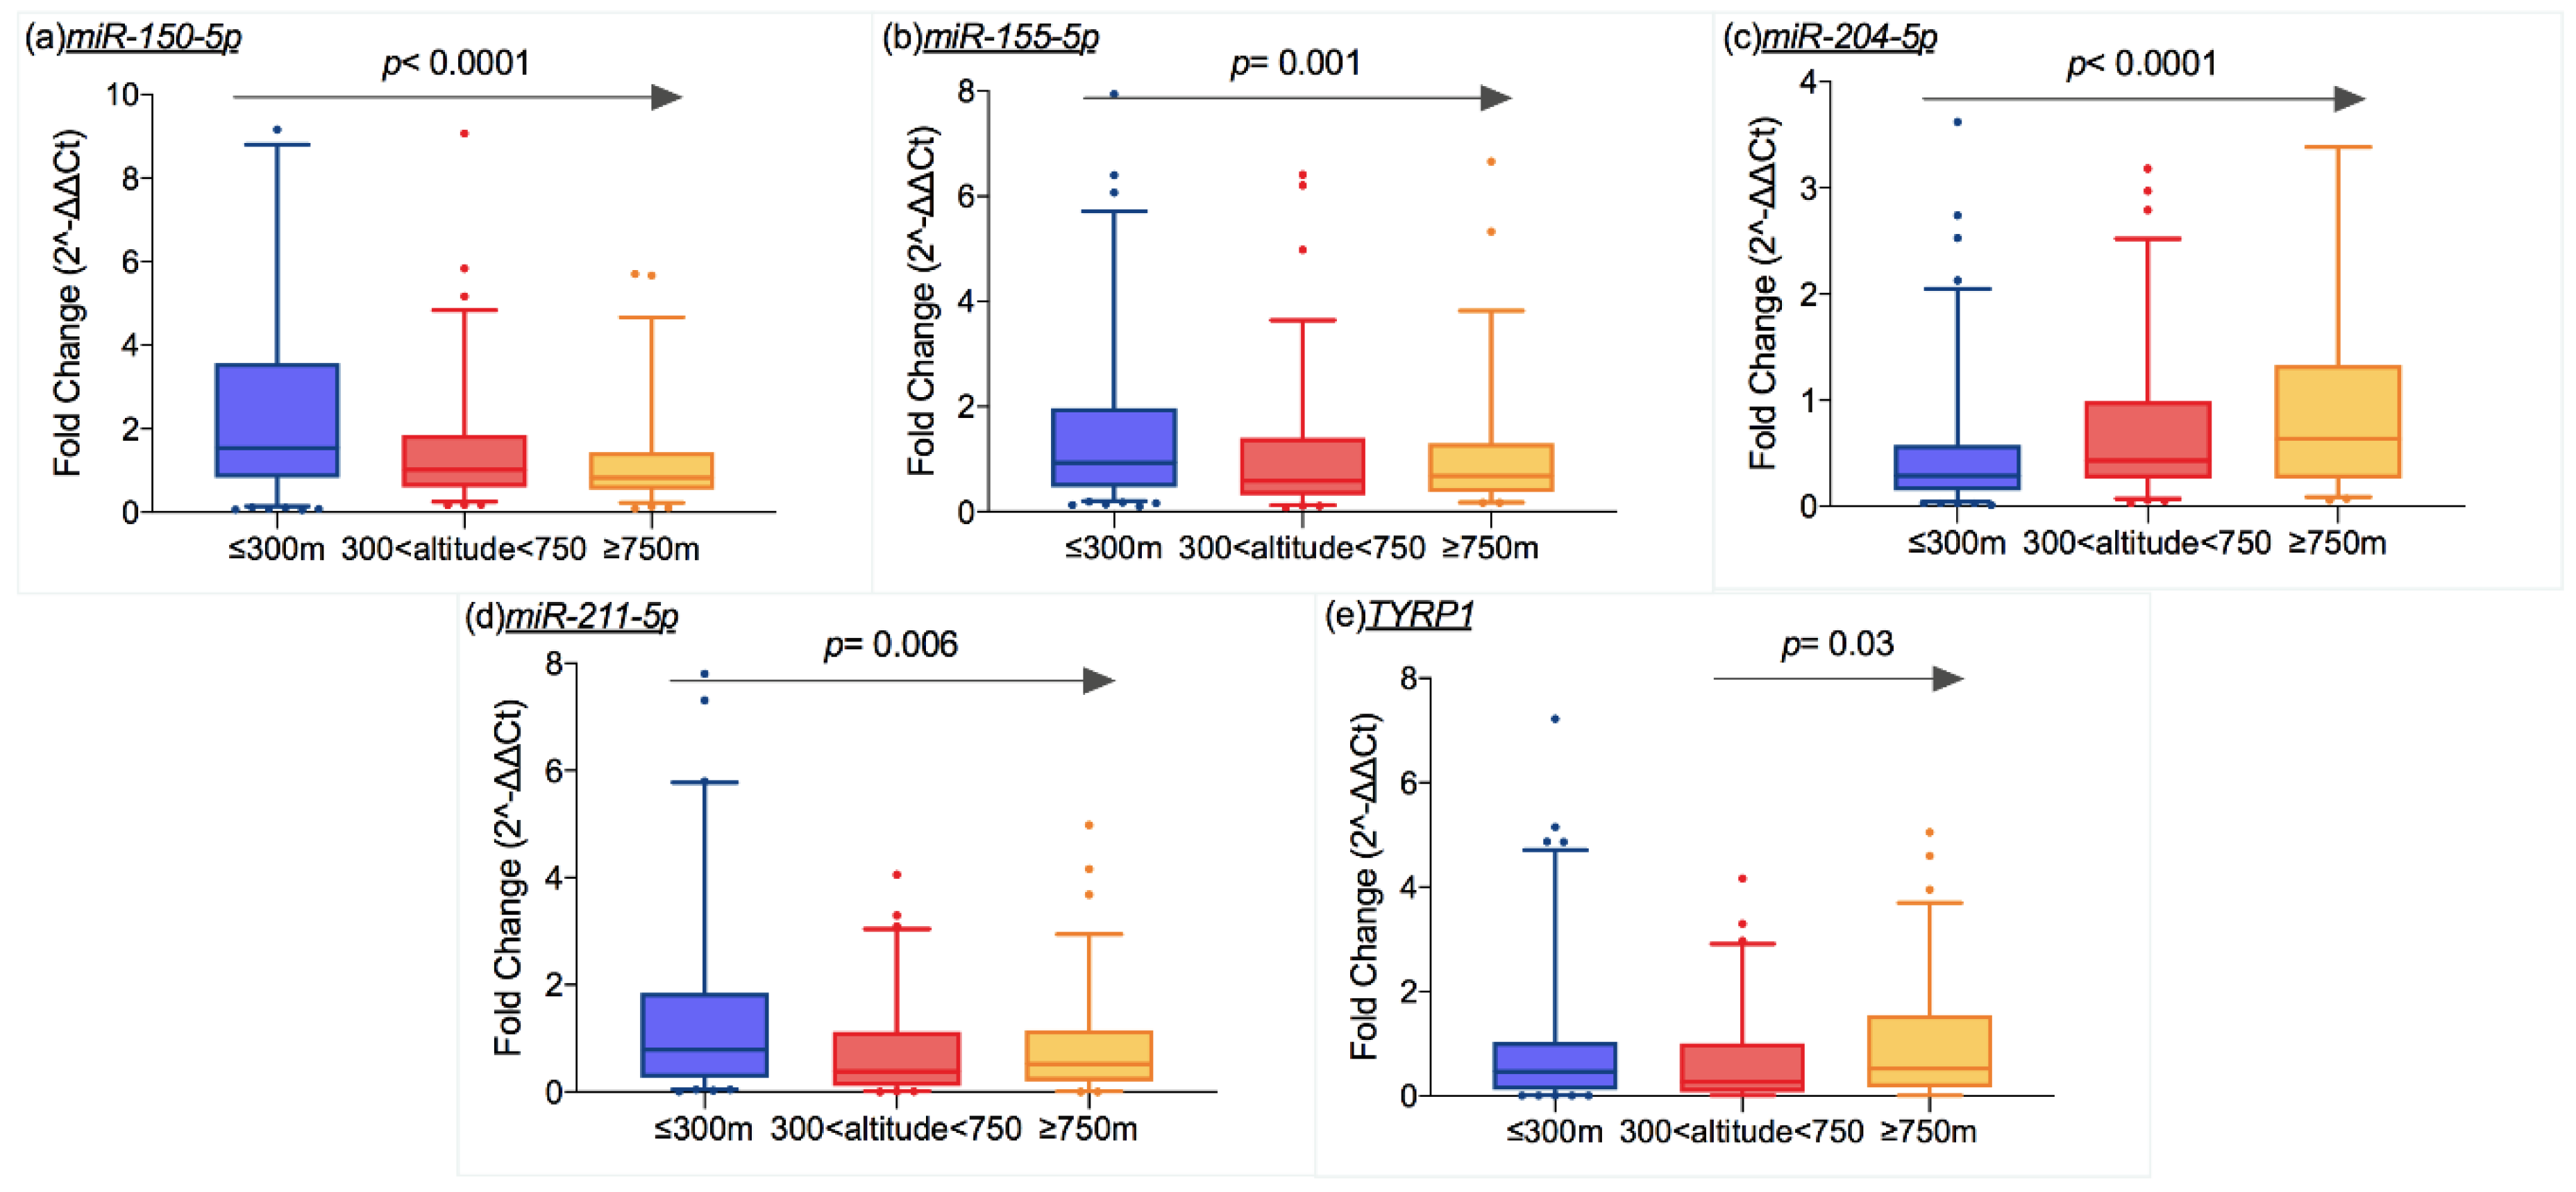
TYRP1 expression was higher in patients living in South Tyrol than in those living in TS and I/IL (Figure 1a, p = 0.02 and p = 0.002, respectively). Higher expression levels of miR-150-5p and miR-155-5p were recorded in patients living in TS in comparison to those living in BZ and I/IL (p < 0.0001 for both, Figure 1b,c). On the other hand, miR-204-5p (Figure 1d) was less expressed in patients living in TS than in those residing in BZ (p < 0.0001) and I/IL (p = 0.002). The expression of miR-211-5p was similar between patients living in Trieste and South Tyrol but differed between TS and I/IL residents (p < 0.0001, Figure 1e) and between BZ and I/IL residents (p < 0.0001) (Figure 1e).
As shown in Figure 2a,b,d, the expression of miR-150-5p (p < 0.0001, r = −0.3), miR-155-5p (p = 0.001, r = −0.2), and miR-211-5p (p = 0.006, r = −0.2) decreased in patients living at high altitude, while miR-204-5p expression was positively correlated with altitude of residence (p < 0.0001, r = 0.3) (Figure. 2c). The TYRP1 expression increased starting from an altitude of 300 m above sea level (a.s.l.) (p = 0.03, r = 0.2) (Figure 2e).

2.4. Transcriptomic Profile and Demography

mRNA and microRNA expression levels were related to patients’ gender and age at the time of diagnosis. Hereafter, only statistically significant results are reported.
Based on a proposed cut-off at 75 years for elderly patients [18], data were grouped accordingly. Differences in CM staging and groupings were found (Chi-square test p = 0.01), namely the patients at stage II were older than stage I and III patients (Mann–Whitney test, p = 0.002 and p = 0.02, respectively). Furthermore, patients with positive lymph nodes were slightly younger than those with negative ones (Mann–Whitney test, p = 0.04).
The expression of CD2, TRPM1, and miR-204-5p decreased in patients aged equal or over 75 years, as shown in Figure S2 (p = 0.002, p = 0.001 and p = 0.04).

2.5. Transcriptomic Profile and CM Features

The expression levels of the analyzed mRNAs and miRNAs were related to CM characteristics, such as anatomical sites, Breslow’s thickness, presence of ulceration, and histotype.
Anatomical sites were defined according to the International Classification of Disease for Oncology (ICD-O) and divided into head&neck&face, trunk, upper limbs, and lower limbs. TRPM1 expression level was lower in melanomas developed in the lower limbs than in those in the upper limb (p = 0.008), as shown in Figure S3. Furthermore, miR-150-5p showed a significantly higher expression in CM in the upper limbs compared to those in the lower limbs (p = 0.02) (Figure S3).
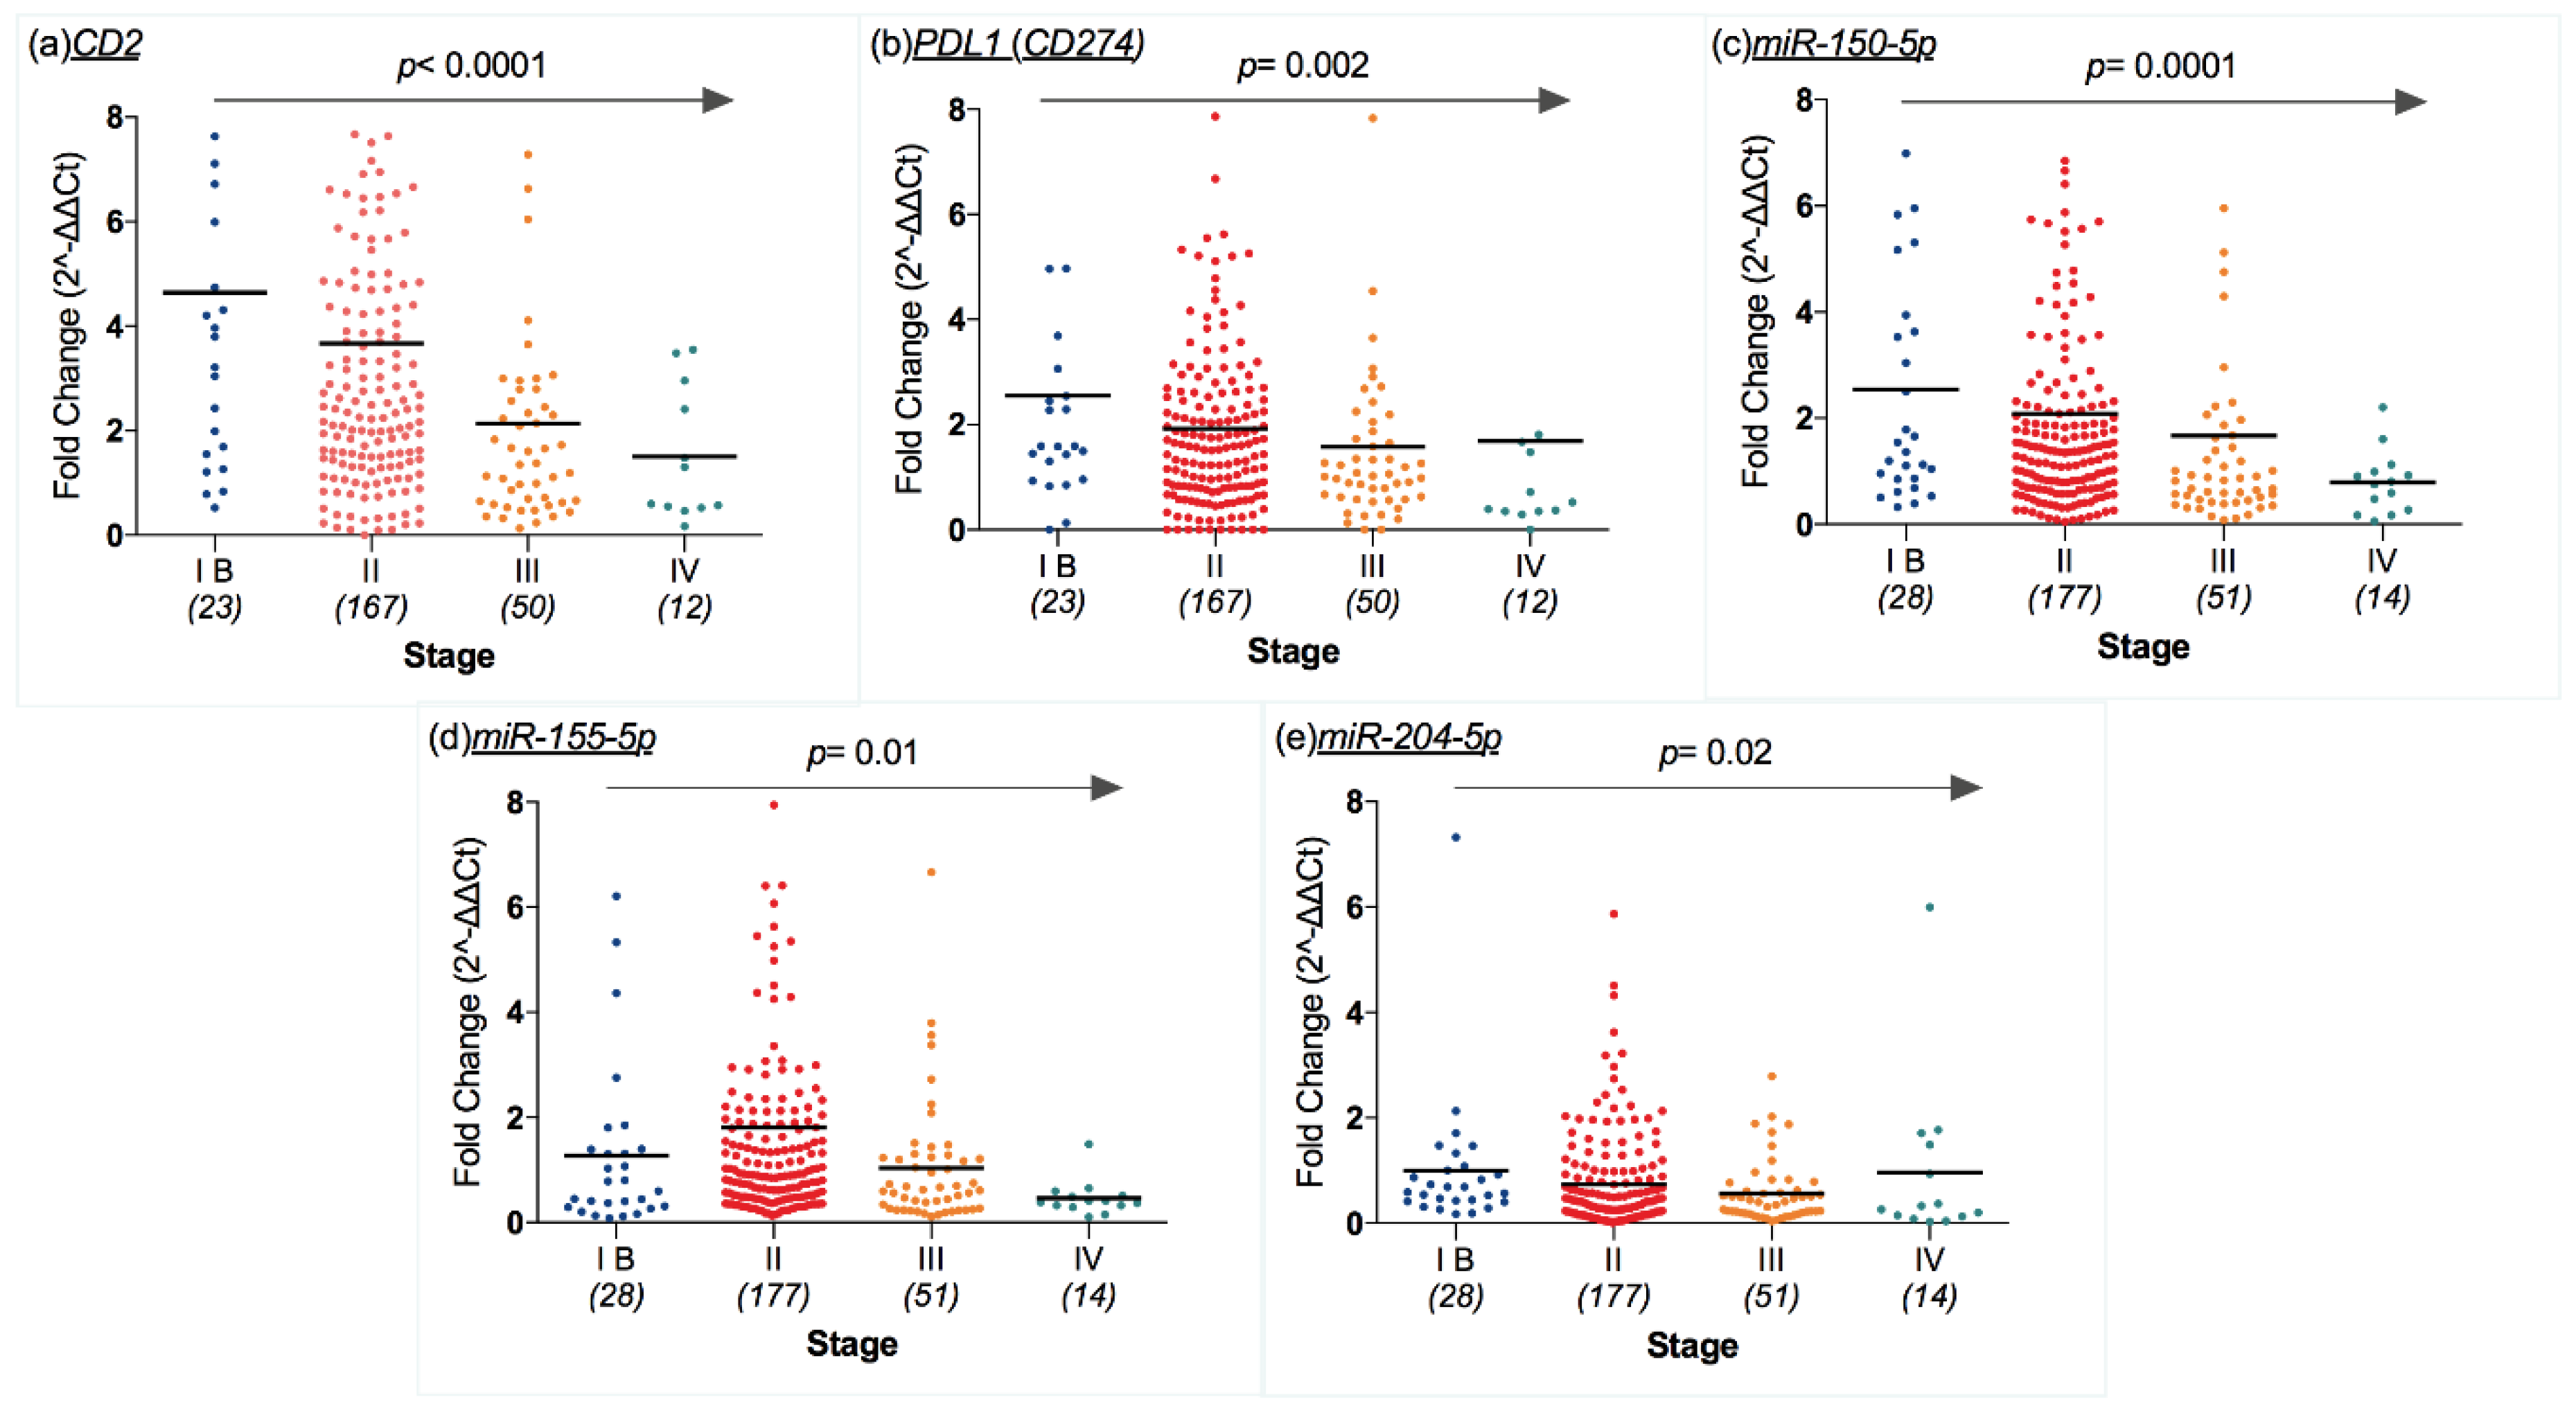
In our cohort, CD2, PDL1, miR-150-5p, miR-155-5p, and miR-204-5p expression was significantly linked to CM stage, namely their expression decreases as stage progresses (p < 0.0001, p = 0.002, p = 0.0001, p = 0.01, and p = 0.02, respectively; Figure 3a–e).
AJCC staging parameters, such as the positivity of lymph nodes, tumor thickness, and ulceration, were significantly correlated to the expression levels of some mRNA and miRNA analyzed in this study. In particular, CD2 and PDL1 gene expression was lower in samples with positive lymph nodes (p = 0.0001 and p = 0.01, respectively; Figure S4). Similar results were obtained for miR-150-5p and miR-155-5p (Figure S4) (p = 0.0004 and p = 0.001, respectively).
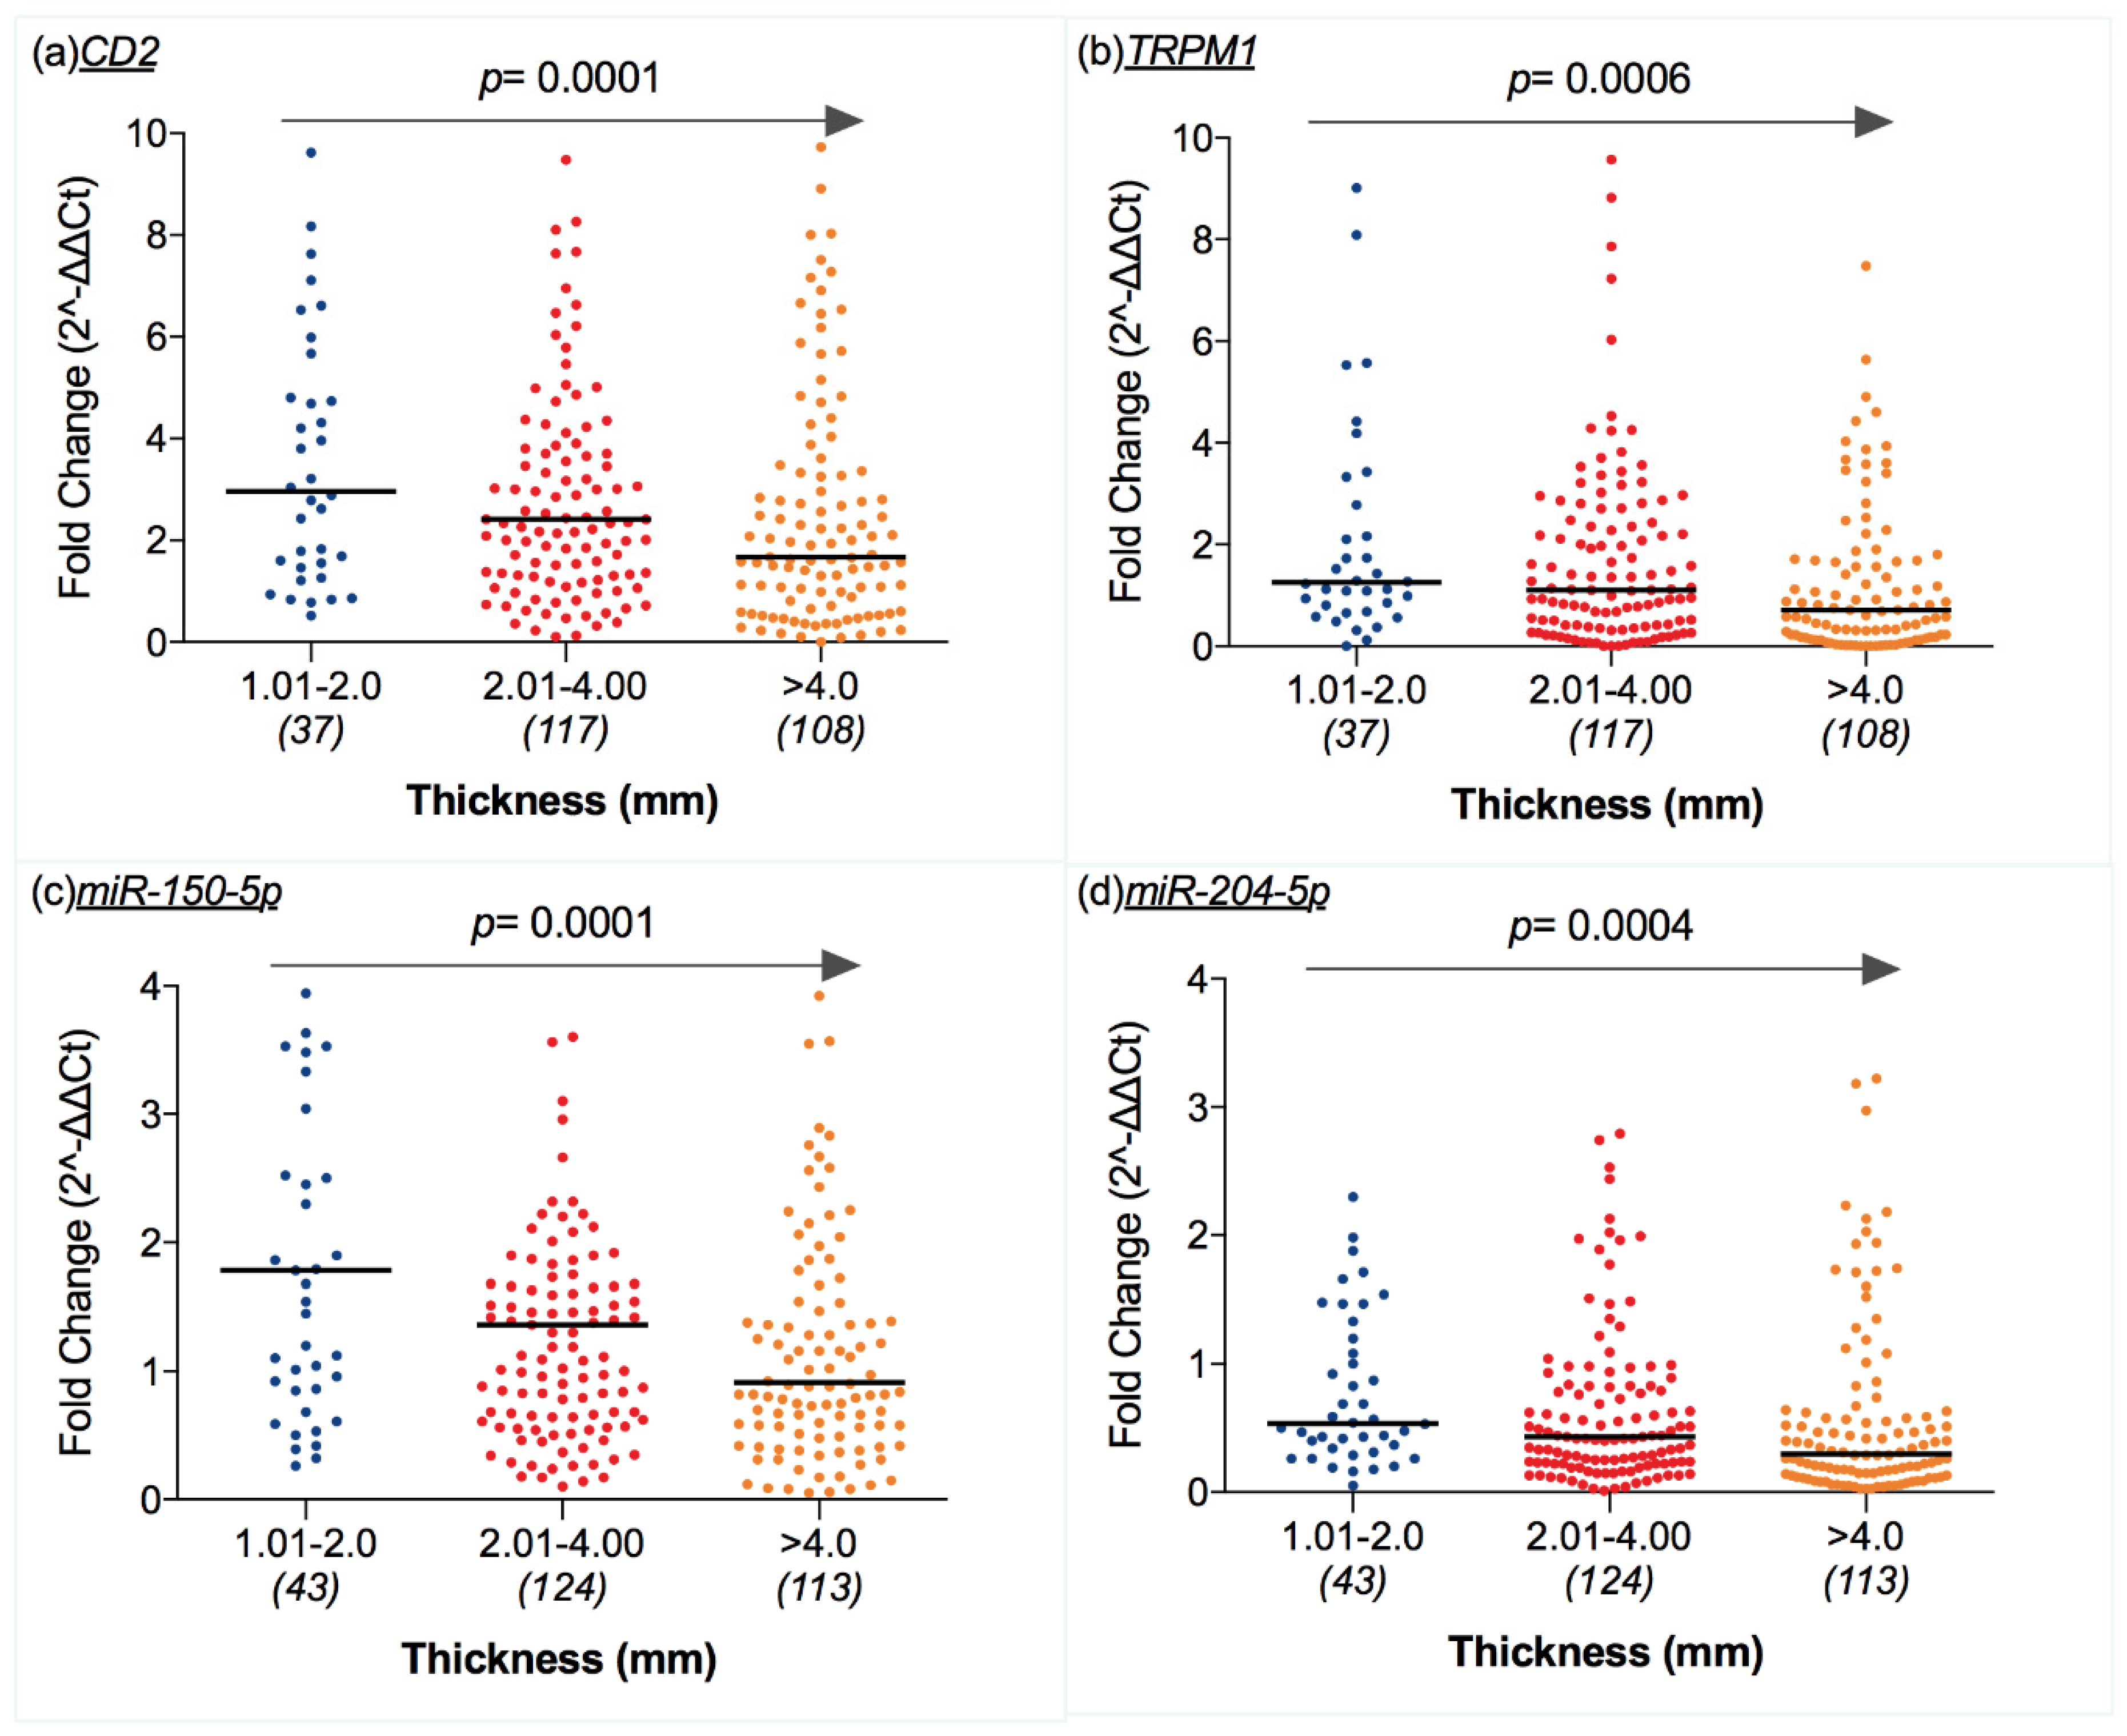
Grouping samples according to T categories of CM [19] showed that expression levels of CD2 and TRPM1 decreased as CM thickness increased (p = 0.0001 and p = 0.0006, respectively; Figure 4a,b). Similar results were found for miR-150-5p and miR-204-5p, which were inversely correlated with CM thickness (p = 0.0001 and p = 0.0004, respectively; Figure 4c,d).
Regarding ulceration, expression levels of TRPM1, MITF, and miR-204-5p in our cohort were higher in non-ulcerated than ulcerated CMs (p = 0.006, p = 0.03, and p = 0.001, respectively).
The expression levels of the analyzed mRNAs and miRNA were related to the mutational status of CM. Accordingly, CD2 expression levels were significantly higher in wild-type CM than in NRAS-mutated CM (p = 0.01). Considering both BRAF and NRAS mutations, the expression of miR-150-5p was higher in BRAF-mutated CM than in NRAS-mutated CM (p = 0.0001) (Figure S5).

2.6. Melanoma-Specific Survival and Overall Survival

Melanoma-specific survival (MSS) was significantly different among patients diagnosed in the different geographical areas (p = 0.0009), which may be related to the different distribution of CM stages reported above (Table 1). By stratifying survival data per CM stages, MSS was significantly different for stage II (p = 0.04) and stage IV (p = 0.01), whereby a shorter MSS was observed for residents from South Tyrol (BZ) and partially from Innsbruck and Innsbruck-Land (I/IL) (only for stage II CM).
The residential altitude was divided into three groups as follows: (1) altitude of residence ≤300 m. a.s.l., (2), altitude of residence between 300 and 750 m, and (3) altitude of residence above 750 m a.s.l.. Considering the three groups, patients’ survival varied significantly with the residential altitude (p = 0.0009), with a shorter MSS for patients living above 300 m (Figure 5A). In order to exclude possible biases, stage IV CMs were excluded from survival analysis. The results confirmed that the altitude of residence influences the MSS (p = 0.006, Figure 5B). Since patients living in Innsbruck and Innsbruck-Land had a different stage distribution, survival analyses were restricted to patients living in the Trieste (TS) and Bozen region (BZ), where no differences were recorded with respect to stage distribution. Similar results were obtained both considering and excluding stage IV CMs, namely survival was shorter for patients living above 750 m a.s.l. (p = 0.002 and p = 0.02, respectively) as shown in Figure 5C,D.
Similar results were also found for overall survival (Figure S7), but the multivariate analysis did not return the altitude of residence as a variable associated to overall survival as shown in Table S4.
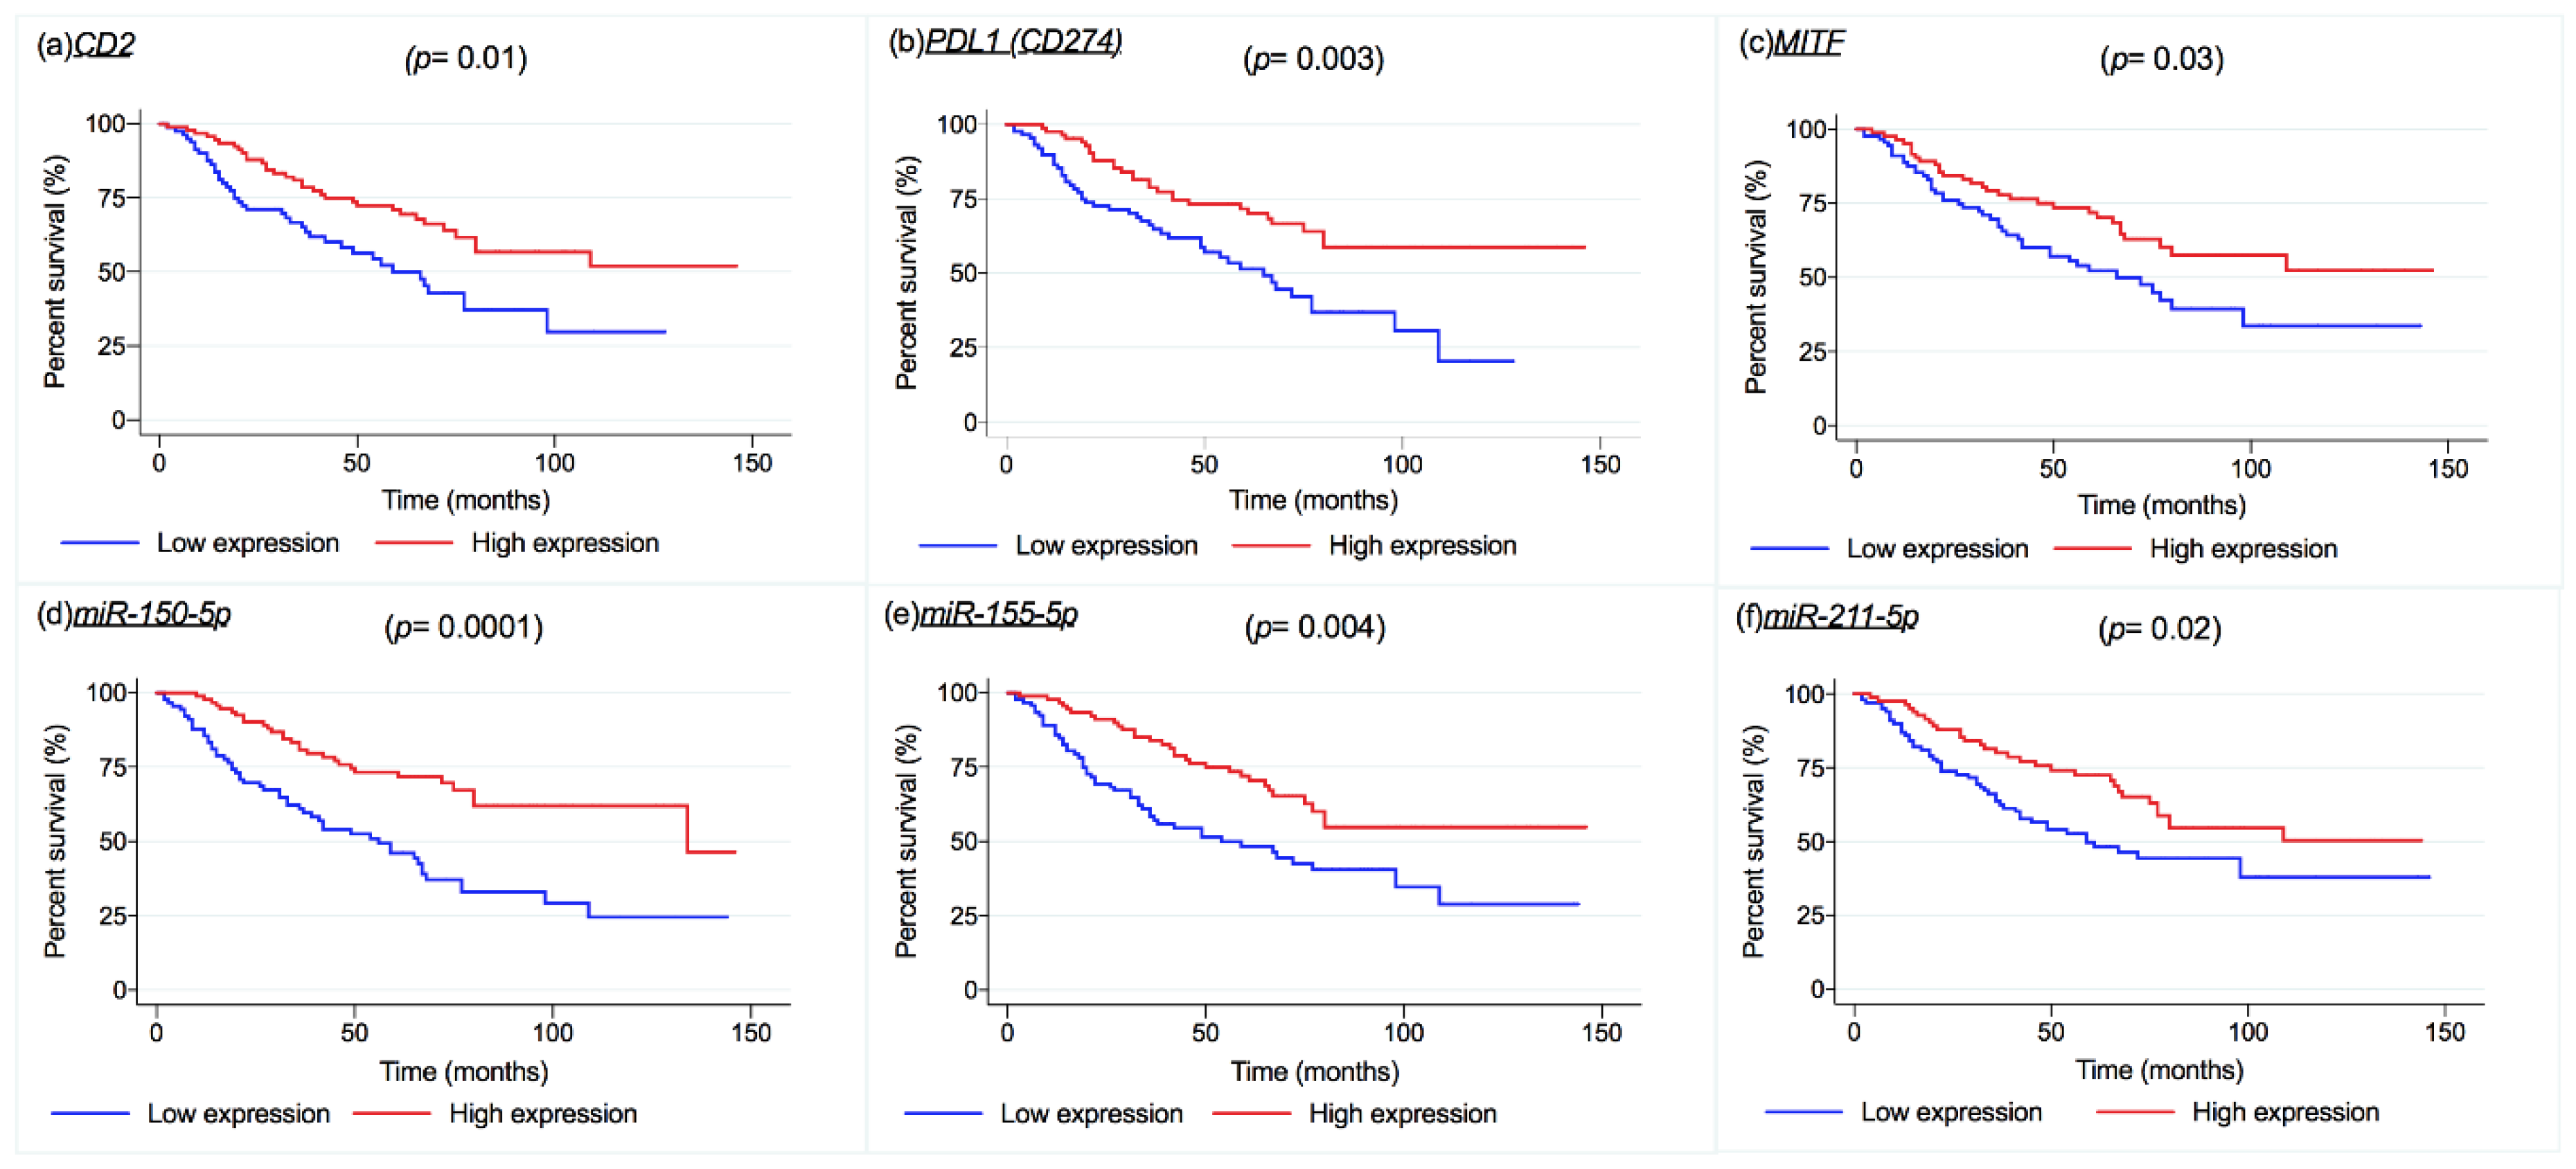
The influence of mRNA and miRNA on patients’ survival was investigated by dichotomizing mRNA and miRNA expression levels according to their median value. Over the entire cohort, melanoma-specific survival (MSS) was influenced by CD2, PDL1 (CD274), and MITF (p = 0.01, p = 0.003, p = 0.03, respectively, Figure 6a–c). Higher expression levels of these transcripts were associated with longer MSS, showing a protective effect on survival. A similar result was found for miR-150-5p, miR-155-5p, and miR-211-5p, with higher expression levels associated with longer survival (in univariate analysis) as shown in Figure 6d,e,f (p = 0.0001, p = 0.004, and p = 0.02, respectively). However, multivariate Cox regression analysis did not confirm the dependence of MSS from the expression levels of those transcripts and miRNAs (Table 4). The regression also returned an effect of TYRP1 on patients’ MSS; in univariate analysis, the adverse effect of that gene was confined to stage II patients only (p = 0.04). In Relapse free survival analysis (RFS) only CD2 seemed to influence patients’ survival as shown in Figure S8.

3. Discussion

Our study adds new insights to the understanding of the complexity of intrinsic and environmental factors involved in melanoma development and progression. In particular, we observed that altitude of residence significantly correlates with the molecular profiling of CM and melanoma-specific survival. The expression levels of miR-150-5p, miR-155-5p, and miR-211-5p were significantly higher in patients living in Trieste (TS), which is a city located by the sea, compared to the geographic areas of South Tyrol (BZ) and Innsbruck/IL (I/IL), which are characterized by higher altitudes of residence (in our dataset, the mean altitude of the South Tyrol region is 884 m a.s.l. and of I/IL is 700 m a.s.l.). The opposite trend was found for miR-204-5p and TYRP1, which were significantly highly expressed in CM of patients living in South Tyrol. The study results were confirmed also when expression levels were correlated with altitude (a.s.l.). Actually, miR-150-5p, miR-155-5p, and miR-211-5p expression decreases as altitude increases; conversely, miR-204-5p and TYRP1 were significantly higher in patients living at altitudes of or above 750 m a.s.l. A possible explanation for our finding might be related to an increased UVR and hypoxic environment at higher altitudes [20]. Concerning the TYRP1 gene, it is well-known that the transcription factor Usf-1 activates the tyrosinase promoter by UV exposure [21]. Additionally, miRNA profiles have been shown to vary in sun-exposed skin [22] and that oxidative stress [23] can induce or suppress miRNA expression. Thus, a higher altitude with a hypoxic environment and increased UV intensity may account for the detected differences in the miRNA expression in our cohort. Although a very high affinity was found by mirDIP (http://ophid.utoronto.ca/mirDIP/) between miR-155-5p and HIF1A, the hypoxia inducible factor 1, as well as between miR-204-5p and HIF1AN, the hypoxia inducible factor 1 subunit alpha inhibitor, experimental data on HIF1A expression in our cohort did not support this hypothesis (see Tables S5 and S6). Micro RNA-155-5p, which was highly expressed in patients living at lower altitudes and at sea level, did not contribute directly to a decrease of the transcriptional activity through binding to HIF1A mRNA, in disagreement with others [24]. In vivo experiments also demonstrated the relationship between UV exposure and the downregulation of miR-155-5p in the development of squamous cell carcinoma (SCC) [25,26]. Furthermore, in vitro studies have shown that miR-150-5p is downregulated by hypoxia in pancreatic cell lines [27]. Nevertheless, the above-mentioned miRNAs have been described as favorable biomarkers in skin melanomas or as tumor suppressor miRNAs [9,14,28,29]. The fact that different miRNAs have been detected in different geographical areas characterized by different altitudes supports the hypothesis for possible regulatory mechanisms induced by environmental conditions, such as a hypoxic environment and/or higher UVR exposure. So far, however, no evidence has been found in our data to support this hypothesis. We acknowledge anyway that the hypobaric hypoxia at altitudes ranging from 564 to 2153 m a.s.l. of patients living in Bozen, Innsbruck and its land can be negligible.
Altitude of residence at or over 750 m a.s.l. negatively affected patients’ melanoma-specific survival; however, even though statistically significant, the revealed risk factor by Cox regression was 1. Even if this result may be biased by an unequal distribution of CM stages among the different geographic groups, it remained statistically significant when considering only the cases from South Tyrol (BZ) and Trieste (TS), which were equally distributed. In line with this finding, three suppressor miRNAs analyzed in this study (namely miR-150-5p, miR-155-5p, and miR-211-5p) were more expressed in residents at low altitude level. Although the amount of UVR increases with altitude, a direct causality between the altitude of residence and CM mortality appears unlikely. Even though populations living at high altitude are exposed to chronic hypobaric hypoxia and permanent stress due to hypoxic exposure, it seems that cancer mortality is reduced in populations living at higher altitude over a broad spectrum of cancer types [30]. Rather, other logistic and societal/cultural issues may play a role, such as difficulties encountered by patients living in rural areas to reach hospitals for treatment or poor knowledge about symptoms. Interestingly, an Austrian study revealed that CM incidence rates have been reported to increase with altitude, but mortality rates decrease [31]. Previously, higher melanoma prevalence was reported at higher altitude of residence, but no influence on melanoma specific mortality was documented [32]. The Cox regression has shown in our cohort that the diagnosis of a stage IV melanoma was the main variable affecting patients’ survival.
All the miRNAs analyzed in our study have proven to be significantly associated with favorable prognostic factors. In particular, miR-150-5p and miR-155-5p were found to be inversely associated with Breslow’s depth, stage, and lymph node involvement. Furthermore, they seem to positively influence melanoma-specific survival. In line with us, Tembe and colleagues associated miR-150-5p with longer survivors and inversely associated to melanoma stage (mainly III and IV) [33]. Our findings seem to be confirmed by the more recent overexpression of miR-150-5p, which was found to inhibit the proliferation, migration, and invasion of melanoma cells [15]. Possible mechanisms explaining its favorable activity in melanoma are the inhibition of the transcription factor MYB [15] and its association to aerobic glycolysis through SIX1 repression [28]. Regarding miR-155-5p, this was already identified among upregulated miRNAs, predicting good prognosis after surgical excision [11]. This miRNA seems to bind and translationally inhibit TYRP1 mRNA [16]. Indeed, two competing miRNAs pair, namely miR-16 acting as a stabilizer and miR-155-5p as an inhibitor, inter-play in the TYRP1 stability [34].
The other two miRNAs studied here, namely miR-204-5p and miR-211-5p, belong to the same family (microRNA mir204/211 family) and they are encoded by the TRPM3 and TRPM1 gene, respectively. In our cohort, miR-204-5p was inversely associated with melanoma ulceration, stage, and depth. Similar results were highlighted by Galasso and co-workers on the association of miR-204-5p with important clinical parameters, such as Breslow’s depth [7]. Our results show that miR-211-5p favorably influenced melanoma-specific survival but did not influence the overall survival. In disagreement with us, Lu and colleagues found a negative influence of miR-211-5p on patients’ overall survival [10], even if the development of most melanomas has been specifically associated with the depletion of miR-211 transcript levels, thus supporting its positive effect [17]. In agreement with our results, Santoni and co-workers reported that the miR-211 expression is linked to tumor suppressor functions [29]. Furthermore, a direct connection has been shown between miR-211-5p and MITF, as it acts as a transcription factor for TRPM1, which within its sixth intron encodes for miR211-5p [17]. Consequently, MITF has been shown to suppress melanoma metastasis through its transcriptional activation of miR-211 via the TRPM1 promoter. In our cohort, similarly to miR-211-5p, MITF expression was also associated to longer melanoma-specific survival, findings that are supported by Mazar and colleagues [17]. Interestingly, TRPM1 was not directly linked to patients’ survival but to favorable pathological variables, such as Breslow’s depth and absence of ulceration, which is in line with other authors who defined TRPM1 loss as an excellent marker of melanoma aggressiveness [29,35,36]. Immune response molecules, namely CD2 and PD-L1, were chosen in our study to define immune-type melanomas, which have been associated with improved patients’ survival [5]. Accordingly, in our samples, CD2 and PD-L1 were both associated to variables of good prognosis, such as lower CM stages, thinner CM, as well as to longer CM-specific survival. Consequently, CD2 has already been proposed as an independent predictor of disease recurrence and overall survival among patients with primary cutaneous melanoma [37]. The fact that CMs have higher expression of PD-L1 and CD2 is most likely due to an anticancer immune response, as is usually indicated by tumor-infiltrating lymphocytes [37,38].
Our data suggest that the mutational status of BRAF-V600 and NRAS-Q61 did not vary among geographical regions and altitudes of residence. Regression analysis confirmed that mutational burden was an independent variable that was not influenced by altitude of residence but by some clinical characteristics of CM [39,40,41] and patients’ demographics. Contrary to previous studies [42,43], in our cohort, BRAFV600 mutations were more frequently detected in men. This result is likely due to our selection criteria as CMs of male patients were analyzed from the trunk, which has already been reported as a preferential anatomical site associated with BRAF mutation [44]. Patient age showed a clear influence on the documented BRAF mutation rate in this study, with younger patients prevailing in the BRAF-mutated group in comparison with NRAS-mutated as well as BRAF/NRAS wild-type ones. BRAF-mutated melanomas are indeed characterized by a young age at diagnosis, absence of chronic sun damage of the skin, and melanoma occurrence on the trunk [45], which closely reflect the features of our BRAF-mutated patients. NRAS mutations were frequently recorded in CMs located on the lower limbs (7.7%, n = 22 of 287) in our dataset, in agreement with others [44,46]. The trunk is commonly considered a site of intermittent sun exposure, while the lower limbs a chronic sun-damaged skin area (CSD). Therefore, our data confirm that the type of UV exposure is a determinant influencing the mutational burden of BRAF V600 and NRAS Q61 [44,46].
The overall detection rate of BRAF in our cohort was 33% (n = 96 of 288), which appears to be in line with the current literature [47]. NRAS mutation frequencies accounted for 21% (n = 62 of 288) in our study, which is also in line with the reported data [48]. Notably, NRAS-mutated melanomas in our study were related to lower CD2 expression levels. The latter finding might be linked to oncogenic RAS, which can disrupt antitumor immunity, resulting in decreased immunogenicity of the RAS-transformed cells [49].

4. Materials and Methods

4.1. Patients and Samples

This was a population-based retrospective study. The study was part of the MEMS project (www.mems-interreg.eu) funded by the European Union’s Interreg V-A Italia-Austria 2014−2020 program. Participating centers included the University Hospitals of Trieste (Italy) and Innsbruck (Austria), the Central Hospital of Bolzano (Italy), and the National Cancer Institute of Aviano (CRO-Italy). The study was conducted in accordance with the Declaration of Helsinki, and it was approved by the following Ethical Committees: Ethical Committee of the Health Agency of the province of Bozen (protocol number 0081449, 01/07/2019), Ethical Committee of the Friuli-Venezia Giulia region (protocol number 20817, 02.07.2018), and the Ethical Committee of the Medical University of Innsbruck (protocol number 1177/2017 and 1182/2018). Written informed consent was obtained from all individual participants included in the study with the exception of deceased patients (permission granted by the Ethical Committee).
Cases of primary CM diagnosed between 01/01/2006 and 31/12/2015 included in this study were retrieved from the histopathological databases at the corresponding participating centers.
Inclusion criteria were the following: (i) Unequivocal diagnosis of primary cutaneous melanoma with a tumor thickness ≥ 1.8 mm (this thickness was chosen to provide tissue slides for molecular analyses without consuming the entire tissue block); (ii) location in the head/neck, trunk/limbs, and acral sites—trunk and head (neck and face) were chosen for men, and higher and lower limbs for women. These sites were chosen because they are mostly gender-related. Cases were matched among participant groups per gender, anatomical site, age range, and tumor thickness; and (iii) availability of the fixed- and paraffin-embedded block. The cohort included also patients with criteria (i), (ii), and (iii) of any anatomical site in patients aged ≥90 years or <30 years as extreme values of the sample. In patients with more than one primary CM, only the first CM was included while subsequent melanomas were excluded from the study.
All CMs were reviewed and grouped into stages according to the AJCC TNM classification 8th edition [19]. Moreover, for all cases, we recorded Breslow’s thickness, presence/absence of ulceration, and anatomical site. With regard to patients’ demographics, we recorded gender, age at diagnosis, and altitude of the geographical area of residence. In addition, follow-up data were collected from the date of diagnosis of the primary CM until 31/12/2018 or death.
The dataset was also analyzed for the altitude of residence.

4.2. Immunohistochemistry

Four or 2-μm-thick sections were cut from each tissue block for immunohistochemical staining using a fully automatized assay based on the BenchMark ULTRA system (Ventana-Roche Diagnostics, Tucson, AZ 85755, USA). The following antibodies were used: the VE1 clone (Ventana Medical System, Tucson, AZ 85755, USA) at a dilution of 1:100 for the detection of BRAF V600E mutation; the rabbit monoclonal anti-human N-Ras Q61R, clone SP174 (Ventana Medical System-Abcam, Tucson, AZ 85755, USA) at a dilution of 1:100 for NRAS Q61R analysis. Sections were dried at 60°C for 30 min and after dewaxing, the slides were pretreated with Cell Conditioning 1 (Ventana Medical System, Tucson, AZ 85755, USA) for 64 min for antigen unmasking and submitted to peroxidase inhibition. Primary antibody decoration was carried out at 37 °C for 16 min for BRAFV600E and 32 min for NRASQ61R. Chromogenic detection was performed using Diaminobenzidine chromogen (DAB) for BRAFV600E, while for NRASQ61R using the UltraView Universal Alkaline Phosphatase Red Detection Kit (Ventana Medical System, Tucson, AZ 85755, USA). Counterstaining was performed with Hematoxylin II for 5 min. After washing, slides were mounted as usual.
Concerning the immunohistochemistry analyses, tissue sections were scored as positive when at least 10% of melanoma cells were positively stained.
The criteria for unequivocal positive BRAF and NRAS staining included strong and medium cytoplasmic staining. Weak cytoplasmic diffuse staining and no staining were scored as negative. Tissue sections with equivocal staining were checked through digital droplet PCR (ddPCR) to confirm the presence or the absence of BRAF/NRAS mutations.

4.3. DNA Extraction and Digital Droplet PCR (ddPCR)

DNA was extracted from five 10-µm-thick tissue sections using the Maxwell® RSC (Promega, Madison, WI 53711-5399, USA) device according to the manufacturer’s instructions. Samples were stored at 4 °C until use. BRAF and NRAS mutations were detected by digital droplet PCR (Biorad, Hercules, CA 94547, USA; Cat. No. 12001037, Cat. No. 12001006). Primers and probes for wild-type and mutated BRAF and NRAS genes were purchased by Biorad (Biorad, Hercules, CA 94547, USA; Cat. No. 12001037, Cat. No. 12001006). The reaction was carried out in a solution containing 10 μL of ddPCRTM Supermix for probes (no dUTP) (Biorad, Hercules, CA 94547, USA; Cat. No. 1863024), 1 μL of mutations Screening Assay, and 25 ng of DNA. The droplets were generated using a QX200TM Droplet Generator (BioRad, Hercules, CA 94547, USA). Subsequently, emulsions were transferred onto a 96-well PCR plate (Biorad, Hercules, CA 94547, USA) and submitted to PCR amplification as follows: denaturation for 10 min at 95 °C, 40 cycles of 94°C for 30 s, annealing/extension for 1 min at 55 °C, and one cycle at 98 °C for 10 min. After amplification, droplets were read in the QX200TM Droplet Reader (BioRad, Hercules, CA 94547, USA). Data analysis was performed using QuantaSoftTM software.

4.4. RNA Analysis

4.4.1. Total RNA extraction

Five 10-μm-thick sections were cut from micro-dissected FFPE tissue blocks and total RNA was isolated using a Maxwell® RSC (Promega, Madison, WI 53711-5399, USA) device according to the manufacturer’s instructions. The protocol was subdivided into two parts: the first part refers to the Maxwell® RSC RNA FFPE kit (Cat. No. AS1440, Promega, Madison, WI 53711-5399, USA) where the sections were de-waxed, digested with proteinase K, de-crosslinked, and treated with DNase I. The subsequent steps follow the Maxwell® RSC miRNA Tissue Kit instructions (Cat. No. AS1460, Promega, Madison, WI 53711-5399, USA). The 1-Thioglycerol/Homogenization solution and the Lysis Buffer (MC501C) were added to the aqueous phase. The entire volume of lysate was added to Maxwell® RSC Cartridge and extracted with its specific method. The total RNA was eluted in 50 μL of nuclease-free water. Samples were split into aliquots and stored at −80 °C.

4.4.2. Reverse Transcription and Real-Time PCR Assays of mRNAs

As regards the analysis of target mRNA gene expression, cDNA was synthesized using random primers and 250 U M-MLV reverse transcriptase (Thermo Fischer Scientific, Waltham, MA 02451, USA; Cat. No. 28025013) as previously described [50]. As regards quantitative Real-time PCR, 60 ng of cDNA was added to JumpStartTM 2X Taq ReadyMixTM (Sigma-Aldrich®, St. Louis, MO 63103, USA; Cat. No. D7440), together with 210 nM of TaqMan probe (IDT, Coralville, IA 52241, USA), 320 nM of reverse and forward primers (IDT, Coralville, IA 52241, USA), Rox100, and made up to a final volume of 21 μL with sterile water. Primers and Taqman probes were designed using the on-line Primer3Plus tool (see Table S1) [51] and their specificity was checked through the Genome Browser BLAT tool [52]. Each reaction was carried out in duplicate. Real-time PCR analysis was performed on a Mastercycler® ep Realplex (Eppendorf, Hamburg, Germany) as reported in Table S1. For relative quantification, the “delta-delta Ct” method [53] was used where, as housekeeping, the geometric mean of at least 2 genes out of 4 analyzed in the present study was employed (see Supplementary Materials for details and Table S3 for efficiencies). Samples with a low concentration of total RNA and samples processed with Bouin’s fixative were excluded from the expression analysis.

4.4.3. Reverse Transcription and Real-Time PCR Assays of MicroRNAs

For miRNA detection, 40 ng of total RNA were reverse transcribed using the miRCURY® LNA® RT kit (Qiagen, Hilden, Germany; Cat. No. 339340) according to the manufacturer’s protocol. Real-time PCR was carried out using 0.4 ng of diluted cDNA (40X), Fast EvaGreen® qPCR Master Mix 2X (Biotium, Fremont, CA 94538, USA; Cat. No. 31003), and 1 μL of specific pre-designed validated miRCURY® LNA® miRNA PCR Assays (QIAGEN, Hilden, Germany; Cat. No. 339306) in a total reaction volume of 10 μL (see Tables S2 and S3 for details).
Each reaction was run in duplicate. Real-time PCR analysis was performed on a Mastercycler® ep Realplex (Eppendorf, Hamburg, Germany) using the following cycles’ conditions: 95 °C for 10 min, 45 cycles of 95 °C for 10 s, and 60 °C for 1 min. Furthermore, at the end of the procedure, the melting curve analysis was performed to evaluate the specificity of the amplified products. For relative quantification, the delta-delta Ct method was applied [53].

4.5. Molecular Subtypes

Samples were clustered into transcriptomic subtypes based on their high or low expression level as described in the TCGA classification [5] (see Supplementary Materials for details and Figure S6 for results).

4.6. Statistical Analyses

Parametric or non-parametric tests were performed after checking data distribution (D’Agostino-Pearson omnibus normality test and Shapiro-Wilk normality test). For normally distributed variables, the t-test or ANOVA test was used. The association of the ratio of the investigated genes at the mRNA level and miRNA with categorical variables was analyzed with the Mann–Whitney test. The Spearman’s rank correlation test was run to identify a possible correlation between Breslow’s depth and mRNA or miRNA expression levels.
Trends across the ordered group were assessed by submitting mRNA and miRNA expression levels to an extension of the Wilcoxon rank-sum test developed by Cuzick [54]. For survival analysis, the normalized RT-qPCR ratios of the analyzed genes and miRNAs were dichotomized according to their median value. Patients with lower gene expression in comparison with the corresponding median value were classified as lower status, while patients with higher values were classified as higher status of gene expression. The log-rank test was used to investigate whether each molecular and clinical-pathological variable affected patients’ survival.
For melanoma-specific survival (MSS), the time between the date of diagnosis and the date of death or last follow-up was used; for overall survival (OS), the period of time from diagnosis to death from any cause or last follow-up was considered. The Cox proportional hazard regression method was applied to analyze patients’ demographics (age at diagnosis, gender, altitude of residence, geographical areas), pathological covariates (stage, ulceration, anatomical site), mutational status, and gene and miRNA expression levels in the entire cohort of patients, to test the joint effects of the covariates on patients’ survival. The proportional hazard assumption was checked by Shoenfeld’s residuals method.
The combined impact of multiple parameters on routine BRAFV600 and/or NRASQ61 mutational status was evaluated through logistic regression analysis. A statistical model to predict the probability of BRAF mutations for individual patients was developed, including age at diagnosis, sex, geographical area of residence, altitude of residence, Breslow’s depth, the presence of ulceration, and the lymph node involvement at diagnosis as independent variables. Pearson χ2 goodness-of-fit test was used to test for the fitted model.
Outliers were excluded from the box-whiskers plots and scatter-dot plot representations. All statistical analyses were two-sided and values of p < 0.05 were considered statistically significant. Statistical analysis was carried out with the GraphPad Prism 6.0 software (San Diego, CA 92108, USA) and the Stata/SE 16.0 package (StataCorp, College Station, TX 77845-4512, USA).

5. Conclusions

The MEMS project was a retrospective study where primary cutaneous melanomas were analyzed at the molecular level and these characteristics were related with pathological and environmental features. The heterogeneous cohort was composed of patients who had been living in different geographic areas and at different altitudes of residence.
In conclusion, our findings highlight that there are differences in the expression profiles of certain mRNAs and miRNAs with respect to the altitude of residence. Namely, TYRP1 and miR-204-5p were highly expressed in patients living at higher altitudes, unlike miR-150-5p, miR-155-5p, and miR-211-5p. Since miRNAs are highly regulated by reactive oxygen species, it is possible that different regulatory mechanisms characterize CMs at different altitudes due to the different environment and UVR intensity.
According to our results, shorter melanoma-specific survival is recorded in patients living at higher altitudes, which is likely due to societal/cultural issues rather than to a causative effect of the residence at higher altitude. This finding could be associated to our molecular results; indeed, the expression of the onco-suppressor miR-150-5p, miR-155-5p, and miR-211-5p were negatively associated with the residence altitude.
Admittedly, our investigation on the effect of URV exposure has not taken into consideration the patients’ periods of residence and their recreational and work activities: This is an important limitation of the present study. Therefore, the results of our study on the survival and altitude of residence need to be confirmed by further studies.

Supplementary Materials

The following are available online at https://www.mdpi.com/2072-6694/12/10/2796/s1, Figure S1: Box plot representing patients’ age between genders, Figure S2: Box plot representing mRNA expression levels resulted different according to patients’ age, Figure S3: Box plot representing mRNA and miRNA expression levels resulted different according to the anatomical site, Figure S4: Box plot representing mRNA and miRNA expression levels resulted different according to the presence or absence of lymph nodes, Figure S5: Box plot representing mRNA and miRNA expression levels resulted different according to the presence of BRAF and NRAS mutations title, Figure S6: Bar plot representing the percentage of CM cases per tumor stage and lymph node involvement divided by molecular subtype, Figure S7: Kaplan Meier survival curves for overall survival (OS) adjusted for age at diagnosis for altitude of residence ranges, Figure S8: Kaplan Meier survival curves for relapse free survival (RFS) for CD2, Table S1: Primers and TaqMan probes for gene expression analysis, Table S2: Sequences and accession numbers of microRNAs, Table S3: Results of standard curves to set up qPCR analyses, Table S4: Results of the Cox Multivariate Analysis (p < 0.0001) for overall survival in the entire cohort of patients, Table S5: Results of associations of HIF1A expression levels with environmental, clinical and pathological variables, Table S6: Results of correlation of HIF1A expression levels with miR-155-5p.The supplementary Materials include also explanations.

Author Contributions

Conceptualization, S.B.; methodology, D.B., J.Z. and S.B.; formal analysis, E.D.M., F.R., J.Z., W.J., E.J. and S.B.; investigation, D.B..; resources, V.C., K.E., G.M., C.N., G.W., B.Z., F.Z. and I.Z.; data curation, E.D.M., D.B., C.C., G.M., C.N., K.E., G.W., B.Z., J.Z., E.J., W.J., M.S., F.R., V.C., G.S., F.Z., I.Z. and S.B.; writing—original draft preparation, E.D.M. and S.B.; writing—review and editing, D.B., V.C., C.C., F.R., W.J., G.W., B.Z., J.Z., E.J., M.S., G.M., C.N., K.E., F.Z., G.S., I.Z.; supervision, V.C., K.E., C.N. and M.S.; project administration, S.B.; funding acquisition, S.B., K.E., C.N. and M.S. All authors have read and agreed to the published version of the manuscript.

Funding

This study was supported by the project MEMS under the Grant agreement ITAT1018 as part of the EU program Interreg V-A Italia-Austria 2014−2020.

Acknowledgments

The authors wish to thank Simon Schwendinger for expert help with digital droplet PCR, and Birgit Moser, Nadja Kühner and Cristina Bottin and Ermanno Nardon for excellent technical assistance. The authors would like to thank the Interreg V-A Italia-Austria 2014−2020 program which supported the project MEMS under the grant agreement ITAT1018.

Conflicts of Interest

The authors declare no conflict of interest.

References

  1. Chang, C.; Murzaku, E.C.; Penn, L.; Abbasi, N.R.; Davis, P.D.; Berwick, M.; Polsky, D. More skin, more sun, more tan, more melanoma. Am. J. Public Health 2014, 104, e92–e99. [Google Scholar] [CrossRef]
  2. Emri, G.; Paragh, G.; Tosaki, A.; Janka, E.; Kollár, S.; Hegedûs, C.; Gellén, E.; Horkay, I.; Koncz, G.; Remenyik, É. Ultraviolet radiation-mediated development of cutaneous melanoma: An update. J. Photochem. Photobiol. B Boil. 2018, 185, 169–175. [Google Scholar] [CrossRef]
  3. Roider, E.M.; Fisher, D.E. Red Hair, Light Skin, and UV-Independent Risk for Melanoma Development in Humans. JAMA Dermatol. 2016, 152, 751–753. [Google Scholar] [CrossRef] [Green Version]
  4. Narayanan, D.L.; Saladi, R.N.; Fox, J.L. Review: Ultraviolet radiation and skin cancer. Int. J. Dermatol. 2010, 49, 978–986. [Google Scholar] [CrossRef]
  5. Akbani, R.; Akdemir, K.C.; Aksoy, B.A.; Albert, M.; Ally, A.; Amin, S.; Arachchi, H.; Arora, A.; Auman, J.T.; Ayala, B.; et al. Genomic Classification of Cutaneous Melanoma. Cell 2015, 161, 1681–1696. [Google Scholar] [CrossRef] [PubMed]
  6. Sensi, M.L.; Nicolini, G.; Petti, C.; Bersani, I.; Lozupone, F.; Molla, A.; Vegetti, C.; Nonaka, D.; Mortarini, R.; Parmiani, G.; et al. Mutually exclusive NRASQ61R and BRAFV600E mutations at the single-cell level in the same human melanoma. Oncogene 2006, 25, 3357–3364. [Google Scholar] [CrossRef] [PubMed] [Green Version]
  7. Galasso, M.; Morrison, C.; Minotti, L.; Corrà, F.; Zerbinati, C.; Agnoletto, C.; Baldassari, F.; Fassan, M.; Bartolazzi, A.; Vecchione, A.; et al. Loss of miR-204 expression is a key event in melanoma. Mol. Cancer 2018, 17, 71. [Google Scholar] [CrossRef] [PubMed] [Green Version]
  8. Hanniford, D.; Zhong, J.; Koetz, L.; Gaziel-Sovran, A.; Lackaye, D.J.; Shang, S.; Pavlick, A.; Shapiro, R.; Berman, R.S.; Darvishian, F.; et al. A miRNA-Based Signature Detected in Primary Melanoma Tissue Predicts Development of Brain Metastasis. Clin. Cancer Res. 2015, 21, 4903–4912. [Google Scholar] [CrossRef] [PubMed] [Green Version]
  9. Jayawardana, K.; Schramm, S.-J.; Tembe, V.; Müller, S.; Thompson, J.F.; Scolyer, R.A.; Mann, G.J.; Yang, J. Identification, Review, and Systematic Cross-Validation of microRNA Prognostic Signatures in Metastatic Melanoma. J. Investig. Dermatol. 2016, 136, 245–254. [Google Scholar] [CrossRef] [Green Version]
  10. Lu, T.; Chen, S.; Qu, L.; Wang, Y.; Chen, H.-D.; He, C. Identification of a five-miRNA signature predicting survival in cutaneous melanoma cancer patients. PeerJ 2019, 7, e7831. [Google Scholar] [CrossRef] [Green Version]
  11. Segura, M.F.; Belitskaya-Lévy, I.; Rose, A.E.; Zakrzewski, J.; Gaziel, A.; Hanniford, D.; Darvishian, F.; Berman, R.S.; Shapiro, R.L.; Pavlick, A.C.; et al. Melanoma MicroRNA Signature Predicts Post-Recurrence Survival. Clin. Cancer Res. 2010, 16, 1577–1586. [Google Scholar] [CrossRef] [PubMed] [Green Version]
  12. Boyle, G.M.; Woods, S.L.; Bonazzi, V.; Stark, M.S.; Hacker, E.; Aoude, L.G.; Dutton-Regester, K.; Cook, A.L.; Sturm, R.; Hayward, N.K. Melanoma cell invasiveness is regulated by miR-211 suppression of the BRN2 transcription factor. Pigment. Cell Melanoma Res. 2011, 24, 525–537. [Google Scholar] [CrossRef] [PubMed]
  13. Díaz-Martínez, M.; Benito-Jardón, L.; Alonso, L.; Koetz-Ploch, L.; Hernando, E.; Teixidó, J. miR-204-5p and miR-211-5p Contribute to BRAF Inhibitor Resistance in Melanoma. Cancer Res. 2017, 78, 1017–1030. [Google Scholar] [CrossRef] [PubMed] [Green Version]
  14. Luan, W.; Qian, Y.; Ni, X.; Bu, X.; Xia, Y.; Wang, J.; Ruan, H.; Ma, S.; Xu, B. miR-204-5p acts as a tumor suppressor by targeting matrix metalloproteinases-9 and B-cell lymphoma-2 in malignant melanoma. OncoTargets Ther. 2017, 10, 1237–1246. [Google Scholar] [CrossRef] [Green Version]
  15. Sun, X.; Zhang, C.; Cao, Y.; Liu, E. miR-150 Suppresses Tumor Growth in Melanoma through Downregulation of MYB. Oncol. Res. Featur. Preclin. Clin. Cancer Ther. 2019, 27, 317–323. [Google Scholar] [CrossRef]
  16. Soengas, M.S.; Hernando, E. TYRP1 mRNA goes fishing for miRNAs in melanoma. Nat. Cell Biol. 2017, 19, 1311–1312. [Google Scholar] [CrossRef]
  17. Mazar, J.; Deyoung, K.; Khaitan, D.; Meister, E.; Almodovar, A.; Goydos, J.; Ray, A.; Perera, R.J. The Regulation of miRNA-211 Expression and Its Role in Melanoma Cell Invasiveness. PLoS ONE 2010, 5, e13779. [Google Scholar] [CrossRef] [Green Version]
  18. Orimo, H.; Ito, H.; Suzuki, T.; Araki, A.; Hosoi, T.; Sawabe, M. Reviewing the definition of “elderly”. Geriatr. Gerontol. Int. 2006, 6, 149–158. [Google Scholar] [CrossRef]
  19. Brierley, J.D.; Gospodarowicz, M.K.; Wittekind, C. (Eds.) TNM Classification of Malignant Tumours, 8th ed.; Wiley-Blackwell: Oxford, UK, 2017; p. 272. [Google Scholar]
  20. Singh, G.; Singh, L.C.G.K. High altitude dermatology. Indian J. Dermatol. 2017, 62, 59–65. [Google Scholar] [CrossRef]
  21. Galibert, M.-D.; Carreira, S.; Goding, C.R. The Usf-1 transcription factor is a novel target for the stress-responsive p38 kinase and mediates UV-induced Tyrosinase expression. EMBO J. 2001, 20, 5022–5031. [Google Scholar] [CrossRef] [Green Version]
  22. Bell, A.; Bell, D.; Chakravarti, N.; Ma, J.; Henton, N.; Prieto, V.G. Detection of a MicroRNA molecular signature of ultraviolet radiation in the superficial regions of melanocytic nevi on sun-exposed skin. Mod. Pathol. 2018, 31, 1744–1755. [Google Scholar] [CrossRef] [PubMed]
  23. Lin, Y.-H. MicroRNA Networks Modulate Oxidative Stress in Cancer. Int. J. Mol. Sci. 2019, 20, 4497. [Google Scholar] [CrossRef] [PubMed] [Green Version]
  24. Serocki, M.; Bartoszewska, S.; Janaszak-Jasiecka, A.; Ochocka, R.J.; Collawn, J.F.; Bartoszewski, R. miRNAs regulate the HIF switch during hypoxia: A novel therapeutic target. Angiogenesis 2018, 21, 183–202. [Google Scholar] [CrossRef] [PubMed] [Green Version]
  25. Hufbauer, M.; Lazic, D.; Reinartz, M.; Akgül, B.; Pfister, H.; Weissenborn, S.J. Skin tumor formation in human papillomavirus 8 transgenic mice is associated with a deregulation of oncogenic miRNAs and their tumor suppressive targets. J. Dermatol. Sci. 2011, 64, 7–15. [Google Scholar] [CrossRef] [PubMed]
  26. Syed, D.N.; Khan, M.I.; Shabbir, M.; Mukhtar, H. MicroRNAs in skin response to UV radiation. Curr. Drug Targets 2013, 14, 1128–1134. [Google Scholar] [CrossRef] [Green Version]
  27. Sun, J.-S.; Zhang, X.-L.; Yang, Y.-J.; Nie, Z.-G.; Zhang, Y. Hypoxia promotes C-X-C chemokine receptor type 4 expression through microRNA-150 in pancreatic cancer cells. Oncol. Lett. 2015, 10, 835–840. [Google Scholar] [CrossRef] [Green Version]
  28. Yang, X.; Zhao, H.; Yang, J.; Ma, Y.; Liu, Z.; Li, C.; Wang, T.; Yan, Z.; Du, N. MiR-150-5p regulates melanoma proliferation, invasion and metastasis via SIX1-mediated Warburg Effect. Biochem. Biophys. Res. Commun. 2019, 515, 85–91. [Google Scholar] [CrossRef]
  29. Santoni, G.; Morelli, M.B.; Santoni, M.; Nabissi, M.; Marinelli, O.; Amantini, C. Targeting Transient Receptor Potential Channels by MicroRNAs Drives Tumor Development and Progression. Adv. Exp. Med. Biol. 2020, 1131, 605–623. [Google Scholar] [CrossRef]
  30. Thiersch, M.; Swenson, E.R. High Altitude and Cancer Mortality. High Alt. Med. Boil. 2018, 19, 116–123. [Google Scholar] [CrossRef]
  31. Haluza, D.; Simic, S.; Moshammer, H. Temporal and Spatial Melanoma Trends in Austria: An Ecological Study. Int. J. Environ. Res. Public Heal. 2014, 11, 734–748. [Google Scholar] [CrossRef] [Green Version]
  32. Aceituno-Madera, P.; Buendía-Eisman, A.; Olmo, F.; Jiménez-Moleón, J.-J.; Serrano-Ortega, S.; Olmo-Reyes, F.J. Melanoma, altitud y radiación UVB. Actas Dermo-Sifiliográficas 2011, 102, 199–205. [Google Scholar] [CrossRef] [PubMed]
  33. Tembe, V.; Schramm, S.-J.; Stark, M.S.; Patrick, E.; Jayaswal, V.; Tang, Y.H.; Barbour, A.P.; Hayward, N.K.; Thompson, J.F.; Scolyer, R.A.; et al. MicroRNA and mRNA expression profiling in metastatic melanoma reveal associations with BRAF mutation and patient prognosis. Pigment. Cell Melanoma Res. 2015, 28, 254–266. [Google Scholar] [CrossRef] [PubMed]
  34. Gilot, D.; Migault, M.; Bachelot, L.; Journé, F.; Rogiers, A.; Donnou-Fournet, E.; Mogha, A.; Mouchet, N.; Pinel-Marie, M.-L.; Mari, B.; et al. A non-coding function of TYRP1 mRNA promotes melanoma growth. Nat. Cell Biol. 2017, 19, 1348–1357. [Google Scholar] [CrossRef] [PubMed]
  35. Brożyna, A.A.; Guo, H.; Yang, S.-E.; Cornelius, L.; Linette, G.; Murphy, M.; Sheehan, C.; Ross, J.; Slominski, A.T.; Carlson, J.A. TRPM1 (melastatin) expression is an independent predictor of overall survival in clinical AJCC stage I and II melanoma patients. J. Cutan. Pathol. 2017, 44, 328–337. [Google Scholar] [CrossRef] [PubMed]
  36. Guo, H.; Carlson, J.A.; Slominski, A.T. Role of TRPM in melanocytes and melanoma. Exp. Dermatol. 2012, 21, 650–654. [Google Scholar] [CrossRef] [Green Version]
  37. Harcharik, S.; Bernardo, S.; Moskalenko, M.; Pan, M.; Sivendran, M.; Bell, H.; Hall, L.D.; Castillo-Martin, M.; Fox, K.; Cordon-Cardo, C.; et al. Defining the role of CD2 in disease progression and overall survival among patients with completely resected stage-II to -III cutaneous melanoma. J. Am. Acad. Dermatol. 2014, 70, 1036–1044.e3. [Google Scholar] [CrossRef] [PubMed]
  38. Taube, J.M.; Young, G.D.; McMiller, T.L.; Chen, S.; Salas, J.T.; Pritchard, T.S.; Xu, H.; Meeker, A.K.; Fan, J.; Cheadle, C.; et al. Differential Expression of Immune-Regulatory Genes Associated with PD-L1 Display in Melanoma: Implications for PD-1 Pathway Blockade. Clin. Cancer Res. 2015, 21, 3969–3976. [Google Scholar] [CrossRef] [Green Version]
  39. Bauer, J.; Büttner, P.; Murali, R.; Okamoto, I.; Kolaitis, N.A.; Landi, M.T.; Scolyer, R.A.; Bastian, B.C. BRAF mutations in cutaneous melanoma are independently associated with age, anatomic site of the primary tumor, and the degree of solar elastosis at the primary tumor site. Pigment. Cell Melanoma Res. 2011, 24, 345–351. [Google Scholar] [CrossRef]
  40. Bonin, S.; Albano, A.; Di Meo, N.; Gatti, A.; Stinco, G.; Zanconati, F.; Trevisan, G. Cutaneous melanoma frequencies and seasonal trend in 20 years of observation of a population characterised by excessive sun exposure. Radiol. Oncol. 2015, 49, 379–385. [Google Scholar] [CrossRef] [Green Version]
  41. Pracht, M.; Mogha, A.; Lespagnol, A.; Fautrel, A.; Mouchet, N.; Le Gall, F.; Paumier, V.; Lefeuvre-Plesse, C.; Rioux-Leclerc, N.; Mosser, J.; et al. Prognostic and predictive values of oncogenicBRAF, NRAS, c-KITandMITFin cutaneous and mucous melanoma. J. Eur. Acad. Dermatol. Venereol. 2015, 29, 1530–1538. [Google Scholar] [CrossRef]
  42. Lee, J.-H.; Choi, J.-W.; Kim, Y.-S. Frequencies of BRAF and NRAS mutations are different in histological types and sites of origin of cutaneous melanoma: A meta-analysis. Br. J. Dermatol. 2011, 164, 776–784. [Google Scholar] [CrossRef] [PubMed]
  43. Saldanha, G.; Potter, L.; DaForno, P.; Pringle, J.H. Cutaneous Melanoma Subtypes Show Different BRAF and NRAS Mutation Frequencies. Clin. Cancer Res. 2006, 12, 4499–4505. [Google Scholar] [CrossRef] [PubMed] [Green Version]
  44. Kim, S.; Hahn, H.J.; Lee, Y.W.; Choe, Y.B.; Ahn, K.J.; Kim, S.-N. Metaanalysis of BRAF mutations and clinicopathologic characteristics in primary melanoma. J. Am. Acad. Dermatol. 2015, 72, 1036–1046.e2. [Google Scholar] [CrossRef] [PubMed]
  45. Schadendorf, D.; Akkooi, A.C.J.; Berking, C.; Griewank, K.G.; Gutzmer, R.; Hauschild, A.; Stang, A.; Roesch, A.; Ugurel, S. Melanoma. Lancet 2018, 392, 971–984. [Google Scholar] [CrossRef]
  46. Maldonado, J.L.; Fridlyand, J.; Patel, H.; Jain, A.N.; Busam, K.; Kageshita, T.; Ono, T.; Albertson, N.G.; Pinkel, D.; Bastian, B.C. Determinants of BRAF mutations in primary melanomas. J. Natl. Cancer Inst. 2003, 95, 1878–1890. [Google Scholar] [CrossRef] [Green Version]
  47. Thomas, N.E.; Edmiston, S.N.; Alexander, A.; Groben, P.A.; Parrish, E.; Kricker, A.; Armstrong, B.K.; Anton-Culver, H.; Gruber, S.B.; From, L.; et al. Association Between NRAS and BRAF Mutational Status and Melanoma-Specific Survival Among Patients With Higher Risk Primary Melanoma. JAMA Oncol. 2015, 1, 359–368. [Google Scholar] [CrossRef] [Green Version]
  48. Johnson, D.B.; Puzanov, I. Treatment of NRAS-mutant melanoma. Curr. Treat. Options Oncol. 2015, 16, 15. [Google Scholar] [CrossRef]
  49. Mandalà, M.; Merelli, B.; Massi, D. Nras in melanoma: Targeting the undruggable target. Crit. Rev. Oncol. 2014, 92, 107–122. [Google Scholar] [CrossRef]
  50. Nardon, E.; Donada, M.; Bonin, S.; Dotti, I.; Stanta, G. Higher random oligo concentration improves reverse transcription yield of cDNA from bioptic tissues and quantitative RT-PCR reliability. Exp. Mol. Pathol. 2009, 87, 146–151. [Google Scholar] [CrossRef]
  51. Untergasser, A.; Nijveen, H.; Rao, X.; Bisseling, T.; Geurts, R.; Leunissen, J.A. Primer3Plus, an enhanced web interface to Primer3. Nucleic Acids Res. 2007, 35, W71–W74. [Google Scholar] [CrossRef] [Green Version]
  52. University of California. Genome Browser-BLAT. Available online: https://genome.ucsc.edu (accessed on 21 August 2018).
  53. Livak, K.J.; Schmittgen, T.D. Analysis of relative gene expression data using real-time quantitative PCR and the 2(-Delta Delta C(T)) Method. Methods 2001, 25, 402–408. [Google Scholar] [CrossRef] [PubMed]
  54. Cuzick, J. A wilcoxon-type test for trend. Stat. Med. 1985, 4, 87–90. [Google Scholar] [CrossRef] [PubMed]
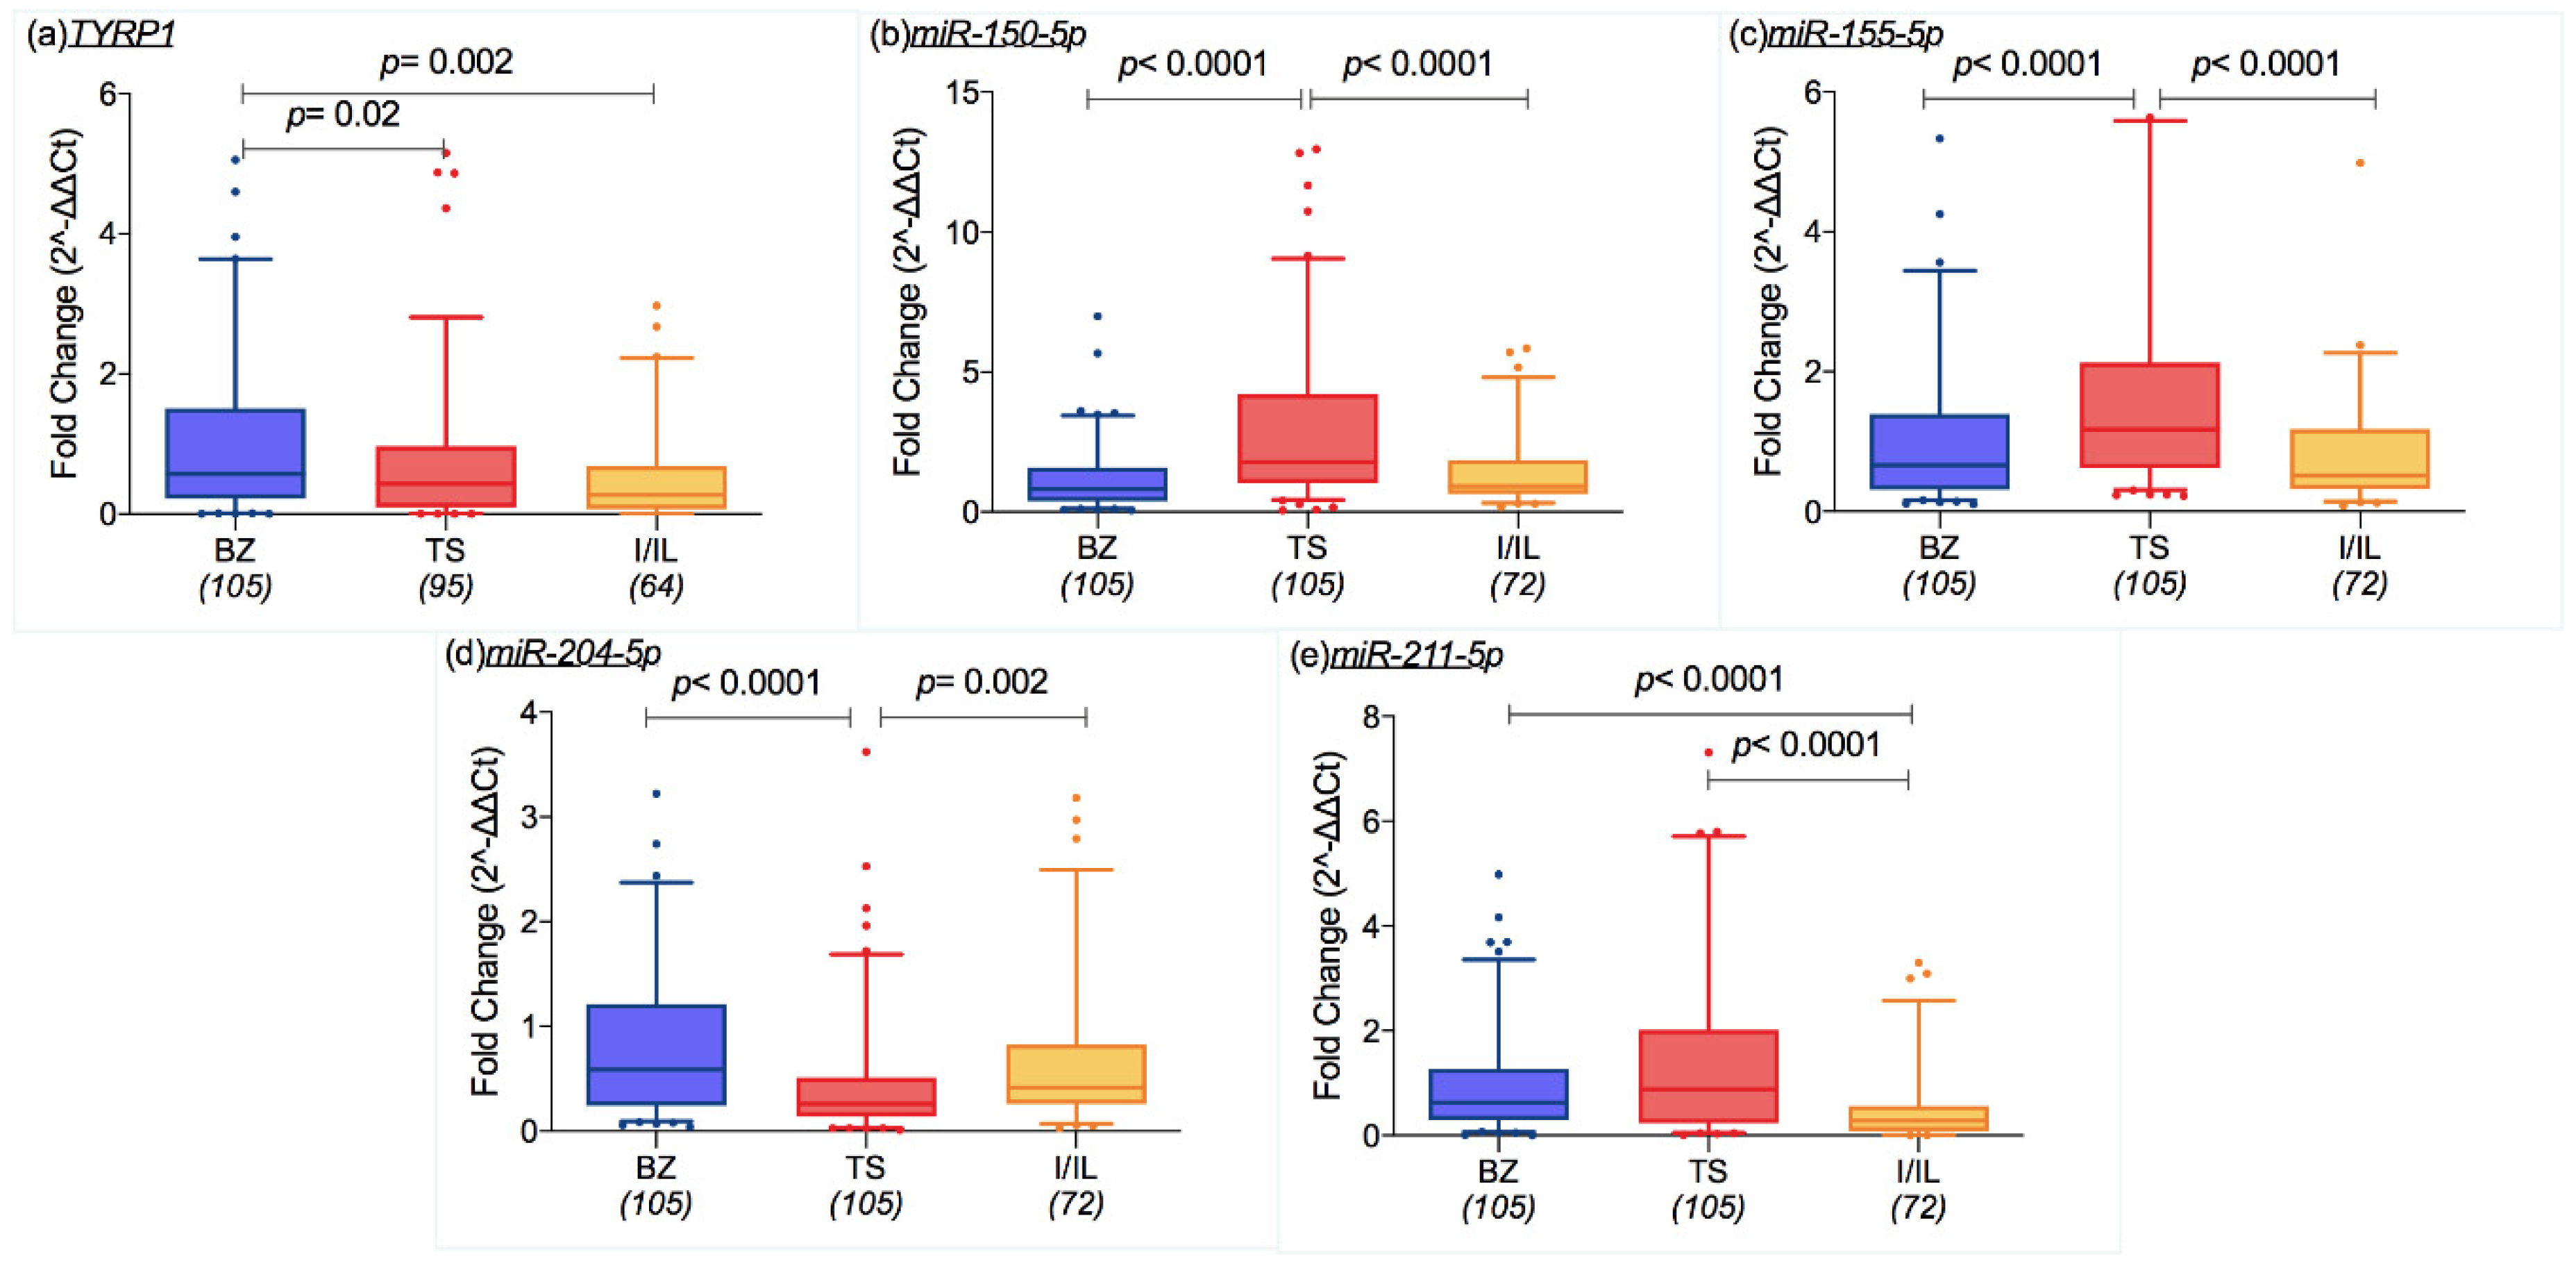
Figure 1. Box plots representing mRNA and miRNA expression levels (ratio of threshold cycles) that were different among the geographical areas: (a) Tyrosinase related protein 1 (TYRP1) was more expressed in the cohort of South Tyrol/Bozen (BZ), than in the province of Trieste TS and in the city of Innsbruck and Innsbruck-Land district (I/IL) (p = 0.02 and p = 0.002); (b) miR-150-5p and (c) miR-155-5p were more expressed in TS samples than BZ and I/IL ones (each comparison showed p < 0.0001); (d) miR-204-5p expression is lower in TS patients in comparison to those who live in BZ and I/IL (p < 0.0001, p = 0.002, in order); (e) miR-211-5p expression was lower in I/IL than the TS and BZ groups (both p < 0.0001). The box extends from the 25th to the 75th percentiles, the middle line indicates the median and the whiskers are the 5th and 95th percentiles (Mann–Whitney test).
Cancers 12 02796 g001
Figure 2. Box plots representing mRNA and miRNA expression levels (ratio of threshold cycles) that were different according to the altitude of residence: the expression of (a) miR-150-5p (p < 0.0001), (b) miR-155-5p (0.001), (d) miR-211-5p (p = 0.006) decreased as altitude increased, while the opposite trend was shown by (c) miR-204-5p (p < 0.0001). (e) TYRP1 expression increase from 300 m of altitude (p = 0.03). The box extends from the 25th to the 75th percentiles, the middle line indicates the median and the whiskers are the 5th and 95th percentiles (p values on the graph refer to Spearman’s correlation test). The altitude cut-off are ≤300 m, between 300 and 750 m, and ≥750 m.
Cancers 12 02796 g002
Figure 3. Scatter dot plots representing mRNA and miRNA expression levels (ratio of threshold cycles) that were different according to cutaneous melanoma’s (CM) stage: (a) CD2, (b) CD274, (c) miR-150-5p, (d) and miR-155-5p, and (e) miR-204-5p decreased as stage progressed (p < 0.0001, p = 0.002, p = 0.0001, p = 0.01 and p = 0.02). Middle lines refer to the median value (p values on the graph refer to Spearman’s rank correlation test using CM stage as the ranking variable).
Cancers 12 02796 g003
Figure 4. Scatter dot plots representing mRNA and miRNA expression levels (ratio of threshold cycles) were different according to CM thickness: (a) CD2 and (b) TRPM1 expression decreased as tumor thickness increased (p = 0.0001 and p = 0.0006); similarly, (c) miR-150-5p and (d) and miR-204-5p were negatively correlated with tumor thickness (p = 0.0001 and p = 0.0004). Middle lines refer to the median value (p values on the graph refer to Spearman’s rank correlation test using Breslow’s depth as a continuous variable).
Cancers 12 02796 g004
Figure 5. Kaplan Meier survival curves for melanoma-specific survival adjusted for age at diagnosis (MSS) for altitude of residence ranges (under 300 m, between 300 and 750 m, and above 750 m); (A) entire cohort, p = 0.0009; (B) entire cohort without stage IV CM, p = 0.006; (C) in cases from TS/BZ, p = 0.002 and (D) in cases from TS/BZ without stage IV CM, p = 0.02. The graphs of the survivor function were adjusted to the mean age of patients (57.6 years). MSS: melanoma-specific survival (p values on the graph refer to the log-rank test).
Cancers 12 02796 g005
Figure 6. Kaplan Meier survival curves for melanoma-specific survival (MSS) for CD2, p = 0.01 (a); CD274, p = 0.003 (b); MITF, p = 0.03 (c); miR-150-5p, p = 0.0001 (d); miR-155-5p, p = 0.004 (e); and miR-211-5p, p = 0.02 (f). The gene and miRNA expression were dichotomized in low expression and high expression for the median value of each transcript (p values on the graph refer to the Log-rank test).
Cancers 12 02796 g006
Table 1. Dataset characteristics.
Dataset Characteristics
Variable and its description BZ
n = 107
(35%)
TS
n = 125
(41%)
I/IL
n = 74
(24%)
Total
n = 306 (100%)
Geographical characteristics
Altitude of residenceMean in meter
(range)
884
(214–2153)
53
(0–253)
699
(564–1513)
p < 0.0001279
(0–2153)
Demographic characteristics
GenderMale59 of 107
(55%)
66 of 125
(52.8%)
41 of 74
(55.4%)
p = 0.9 166 of 306
(54%)
Female48 of 107
(45%)
59 of 125
(47.2%)
33 of 74
(44.6%)
140 of 306
(46%)
Mean ageYear
(range)
67
(19–101)
69
(16–98)
70
(21–100)
p = 0.5 69
(16–101)
Pathological characteristics
Localization §Head&Neck&face a25 of 107
(23.4%)
29 of 125
(23.2%)
18 of 74
(24.3%)
p = 0.9 72 of 306
(23.5%)
Trunk b35 of 107
(32.7%)
41 of 125
(32.8%)
25 of 74
(33.8%)
101 of 306
(33%)
Upper Limb c16 of 107
(15%)
16 of 125
(12.8%)
12 of 74
(16.2%)
44 of 306
(14.4%)
Lower Limb d30 of 107
(28%)
35 of 125
(28%)
18 of 74
(24.3%)
83 of 306
(27.1%)
Other sites e1 of 107
(0.9%)
4 of 125
(3.2%)
1 of 74
(1.4%)
6 of 306
(2%)
StageI B10 of 107
(9.3%)
9 of 125
(7.2%)
12 of 74
(16.2%)
p = 0.003 31 of 306
(10%).
II68 of 107
(63.6%)
89 of 125
(71.2 %)
34 of 74
(45.9%)
191 of 306
(62%)
III21 of 107
(19.6%)
25 of 125
(20%)
9 of 74
(12.2%)
55 of 306
(18%)
IV6 of 107
(5.6%)
2 of 125
(1.6%)
9 of 74
(12.2%)
17 of 306
(6%)
unknown2 of 107
(1.9%)
0 of 125
(0%)
10 of 74
(13.5%)
12 of 306
(4%)
Lymph nodesPositive23 of 107
(21.5%)
22 of 125
(17.6%)
13 of 74
(17.6%)
p = 0.7 58 of 306
(19%)
Negative82 of 107
(76.6%)
103 of 125
(82.4%)
51 of 74
(68.9%)
236 of 306
(77%)
unknown2 of 107
(1.9%)
0 of 125
(0%)
10 of 74
(13.5%)
12 of 306
(4%)
Breslow’s thicknessMean in mm
(range)
4.5
(1.8−27.6)
4.6
(1.8−30)
4.6
(1.8−30)
p = 0.9 4.6 mm
(1.8−30)
Ulceration statusyes52 of 107
(48.6%)
65 of 125
(52%)
23 of 74
(31%)
p = 0.3 140 of 306
(46%)
no54 of 107
(50.5%)
57 of 125
(45.6%)
34 of 74
(46%)
145 of 306
(47%)
unknown1 of 107
(0.9%)
3 of 125
(2.4%)
17 of 74
(23%)
21 of 306
(7%)
Histotype NOS f2 of 107
(1.9%)
46 of 125
(36.8%)
37 of 74
(50%)
p < 0.000185 of 306
(27.7%)
Nodular g57 of 107
(53.3%)
61 of 125
(48.8%)
22 of 74
(29.7%)
140 of 306
(46%)
Superficial spreading h32 of 107
(29.9%)
1 of 125
(0.8%)
7 of 74
(9.5%)
40 of 306
(13%)
Acral i5 of 107
(4.7%)
0 of 125
(0%)
3 of 74
(4.1%)
8 of 306
(3%)
Others l, m, n, o, p, q, r10 of 107
(9.3%)
17 of 125
(13.6%)
5 of 74
(6.8%)
32 of 306
(10%)
Unknown1 of 107
(0.9%)
0 of 125
(0%)
0 of 74
(0%)
1 of 306
(0.3%)
Ordinary one-way ANOVA test (the unknown cases were excluded from the analysis); Chi-square test (the unknown cases were excluded from the analysis); underlined p highlights statistically significant results by univariate analysis (p < 0.05). § ICD-O code was used to define anatomical tumor localization: a. C44.0; C44.1; C44.2; C44.3; C44.4; b. C44.5; c. C44.6; d. C44.7 and e. C51.0; SNOMED code was used to define tumor histotypes: f. not specified; g. M87213; h. M87433; i. M87443; l. M87453; m. M87723; n. M87733; o. M87803; p. M87303; q. M87423; r. M87713.
Table 2. Mutational characteristics of the whole dataset.
Mutation Statusn = 288(100%)
BRAF an = 96(33.3%)
NRAS bn = 62(21.5%)
Focal positivity for NRAS b cn = 5(1.8%)
BRAF and NRAS negativen = 124(43%)
Positive IHC for BRAF and NRASn = 1(0.4%)
a: BRAF mutations V600E or V600K; b: NRAS mutations Q61R or K or L or H; c: one sample is defined with focal positivity (−/+) by IHC and four both through IHC and ddPCR (0.08 or 0.16 copies/μL).
Table 3. Mutational status and patients’ cutaneous melanoma features. Underlined p highlights statistically significant results (p < 0.05).
CharacteristicsBRAF MutatedNRAS MutatedNo MutatedTotalp Valuep Value
BRAF Mut
vs.
No Mutated
p Value
NRAS Mut vs.
No Mutated
p Value
BRAF Mut vs. NRAS Mut
n = 96
(33.5%)
n = 67
(23.3%)
n = 124
(43.2%)
n = 287
(100%)
Environmental characteristics
Geographic areasBZ33 of 96
(34.4%)
30 of 67
(44.8%)
43 of 124
(34.7%)
106 of 287
(37%)
0.2 0.2 0.3 0.4
TS45 of 96
(46.9%)
24 of 67
(35.8%)
46 of 124
(37.1%)
115 of 287
(40%)
I/IL18 of 96
(18.8%)
13 of 67
(19.4%)
35 of 124
(28.2%)
66 of 287
(23%)
Altitude of residenceMean
(range)
449.4
(13–1718)
593
(46–2153)
509
(10–2131)
660
(10–2153)
0.1 0.4 ††0.3 ††0.1 ††
≤300 m52 of 95
(54.7%)
32 of 67
(47.8%)
60 of 124
(48.4%)
144 of 286
(50.3%)
0.4 0.4 0.3 0.6
300 < m <75019 of 95
(20%)
13 of 67
(19.4%)
34 of 124
(27.4%)
66 of 286
(23%)
≥750 m24 of 95
(25.3%)
22 of 67
(32.8%)
30 of 124
(24.2%)
76 of 286
(26.6%)
Demographic characteristics
GenderMale63 of 96
(65.6%)
32 of 67
(47.8%)
64 of 124
(51.6%)
159 of 287
(55.4%)
0.040.040.6 0.02
Female33 of 96
(34.4%)
35 of 67
(52.2%)
60 of 124
(48.4%)
128 of 287
(44.6%)
Mean ageYears
(range)
62
(16–95)
73
(32–101)
71
(21–101)
71
(16–101)
0.00010.0005††0.5 ††0.0001††
Pathological characteristics
Localization§Head&Neck&Face a20 of 96
(20.8%)
11 of 67
(16.4%)
38 of 124
(30.6%)
69 of 287
(24%)
0.020.020.1 0.08
Trunk b43 of 96
(44.8%)
21 of 67
(31.3%)
33 of 124
(26.6%)
97 of 287
(33.8%)
Upper Limb c8 of 96
(8.3%)
13 of 67
(19.4%)
19 of 124
(15.3%)
40 of 287
(14%)
Lower Limb d25 of 96
(26%)
22 of 67
(32.8%)
29 of 124
(23.4%)
76 of 287
(26.5%)
Other sites e0 of 96
(0%)
0 of 67
(0%)
5 of 124
(4%)
5 of 287
(1.7%)
StageI B17 of 96
(17.7%)
2 of 67
(3%)
8 of 124
(6.5%)
27 of 287
(9.4%)
0.0050.0050.2 0.04
II51 of 96
(53.1%)
43 of 67
(64.2%)
88 of 124
(71%)
182 of 287
(63.4%)
III23 of 96
(24%)
15 of 67
(22.4%)
15 of 124
(12.1%)
53 of 287
(18.5%)
IV5 of 96
(5.2%)
3 of 67
(4.5%)
7 of 124
(5.6%)
15 of 287
(5.2%)
unknown0 of 96
(0%)
4 of 67
(6%)
6 of 124
(4.8%)
10 of 287
(3.5%)
Lymph nodesPositive25 of 96
(26%)
14 of 67
(20.9%)
16 of 124
(12.9%)
55 of 287
(19.2%)
0.07 0.020.1 0.5
Negative71 of 96
(74%)
50 of 67
(74.6%)
101 of 124
(81.5%)
222 of 287
(77.4%)
unknown0 of 96
(0%)
3 of 67
(4.5%)
7 of 124
(5.6%)
10 of 287
(3.5%)
Breslow’s thicknessMedian in mm (range)3.2
(1.8−15)
3.6
(1.9−30)
3.5
(1.8−22)
4
(1.8−30)
0.1 0.3††0.2††0.07 ††
Ulceration statusyes45 of 96
(47%)
31 of 67
(46.3%)
57 of 124
(46%)
133 of 287
(46.3%)
0.9 0.7 0.9 0.8
no49 of 96
(51%)
32 of 67
(47.8%)
57 of 124
(46%)
138 of 287
(48.1%)
unknown2 of 96
(2%)
4 of 67
(6%)
10 of 124
(8%)
16 of 287
(5.6%)
Histotype NOS f28 of 96
(29.2%)
16 of 67
(23.9%)
31 of 124
(25%)
75 of 287
(26.1%)
0.1 0.08 0.2 0.7
Nodular g47 of 96
(49%)
33 of 67
(49.3%)
56 of 124
(45.2%)
136 of 287
(47.5%)
Superficial spreading h14 of 96
(14.6%)
12 of 67
(17.9%)
13 of 124
(10.5%)
39 of 287
(13.6%)
Acral i0 of 96
(0%)
1 of 67
(1.5%)
6 of 124
(4.8%)
7 of 287
(2.4%)
Others l, m, n, o, p, q, r7 of 96
(7.3%)
4 of 67
(6%)
18 of 124
(14.5%)
29 of 287
(10.1%)
Unknown0 of 96
(0%)
1 of 67
(1.5%)
0 of 124
(0%)
1 of 287
(0.3%)
Ordinary one-way ANOVA test (the unknown cases were excluded from the analysis). †† Unpaired t-test (the unknown cases were excluded from the analysis). Chi-square test (the unknown cases were excluded from the analysis). Underlined p highlights statistically significant results by univariate analysis (p < 0.05). § ICD-O code was used to define anatomical tumor localization: a. C44.0; C44.1; C44.2; C44.3; C44.4; b. C44.5; c. C44.6; d. C44.7 and e. C51.0. SNOMED code was used to define tumor histotypes: f. not specified, g. M87213; h. M87433; i. M87443; l. M87453; m. M87723; n. M87733; o. M87803; p. M87303; q. M87423; r. M87713.
Table 4. Results of the Cox multivariate analysis (p < 0.0001).
Variable Haz. Ratiop > z95% Conf. Interval
Age at diagnosis 1.020.02 11.00−1.04
1.0120.20.99−1.04
Gender 0.620.10.33−1.14
0.650.20.32−1.33
Altitude of Residence 1.000.0041.00−1.00
1.000.031.00−1.00
Anatomical Site 1.130.30.90−1.40
1.010.90.77−1.32
Geographic area 1.130.50.69−1.87
1.130.80.42−3.01
TRPM1 0.760.50.36−1.61
0.720.50.29−1.80
TYRP1 2.430.011.24−4.77
2.510.021.15−5.48
PDL1 (CD274) 0.710.30.37−1.35
0.490.060.23−1.01
CD2 0.750.40.39−1.42
0.940.90.46−1.93
MITF 0.510.040.27−0.97
0.980.90.44−2.19
HIF1A 1.150.60.66−2.00
1.390.40.69−2.75
miR-150-5p 0.960.90.48−1.93
0.620.30.27−1.42
miR-155-5p 0.950.90.50−1.79
0.860.70.41−1.80
miR-204-5p 0.870.70.48−1.59
1.080.80.53−2.19
miR-211-5p 0.9910.44−2.25
0.580.30.21−1.60
Mutational Status 1.98<0.0011.40−2.25
1.550.041.01−2.39
Stage at diagnosisII0.670.40.25−1.81
0.950.90.27−3.31
III1.380.50.49−3.94
1.870.40.48−7.32
IV9.89<0.0012.76−35.5
11.10.0081.88−65.8
Ulceration 1.30.40.72−2.34
1.50.30.73−2.99
phtest p = 0.3
phtest p = 0.1
1: Underlined p highlights statistical significance; 2: In italics are reported the values of the Cox regression by exclusion of patients from Innsbruck and its land.