HB-EGF–EGFR Signaling in Bone Marrow Endothelial Cells Mediates Angiogenesis Associated with Multiple Myeloma

 ,
,  ,
,  ,
,  , ,
, ,  , ,
, ,  ,
,  , and
, and 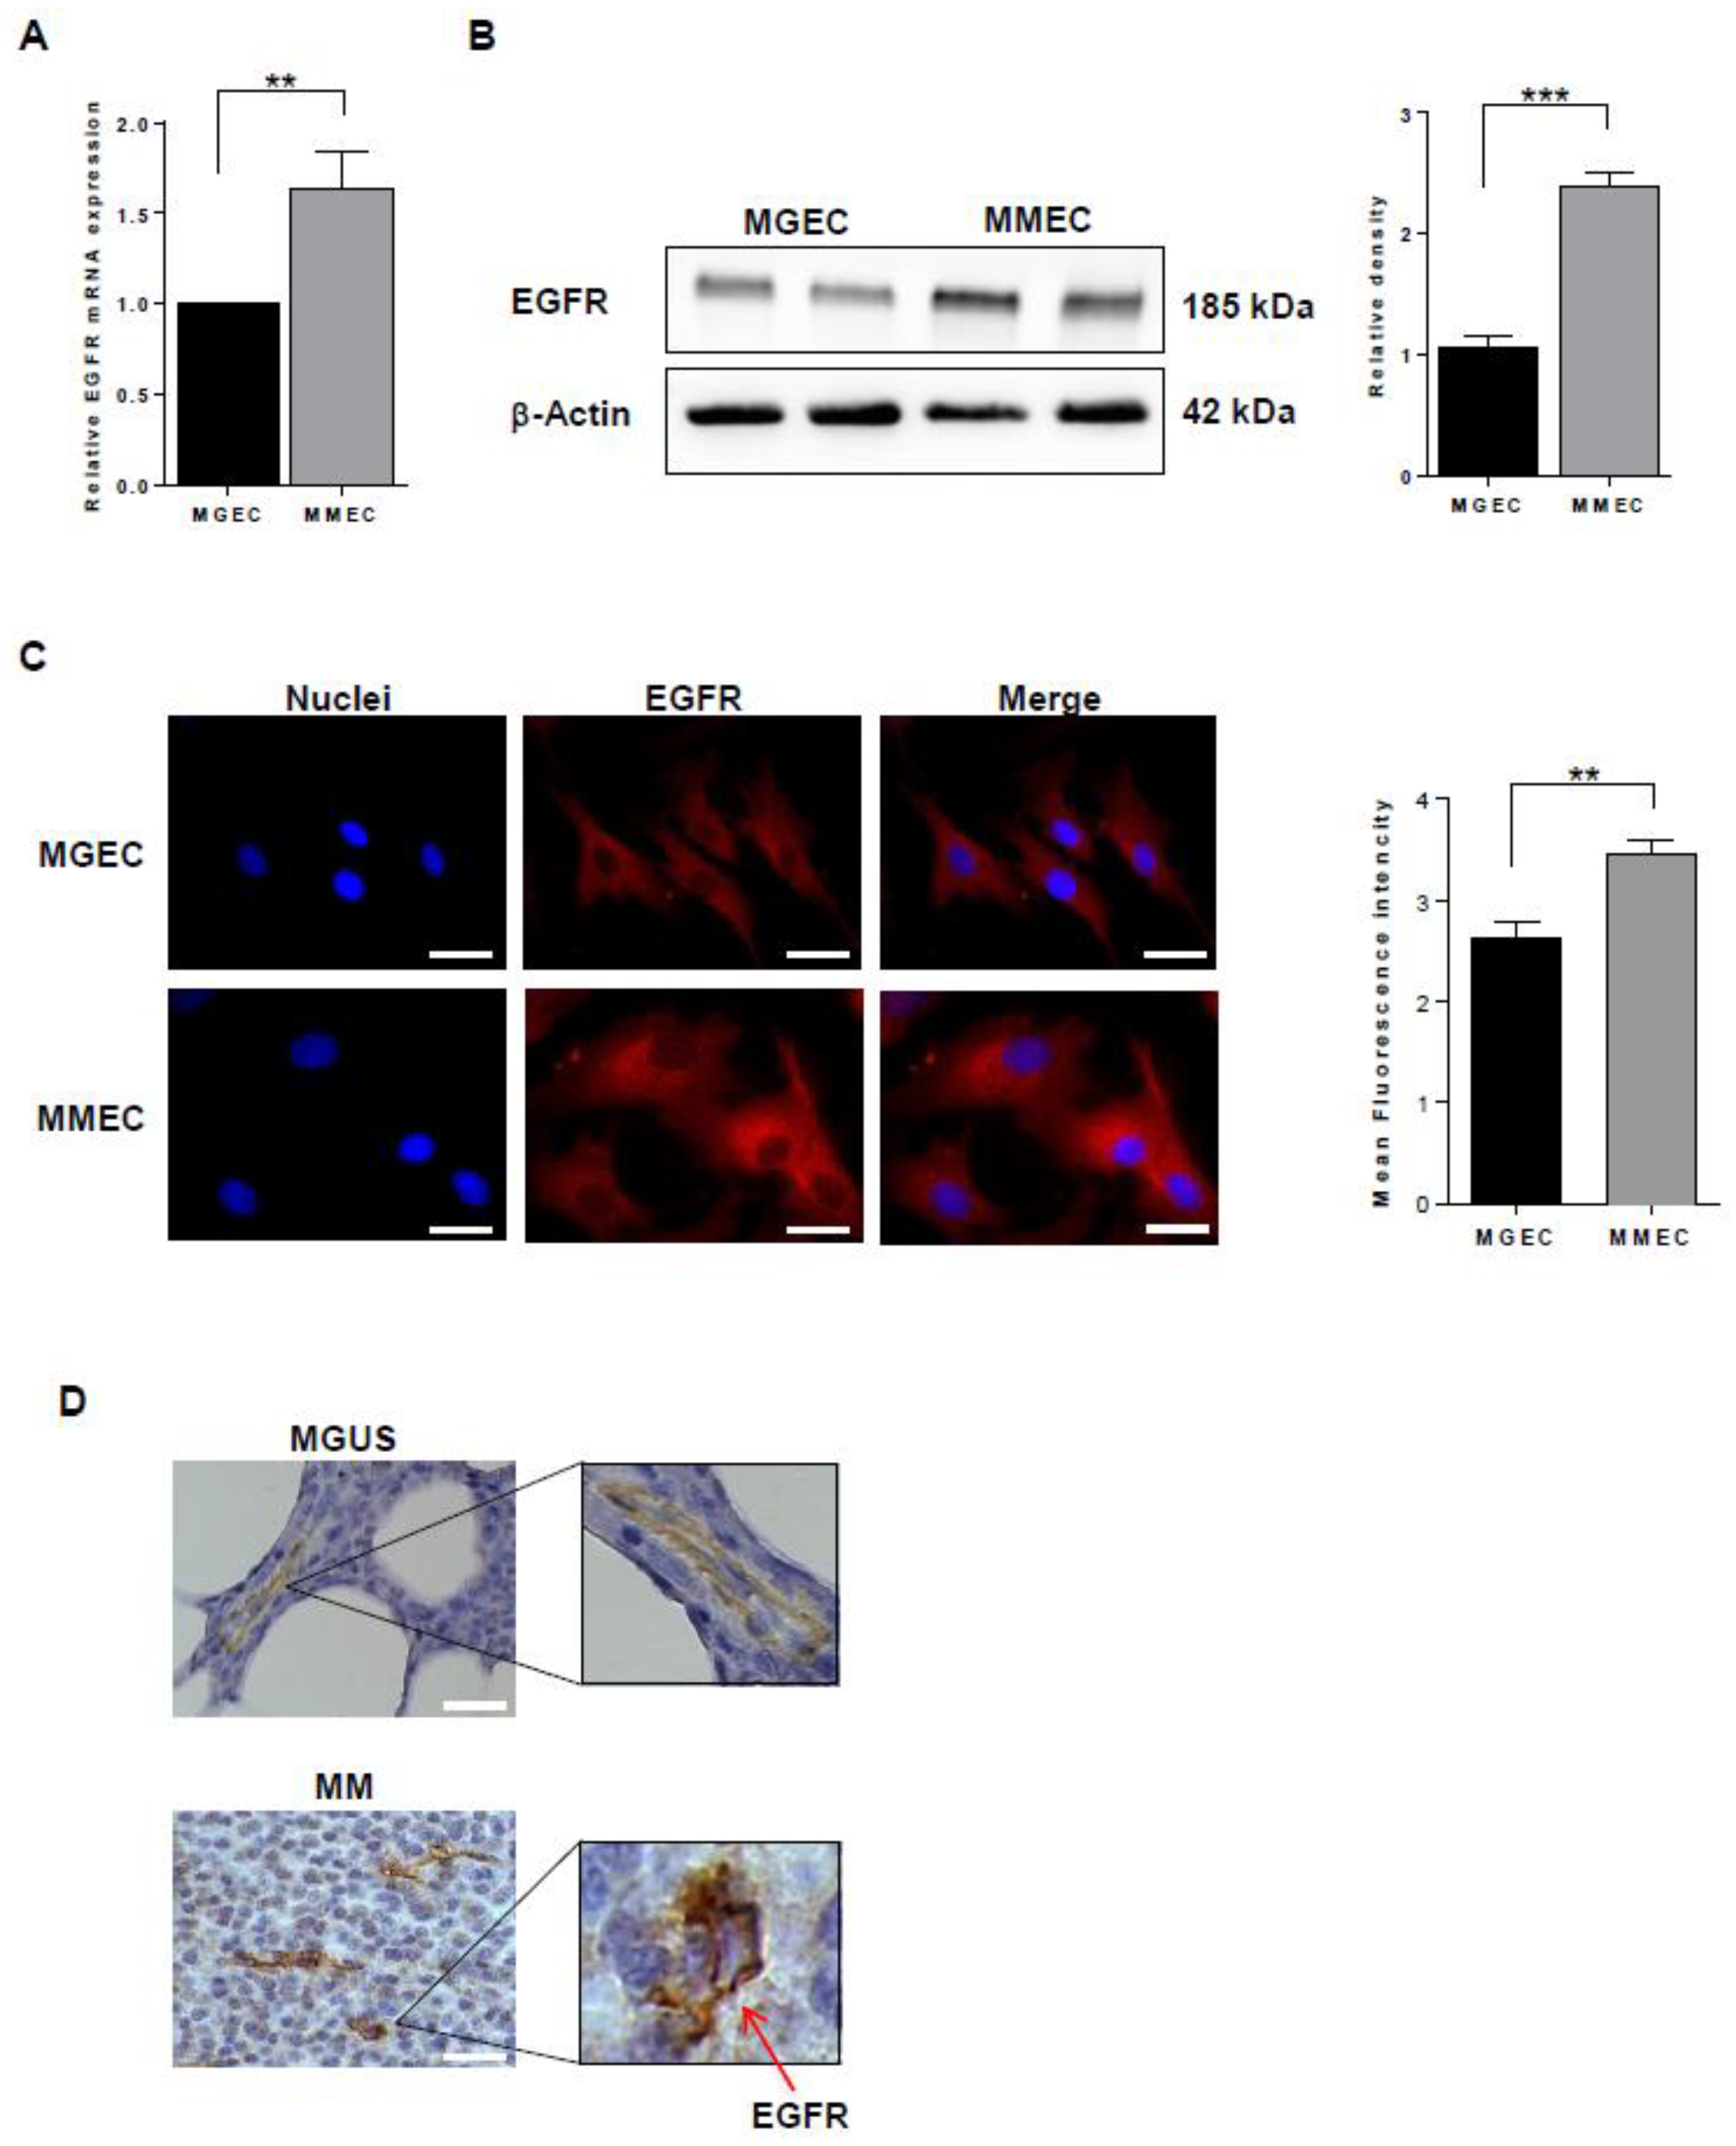
Abstract
1. Introduction
2. Results
2.1. EGFR Expression
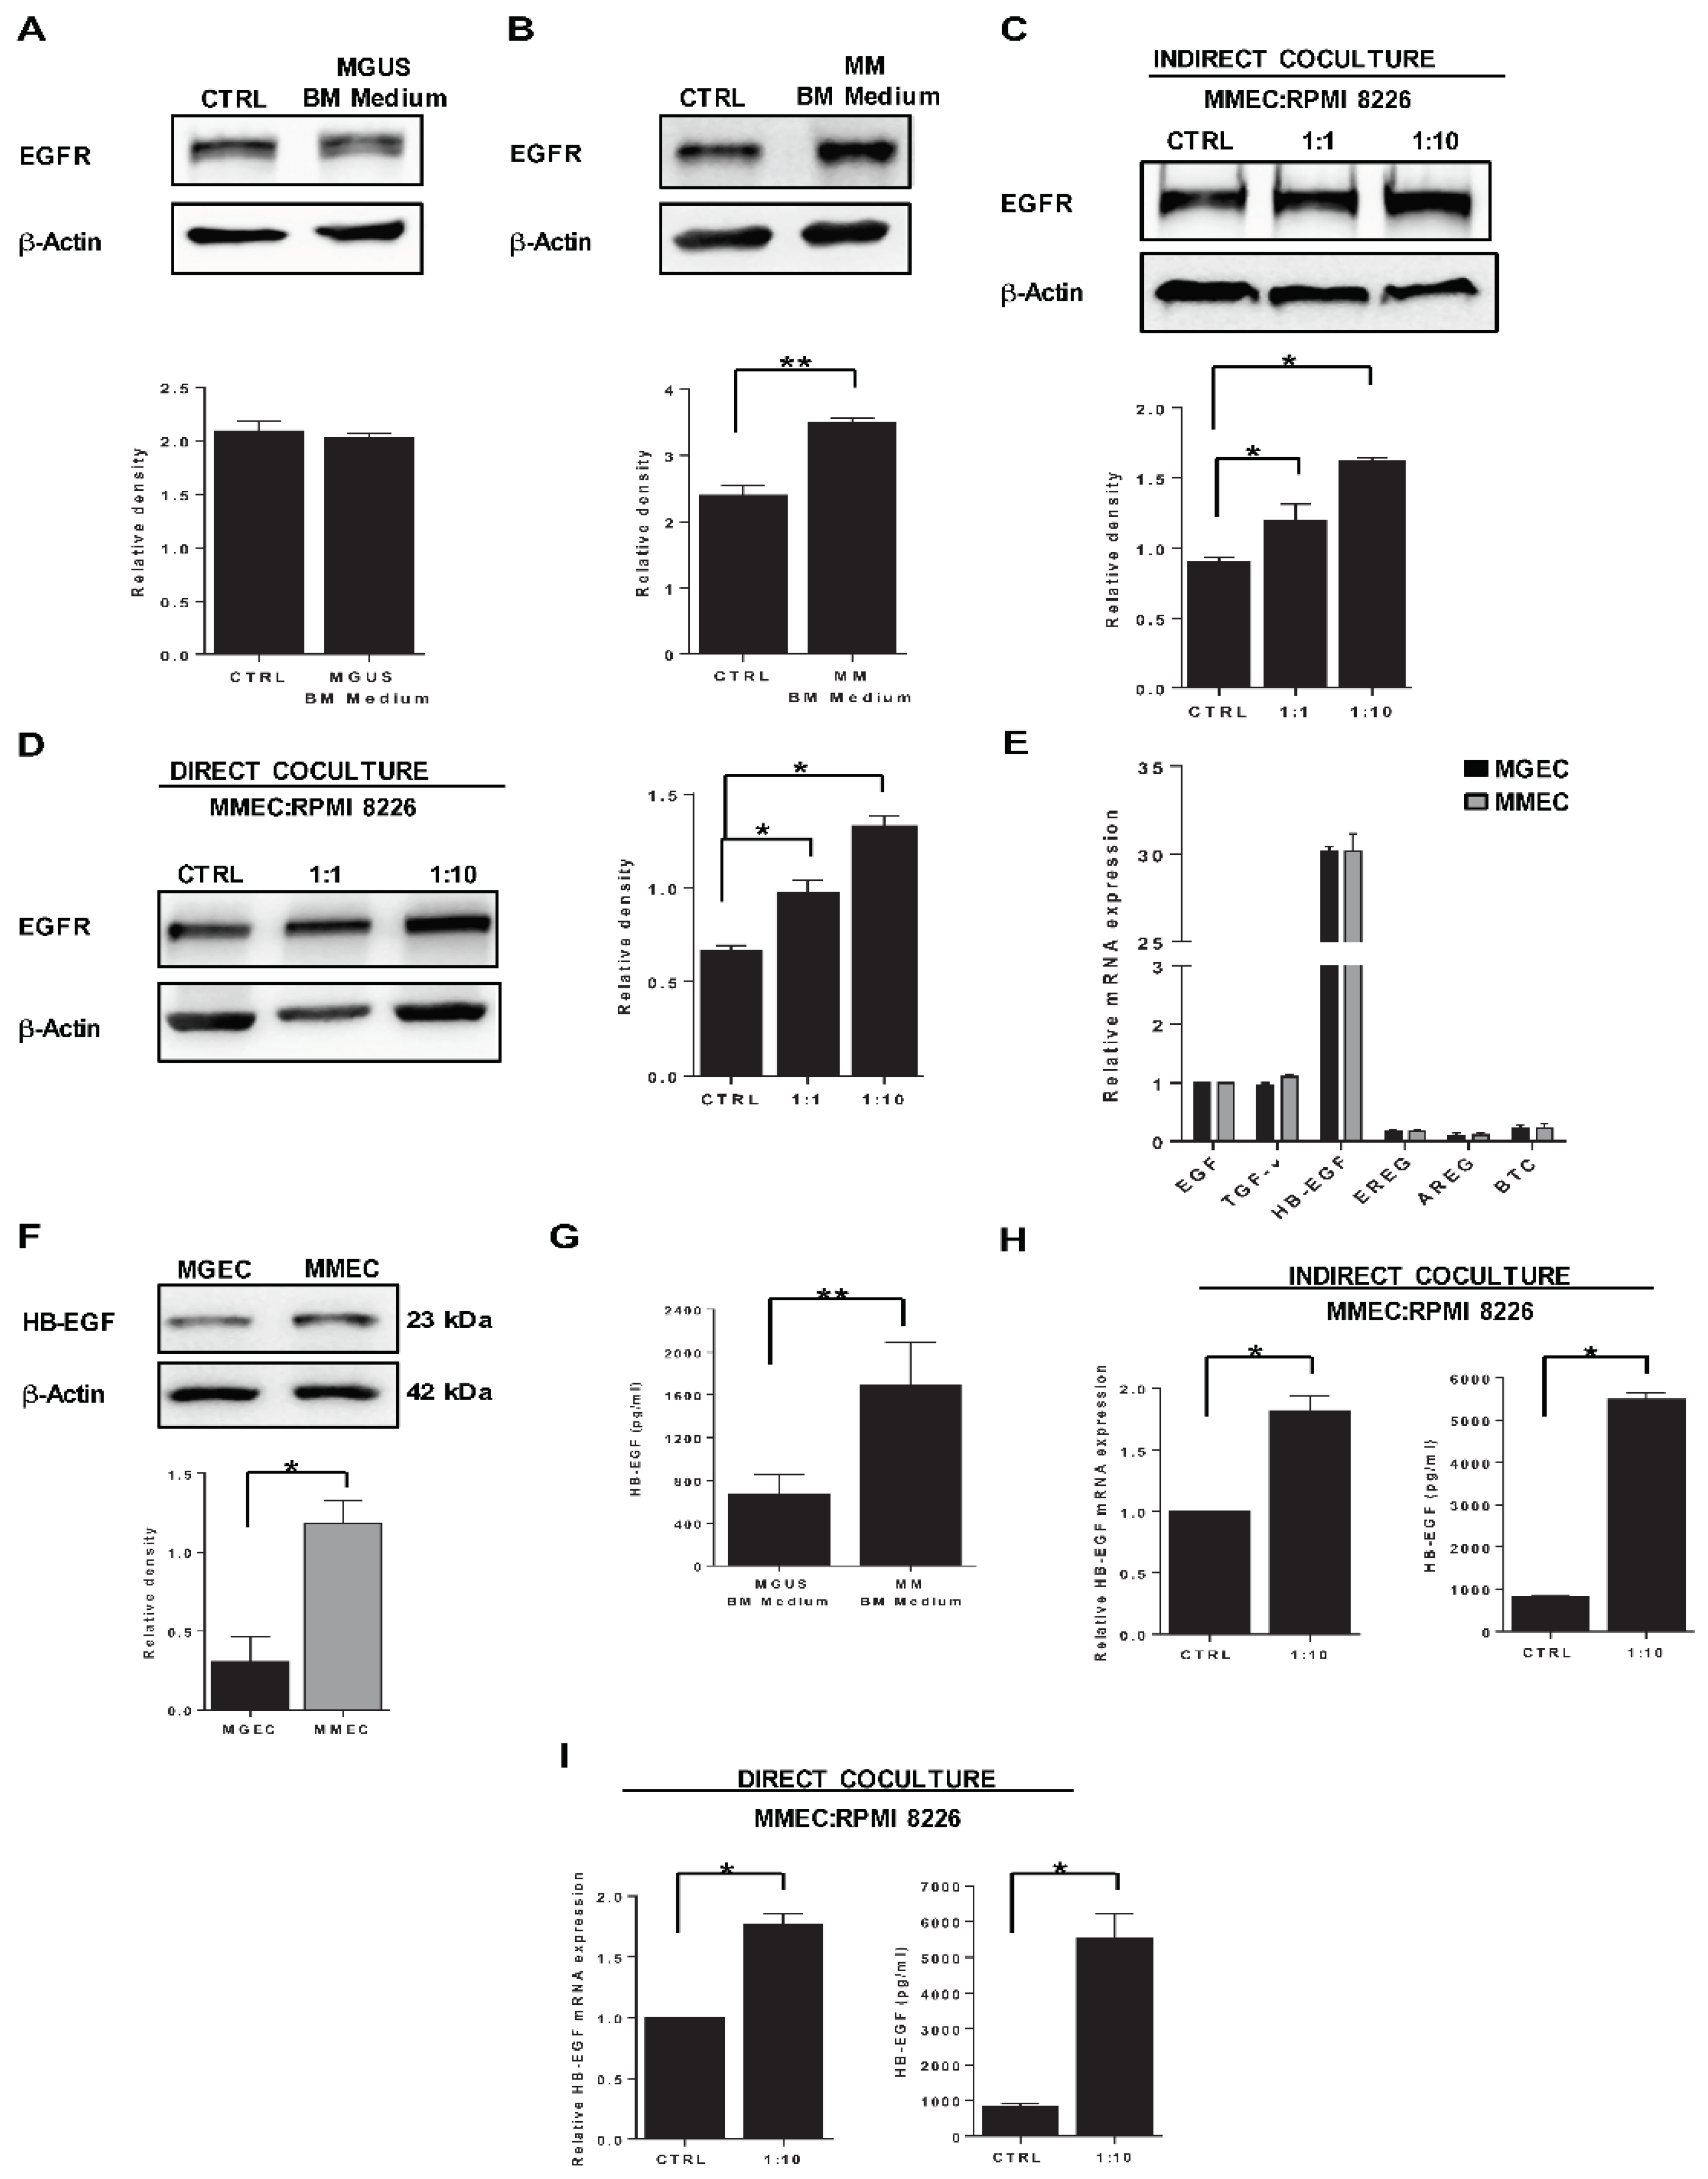
2.2. HB-EGF Expression
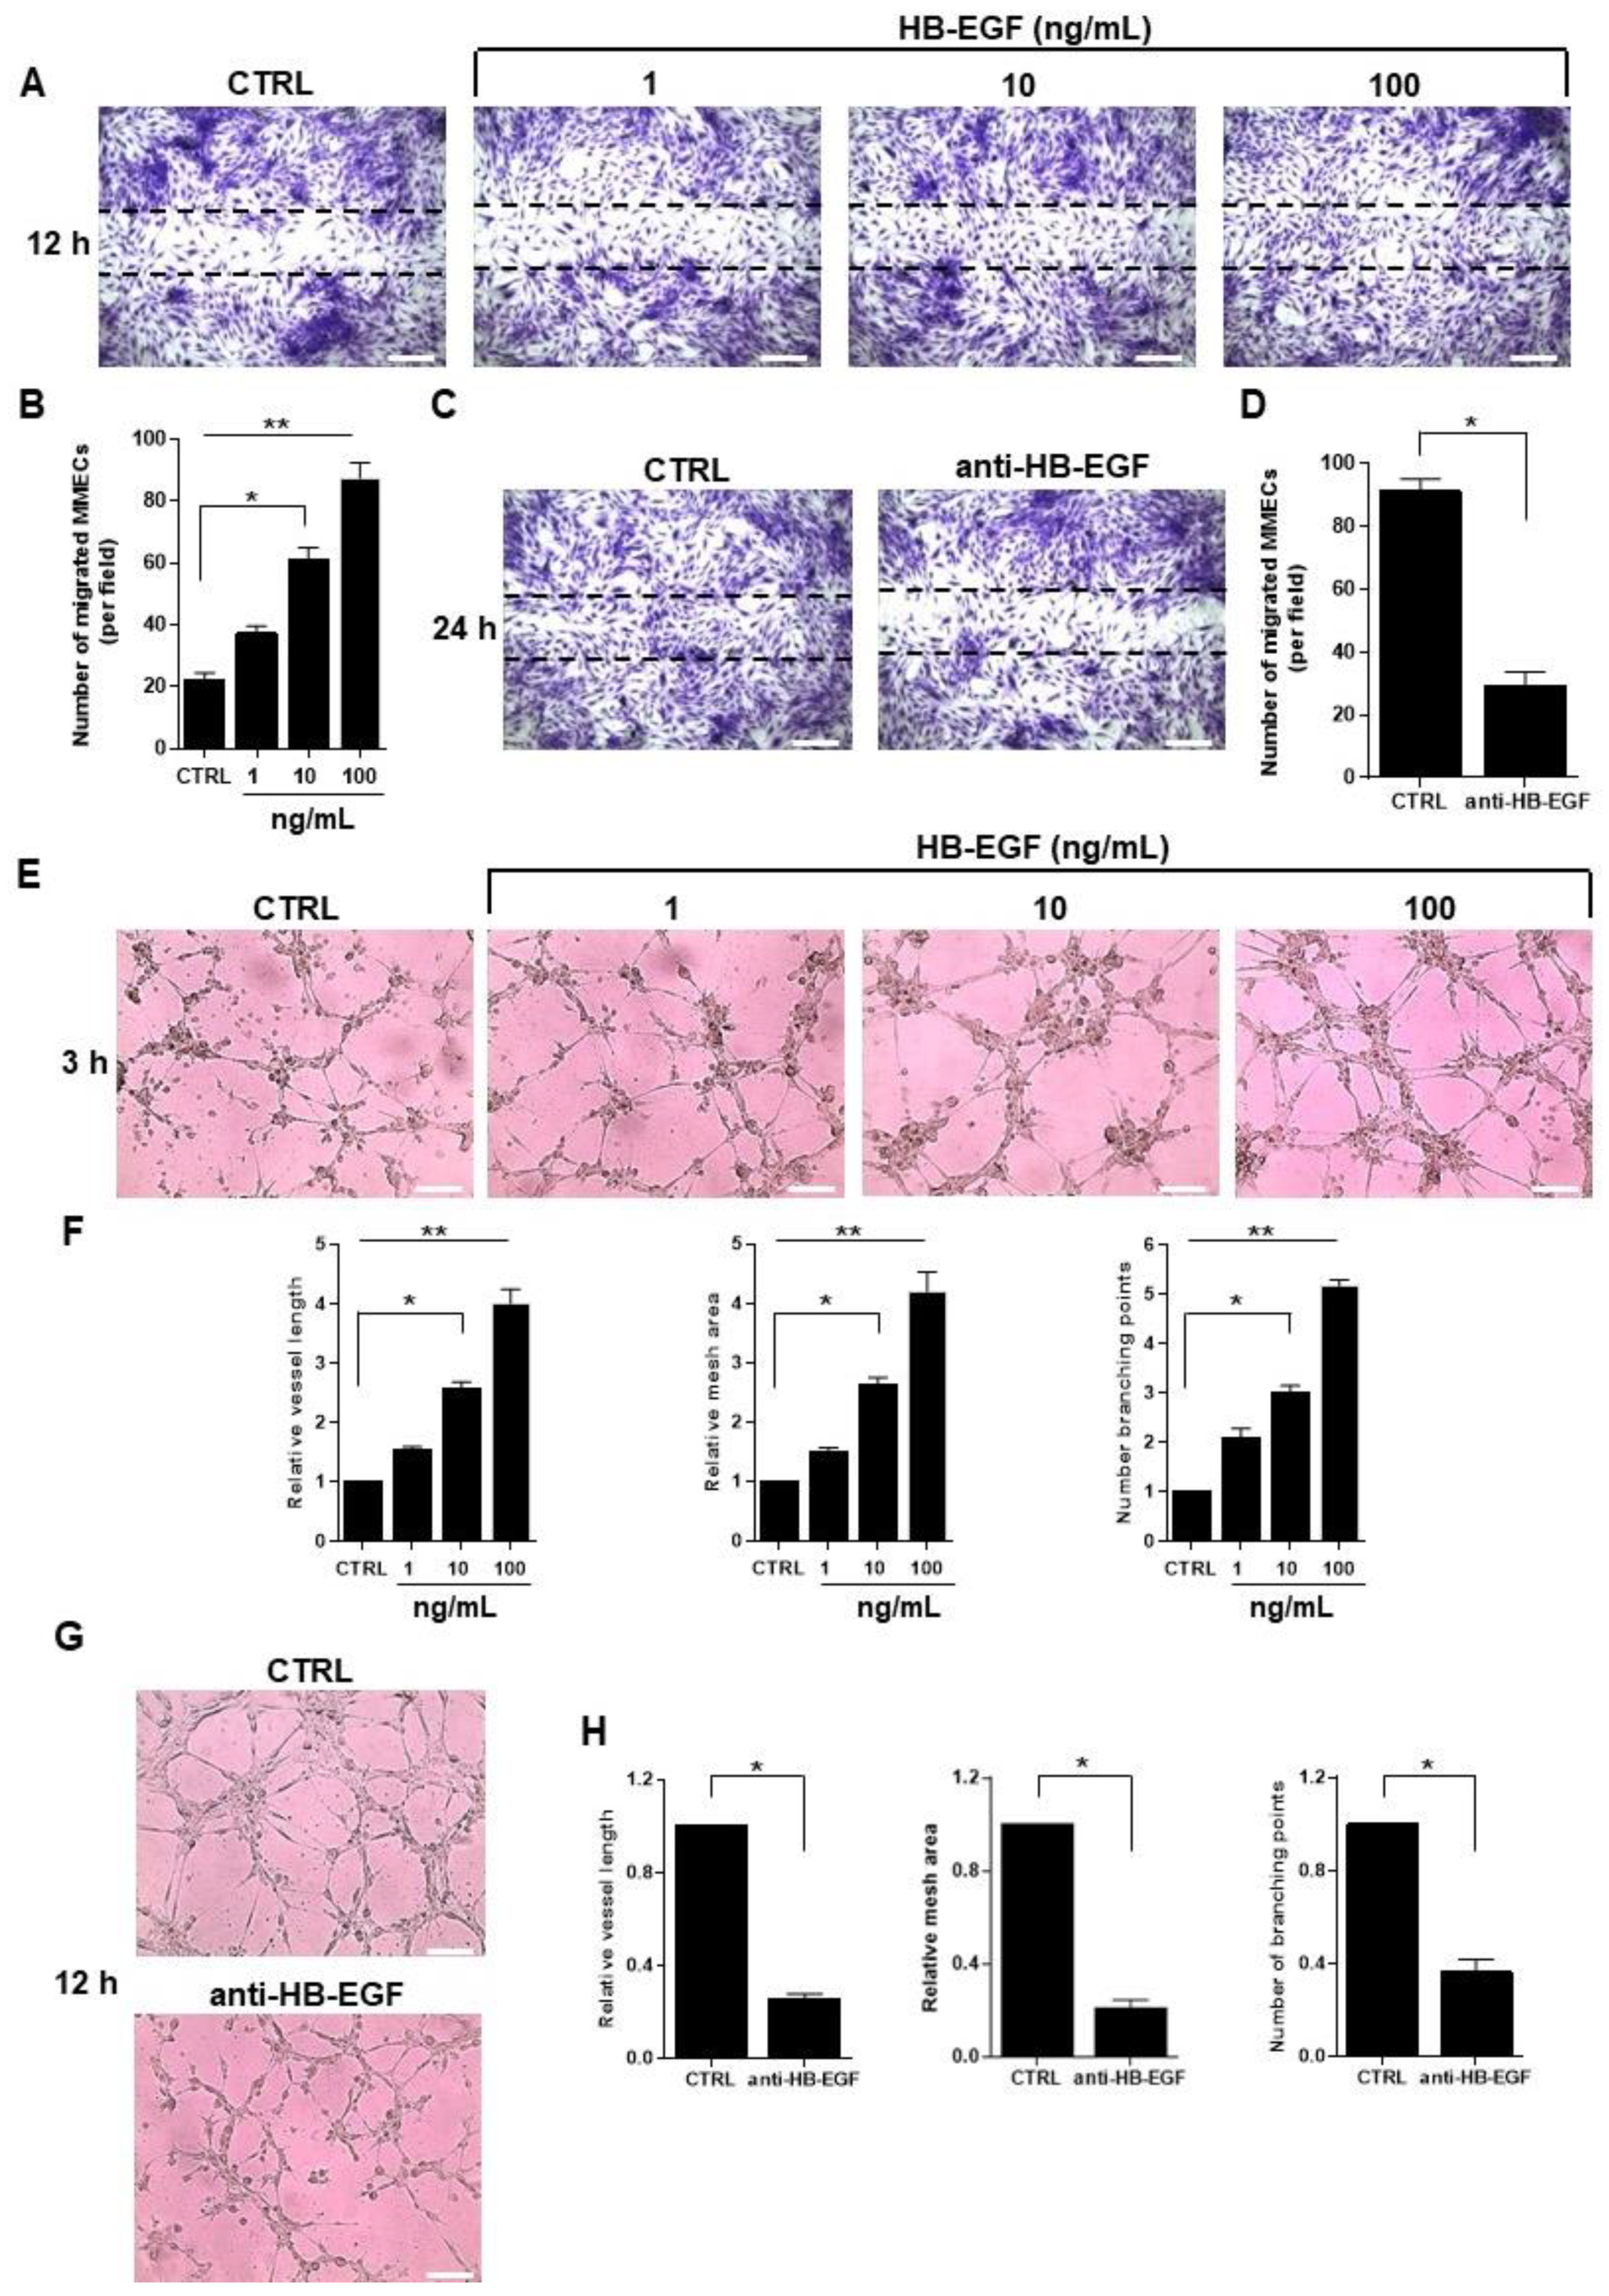
2.3. Role of HB-EGF in MM-Associated Angiogenesis In Vitro
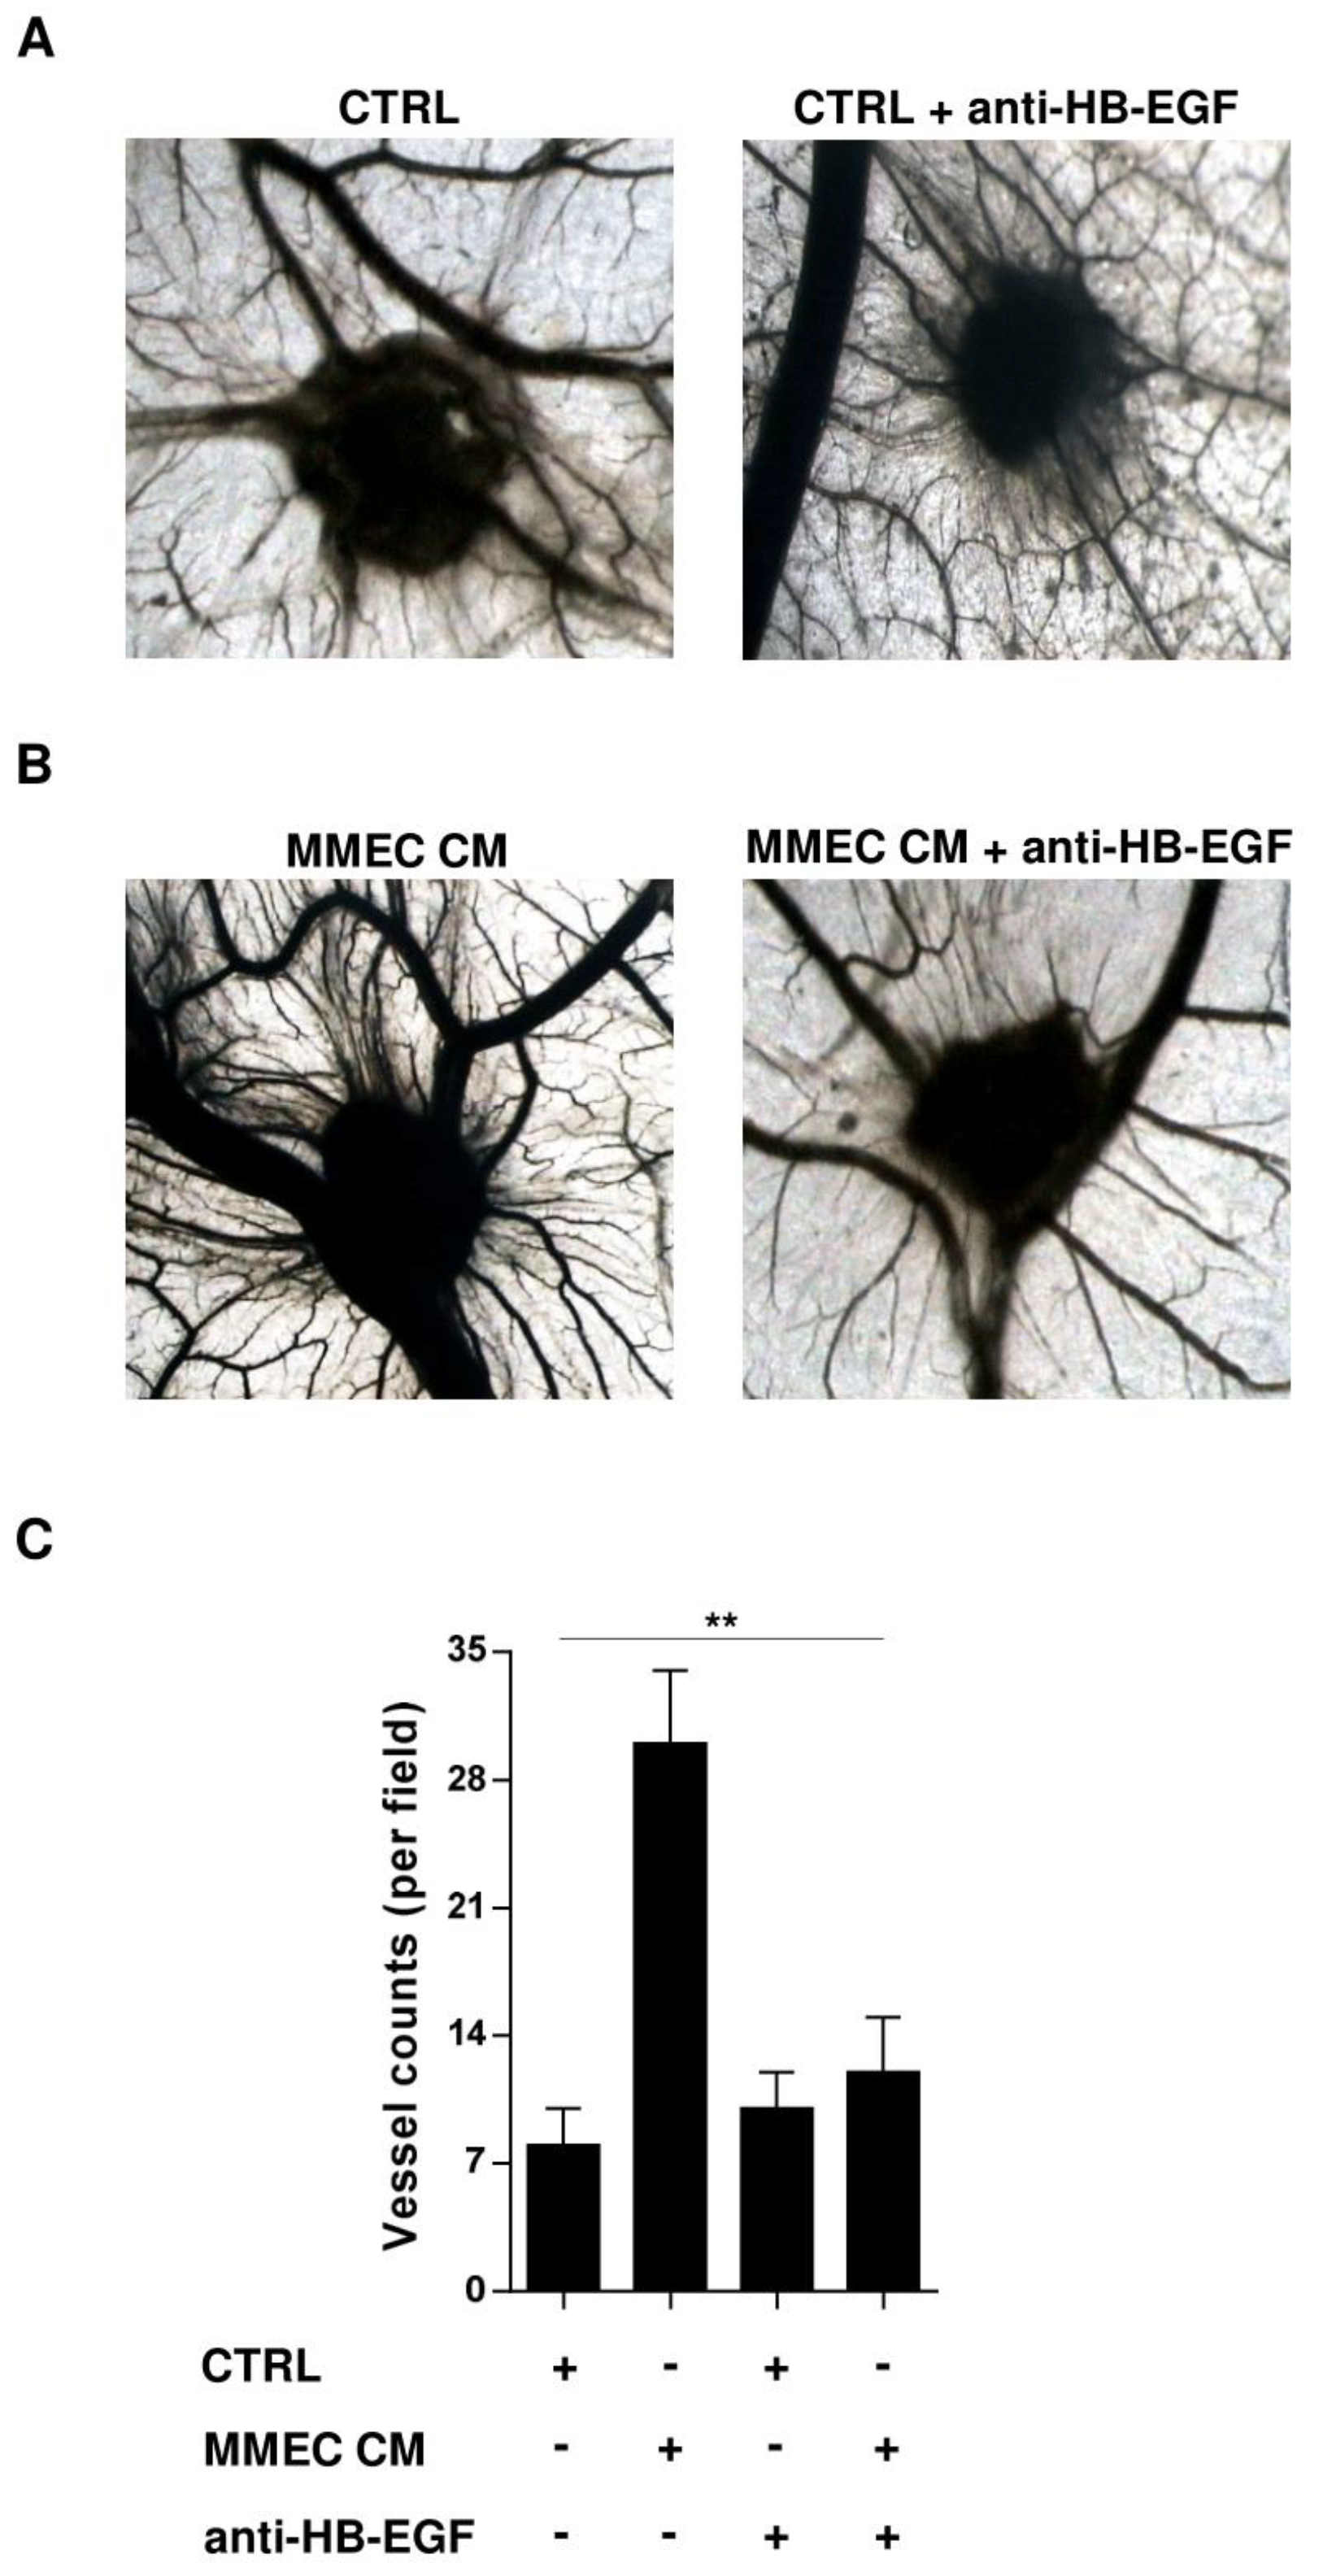
2.4. Role of HB-EGF in MM-Associated Angiogenesis In Vivo
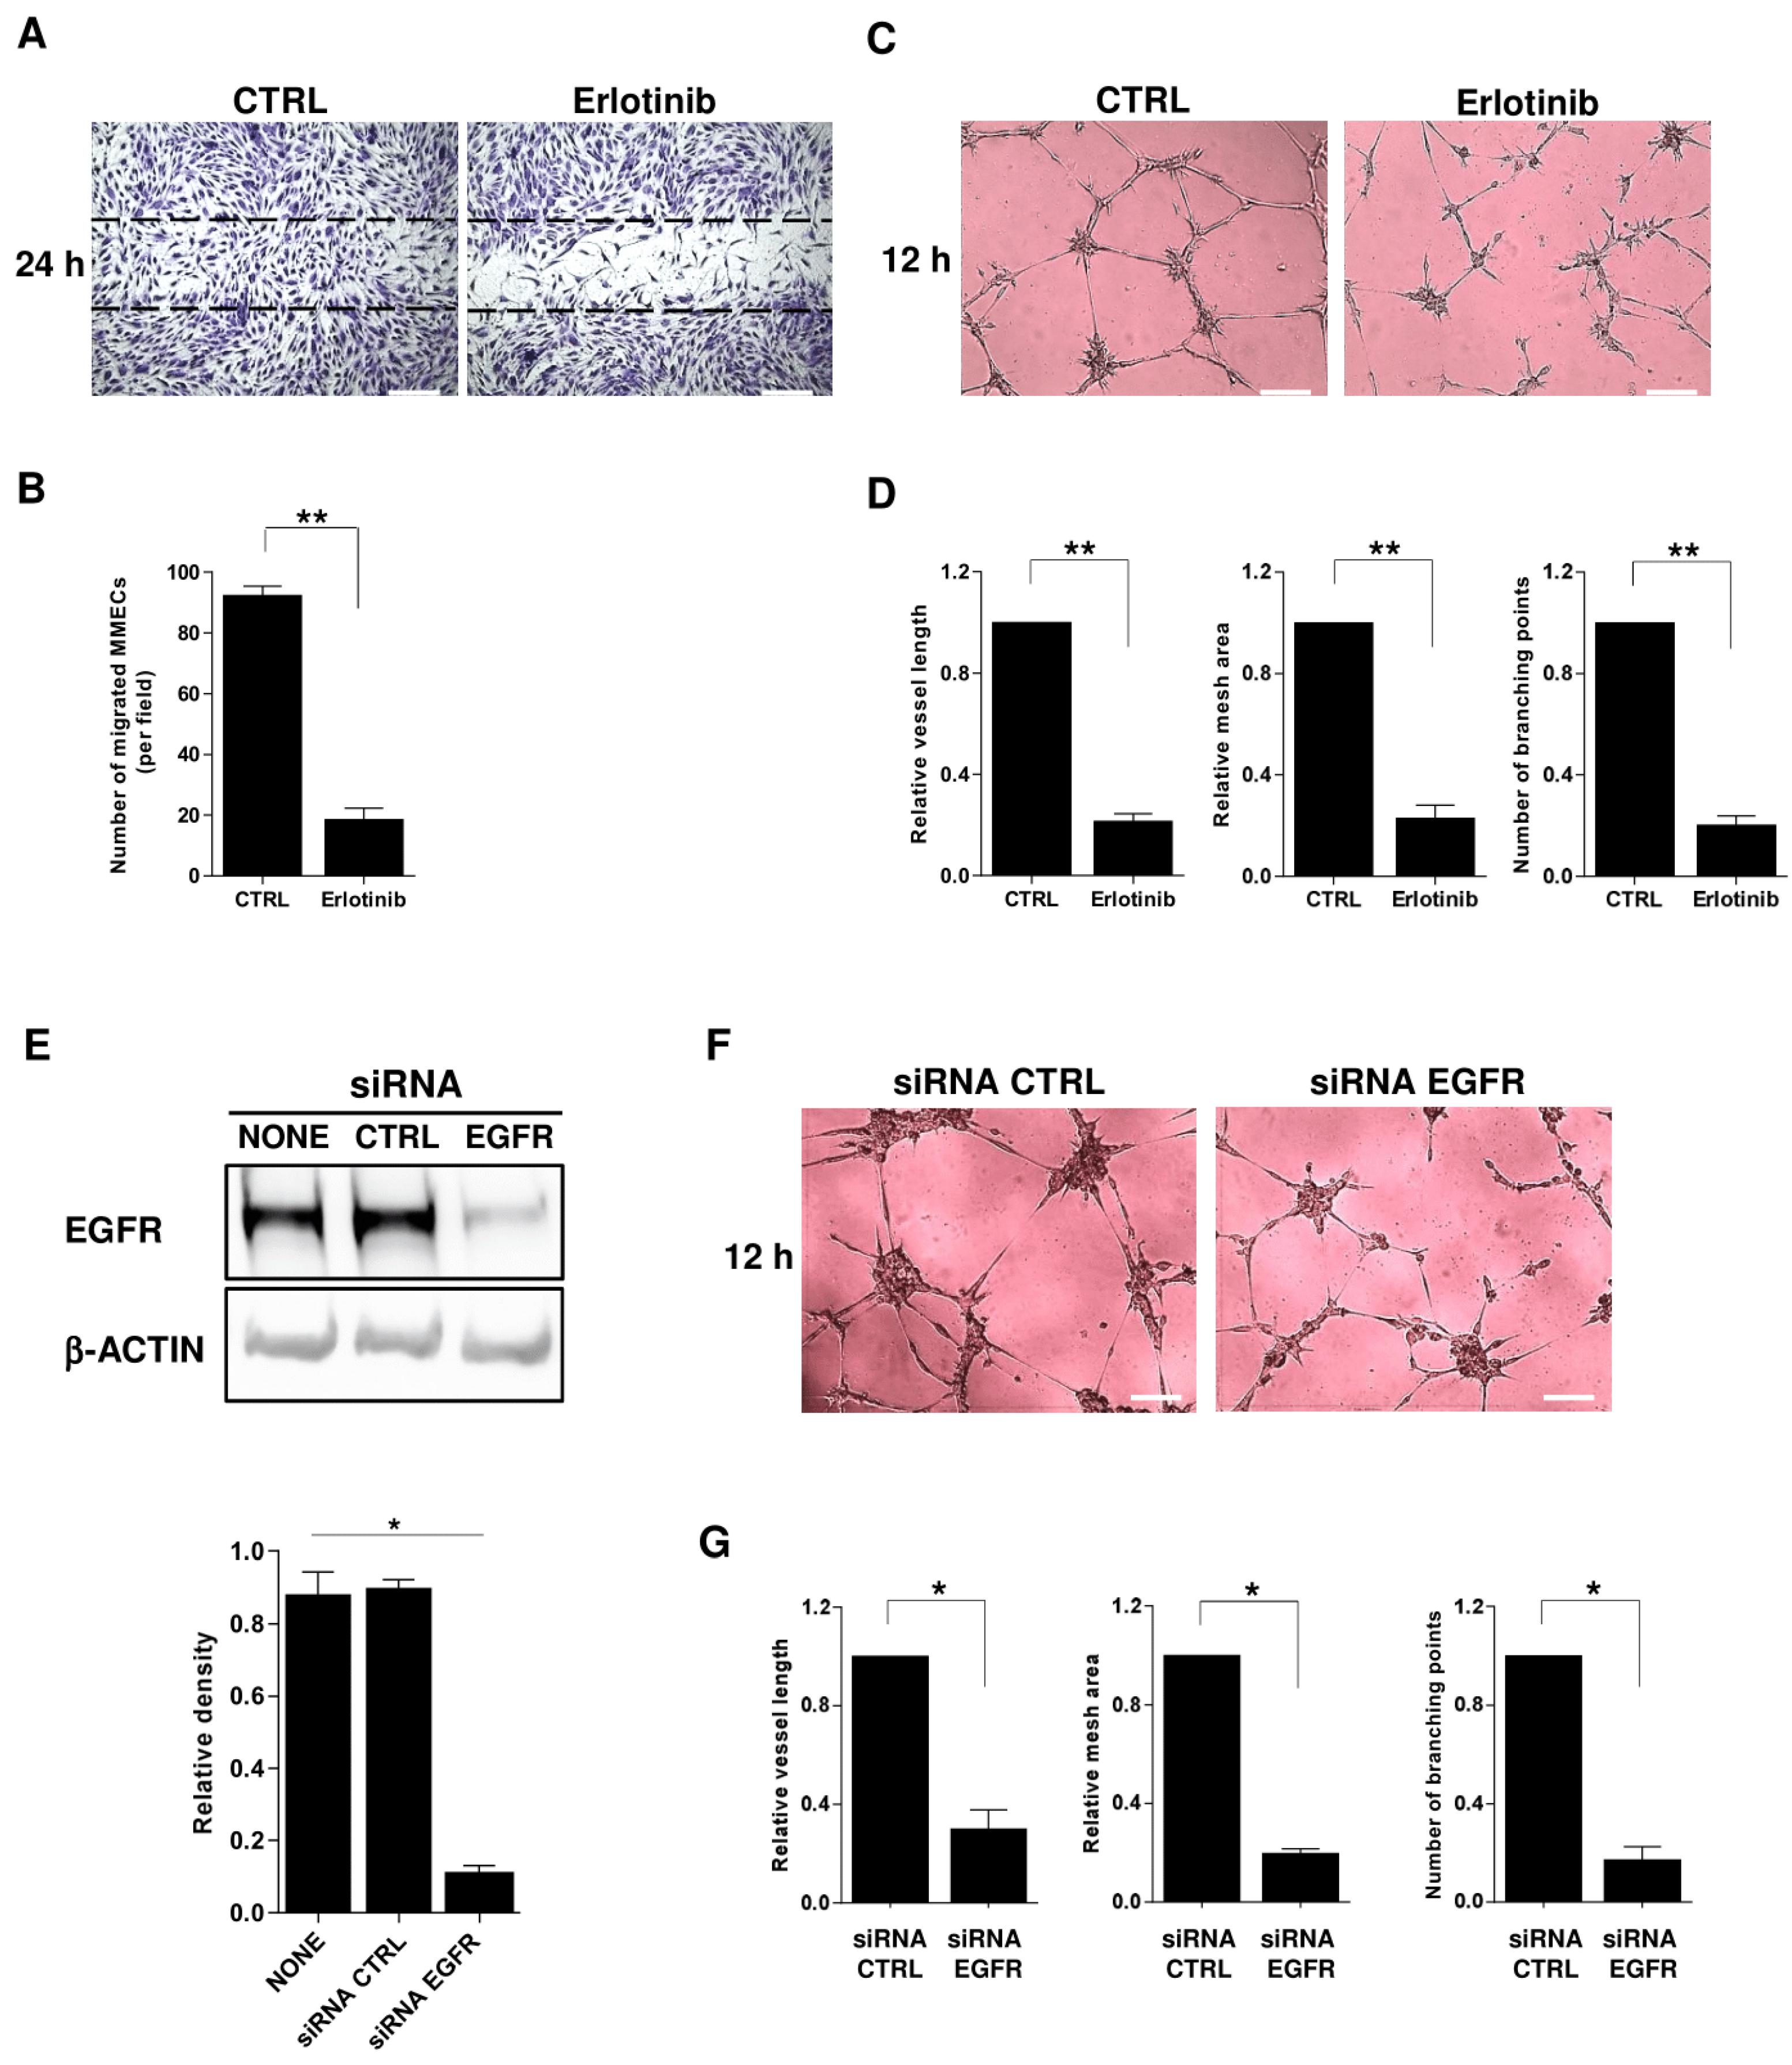
2.5. Impact of EGFR Blockade on MM-Associated Angiogenesis
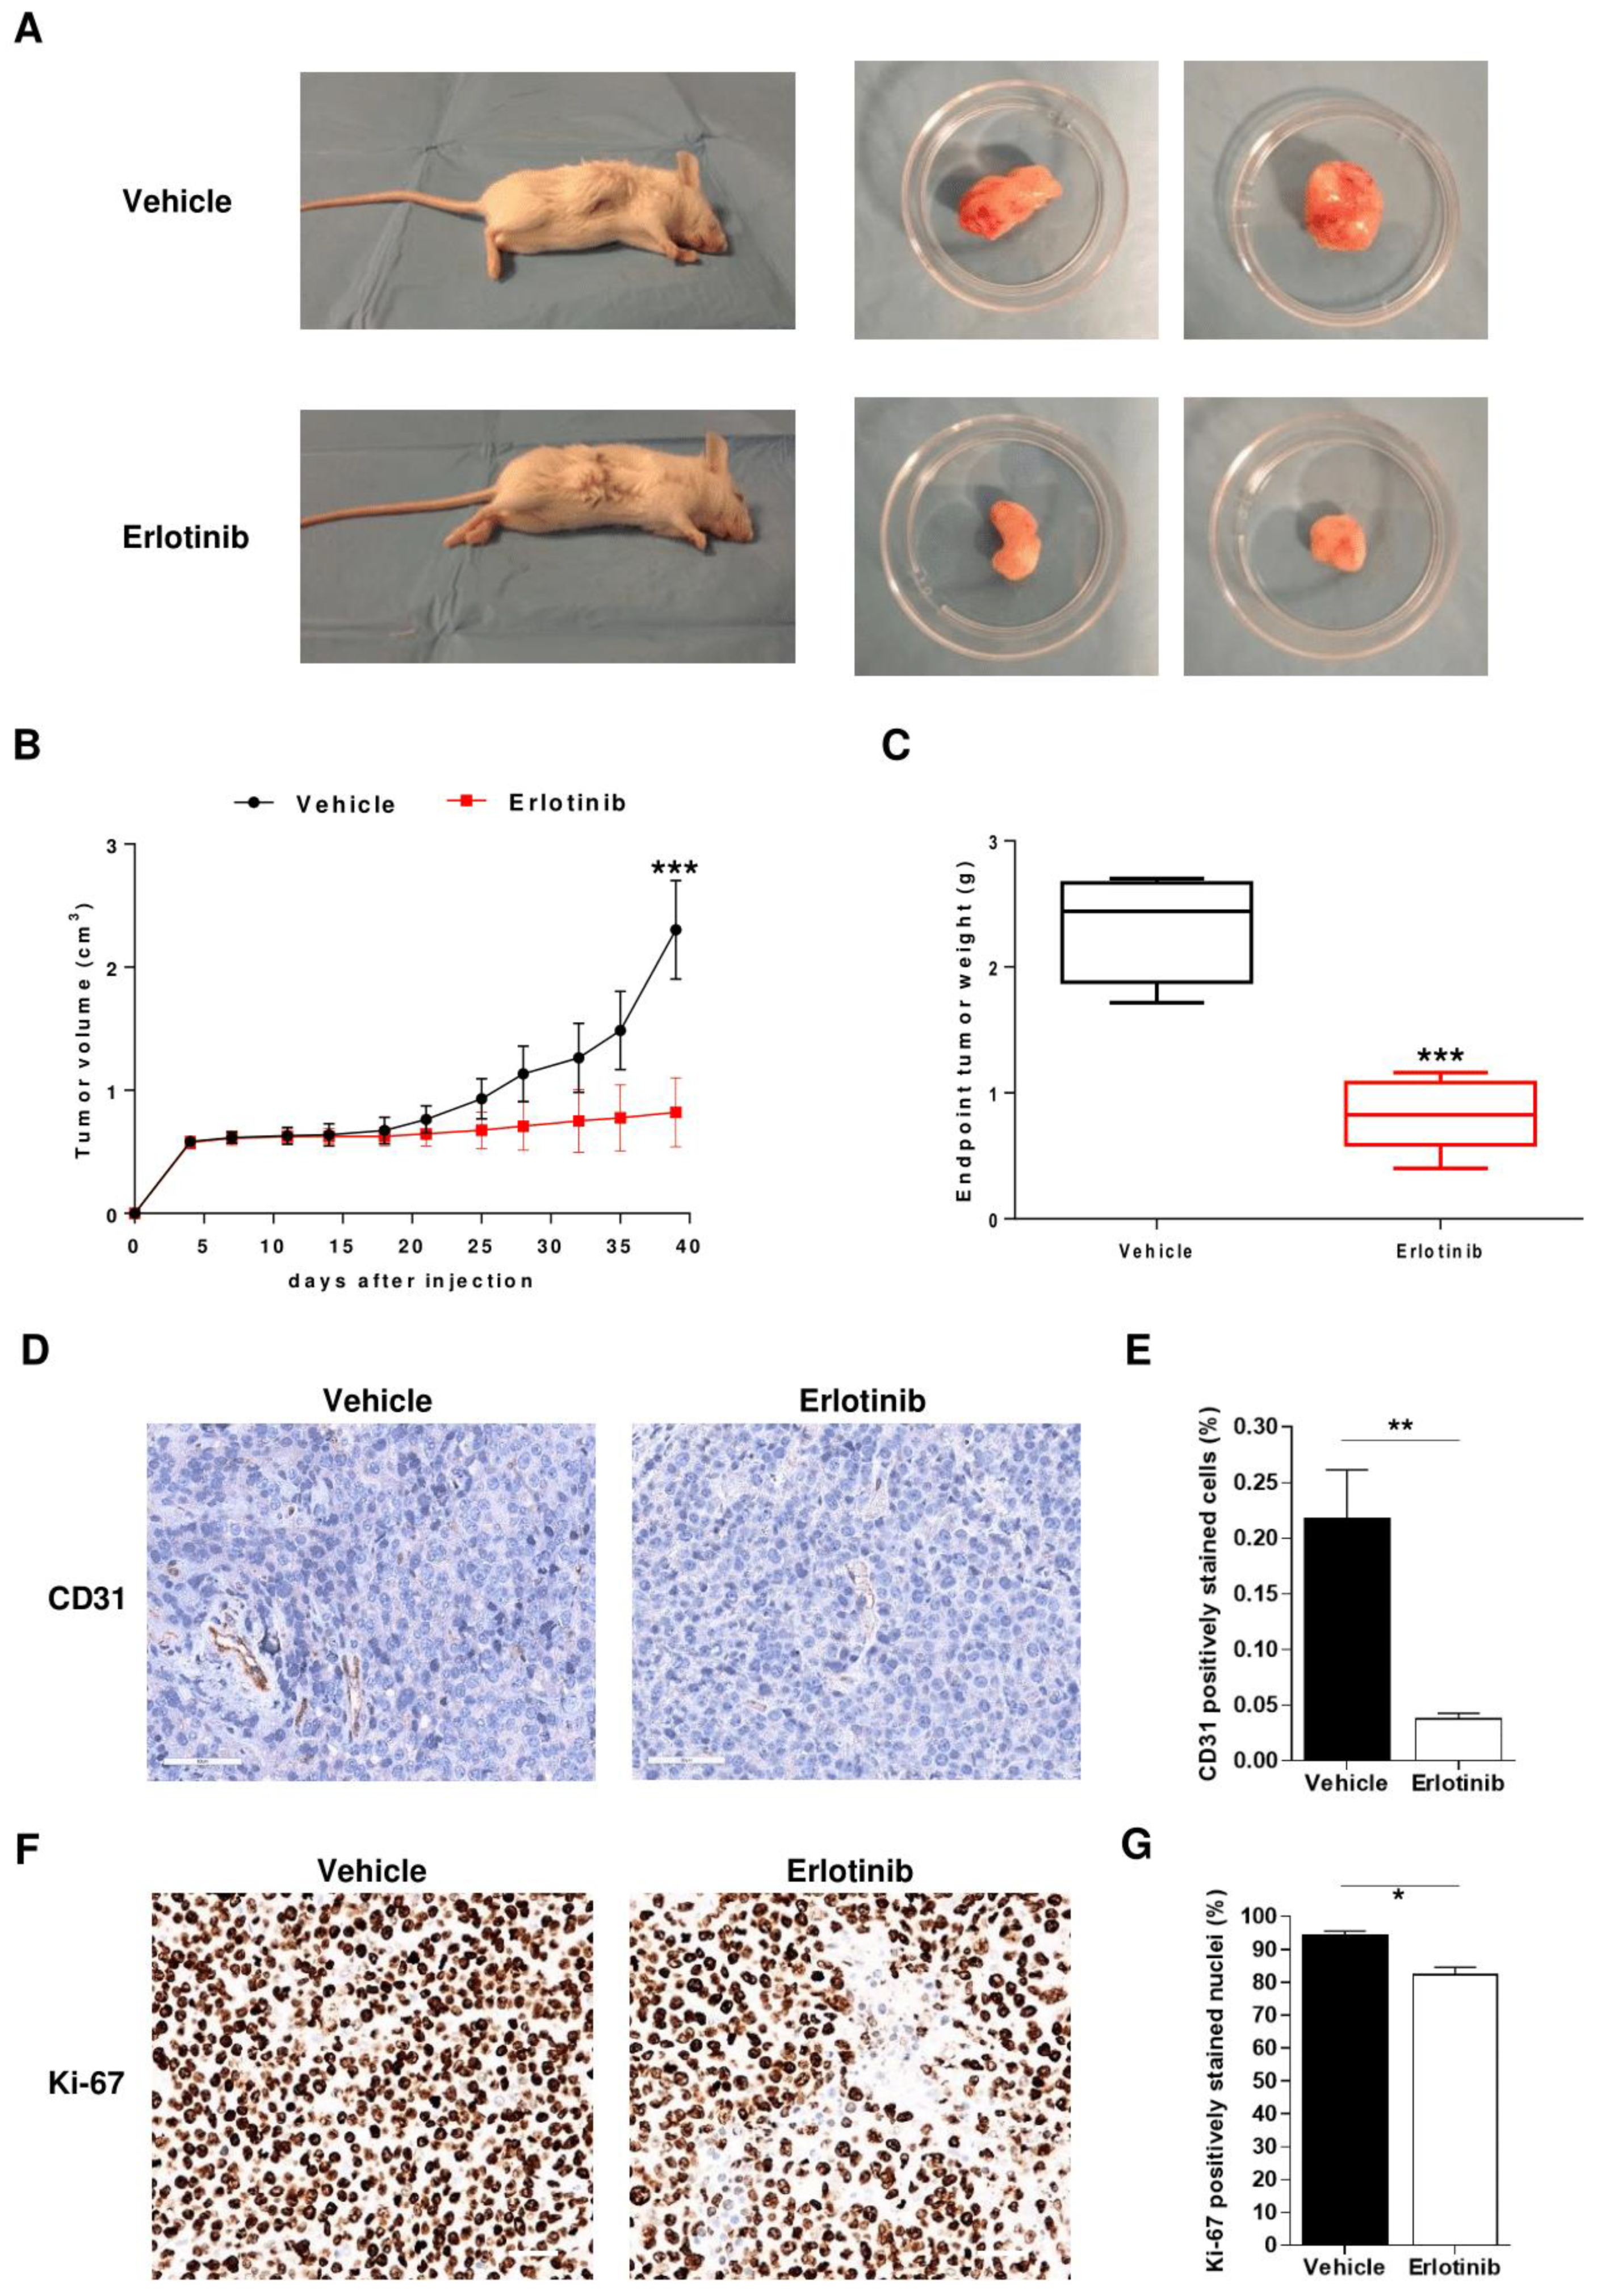
2.6. Anti-Angiogenic Effect of Erlotinib in MM Mouse Model
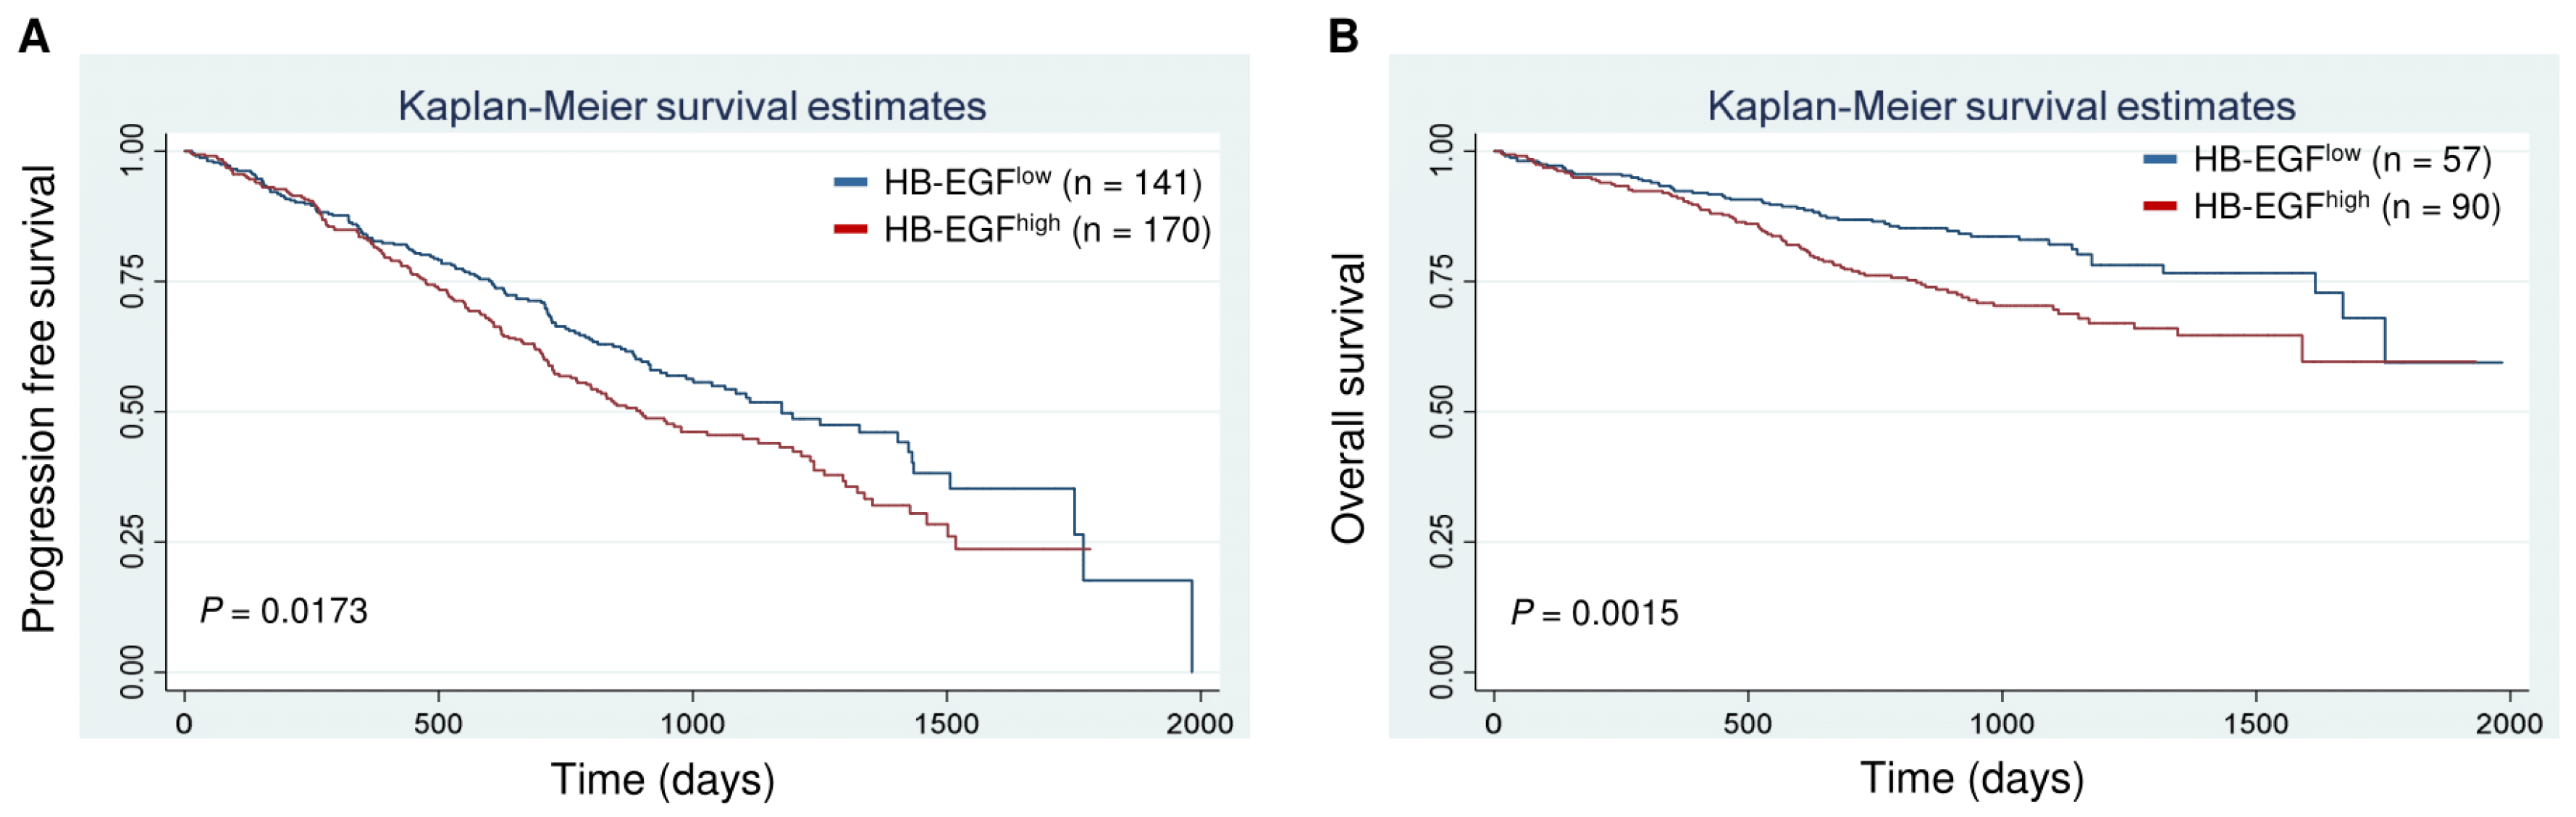
2.7. Clinical Correlates and Prognostic Significance (CoMMpass Study)
3. Discussion
4. Materials and Methods
4.1. Biological Materials
4.2. Cell Isolation and Culture Procedures
4.3. Conditioned Media
4.4. Real-Time PCR
4.5. Immunochemical Procedures
4.6. HB-EGF Determination via ELISA
4.7. Functional Assays
4.8. RNA Interference
4.9. MM Xenograft Model
4.10. Survival Analysis of CoMMpass Data
4.11. Statistical Analyses
Supplementary Materials
Author Contributions
Funding
Acknowledgments
Conflicts of Interest
References
- Wieduwilt, M.J.; Moasser, M.M. The epidermal growth factor receptor family: Biology driving targeted therapeutics. Cell Mol. Life Sci. 2008, 65, 1566–1584. [Google Scholar] [CrossRef] [PubMed]
- Ellis, L.M. Epidermal growth factor receptor in tumor angiogenesis. Hematol. Oncol. Clin. N. Am. 2004, 18, 1007–1021. [Google Scholar] [CrossRef] [PubMed]
- Normanno, N.; De Luca, A.; Bianco, C.; Strizzi, L.; Mancino, M.; Maiello, M.R.; Carotenuto, A.; De Feo, G.; Caponigro, F.; Salomon, D.S. Epidermal growth factor receptor (EGFR) signaling in cancer. Gene 2006, 366, 2–16. [Google Scholar] [CrossRef]
- Sigismund, S.; Avanzato, D.; Lanzetti, L. Emerging functions of the EGFR in cancer. Mol. Oncol. 2018, 12, 3–20. [Google Scholar] [CrossRef] [PubMed]
- Sasaki, T.; Hiroki, K.; Yamashita, Y. The role of epidermal growth factor receptor in cancer metastasis and microenvironment. BioMed Res. Int. 2013, 2013, 546318. [Google Scholar] [CrossRef] [PubMed]
- Singh, B.; Carpenter, G.; Coffey, R.J. EGF receptor ligands: Recent advances. F1000Research 2016, 5. [Google Scholar] [CrossRef]
- Seshacharyulu, P.; Ponnusamy, M.P.; Haridas, D.; Jain, M.; Ganti, A.K.; Batra, S.K. Targeting the EGFR signaling pathway in cancer therapy. Expert Opin. Ther. Targets 2012, 16, 15–31. [Google Scholar] [CrossRef]
- Ray, M.; Salgia, R.; Vokes, E.E. The role of EGFR inhibition in the treatment of non-small cell lung cancer. Oncologist 2009, 14, 1116–1130. [Google Scholar] [CrossRef]
- Miyamoto, S.; Iwamoto, R.; Furuya, A.; Takahashi, K.; Sasaki, Y.; Ando, H.; Yotsumoto, F.; Yoneda, T.; Hamaoka, M.; Yagi, H.; et al. A novel anti-human HB-EGF monoclonal antibody with multiple antitumor mechanisms against ovarian cancer cells. Clin. Cancer Res. 2011, 17, 6733–6741. [Google Scholar] [CrossRef]
- Taylor, S.R.; Markesbery, M.G.; Harding, P.A. Heparin-binding epidermal growth factor-like growth factor (HB-EGF) and proteolytic processing by a disintegrin and metalloproteinases (ADAM): A regulator of several pathways. Semin. Cell Dev. Biol. 2014, 28, 22–30. [Google Scholar] [CrossRef]
- Ettinger, D.S. Clinical implications of EGFR expression in the development and progression of solid tumors: Focus on non-small cell lung cancer. Oncologist 2006, 11, 358–373. [Google Scholar] [CrossRef] [PubMed]
- Ito, Y.; Higashiyama, S.; Takeda, T.; Yamamoto, Y.; Wakasa, K.I.; Matsuura, N. Expression of Heparin-Binding Epidermal Growth Factor-like Growth Factor in Pancreatic Adenocarcinoma. Int. J. Pancreatol. 2001, 29, 47–52. [Google Scholar] [CrossRef]
- Kumar, S.K.; Rajkumar, V.; Kyle, R.A.; van Duin, M.; Sonneveld, P.; Mateos, M.V.; Gay, F.; Anderson, K.C. Multiple myeloma. Nat. Rev. Dis. Primers 2017, 3, 17046. [Google Scholar] [CrossRef] [PubMed]
- Wang, Y.D.; De Vos, J.; Jourdan, M.; Couderc, G.; Lu, Z.Y.; Rossi, J.F.; Klein, B. Cooperation between heparin-binding EGF-like growth factor and interleukin-6 in promoting the growth of human myeloma cells. Oncogene 2002, 21, 2584–2592. [Google Scholar] [CrossRef][Green Version]
- Mahtouk, K.; Jourdan, M.; De Vos, J.; Hertogh, C.; Fiol, G.; Jourdan, E.; Rossi, J.F.; Klein, B. An inhibitor of the EGF receptor family blocks myeloma cell growth factor activity of HB-EGF and potentiates dexamethasone or anti-IL-6 antibody-induced apoptosis. Blood 2004, 103, 1829–1837. [Google Scholar] [CrossRef] [PubMed][Green Version]
- Mahtouk, K.; Hose, D.; Reme, T.; De Vos, J.; Jourdan, M.; Moreaux, J.; Fiol, G.; Raab, M.; Jourdan, E.; Grau, V.; et al. Expression of EGF-family receptors and amphiregulin in multiple myeloma. Amphiregulin is a growth factor for myeloma cells. Oncogene 2005, 24, 3512–3524. [Google Scholar] [CrossRef]
- Ongusaha, P.P.; Kwak, J.C.; Zwible, A.J.; Macip, S.; Higashiyama, S.; Taniguchi, N.; Fang, L.; Lee, S.W. HB-EGF is a potent inducer of tumor growth and angiogenesis. Cancer Res. 2004, 64, 5283–5290. [Google Scholar] [CrossRef]
- Yagi, H.; Yotsumoto, F.; Miyamoto, S. Heparin-binding epidermal growth factor-like growth factor promotes transcoelomic metastasis in ovarian cancer through epithelial-mesenchymal transition. Mol. Cancer Ther. 2008, 7, 3441–3451. [Google Scholar] [CrossRef]
- Leone, P.; Di Lernia, G.; Solimando, A.G.; Cicco, S.; Saltarella, I.; Lamanuzzi, A.; Ria, R.; Frassanito, M.A.; Ponzoni, M.; Ditonno, P.; et al. Bone marrow endothelial cells sustain a tumor-specific CD8(+) T cell subset with suppressive function in myeloma patients. Oncoimmunology 2019, 8, e1486949. [Google Scholar] [CrossRef]
- Vacca, A.; Ribatti, D. Bone marrow angiogenesis in multiple myeloma. Leukemia 2006, 20, 193–199. [Google Scholar] [CrossRef]
- Jakob, C.; Sterz, J.; Zavrski, I.; Heider, U.; Kleeberg, L.; Fleissner, C.; Kaiser, M.; Sezer, O. Angiogenesis in multiple myeloma. Eur. J. Cancer 2006, 42, 1581–1590. [Google Scholar] [CrossRef] [PubMed]
- Barchnicka, A.; Olejniczak-Nowakowska, M.; Krupa-Kotara, K.; Grosicki, S. The importance of antiangiogenic effect in multiple myeloma treatment. Adv. Clin. Exp. Med. 2018, 27, 291–297. [Google Scholar] [CrossRef] [PubMed]
- Solimando, A.G.; Da Via, M.C.; Cicco, S.; Leone, P.; Di Lernia, G.; Giannico, D.; Desantis, V.; Frassanito, M.A.; Morizio, A.; Delgado Tascon, J.; et al. High-Risk Multiple Myeloma: Integrated Clinical and Omics Approach Dissects the Neoplastic Clone and the Tumor Microenvironment. J. Clin. Med. 2019, 8. [Google Scholar] [CrossRef] [PubMed]
- Lagana, A.; Perumal, D.; Melnekoff, D.; Readhead, B.; Kidd, B.A.; Leshchenko, V.; Kuo, P.Y.; Keats, J.; DeRome, M.; Yesil, J.; et al. Integrative network analysis identifies novel drivers of pathogenesis and progression in newly diagnosed multiple myeloma. Leukemia 2018, 32, 120–130. [Google Scholar] [CrossRef]
- Kucharczuk, C.R.; Ganetsky, A.; Vozniak, J.M. Drug-Drug Interactions, Safety, and Pharmacokinetics of EGFR Tyrosine Kinase Inhibitors for the Treatment of Non-Small Cell Lung Cancer. J. Adv. Pract. Oncol. 2018, 9, 189–200. [Google Scholar]
- Moore, M.J.; Goldstein, D.; Hamm, J.; Figer, A.; Hecht, J.R.; Gallinger, S.; Au, H.J.; Murawa, P.; Walde, D.; Wolff, R.A.; et al. Erlotinib plus gemcitabine compared with gemcitabine alone in patients with advanced pancreatic cancer: A phase III trial of the National Cancer Institute of Canada Clinical Trials Group. J. Clin. Oncol. 2007, 25, 1960–1966. [Google Scholar] [CrossRef]
- Rosell, R.; Carcereny, E.; Gervais, R.; Vergnenegre, A.; Massuti, B.; Felip, E.; Palmero, R.; Garcia-Gomez, R.; Pallares, C.; Sanchez, J.M.; et al. Erlotinib versus standard chemotherapy as first-line treatment for European patients with advanced EGFR mutation-positive non-small-cell lung cancer (EURTAC): A multicentre, open-label, randomised phase 3 trial. Lancet Oncol. 2012, 13, 239–246. [Google Scholar] [CrossRef]
- Raponi, M.; Winkler, H.; Dracopoli, N.C. KRAS mutations predict response to EGFR inhibitors. Curr. Opin. Pharmacol. 2008, 8, 413–418. [Google Scholar] [CrossRef]
- Da Costa, N.M.; Fialho, A.D.; Proietti, C.C.; da Silva Kataoka, M.S.; Jaeger, R.G.; de Alves-Junior, S.M.; de Jesus Viana Pinheiro, J. Role of hypoxia-related proteins in invasion of ameloblastoma cells: Crosstalk between NOTCH1, hypoxia-inducible factor 1alpha, a disintegrin and metalloproteinase 12, and heparin-binding epidermal growth factor. Histopathology 2016, 69, 99–106. [Google Scholar] [CrossRef] [PubMed]
- Kim, J.; Adam, R.M.; Freeman, M.R. Trafficking of nuclear heparin-binding epidermal growth factor-like growth factor into an epidermal growth factor receptor-dependent autocrine loop in response to oxidative stress. Cancer Res. 2005, 65, 8242–8249. [Google Scholar] [CrossRef]
- Schrevel, M.; Osse, E.M.; Prins, F.A.; Trimbos, J.; Fleuren, G.J.; Gorter, A.; Jordanova, E.S. Autocrine expression of the epidermal growth factor receptor ligand heparin-binding EGF-like growth factor in cervical cancer. Int. J. Oncol. 2017, 50, 1947–1954. [Google Scholar] [CrossRef] [PubMed]
- Zhou, Z.N.; Sharma, V.P.; Beaty, B.T.; Roh-Johnson, M.; Peterson, E.A.; Van Rooijen, N.; Kenny, P.A.; Wiley, H.S.; Condeelis, J.S.; Segall, J.E. Autocrine HBEGF expression promotes breast cancer intravasation, metastasis and macrophage-independent invasion in vivo. Oncogene 2014, 33, 3784–3793. [Google Scholar] [CrossRef] [PubMed]
- Zhang, X.D.; Baladandayuthapani, V.; Lin, H.; Mulligan, G.; Li, B.; Esseltine, D.W.; Qi, L.; Xu, J.; Hunziker, W.; Barlogie, B.; et al. Tight Junction Protein 1 Modulates Proteasome Capacity and Proteasome Inhibitor Sensitivity in Multiple Myeloma via EGFR/JAK1/STAT3 Signaling. Cancer Cell 2016, 29, 639–652. [Google Scholar] [CrossRef] [PubMed]
- Porta, R.; Sanchez-Torres, J.M.; Paz-Ares, L.; Massuti, B.; Reguart, N.; Mayo, C.; Lianes, P.; Queralt, C.; Guillem, V.; Salinas, P.; et al. Brain metastases from lung cancer responding to erlotinib: The importance of EGFR mutation. Eur. Respir. J. 2011, 37, 624–631. [Google Scholar] [CrossRef]
- Sun, C.; Wang, L.; Huang, S.; Heynen, G.J.; Prahallad, A.; Robert, C.; Haanen, J.; Blank, C.; Wesseling, J.; Willems, S.M.; et al. Reversible and adaptive resistance to BRAF(V600E) inhibition in melanoma. Nature 2014, 508, 118–122. [Google Scholar] [CrossRef]
- Wang, B.; Krall, E.B.; Aguirre, A.J.; Kim, M.; Widlund, H.R.; Doshi, M.B.; Sicinska, E.; Sulahian, R.; Goodale, A.; Cowley, G.S.; et al. ATXN1L, CIC, and ETS Transcription Factors Modulate Sensitivity to MAPK Pathway Inhibition. Cell Rep. 2017, 18, 1543–1557. [Google Scholar] [CrossRef] [PubMed]
- Yang, R.; Chen, L.H.; Hansen, L.J.; Carpenter, A.B.; Moure, C.J.; Liu, H.; Pirozzi, C.J.; Diplas, B.H.; Waitkus, M.S.; Greer, P.K.; et al. Cic Loss Promotes Gliomagenesis via Aberrant Neural Stem Cell Proliferation and Differentiation. Cancer Res. 2017, 77, 6097–6108. [Google Scholar] [CrossRef] [PubMed]
- Da Via, M.C.; Solimando, A.G.; Garitano-Trojaola, A.; Barrio, S.; Munawar, U.; Strifler, S.; Haertle, L.; Rhodes, N.; Teufel, E.; Vogt, C.; et al. CIC Mutation as a Molecular Mechanism of Acquired Resistance to Combined BRAF-MEK Inhibition in Extramedullary Multiple Myeloma with Central Nervous System Involvement. Oncologist 2019. [Google Scholar] [CrossRef]
- Leich, E.; Weissbach, S.; Klein, H.U.; Grieb, T.; Pischimarov, J.; Stuhmer, T.; Chatterjee, M.; Steinbrunn, T.; Langer, C.; Eilers, M.; et al. Multiple myeloma is affected by multiple and heterogeneous somatic mutations in adhesion- and receptor tyrosine kinase signaling molecules. Blood Cancer J. 2013, 3, e102. [Google Scholar] [CrossRef]
- Andrulis, M.; Lehners, N.; Capper, D.; Penzel, R.; Heining, C.; Huellein, J.; Zenz, T.; von Deimling, A.; Schirmacher, P.; Ho, A.D.; et al. Targeting the BRAF V600E mutation in multiple myeloma. Cancer Discov. 2013, 3, 862–869. [Google Scholar] [CrossRef]
- Chang, H.; Sloan, S.; Li, D.; Keith Stewart, A. Multiple myeloma involving central nervous system: High frequency of chromosome 17p13.1 (p53) deletions. Br. J. Haematol. 2004, 127, 280–284. [Google Scholar] [CrossRef] [PubMed]
- Short, K.D.; Rajkumar, S.V.; Larson, D.; Buadi, F.; Hayman, S.; Dispenzieri, A.; Gertz, M.; Kumar, S.; Mikhael, J.; Roy, V.; et al. Incidence of extramedullary disease in patients with multiple myeloma in the era of novel therapy, and the activity of pomalidomide on extramedullary myeloma. Leukemia 2011, 25, 906–908. [Google Scholar] [CrossRef] [PubMed]
- Kopetz, S.; Grothey, A.; Yaeger, R.; Van Cutsem, E.; Desai, J.; Yoshino, T.; Wasan, H.; Ciardiello, F.; Loupakis, F.; Hong, Y.S.; et al. Encorafenib, Binimetinib, and Cetuximab in BRAF V600E-Mutated Colorectal Cancer. N. Engl. J. Med. 2019, 381, 1632–1643. [Google Scholar] [CrossRef] [PubMed]
- International Myeloma Working, G. Criteria for the classification of monoclonal gammopathies, multiple myeloma and related disorders: A report of the International Myeloma Working Group. Br. J. Haematol. 2003, 121, 749–757. [Google Scholar] [CrossRef]
- Schellerer, V.S.; Croner, R.S.; Weinlander, K.; Hohenberger, W.; Sturzl, M.; Naschberger, E. Endothelial cells of human colorectal cancer and healthy colon reveal phenotypic differences in culture. Lab. Investig. 2007, 87, 1159–1170. [Google Scholar] [CrossRef][Green Version]
- Rao, L.; De Veirman, K.; Giannico, D.; Saltarella, I.; Desantis, V.; Frassanito, M.A.; Solimando, A.G.; Ribatti, D.; Prete, M.; Harstrick, A.; et al. Targeting angiogenesis in multiple myeloma by the VEGF and HGF blocking DARPin((R)) protein MP0250: A preclinical study. Oncotarget 2018, 9, 13366–13381. [Google Scholar] [CrossRef]
- Guidolin, D.; Vacca, A.; Nussdorfer, G.G.; Ribatti, D. A new image analysis method based on topological and fractal parameters to evaluate the angiostatic activity of docetaxel by using the Matrigel assay in vitro. Microvasc. Res. 2004, 67, 117–124. [Google Scholar] [CrossRef]
- Ribatti, D.; Nico, B.; Vacca, A.; Presta, M. The gelatin sponge-chorioallantoic membrane assay. Nat. Protoc. 2006, 1, 85–91. [Google Scholar] [CrossRef]
- Zhang, W.; Peyton, M.; Xie, Y.; Soh, J.; Minna, J.D.; Gazdar, A.F.; Frenkel, E.P. Histone deacetylase inhibitor romidepsin enhances anti-tumor effect of erlotinib in non-small cell lung cancer (NSCLC) cell lines. J. Thorac. Oncol. 2009, 4, 161–166. [Google Scholar] [CrossRef]
- Conesa, A.; Madrigal, P.; Tarazona, S.; Gomez-Cabrero, D.; Cervera, A.; McPherson, A.; Szczesniak, M.W.; Gaffney, D.J.; Elo, L.L.; Zhang, X.; et al. A survey of best practices for RNA-seq data analysis. Genome Biol. 2016, 17, 13. [Google Scholar] [CrossRef]


© 2020 by the authors. Licensee MDPI, Basel, Switzerland. This article is an open access article distributed under the terms and conditions of the Creative Commons Attribution (CC BY) license (http://creativecommons.org/licenses/by/4.0/).
Share and Cite
Rao, L.; Giannico, D.; Leone, P.; Solimando, A.G.; Maiorano, E.; Caporusso, C.; Duda, L.; Tamma, R.; Mallamaci, R.; Susca, N.; et al. HB-EGF–EGFR Signaling in Bone Marrow Endothelial Cells Mediates Angiogenesis Associated with Multiple Myeloma. Cancers 2020, 12, 173. https://doi.org/10.3390/cancers12010173
Rao L, Giannico D, Leone P, Solimando AG, Maiorano E, Caporusso C, Duda L, Tamma R, Mallamaci R, Susca N, et al. HB-EGF–EGFR Signaling in Bone Marrow Endothelial Cells Mediates Angiogenesis Associated with Multiple Myeloma. Cancers. 2020; 12(1):173. https://doi.org/10.3390/cancers12010173
Chicago/Turabian StyleRao, Luigia, Donato Giannico, Patrizia Leone, Antonio Giovanni Solimando, Eugenio Maiorano, Concetta Caporusso, Loren Duda, Roberto Tamma, Rosanna Mallamaci, Nicola Susca, and et al. 2020. "HB-EGF–EGFR Signaling in Bone Marrow Endothelial Cells Mediates Angiogenesis Associated with Multiple Myeloma" Cancers 12, no. 1: 173. https://doi.org/10.3390/cancers12010173
APA StyleRao, L., Giannico, D., Leone, P., Solimando, A. G., Maiorano, E., Caporusso, C., Duda, L., Tamma, R., Mallamaci, R., Susca, N., Buonavoglia, A., Da Vià, M. C., Ribatti, D., De Re, V., Vacca, A., & Racanelli, V. (2020). HB-EGF–EGFR Signaling in Bone Marrow Endothelial Cells Mediates Angiogenesis Associated with Multiple Myeloma. Cancers, 12(1), 173. https://doi.org/10.3390/cancers12010173