Review

The Genetic Architecture of Gliomagenesis–Genetic Risk Variants Linked to Specific Molecular Subtypes

1
Department of Radiation Sciences, Oncology, Umeå University, 901 87 Umeå, Sweden
2
Department of Medical Bioscience, Umeå University, 901 87 Umeå, Sweden
3
Department of Advanced Home Care, Linköping University and Department of Clinical and Experimental Medicine, Linköping University, 581 83 Linköping, Sweden
4
Department of Health Research and Policy (Epidemiology), Stanford University School of Medicine, Stanford, CA 94305, USA
5
Department of Medicine, Dan L. Duncan Comprehensive Cancer Center, Baylor College of Medicine, Houston, TX 77030, USA
*
Author to whom correspondence should be addressed.
These authors contributed equally to this work.
Cancers 2019, 11(12), 2001; https://doi.org/10.3390/cancers11122001
Submission received: 28 October 2019 / Revised: 5 December 2019 / Accepted: 7 December 2019 / Published: 12 December 2019
(This article belongs to the Special Issue Tumors of the Central Nervous System: An Update)

Abstract

:
Genome-wide association studies have identified 25 germline genetic loci that increase the risk of glioma. The somatic tumor molecular alterations, including IDH-mutation status and 1p/19q co-deletion, have been included into the WHO 2016 classification system for glioma. To investigate how the germline genetic risk variants correlate with the somatic molecular subtypes put forward by WHO, we performed a meta-analysis that combined findings from 330 Swedish cases and 876 controls with two other recent studies. In total, 5,103 cases and 10,915 controls were included. Three categories of associations were found. First, variants in TERT and TP53 were associated with increased risk of all glioma subtypes. Second, variants in CDKN2B-AS1, EGFR, and RTEL1 were associated with IDH-wildtype glioma. Third, variants in CCDC26 (the 8q24 locus), C2orf80 (close to IDH), LRIG1, PHLDB1, ETFA, MAML2 and ZBTB16 were associated with IDH-mutant glioma. We therefore propose three etiopathological pathways in gliomagenesis based on germline variants for future guidance of diagnosis and potential functional targets for therapies. Future prospective clinical trials of patients with suspicion of glioma diagnoses, using the genetic variants as biomarkers, are necessary to disentangle how strongly they can predict glioma diagnosis.

1. Introduction

Gliomas have several subtypes and the most recent update of glioma classification from the world health organization (WHO) 2016 added a layer of somatic molecular information to the classification of subtypes, including IDH mutation status and 1p/19q co-deletion [1]. The most aggressive type of glioma, glioblastoma (GBM), is defined as either IDH-wildtype (IDH-wt) or IDH-mutant. Primary GBM lacks IDH mutation and often has somatic promotor TERT mutations and EGFR amplification apart from high levels of mitosis and necrosis. Lower grade glioma (non-GBM) is classified morphologically into diffuse astrocytoma, oligodendroglioma, anaplastic astrocytoma, or anaplastic oligodendroglioma. This leads to three overarching molecular subgroups, namely IDH-wt, IDH-mutant and 1p/19q intact, or IDH-mutant and 1p/19q co-deleted [1].
Understanding the etiology and the development from a normal cell to a tumor cell is a powerful way to find methods for prevention and surveillance. It opens up the possibility to identify general mechanisms for tumor development that can be potential targets for treatment. Very few external etiological factors have been established for glioma apart from high doses of ionizing radiation, which is a rare exposure [2]. One possible assumption is that the etiology of glioma largely can be explained by genetic interplay between inherited genetic variants [3]. Not only high penetrant mutations in hereditary syndromes can lead to increased glioma risk, as recent genome-wide association studies identified 25 single nucleotide variants (SNVs) that were associated with glioma risk in adults [3,4,5,6,7,8]. Some of these germline genetic variants could potentially be used to support the tissue-based WHO pathological classification through blood diagnostics.
The aims of this study are to investigate how these genetic variants are distributed among the molecular sub-classifications of glioma used in WHO 2016 and to give an overview of which pathways could be targets for future functional studies of the genotypes and eventually drug development. We used 330 cases and 876 controls from the Swedish Glioma International Case-Control (GICC) study for our analyses. Furthermore, in order to provide robust results, we conducted a meta-analysis to combine our results with two recent large studies [9,10]. The genetic risk variants were then categorized into three groups, based on their pattern of association with glioma molecular subgroups: (1) SNVs in TP53 and TERT associated with all glioma; (2) SNVs in CDKN2B-AS1, EGFR, near EGFR, and RTEL1 associated with IDH-wt glioma; and (3) SNVs in CCDC26, C2orf80, PHLDB1, ETFA, LRIG1, ZBTB16 and MAML2 associated with IDH-mutant glioma.

2. Results

2.1. Descriptive Characteristics of Datasets

Table 1 shows the characteristics of 5103 cases and 10,915 controls in three studies. The ratios of control to case numbers were 2.65, 3.54, and 0.32 in the current, Labreche’s and Eckel-Passow’s studies, respectively [9,10]. The proportion of GBM cases was higher in our study (62.7%) than Eckel-Passow’s (41.9%) and Labreche’s studies (30.0%).
Labreche et al. and Eckel-Passow et al. classified cases into five molecular subgroups, based on IDH mutation, 1p/19q co-deletion and TERT promotor mutation [9,10]. The latter aberration is not formally a part of the WHO classification. For the purpose of the meta-analysis, we discarded the TERT promotor mutation status as a classifier, and regrouped all cases into three subtypes based on IDH mutation and 1p/19q co-deletion statuses; (1) IDH-wt subtype, including the previous groups “triple negative” and “TERT only”, (2) IDH-mutant and 1p/19q intact subtype, including the previous groups “TERT-IDH” and “IDH-only”, and (3) IDH-mutant and 1p/19q co-deleted subtype, including the previous group “triple positive”.
The results of the meta-analysis and the OR (95% CI) in each study are shown in Figure 1, Figure S1 and Table S2. Based on our and previously published results, we suggest three different subtype-specific models of gliomagenesis as shown in Figure 2 and explained in detail below.

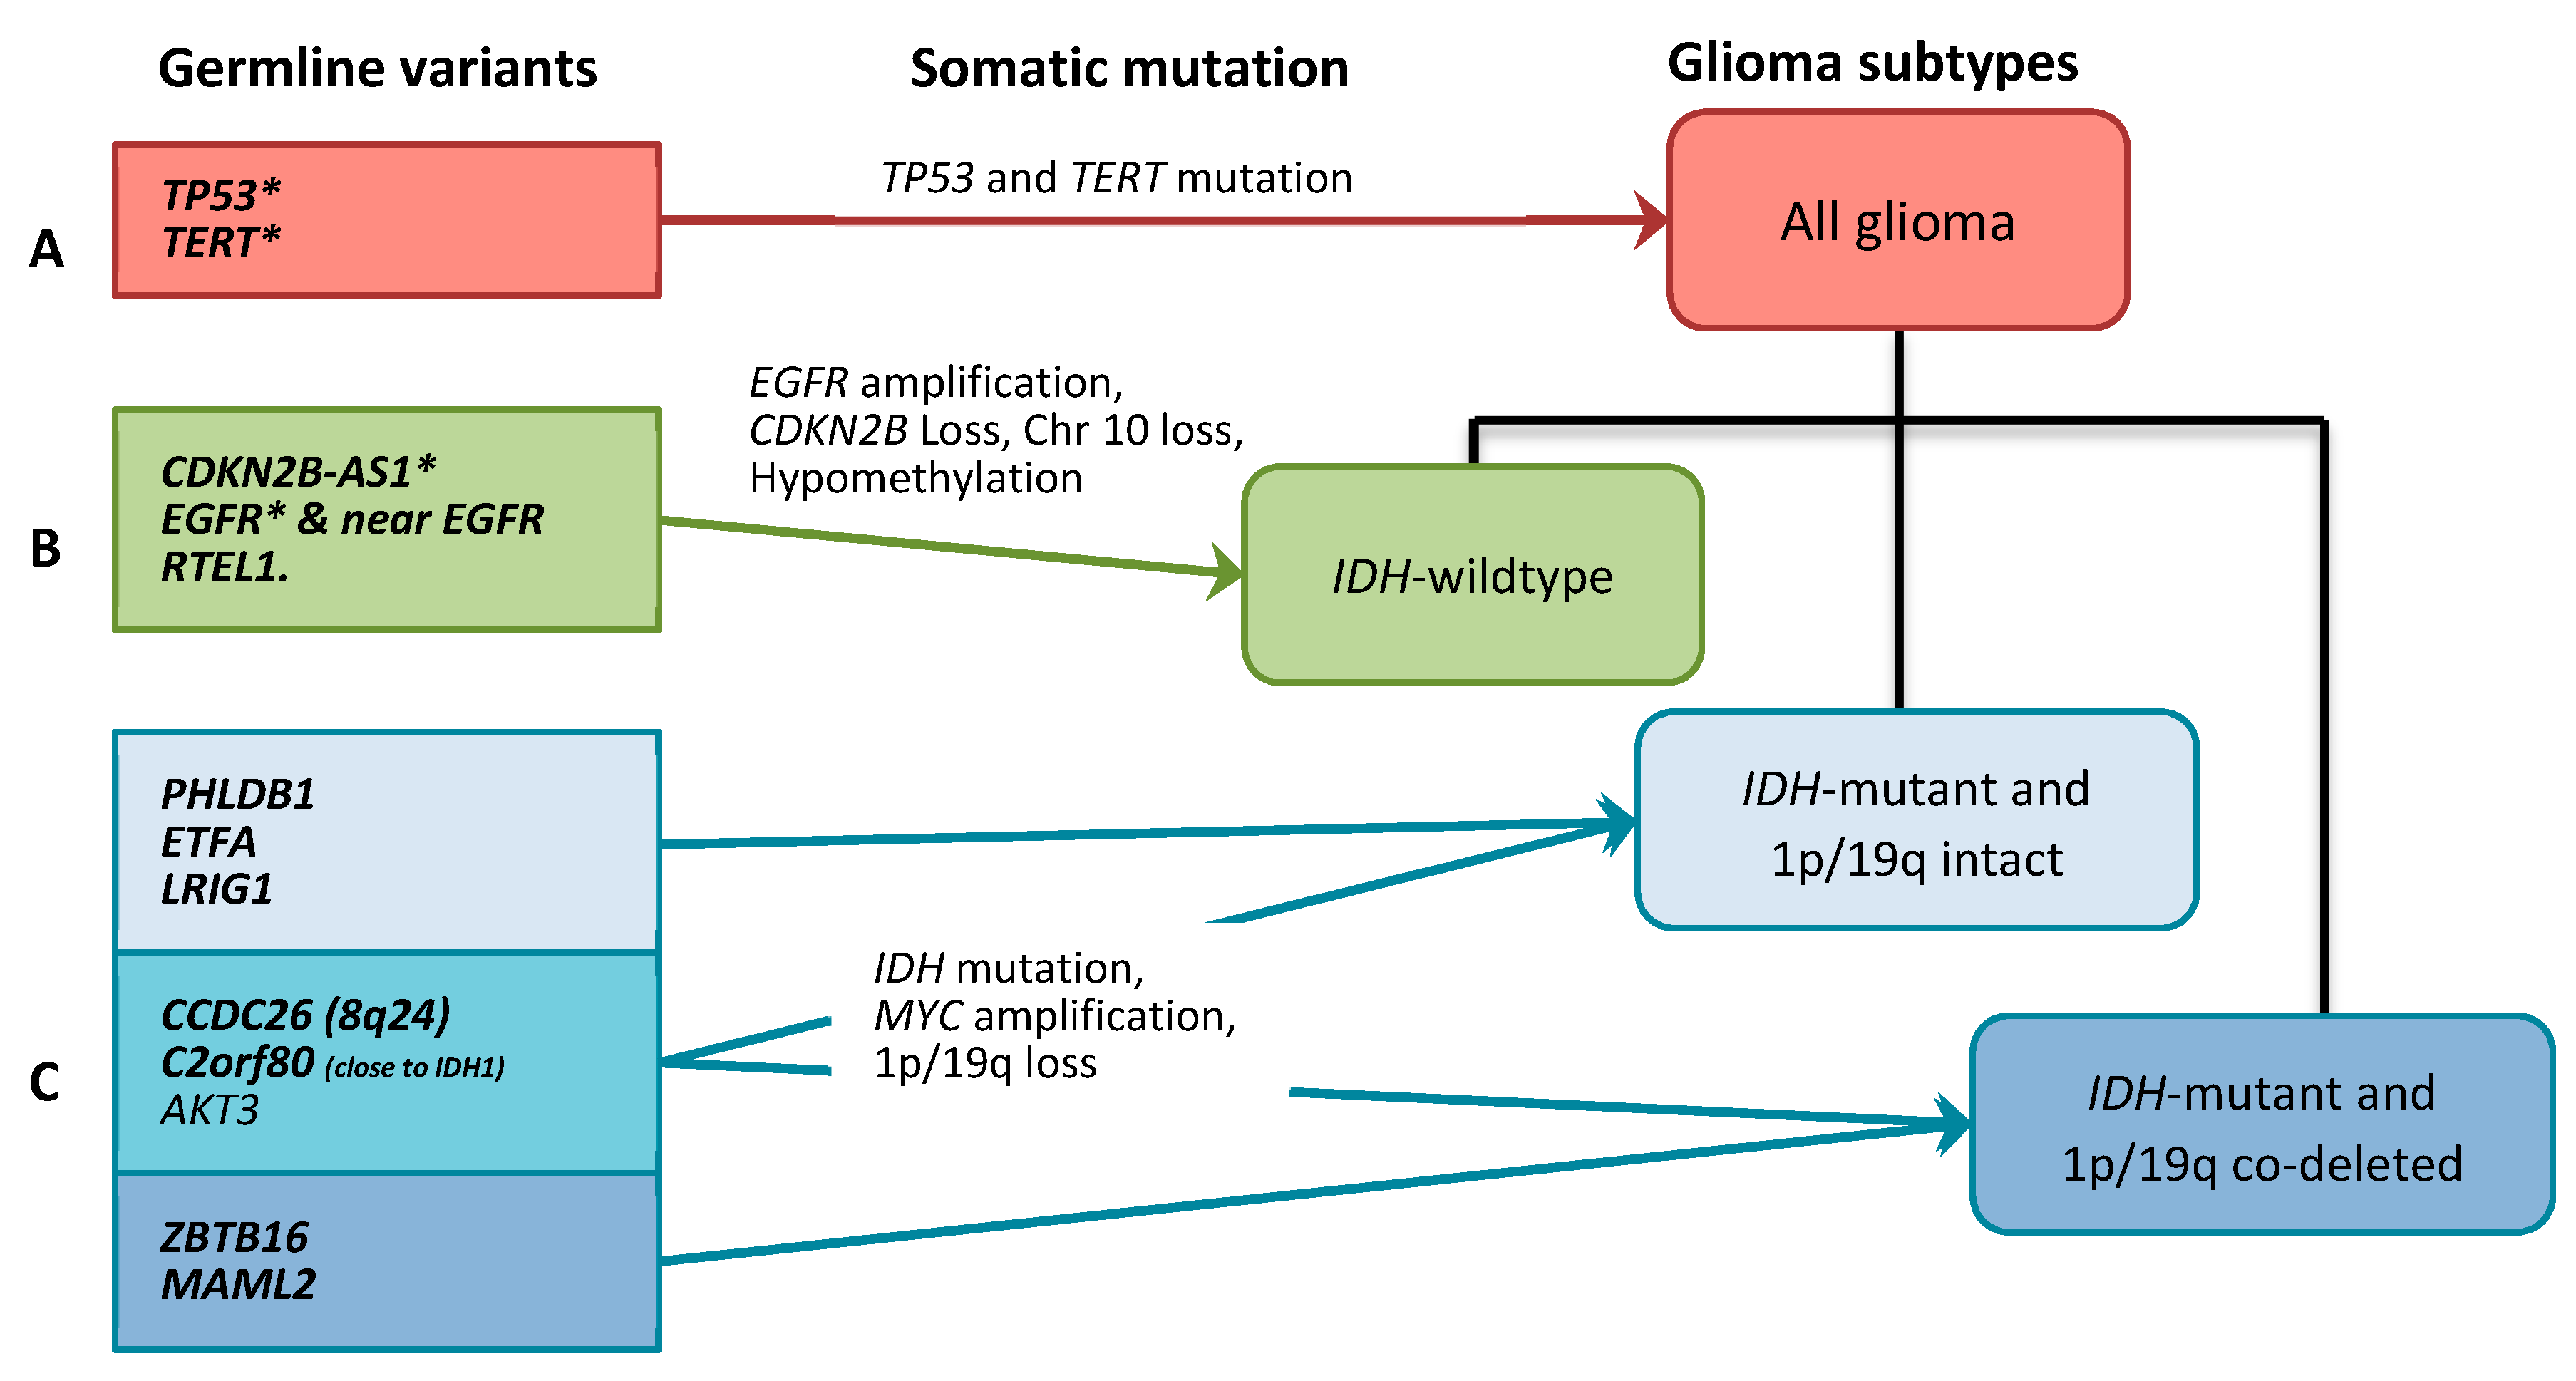
2.2. Gliomagenesis Models

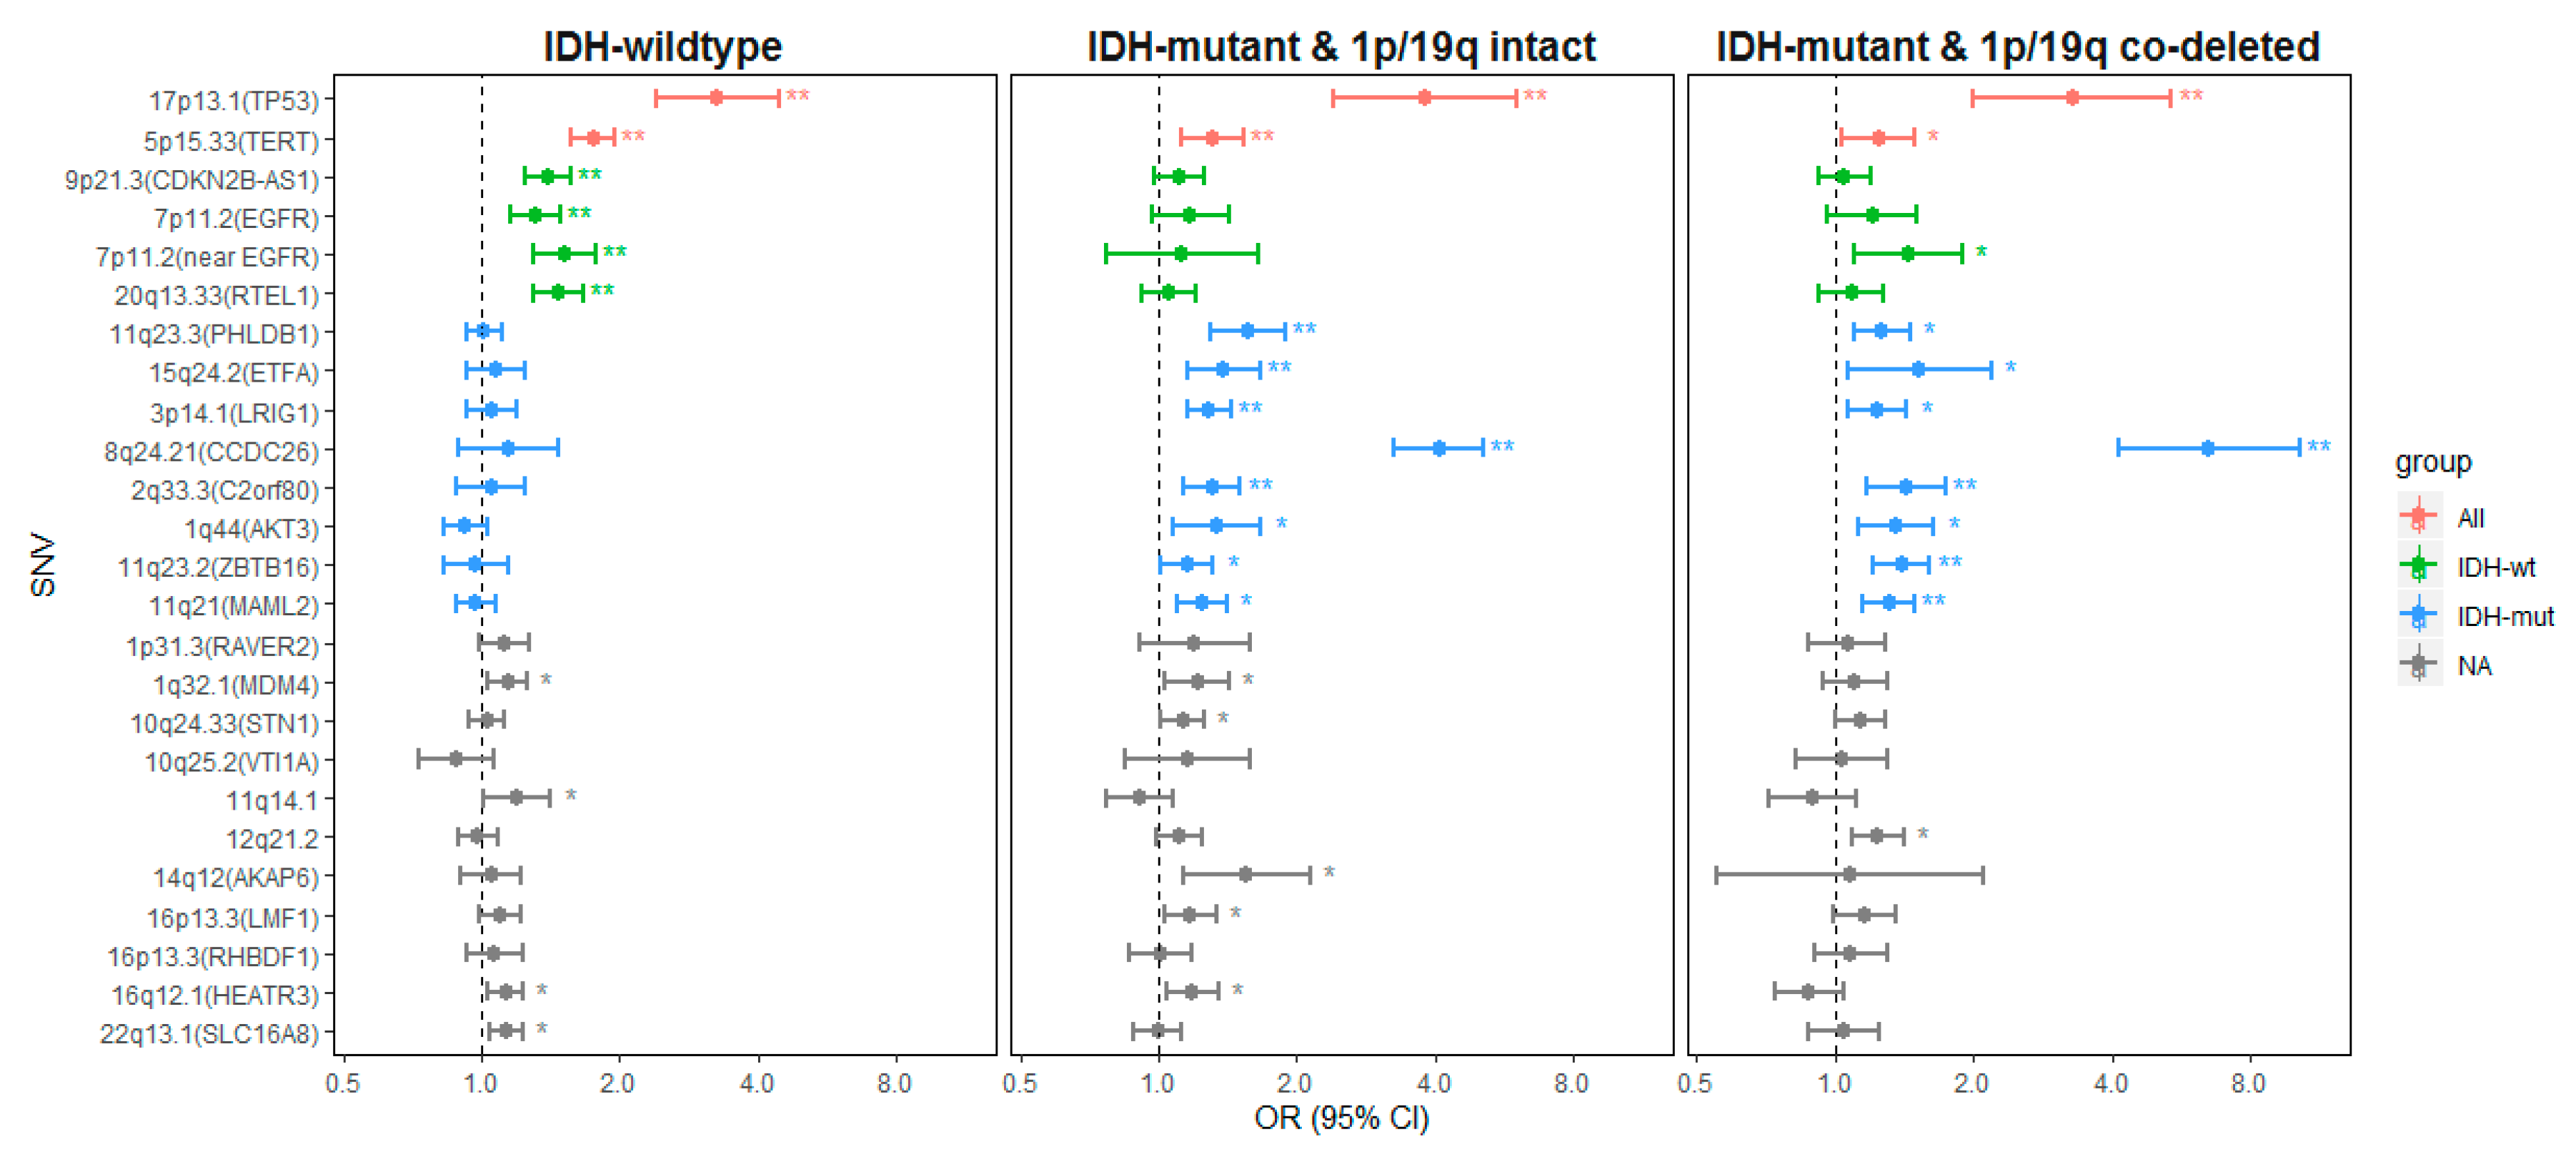
2.2.1. Genetic Variants Associated with all Glioma

According to the findings from the meta-analysis, two SNVs, rs78378222 (in the 3′ UTR region of TP53, 17p13.1) and rs10069690 (TERT, 5p15.33) were associated with increased risk of all glioma subtypes. Consistant and significant association between rs78378222 and all glioma types were found in all three studies (Figure S1). The ORs from the meta-analysis were 3.26 (95% CI = 2.40–4.43), 3.79 (95%CI = 2.40–6.00) and 3.28 (95%CI = 2.00–5.39), for IDH-wt, IDH-mutant and 1p/19q intact, and IDH-mutant and 1p/19q co-deleted subtypes, respectively (Table S2a). The rs10069690 had an association in the same direction for all glioma subtypes (OR = 1.75, 1.31 and 1.24 for IDH-wt, IDH-mutant and 1p/19q intact, and IDH-mutant and 1p/19q co-deleted, respectively), although IDH-mutant and 1p/19q co-deleted was not significant after adjusting for 25×3 tests (p = 0.018).

2.2.2. Genetic Variants Associated with IDH-wt Glioma

Variants in 9p21.3 (CDKN2B- AS1), 7p11.2 (EGFR, intronic and near), and 20q13.33 (RETL1) (as indicated in green in Figure 1) were significantly associated with IDH-wt glioma. The ORs (95%CI) were 1.40 (1.25–1.57), 1.31 (1.15–1.48), 1.51 (1.29–1.77) and 1.47 (1.29–1.67), respectively (Table S2a). Variants in 1q32.1 (MDM4), 16q12.1 (HEATR3), 22q13.1 (SLC16A8) and 11q14.1 were also associated with increased risk of IDH-wt glioma although the results were not significant after adjusting for multiple comparison. Interestingly, the SNV rs75061357 at 7p11.2 (near EGFR) was also associated with IDH-mutant and 1p/19q co-deleted subtype (OR = 1.44, 95%CI = 1.09-1.89, p-value = 0.0092).

2.2.3. Genetic Variants Associated with IDH-Mutant Glioma

Seven SNVs (indicated as blue in Figure 1) were statistically significantly associated with the IDH-mutant glioma subgroups. Strong associations were found between rs55705857 (CCDC26, 8q24.21) and IDH mutation (OR = 6.50 and 4.08 for IDH-mutant with and without 1p/19q co-deletion). The variant in C2orf80 was associated with IDH mutation (OR = 1.42 and 1.31 for IDH-mutant with and without 1p/19q co-deletion). Risk variants in LRIG1, PHLDB1, ETFA, MAML2 and ZBTB16 were also associated with IDH-mutant glioma (Table S2a). After adjusting for multiple comparisons, we found that the LRIG1, PHLDB1 and ETFA SNVs were significantly associated with IDH-mutant and 1p/19q intact subtype and the MALM2 and ZBTB16 SNVs were significantly associated with IDH-mutant and 1p/19q co-deleted subtype (Figure 1). One variant in 1q44 (AKT3) was also associated to the IDH-mutant subtypes regardless of 1p/19q status in all three studies, although the results from the meta-analysis were not statistically significant. We also observed that SNVs, rs4252707 (1p32.1, MDM4), rs11598018 (10q24.33, STN1), rs10131032 (14q12, AKAP6), rs3751667 (16p13.3, LMF1) and rs10852606 (16q12.1, HEATR3), were associated with the increased risk of IDH-mutant and 1p/19q intact subtype. The ORs (95%CI) were 1.22 (1.04–1.43), 1.13 (1.01–1.26), 1.55 (1.13–2.13), 1.18 (1.03–1.34) and 1.19 (1.04–1.35), respectively (Table S2a). However, none of them were significant after adjusting for 25×3 tests in the meta-analysis.

2.3. Genetic Effects on the Gene Expression Levels

To gain insight into the plausible mechanism of the germline variants, we conducted a search for the single-tissue expression quantitative trait loci (eQTL) and splicing expression quantitative trait loci (sQTL) among 25 glioma risk variants using data from 13 regions of normal brain from GTEx portal [11]. For SNVs associated with all subtypes, we didn’t find any significant differences on the gene expression levels (false discovery rate <0.05). Three SNVs associated with the IDH-wt subtype had influences on genes containing and/or neighboring the SNVs. Further, rs723527 (located in EGFR) was associated with expression of EGFR, rs634537 (located in CDKN2B-AS1) was associated with expression of CDKN2A, and rs2297440 (located in RTEL1) was associated with the expression of RTEL1 and six other genes in the region. The variant, rs2297440, was also associated with alternative splicing in two genes, RTEL1 and LIME1 across several brain tissues. Among the SNVs associated with the IDH-mutant subtype, the risk allele (C) of rs11706832 was associated with higher SLC25A26 gene expression levels in nucleus accumbens (basal ganglia) and substantia nigra. The risk variant, rs12803321 was associated with higher expression levels of PHLDB1 and lower expression levels of PR11-158I9.8. The variant was also significantly associated with PHLDB1 splicing. The results were summarized in the Table S3a–b.

3. Discussion

3.1. All Glioma Risk Genes

Defining the etiopathogenesis of different cancer types can be useful for several clinical applications. One example is to develop a biomarker panel for diagnostics of symptomatic patients as it has been successfully done in other diagnoses [12]. Increased basic knowledge of the mechanisms of glioma development could also help discover novel therapeutic targets, in analogy with how PARP inhibitors were discovered as a therapy in BRCA1 positive breast cancer patients [13]. For glioma, there is no robust blood test in diagnostics, even if some different pre-diagnostic biomarkers such as metabolites have been suggested [14]. Current therapeutic options have limited success and novel effective targeted treatments for glioma are urgently needed to improve survival.
The present study highlights a clear pattern of germline genetic variants associated with IDH-mutant and IDH-wildtype glioma, respectively (Figure 2). The variants with lowest frequency and strongest effect size are those most likely to be possible to incorporate in a clinical setting as it was shown in the recent study by Eckel-Passow et al. [10]. In the meta-analyses, we observe an association with all glioma for the TP53 gene variant and the TERT gene variant (Figure 1, group all, indicated in red). The TP53 variant is relatively rare, and its function is associated with both somatic loss of heterozygosity in the region and disrupted TP53 mRNA termination, as shown through previous studies of expression arrays in the TCGA dataset [15,16]. We did not find any differences in expression in the eQTL analyses (Table S3a). Furthermore, TP53 mutations are generally rare in glioma families [17,18]. TP53 is currently tested as a target for therapy, but as yet, no method has been introduced as a common treatment in any type of cancer [18].
TERT encodes for telomerase reverse transcriptase, which has a function in telomere maintenance [19]. The TERT genetic risk variant has been associated with both glioma risk and telomere length indicating a functional effect through telomere regulation [20,21]. Longer leukocyte telomere length has been associated with increased risk of glioma [22,23]. The direct analyses of the single variant in TERT did not show any association with gene expression. However, recent transcriptome-wide association analysis (TWAS) using gene-based approaches that aggregate the effects of multiple variants suggests that the effect of TERT gene variants is mediated by transcription levels of the TERT gene [24]. The TWAS reported an association between genetically predicted TERT gene expression levels and risk of both GBM and non-GBM, which is in line with our finding that the TERT gene variant is associated with risk of glioma, regardless of IDH mutation status. One plausible mechanism of action for the TERT genetic variant is through methylation changes, considering that variants in the genomic area have been associated with lower methylation of a CpG site near the TERT transcription start site, cg23827991 [25,26]. Furthermore, the risk allele of rs10069690 has been shown to create an alternative splice donor site leading to a decrease in telomerase activity [26,27]. The genomic area is pleiotropic, and it is also possible that the variant exerts its function through a telomerase-independent pathway (alternative lengthening of telomeres) rather than by upregulating telomerase activity [28]. Several clinical trials that target TERT and telomere function are ongoing for different types of diseases but currently not for glioma [19].

3.2. IDH-wildtype Glioma Risk Variants

For IDH-wt tumors, there was a strong consistent association with genetic variants in EGFR, CDKN2B-AS1, and the RTEL gene (Figure 1, group IDH-wt indicated in green). Interestingly, EGFR amplification and homozygous deletion of the chromosomal region comprising CDKN2B-AS1 are two of the most common somatic mutations found in IDH-wt tumors, while the same aberrations are uncommon in IDH-mutant tumors [29]. This specifically highlights the importance of these two genes in the development of IDH-wt tumors. The understanding of the initiation of EGFR amplification and the functional aspects thereof are still under investigation [30]. One hypothesis of the link between genetic variants and the risk of subtype-specific disease could be that the genetic variants convey their increased glioma risk through contributing to a chronical activation of the EGFR receptor family that triggers tumor initiation. This is supported by the observation that glioma cases had higher concentrations of sEGFR and sERBB2 protein levels in prediagnostic serum samples from individuals that later developed GBM compared to matched controls [31,32]. In the brain tissue eQTL results, we found that risk variant of rs723527, located in intron 1, was associated with lower levels of EGFR expression. A similar finding was also found in the TWAS that increased expression of EGFR was negatively associated with glioma risk [24]. The mechanism behind how the genetic variant may be related to the development of aberrations in EGFR in GBM is currently unclear. The unexpected finding of lower expression linked to the EGFR variant could indicate different mechanisms in the initiation phase towards glioma development, compared with the fully developed glioblastoma stage [24].
In addition to the gain and amplification of EGFR, GBM has frequent somatic loss of chromosome 9p, which harbours the CDKN2B-AS1 [33]. In previous studies, we have observed a subset of GBMs that have a specific EGFR germline gene variant in combination with somatic loss of CDKN2B, allelic loss of EGFR, and gain of the remaining EGFR allele [34]. This indicates that there may be subgroups of GBMs that have specific tumor features depending on their germline genetic variant status. Additional studies have shown that the EGFR glioma risk variants have been associated with CDKN2B-AS1 loss and EGFR amplification [9,35]. We have sequenced a set of 14 glioma cases with this combination without finding any exonic mutations (unpublished observations). The lack of findings of germline mutations that are in linkage disequilibrium with the germline risk variants suggests other mechanisms of action, such as possibly enhancer or splicing effects. Families with glioma and melanoma have in rare cases been observed with germline mutations in CDKN2A/B region [17,36,37]. The result of tissue eQTL suggests a negative association between rs634537 and CDKN2A expression in brain cortex. The recent TWAS also reported an increased risk of GBM with lower CDKN2B expression levels [24]. Notable, the expression of CDKN2B-AS1 (ANRIL), CDKN2A and CDKN2B is correlated to each other [38]. Those findings were in line with the probable role of CDKN2B as a tumor suppressor gene. However, the exact functional mechanism of the germline genetic variants in the same region is not clear as an integrated analysis of TCGA dataset did not observe any clear link to chromosomal loss or mRNA expression levels of genes at the same genomic locus in the tumors [39].
IDH-wt tumors have lower levels of DNA-methylation compared to IDH-mutant tumors. In a recent study, we found that the methylation pattern of the tumor was associated with two genetic variants in CDKN2B-AS1, i.e., rs1412829 and rs4977756, and the same direction was seen in TCGA dataset [25]. The risk alleles of these variants were associated with lower levels of DNA methylation. This implicates that the functional role of genetic risk variants in the 9p21.3 region may not only be through direct regulation of the nearby tumor suppressor genes CDKN2A/B, but also through distant regulatory effects. Previous studies have shown that the combination of CDKN2B loss and EGFR amplification are early evolutionary events in GBM as they can be observed as a joint event in all parts of the tumor. Functional effects of the risk variants in the regulation of these genes are likely, even if the mechanisms of action still are to be further explored [40]. The mechanism of function in the genetic variant in RTEL is yet to be understood, and there are several other plausible genes in the chromosomal area that could be the actual gene with functional effect such as STMN3 suggested by Labreche et al., or DcR3, a gene that has been differentially expressed in glioma and suggested as a therapeutic target by preclinical studies [41,42].

3.3. IDH-Mutant Glioma Risk Variants

As previously reported, the genetic variant at the 8p24 locus was strongly associated with IDH-mutant gliomas [9,10,43,44]. The variant maps to intron 1 of the long non-coding RNA CCDC26 gene. It has been shown to have a superenhancer effect on the MYC locus (in close proximity to CCDC26) in hematopoietic malignancies [45]. A recent Turkish study of glioma cases showed some evidence of differential MYC expression depending on risk variant carriership indicating a regulation of the MYC locus [46]. There are currently ongoing studies with anti MYC compounds in animal models in conjunction with chemotherapy for other tumor types.
The genetic variant at C2orf80 is located 46kb from the IDH1 gene, which raises the question if it exerts a distance effect on IDH1 itself. It was significantly associated with IDH-mutant glioma, irrespective of 1p/19q co-deletion. The function is not known, but IDH1 is an interesting region as there are several IDH targeted therapies underway, currently tested both in acute myeloid leukemia and in glioma [47].
A non-significant but consistent association across the three studies between the variant in the AKT3 gene and IDH-mutant subtype was observed. AKT has three different isoforms and those have been observed with differential expression in GBM mRNA levels [48]. AKT3 mRNA was higher in lower grade gliomas and patients with tumors expressing higher levels of AKT3 mRNA tended to have longer survival which has also been observed in patients with IDH-mutant subtype.
Furthermore, we observed a significant association between the genetic variants in LRIG1, PHLDB1, ETFA, ZBTB16 and MAML2 and the risk of IDH-mutant glioma. LRIG1 regulates EGFR, and its soluble form has been shown to inhibit in vivo glioma growth irrespective of EGFR status. It exerts an effect as a tumor suppressor in glioma, possibly by a negative downregulation of the MET pathway but not AKT [49]. The LRIG1 genetic risk variant is located in intron 2, relatively close to exon 3, where differential mRNA splicing is one potential functional mechanism, but the exact mechanism by which the increased glioma risk is conveyed is not understood. Functional studies of the PHLDB1 gene with knockdown experiments in cell culture and 3D assays to evaluate the role of PHLDB1 and DDX6 suggest that both PHLDB1 and DDX6 may contribute to the cell viability [50]. TWAS has found an association between risk of non-GBM and the genetically predicted levels of PHLDB1 expression, but also expression of other genes in the region, including TREH, RPL5P30, and TMEM25 [24]. ZBTB16 gene expression has been observed to have a distinct expression pattern associated with GBM prognosis, but no clear role has so far been observed for lower grade glioma tumors [51]. MAML2 and ETFA are currently not established to have a clear role in somatic alterations in glioma. In summary, some genetic variants have suggested modes of function but many still need further investigation.

3.4. Limitations

Some associations were seen only in one or two studies and the mechanisms for this could be several, including differences in population substructures, the case ascertainment through the population based studies compared to tertiary referral centers for some studies and the strength of association and statistical power to detect associations. A prospective integrated study of all new patients having lesions with suspected glioma is necessary to determine the absolute effect of the glioma risk variants as a biomarker panel in the diagnostic setting.

4. Materials and Methods

4.1. Swedish GICC Study Population

The study subjects were those who participated in the Swedish arm of the Glioma International Case-Control (GICC) study. Details of patient recruitment, data collection and quality control were available in previous publications [5,52]. In brief, 18–80 years old cases were recruited between year 2010 and 2013 from five hospitals in Sweden. A total of 476 histologically confirmed newly diagnosed glioma cases and 924 population-based controls were included and genotyped. Subjects were excluded if their sample genotyping call-rate was <99% or reported sex and sex estimated by genotype were inconsistent. Those who were identified as outliers in principle component analyses, and one subject from each pair of subjects with spurious relations (PI-HAT > 0.2) were also excluded. After the quality control, 437 cases and 876 controls were included. A total of 330 patients with SNOMED codes 93,803, 93,823, 94,003, 94,013, 94,203, 94,403, 94,413, 94,503, and 94,513 were successfully obtained the unstained paraffin embedded slides for the classification of subtypes of glioma.

4.2. Genotyping and Imputation in Swedish GICC Study

Genotyping of germline DNA was performed using Illumnia’s Oncoaaray. Untyped variants were imputed using the IMPUTE2 software as previously described [5]. Imputation info scores for 25 SNVs are presented in Table S1. For imputed variants, genotypes were called based on the highest imputed genotype probability. A genotype call was set as “missing” in subjects where all three genotype probabilities for a variant were <0.9.

4.3. Immunohistochemistry in Swedish GICC Study

Based on eosin staining, a neuropathologist reviewed all slides to ensure that adequate tumor tissue was present on each slide. Slides were pretreated and stained against IDH1-R132H as previously described, using Ultra view DAB kit 760 (Roche, Basel Switzerland) and mouse anti IDH1-R132H (Dianova, Hamburg, Germany). All slides were coded to exclude any bias, and analyzed by the same neuropathologist. Representative staining for IDH1-R132H positive and negative staining were shown in Figure S2.

4.4. Fluorescent In Situ Hybridization (FISH) in Swedish GICC Study

Slides were first deparaffinized in xylene and dehydrated in 100% ethanol. Thereafter, slides were placed in a pretreatment solution for 12 min at 80 °C and protease solution for 45 min at 37 °C (according to the instruction in Vysis pretreatment kit IV (Abbot, Abbott Park, Illinois)). Then, slides were washed in H2O and dehydrated in a series of 70%, 80% and 100% ethanol. Sufficient amount of probes was added to cover each section. Slides were co-denatured at 80 °C for 6 min and hybridized over night at 37 °C. For 1p/19q co-deletion, we used “Vysis LSI 1p36/LSI 1q25 and LSI 19q13/19p13 dual-color probe” (Abbott). Unspecific staining was removed by using wash buffer 1 and 2 according to the instruction in the Vysis pretreatment kit IV (Abbott). Sections were counterstained using DAPI-Antifade (Cytocell, Cambridge, UK). Slides were coded to exclude any bias, and two independent observers analyzed 50 cells for each probe and analyzed as previously been described [35]. Representative staining for 1p/19q co-deletion was shown in Figure S3.

4.5. Statistical Analysis

We analyzed 25 SNVs which have been reported to show robustly significant association with the development of adult glioma in the recent GWAS study [5]. The associations between 25 SNVs and glioma subtypes were performed under an additive multinomial logistic regression model. We classified the molecular subtypes into three sub-groups including (1) IDH-wt (and 1p/19q intact), (2) IDH-mutant and 1p/19q intact and (3) IDH-mutant and 1p/19q co-deleted. Gender and first principle component (calculated using EIGENSOFT version 7.2.1) were used to adjust the potential confounding effects, such as population stratification [53,54]. To perform the meta-analysis, the OR and 95% CI of five molecular subtypes classified according to IDH mutation, 1p/19q co-deletion and TERT promotor mutation were first obtained. We then regrouped into three subtypes based on IDH mutation and 1p/19q co-deletion statuses as described above. A random-effects model was used to calculate summary ORs and 95% CIs using the R package “metafor” v2.1-0 [55].

4.6. Expression Quantitative Trait Locus Analysis

We used the V8 GTEx portal (https://gtexportal.org/home/) to investigate the association between 25 germline variants and gene expression levels on 13 regions of normal human brain tissue [11]. A false discovery rate of 0.05 was used to identify the gene with significant expression levels.

5. Conclusions

We used a meta-analysis approach to combine the results from two previously published studies and the present study, and observed a consistent and clear pattern of specific glioma risk variants associated with all glioma, IDH-wt and IDH-mutant glioma, respectively. Several of the 25 glioma risk variants map to, or are in close proximity to, genes that are frequently somatically changed in tumor tissue. Distant regulatory mechanisms or promoter functions have been suggested for some of variants, such as the variants mapping to 8p24, MYC, TERT, PHDLB1, and TP53. Further research into the molecular mechanisms behind the observed associations with increased glioma risk is necessary to improve the understanding of glioma etiopathogenesis. Moreover, it is conceivable that the risk variants eventually could be used as blood-based biomarkers, in conjunction with other pre-operative tools such as PET/MRI imaging, to determine the correct/suspected molecular classification before surgery. A presurgical diagnostic tool could open up for the possibility to give neoadjuvant treatment in a presurgical setting or to define the diagnosis and avoid surgery in vulnerable patients. That has to be determined by prospective trials testing a blood based biomarker test towards pre-surgery biopsies to see if the blood test can classify the molecular subtypes without the need of a surgical biopsy in symptomatic patients. The discovery of germline genetic risk variants has given novel insights into the etiology of glioma, but there are still several steps of systematic research needed before this knowledge may affect patient management.

Supplementary Materials

The following are available online at https://www.mdpi.com/2072-6694/11/12/2001/s1, Figure S1: The forest plot of the meta-analysis by three molecular subtypes, Figure S2: Representative images showing IDH1-R132H positive/mutated (a) and negative/wildtype staining (b). Figure S3: Representative staining showing the quality of our 1p/19q co-deletion assay. Table S1: Overview of glioma risk single nucleotide variants at 25 loci, Table S2: (a) Summary odds ratio, 95% confidence interval and p-value for three molecular subtypes in the meta-analysis, (b) Odds ratio and 95% confidence interval for three molecular subtypes in current study, (c) Odds ratio and 95% confidence interval for three molecular subtypes in Eckel-Passow’s study, (d) Odds ratio and 95% confidence interval for three molecular subtypes in Labreche’s study. Table S3: (a) Results of single-tissue expression quantitative trait loci, (b) Results of single-tissue splicing expression quantitative trait loci.

Author Contributions

Conceptualization, B.M., A.M.D., C.W., and G.J.; methodology, A.M.D. and W.Y.-Y.W.; software, W.Y.-Y.W., A.M.D., and C.W.; validation: A.M.D.; formal analysis, W.Y.-Y.W., A.M.D., and G.J.; investigation, B.M., and M.L.B.; resources, B.M., M.B., T.B., A.M., I.G. and R.H.; data curation, W.Y.-Y.W., A.M.D. and U.A.; writing—original draft preparation, B.M., G.J., W.Y.-Y.W., A.M.D., C.W., and U.A.; writing—review and editing, all authors.; visualization, C.W., W.Y.-Y.W., and A.M.D.; supervision, B.M. and A.M.D.; project administration, U.A., and A.M.; funding acquisition, B.M. and M.L.B.

Funding

This research was funded by the GICC NCI grant R01CA139020/CA/NCI, The Swedish Research council, the Swedish Cancer foundation and the Northern Sweden research foundation as well as Umeå University hospital grant. The U-CAN grant supported the preparation of tissues in the Swedish study.

Acknowledgments

We are grateful to Ulla-Stina Spetz at Department of Medical Bioscience and Mikael Kimdal at Department of Radiation Sciences, Oncology, Umeå University for laboratory technical support. We thank all Neurosurgery departments and Pathology departments that took part and helped recruit patients to the study. The patient slides have been collected throughout Sweden and this would not have been possible without Gudrun Byström, Sara Huggert, Eva Svedberg and Sonia Katsuura at the Oncology Clinic, Umeå University Hospital, the CNS study planning group and the research nurses at the Neurosurgery departments. We also want to thank Jonas Sörlin, Charlotte Andersson and Angelika Brännlund at Clinical Genetics, Umeå University Hospital, for assistance with the FISH analysis.

Conflicts of Interest

The authors declare no conflict of interest.

References

  1. Louis, D.N.; Perry, A.; Reifenberger, G.; von Deimling, A.; Figarella-Branger, D.; Cavenee, W.K.; Ohgaki, H.; Wiestler, O.D.; Kleihues, P.; Ellison, D.W. The 2016 World Health Organization Classification of Tumors of the Central Nervous System: A summary. Acta Neuropathol. 2016, 131, 803–820. [Google Scholar] [CrossRef] [PubMed] [Green Version]
  2. Ostrom, Q.T.; Bauchet, L.; Davis, F.G.; Deltour, I.; Fisher, J.L.; Langer, C.E.; Pekmezci, M.; Schwartzbaum, J.A.; Turner, M.C.; Walsh, K.M.; et al. The epidemiology of glioma in adults: A “state of the science” review. Neuro Oncol. 2014, 16, 896–913. [Google Scholar] [CrossRef] [PubMed] [Green Version]
  3. Kinnersley, B.; Labussiere, M.; Holroyd, A.; Di Stefano, A.L.; Broderick, P.; Vijayakrishnan, J.; Mokhtari, K.; Delattre, J.Y.; Gousias, K.; Schramm, J.; et al. Genome-wide association study identifies multiple susceptibility loci for glioma. Nat. Commun. 2015, 6, 8559. [Google Scholar] [CrossRef] [PubMed]
  4. Shete, S.; Hosking, F.J.; Robertson, L.B.; Dobbins, S.E.; Sanson, M.; Malmer, B.; Simon, M.; Marie, Y.; Boisselier, B.; Delattre, J.Y.; et al. Genome-wide association study identifies five susceptibility loci for glioma. Nat. Genet. 2009, 41, 899–904. [Google Scholar] [CrossRef] [PubMed] [Green Version]
  5. Melin, B.S.; Barnholtz-Sloan, J.S.; Wrensch, M.R.; Johansen, C.; Il’yasova, D.; Kinnersley, B.; Ostrom, Q.T.; Labreche, K.; Chen, Y.; Armstrong, G.; et al. Genome-wide association study of glioma subtypes identifies specific differences in genetic susceptibility to glioblastoma and non-glioblastoma tumors. Nat. Genet. 2017, 49, 789–794. [Google Scholar] [CrossRef] [PubMed]
  6. Wrensch, M.; Jenkins, R.B.; Chang, J.S.; Yeh, R.F.; Xiao, Y.; Decker, P.A.; Ballman, K.V.; Berger, M.; Buckner, J.C.; Chang, S.; et al. Variants in the CDKN2B and RTEL1 regions are associated with high-grade glioma susceptibility. Nat. Genet. 2009, 41, 905–908. [Google Scholar] [CrossRef] [PubMed]
  7. Andersson, U.; Schwartzbaum, J.; Wiklund, F.; Sjostrom, S.; Liu, Y.; Tsavachidis, S.; Ahlbom, A.; Auvinen, A.; Collatz-Laier, H.; Feychting, M.; et al. A comprehensive study of the association between the EGFR and ERBB2 genes and glioma risk. Acta Oncol. 2010, 49, 767–775. [Google Scholar] [CrossRef]
  8. Rajaraman, P.; Melin, B.S.; Wang, Z.; McKean-Cowdin, R.; Michaud, D.S.; Wang, S.S.; Bondy, M.; Houlston, R.; Jenkins, R.B.; Wrensch, M.; et al. Genome-wide association study of glioma and meta-analysis. Hum. Genet. 2012, 131, 1877–1888. [Google Scholar] [CrossRef] [Green Version]
  9. Labreche, K.; Kinnersley, B.; Berzero, G.; Di Stefano, A.L.; Rahimian, A.; Detrait, I.; Marie, Y.; Grenier-Boley, B.; Hoang-Xuan, K.; Delattre, J.Y.; et al. Diffuse gliomas classified by 1p/19q co-deletion, TERT promoter and IDH mutation status are associated with specific genetic risk loci. Acta Neuropathol. 2018, 135, 743–755. [Google Scholar] [CrossRef] [Green Version]
  10. Eckel-Passow, J.E.; Decker, P.A.; Kosel, M.L.; Kollmeyer, T.M.; Molinaro, A.M.; Rice, T.; Caron, A.A.; Drucker, K.L.; Praska, C.E.; Pekmezci, M.; et al. Using germline variants to estimate glioma and subtype risks. Neuro Oncol. 2019, 21, 451–461. [Google Scholar] [CrossRef]
  11. Consortium, G.T. The Genotype-Tissue Expression (GTEx) project. Nat. Genet. 2013, 45, 580–585. [Google Scholar] [CrossRef]
  12. Gronberg, H.; Adolfsson, J.; Aly, M.; Nordstrom, T.; Wiklund, P.; Brandberg, Y.; Thompson, J.; Wiklund, F.; Lindberg, J.; Clements, M.; et al. Prostate cancer screening in men aged 50–69 years (STHLM3): A prospective population-based diagnostic study. Lancet Oncol. 2015, 16, 1667–1676. [Google Scholar] [CrossRef]
  13. Robson, M.; Im, S.A.; Senkus, E.; Xu, B.; Domchek, S.M.; Masuda, N.; Delaloge, S.; Li, W.; Tung, N.; Armstrong, A.; et al. Olaparib for Metastatic Breast Cancer in Patients with a Germline BRCA Mutation. N. Engl. J. Med. 2017, 377, 523–533. [Google Scholar] [CrossRef] [PubMed]
  14. Saenz-Antonanzas, A.; Auzmendi-Iriarte, J.; Carrasco-Garcia, E.; Moreno-Cugnon, L.; Ruiz, I.; Villanua, J.; Egana, L.; Otaegui, D.; Sampron, N.; Matheu, A. Liquid Biopsy in Glioblastoma: Opportunities, Applications and Challenges. Cancers (Basel) 2019, 11, 950. [Google Scholar] [CrossRef] [Green Version]
  15. Stacey, S.N.; Sulem, P.; Jonasdottir, A.; Masson, G.; Gudmundsson, J.; Gudbjartsson, D.F.; Magnusson, O.T.; Gudjonsson, S.A.; Sigurgeirsson, B.; Thorisdottir, K.; et al. A germline variant in the TP53 polyadenylation signal confers cancer susceptibility. Nat. Genet. 2011, 43, 1098–1103. [Google Scholar] [CrossRef]
  16. Wang, Z.; Rajaraman, P.; Melin, B.S.; Chung, C.C.; Zhang, W.; McKean-Cowdin, R.; Michaud, D.; Yeager, M.; Ahlbom, A.; Albanes, D.; et al. Further Confirmation of Germline Glioma Risk Variant rs78378222 in TP53 and Its Implication in Tumor Tissues via Integrative Analysis of TCGA Data. Hum. Mutat. 2015, 36, 684–688. [Google Scholar] [CrossRef] [Green Version]
  17. Robertson, L.B.; Armstrong, G.N.; Olver, B.D.; Lloyd, A.L.; Shete, S.; Lau, C.; Claus, E.B.; Barnholtz-Sloan, J.; Lai, R.; Il’yasova, D.; et al. Survey of familial glioma and role of germline p16INK4A/p14ARF and p53 mutation. Fam. Cancer 2010, 9, 413–421. [Google Scholar] [CrossRef]
  18. Bykov, V.J.N.; Eriksson, S.E.; Bianchi, J.; Wiman, K.G. Targeting mutant p53 for efficient cancer therapy. Nat. Rev. Cancer 2018, 18, 89–102. [Google Scholar] [CrossRef]
  19. Xu, Y.; Goldkorn, A. Telomere and Telomerase Therapeutics in Cancer. Genes (Basel) 2016, 7, 22. [Google Scholar] [CrossRef] [Green Version]
  20. Melin, B.S.; Nordfjall, K.; Andersson, U.; Roos, G. hTERT cancer risk genotypes are associated with telomere length. Genet. Epidemiol. 2012, 36, 368–372. [Google Scholar] [CrossRef]
  21. Codd, V.; Nelson, C.P.; Albrecht, E.; Mangino, M.; Deelen, J.; Buxton, J.L.; Hottenga, J.J.; Fischer, K.; Esko, T.; Surakka, I.; et al. Identification of seven loci affecting mean telomere length and their association with disease. Nat. Genet. 2013, 45, 422–427. [Google Scholar] [CrossRef] [PubMed] [Green Version]
  22. Andersson, U.; Degerman, S.; Dahlin, A.M.; Wibom, C.; Johansson, G.; Bondy, M.L.; Melin, B.S. The association between longer relative leukocyte telomere length and risk of glioma is independent of the potentially confounding factors allergy, BMI, and smoking. Cancer Causes Control CCC 2019, 30, 177–185. [Google Scholar] [CrossRef] [PubMed] [Green Version]
  23. Walsh, K.M.; Codd, V.; Rice, T.; Nelson, C.P.; Smirnov, I.V.; McCoy, L.S.; Hansen, H.M.; Elhauge, E.; Ojha, J.; Francis, S.S.; et al. Longer genotypically-estimated leukocyte telomere length is associated with increased adult glioma risk. Oncotarget 2015, 6, 42468–42477. [Google Scholar] [CrossRef] [PubMed] [Green Version]
  24. Atkins, I.; Kinnersley, B.; Ostrom, Q.T.; Labreche, K.; Il’yasova, D.; Armstrong, G.N.; Eckel-Passow, J.E.; Schoemaker, M.J.; Nothen, M.M.; Barnholtz-Sloan, J.S.; et al. Transcriptome-Wide Association Study Identifies New Candidate Susceptibility Genes for Glioma. Cancer Res. 2019, 79, 2065–2071. [Google Scholar] [CrossRef] [PubMed] [Green Version]
  25. Dahlin, A.M.; Wibom, C.; Ghasimi, S.; Brannstrom, T.; Andersson, U.; Melin, B. Relation between Established Glioma Risk Variants and DNA Methylation in the Tumor. PLoS ONE 2016, 11, e0163067. [Google Scholar] [CrossRef] [Green Version]
  26. Bojesen, S.E.; Pooley, K.A.; Johnatty, S.E.; Beesley, J.; Michailidou, K.; Tyrer, J.P.; Edwards, S.L.; Pickett, H.A.; Shen, H.C.; Smart, C.E.; et al. Multiple independent variants at the TERT locus are associated with telomere length and risks of breast and ovarian cancer. Nat. Genet. 2013, 45, 371–384. [Google Scholar] [CrossRef]
  27. Killedar, A.; Stutz, M.D.; Sobinoff, A.P.; Tomlinson, C.G.; Bryan, T.M.; Beesley, J.; Chenevix-Trench, G.; Reddel, R.R.; Pickett, H.A. A Common Cancer Risk-Associated Allele in the hTERT Locus Encodes a Dominant Negative Inhibitor of Telomerase. PLoS Genet. 2015, 11, e1005286. [Google Scholar] [CrossRef]
  28. Wang, Z.; Zhu, B.; Zhang, M.; Parikh, H.; Jia, J.; Chung, C.C.; Sampson, J.N.; Hoskins, J.W.; Hutchinson, A.; Burdette, L.; et al. Imputation and subset-based association analysis across different cancer types identifies multiple independent risk loci in the TERT-CLPTM1L region on chromosome 5p15.33. Hum. Mol. Genet. 2014, 23, 6616–6633. [Google Scholar] [CrossRef] [Green Version]
  29. Cancer Genome Atlas Research Network; Brat, D.J.; Verhaak, R.G.; Aldape, K.D.; Yung, W.K.; Salama, S.R.; Cooper, L.A.; Rheinbay, E.; Miller, C.R.; Vitucci, M.; et al. Comprehensive, Integrative Genomic Analysis of Diffuse Lower-Grade Gliomas. N. Engl. J. Med. 2015, 372, 2481–2498. [Google Scholar] [CrossRef] [Green Version]
  30. Verhaak, R.G.W.; Bafna, V.; Mischel, P.S. Extrachromosomal oncogene amplification in tumour pathogenesis and evolution. Nat. Rev. Cancer 2019, 19, 283–288. [Google Scholar] [CrossRef]
  31. Acquaviva, J.; Jun, H.J.; Lessard, J.; Ruiz, R.; Zhu, H.; Donovan, M.; Woolfenden, S.; Boskovitz, A.; Raval, A.; Bronson, R.T.; et al. Chronic activation of wild-type epidermal growth factor receptor and loss of Cdkn2a cause mouse glioblastoma formation. Cancer Res. 2011, 71, 7198–7206. [Google Scholar] [CrossRef] [PubMed] [Green Version]
  32. Spath, F.; Andersson, U.; Dahlin, A.M.; Langseth, H.; Hovig, E.; Johannesen, T.B.; Grankvist, K.; Bjorkblom, B.; Wibom, C.; Melin, B. Pre-diagnostic serum levels of EGFR and ErbB2 and genetic glioma risk variants: A nested case-control study. Tumour Biol. 2016, 37, 11065–11072. [Google Scholar] [CrossRef] [PubMed] [Green Version]
  33. Verhaak, R.G.; Hoadley, K.A.; Purdom, E.; Wang, V.; Qi, Y.; Wilkerson, M.D.; Miller, C.R.; Ding, L.; Golub, T.; Mesirov, J.P.; et al. Integrated genomic analysis identifies clinically relevant subtypes of glioblastoma characterized by abnormalities in PDGFRA, IDH1, EGFR, and NF1. Cancer Cell 2010, 17, 98–110. [Google Scholar] [CrossRef] [PubMed] [Green Version]
  34. Wibom, C.; Ghasimi, S.; Van Loo, P.; Brannstrom, T.; Trygg, J.; Lau, C.; Henriksson, R.; Bergenheim, T.; Andersson, U.; Ryden, P.; et al. EGFR gene variants are associated with specific somatic aberrations in glioma. PLoS ONE 2012, 7, e47929. [Google Scholar] [CrossRef] [PubMed] [Green Version]
  35. Ghasimi, S.; Wibom, C.; Dahlin, A.M.; Brannstrom, T.; Golovleva, I.; Andersson, U.; Melin, B. Genetic risk variants in the CDKN2A/B, RTEL1 and EGFR genes are associated with somatic biomarkers in glioma. J. Neurooncol. 2016, 127, 483–492. [Google Scholar] [CrossRef] [Green Version]
  36. Chan, A.K.; Han, S.J.; Choy, W.; Beleford, D.; Aghi, M.K.; Berger, M.S.; Shieh, J.T.; Bollen, A.W.; Perry, A.; Phillips, J.J.; et al. Familial melanoma-astrocytoma syndrome: Synchronous diffuse astrocytoma and pleomorphic xanthoastrocytoma in a patient with germline CDKN2A/B deletion and a significant family history. Clin. Neuropathol. 2017, 36, 213–221. [Google Scholar] [CrossRef] [Green Version]
  37. Andersson, U.; Wibom, C.; Cederquist, K.; Aradottir, S.; Borg, A.; Armstrong, G.N.; Shete, S.; Lau, C.C.; Bainbridge, M.N.; Claus, E.B.; et al. Germline rearrangements in families with strong family history of glioma and malignant melanoma, colon, and breast cancer. Neuro Oncol. 2014, 16, 1333–1340. [Google Scholar] [CrossRef] [Green Version]
  38. Cunnington, M.S.; Santibanez Koref, M.; Mayosi, B.M.; Burn, J.; Keavney, B. Chromosome 9p21 SNPs Associated with Multiple Disease Phenotypes Correlate with ANRIL Expression. PLoS Genet. 2010, 6, e1000899. [Google Scholar] [CrossRef] [Green Version]
  39. Feng, J.; Kim, S.T.; Liu, W.; Kim, J.W.; Zhang, Z.; Zhu, Y.; Berens, M.; Sun, J.; Xu, J. An integrated analysis of germline and somatic, genetic and epigenetic alterations at 9p21.3 in glioblastoma. Cancer 2012, 118, 232–240. [Google Scholar] [CrossRef]
  40. Sottoriva, A.; Spiteri, I.; Piccirillo, S.G.; Touloumis, A.; Collins, V.P.; Marioni, J.C.; Curtis, C.; Watts, C.; Tavare, S. Intratumor heterogeneity in human glioblastoma reflects cancer evolutionary dynamics. Proc. Natl. Acad. Sci. USA 2013, 110, 4009–4014. [Google Scholar] [CrossRef] [Green Version]
  41. Fann, L.Y.; Chen, Y.; Chu, D.C.; Weng, S.J.; Chu, H.C.; Wu, A.T.H.; Lee, J.F.; Ali, A.A.A.; Chen, T.C.; Huang, H.S.; et al. Identification and preclinical evaluation of the small molecule, NSC745887, for treating glioblastomas via suppressing DcR3-associated signaling pathways. Oncotarget 2018, 9, 11922–11937. [Google Scholar] [CrossRef] [PubMed] [Green Version]
  42. Roth, W.; Isenmann, S.; Nakamura, M.; Platten, M.; Wick, W.; Kleihues, P.; Bahr, M.; Ohgaki, H.; Ashkenazi, A.; Weller, M. Soluble decoy receptor 3 is expressed by malignant gliomas and suppresses CD95 ligand-induced apoptosis and chemotaxis. Cancer Res. 2001, 61, 2759–2765. [Google Scholar] [PubMed]
  43. Jenkins, R.B.; Xiao, Y.; Sicotte, H.; Decker, P.A.; Kollmeyer, T.M.; Hansen, H.M.; Kosel, M.L.; Zheng, S.; Walsh, K.M.; Rice, T.; et al. A low-frequency variant at 8q24.21 is strongly associated with risk of oligodendroglial tumors and astrocytomas with IDH1 or IDH2 mutation. Nat. Genet. 2012, 44, 1122–1125. [Google Scholar] [CrossRef] [PubMed]
  44. Walsh, K.M.; Codd, V.; Smirnov, I.V.; Rice, T.; Decker, P.A.; Hansen, H.M.; Kollmeyer, T.; Kosel, M.L.; Molinaro, A.M.; McCoy, L.S.; et al. Variants near TERT and TERC influencing telomere length are associated with high-grade glioma risk. Nat. Genet. 2014, 46, 731–735. [Google Scholar] [CrossRef] [PubMed] [Green Version]
  45. Bahr, C.; von Paleske, L.; Uslu, V.V.; Remeseiro, S.; Takayama, N.; Ng, S.W.; Murison, A.; Langenfeld, K.; Petretich, M.; Scognamiglio, R.; et al. A Myc enhancer cluster regulates normal and leukaemic haematopoietic stem cell hierarchies. Nature 2018, 553, 515–520. [Google Scholar] [CrossRef] [PubMed]
  46. Oktay, Y.; Ulgen, E.; Can, O.; Akyerli, C.B.; Yuksel, S.; Erdemgil, Y.; Durasi, I.M.; Henegariu, O.I.; Nanni, E.P.; Selevsek, N.; et al. IDH-mutant glioma specific association of rs55705857 located at 8q24.21 involves MYC deregulation. Sci. Rep. 2016, 6, 27569. [Google Scholar] [CrossRef] [Green Version]
  47. Golub, D.; Iyengar, N.; Dogra, S.; Wong, T.; Bready, D.; Tang, K.; Modrek, A.S.; Placantonakis, D.G. Mutant Isocitrate Dehydrogenase Inhibitors as Targeted Cancer Therapeutics. Front. Oncol. 2019, 9, 417. [Google Scholar] [CrossRef] [Green Version]
  48. Joy, A.; Kapoor, M.; Georges, J.; Butler, L.; Chang, Y.; Li, C.; Crouch, A.; Smirnov, I.; Nakada, M.; Hepler, J.; et al. The role of AKT isoforms in glioblastoma: AKT3 delays tumor progression. J. Neurooncol. 2016, 130, 43–52. [Google Scholar] [CrossRef] [Green Version]
  49. Mao, F.; Holmlund, C.; Faraz, M.; Wang, W.; Bergenheim, T.; Kvarnbrink, S.; Johansson, M.; Henriksson, R.; Hedman, H. Lrig1 is a haploinsufficient tumor suppressor gene in malignant glioma. Oncogenesis 2018, 7, 13. [Google Scholar] [CrossRef] [Green Version]
  50. Baskin, R.; Woods, N.T.; Mendoza-Fandino, G.; Forsyth, P.; Egan, K.M.; Monteiro, A.N. Functional analysis of the 11q23.3 glioma susceptibility locus implicates PHLDB1 and DDX6 in glioma susceptibility. Sci. Rep. 2015, 5, 17367. [Google Scholar] [CrossRef] [Green Version]
  51. Cheng, W.; Ren, X.; Zhang, C.; Cai, J.; Liu, Y.; Han, S.; Wu, A. Bioinformatic profiling identifies an immune-related risk signature for glioblastoma. Neurology 2016, 86, 2226–2234. [Google Scholar] [CrossRef] [PubMed]
  52. Amirian, E.S.; Armstrong, G.N.; Zhou, R.; Lau, C.C.; Claus, E.B.; Barnholtz-Sloan, J.S.; Il’yasova, D.; Schildkraut, J.; Ali-Osman, F.; Sadetzki, S.; et al. The Glioma International Case-Control Study: A Report From the Genetic Epidemiology of Glioma International Consortium. Am. J. Epidemiol. 2016, 183, 85–91. [Google Scholar] [CrossRef] [PubMed] [Green Version]
  53. Patterson, N.; Price, A.L.; Reich, D. Population structure and eigenanalysis. PLoS Genet. 2006, 2, e190. [Google Scholar] [CrossRef] [PubMed]
  54. Price, A.L.; Patterson, N.J.; Plenge, R.M.; Weinblatt, M.E.; Shadick, N.A.; Reich, D. Principal components analysis corrects for stratification in genome-wide association studies. Nat. Genet. 2006, 38, 904–909. [Google Scholar] [CrossRef]
  55. Viechtbauer, W. Conducting Meta-Analyses in R with the metafor Package. J. Stat. Softw. 2010, 36, 48. [Google Scholar] [CrossRef] [Green Version]
Figure 1. The associations between 25 germline variants and molecular subgroups in the meta-analysis. The genetic variants were categorized into three groups: (red) associated with all glioma (All), (green) associated with IDH-wildtype (IDH-wt), and (blue) associated with IDH-mutant (IDH-mut). * p-value < 0.05, ** Bonferroni p-value < 0.05/75. Abbreviations: SNV: single nucleotide variant; NA: Not significant for molecular subtypes in the present study; OR: odds ratio; CI: confidence interval.
Cancers 11 02001 g001
Figure 2. Three hypothesized pathways in gliomagenesis based on germline variants. (A) the overall glioma pathway, (B) the IDH wildtype pathway and (C) the IDH mutant pathway. The bold text represents statistically significant findings after adjusting for multiple comparisons. The asterisk (*) represents that the genes also have common somatic mutations in glioma.
Cancers 11 02001 g002
Table 1. Descriptive characteristics of datasets in three studies.
StudyCurrent StudyLabreche et al., 2018 [9]Eckel-Passow et al., 2019 [10]
TCGAFrench GWASFrench SequencingSubtotal
Subjects
Mayo ClinicUCSFSubtotal
Subjects
Controls, N8762648119055279365443231674
Male, N (%)516
(58.9)
NANANANA250
(56.4)
121
(54.4)
371
(55.0)
Age, median (range)59
(21–82)
NANANANA56
(22–84)
54
(18–89)
NA
(18–89)
Cases, N3305211423704264812738522125
Male, N (%)135
(40.9)
NANANANA748
(58.8)
495
(48.1)
1243
(58.5)
Age, median (range)59
(22–81)
NANANANA48
(18–84)
51
(19–87)
NA
(18–87)
GBM, N (%)207
(62.7)
183
(35.12)
430
(30.2)
181
(25.7)
795
(30.0)
481
(37.8)
410
(48.1)
891
(41.9)
Molecular subtypes
IDH-wildtype, N25855450277782165335500
IDH-mutant and 1p/19q intact, N 29104215209528141133274
IDH-mutant and 1p/19q co-deleted, N 1965851993499692188
Abbreviations: NA: Not available, GBM: glioblastoma, GWAS: genome-wide association study.

