Tumor Mutational Burden and Efficacy of Immune Checkpoint Inhibitors: A Systematic Review and Meta-Analysis

 ,
,  , , ,
, , ,  and
and
Abstract
1. Introduction
2. Results
2.1. Identification of Studies and Study Characteristics
2.2. High TMB Group Versus Low TMB Group
2.3. ICI Arm Versus Chemotherapy Arm, within High TMB Group or Low TMB Group
3. Discussion
4. Materials and Methods
4.1. Literature Search Strategy and Eligibility Criteria
4.2. Data Extraction
4.3. Statistical Analysis
5. Conclusions
Supplementary Materials
Author Contributions
Funding
Conflicts of Interest
Appendix A

| Title | 1 | Identify the Report as a Systematic Review, Meta-Analysis, or Both | 0 |
| ABSTRACT | |||
| Structured summary | 2 | Provide a structured summary including, as applicable: Background; objectives; data sources; study eligibility criteria, participants, and interventions; study appraisal and synthesis methods; results; limitations; conclusions and implications of key findings; systematic review registration number. | 0 |
| INTRODUCTION | |||
| Rationale | 3 | Describe the rationale for the review in the context of what is already known. | 1 |
| Objectives | 4 | Provide an explicit statement of questions being addressed with reference to participants, interventions, comparisons, outcomes, and study design (PICOS). | 1 |
| METHODS | |||
| Protocol and registration | 5 | Indicate if a review protocol exists, if and where it can be accessed (e.g., Web address), and, if available, provide registration information including registration number. | N/A |
| Eligibility criteria | 6 | Specify study characteristics (e.g., PICOS, length of follow-up) and report characteristics (e.g., years considered, language, publication status) used as criteria for eligibility, giving rationale. | 11–12 |
| Information sources | 7 | Describe all information sources (e.g., databases with dates of coverage, contact with study authors to identify additional studies) in the search and date last searched. | 11 |
| Search | 8 | Present full electronic search strategy for at least one database, including any limits used, such that it could be repeated. | Appendix B |
| Study selection | 9 | State the process for selecting studies (i.e., screening, eligibility, included in systematic review, and, if applicable, included in the meta-analysis). | 11–12 |
| Data collection process | 10 | Describe method of data extraction from reports (e.g., piloted forms, independently, in duplicate) and any processes for obtaining and confirming data from investigators. | 12 |
| Data items | 11 | List and define all variables for which data were sought (e.g., PICOS, funding sources) and any assumptions and simplifications made. | 12 |
| Risk of bias in individual studies | 12 | Describe methods used for assessing risk of bias of individual studies (including specification of whether this was done at the study or outcome level), and how this information is to be used in any data synthesis. | N/A |
| Summary measures | 13 | State the principal summary measures (e.g., risk ratio, difference in means). | 12 |
| Synthesis of results | 14 | Describe the methods of handling data and combining results of studies, if done, including measures of consistency (e.g., I2) for each meta-analysis. | 12 |
| Risk of bias across studies | 15 | Specify any assessment of risk of bias that may affect the cumulative evidence (e.g., publication bias, selective reporting within studies). | 12 |
| Additional analyses | 16 | Describe methods of additional analyses (e.g., sensitivity or subgroup analyses, meta-regression), if done, indicating which were pre-specified. | 12 |
| RESULTS | |||
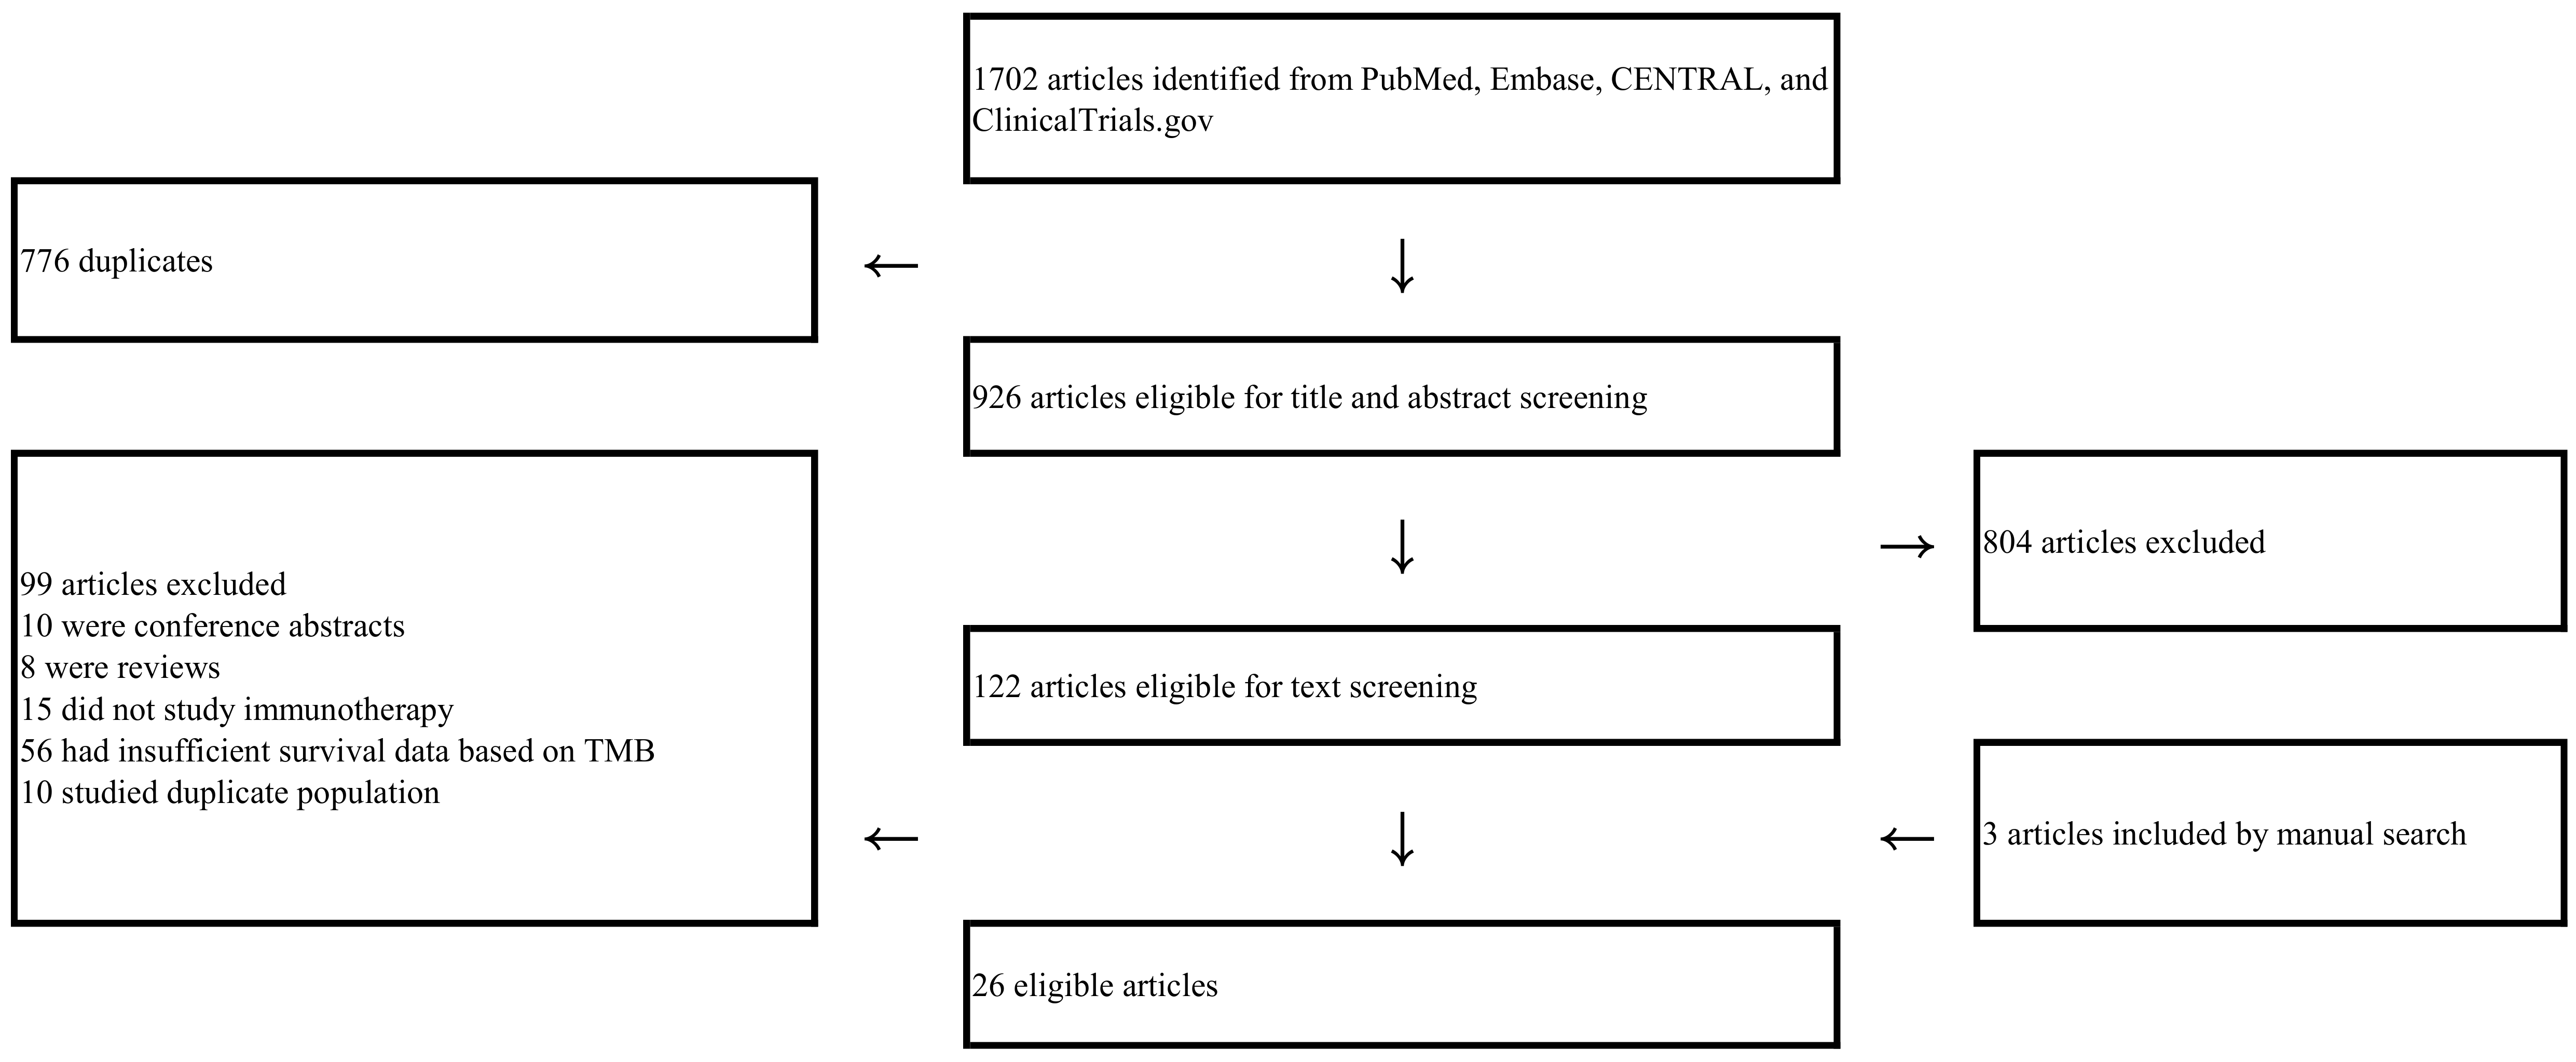
| Study selection | 17 | Give numbers of studies screened, assessed for eligibility, and included in the review, with reasons for exclusions at each stage, ideally with a flow diagram. | 2, Figure 1 |
| Study characteristics | 18 | For each study, present characteristics for which data were extracted (e.g., study size, PICOS, follow-up period) and provide the citations. | 2, Table 1 and Table 2 |
| Risk of bias within studies | 19 | Present data on risk of bias of each study and, if available, any outcome level assessment (see item 12). | N/A |
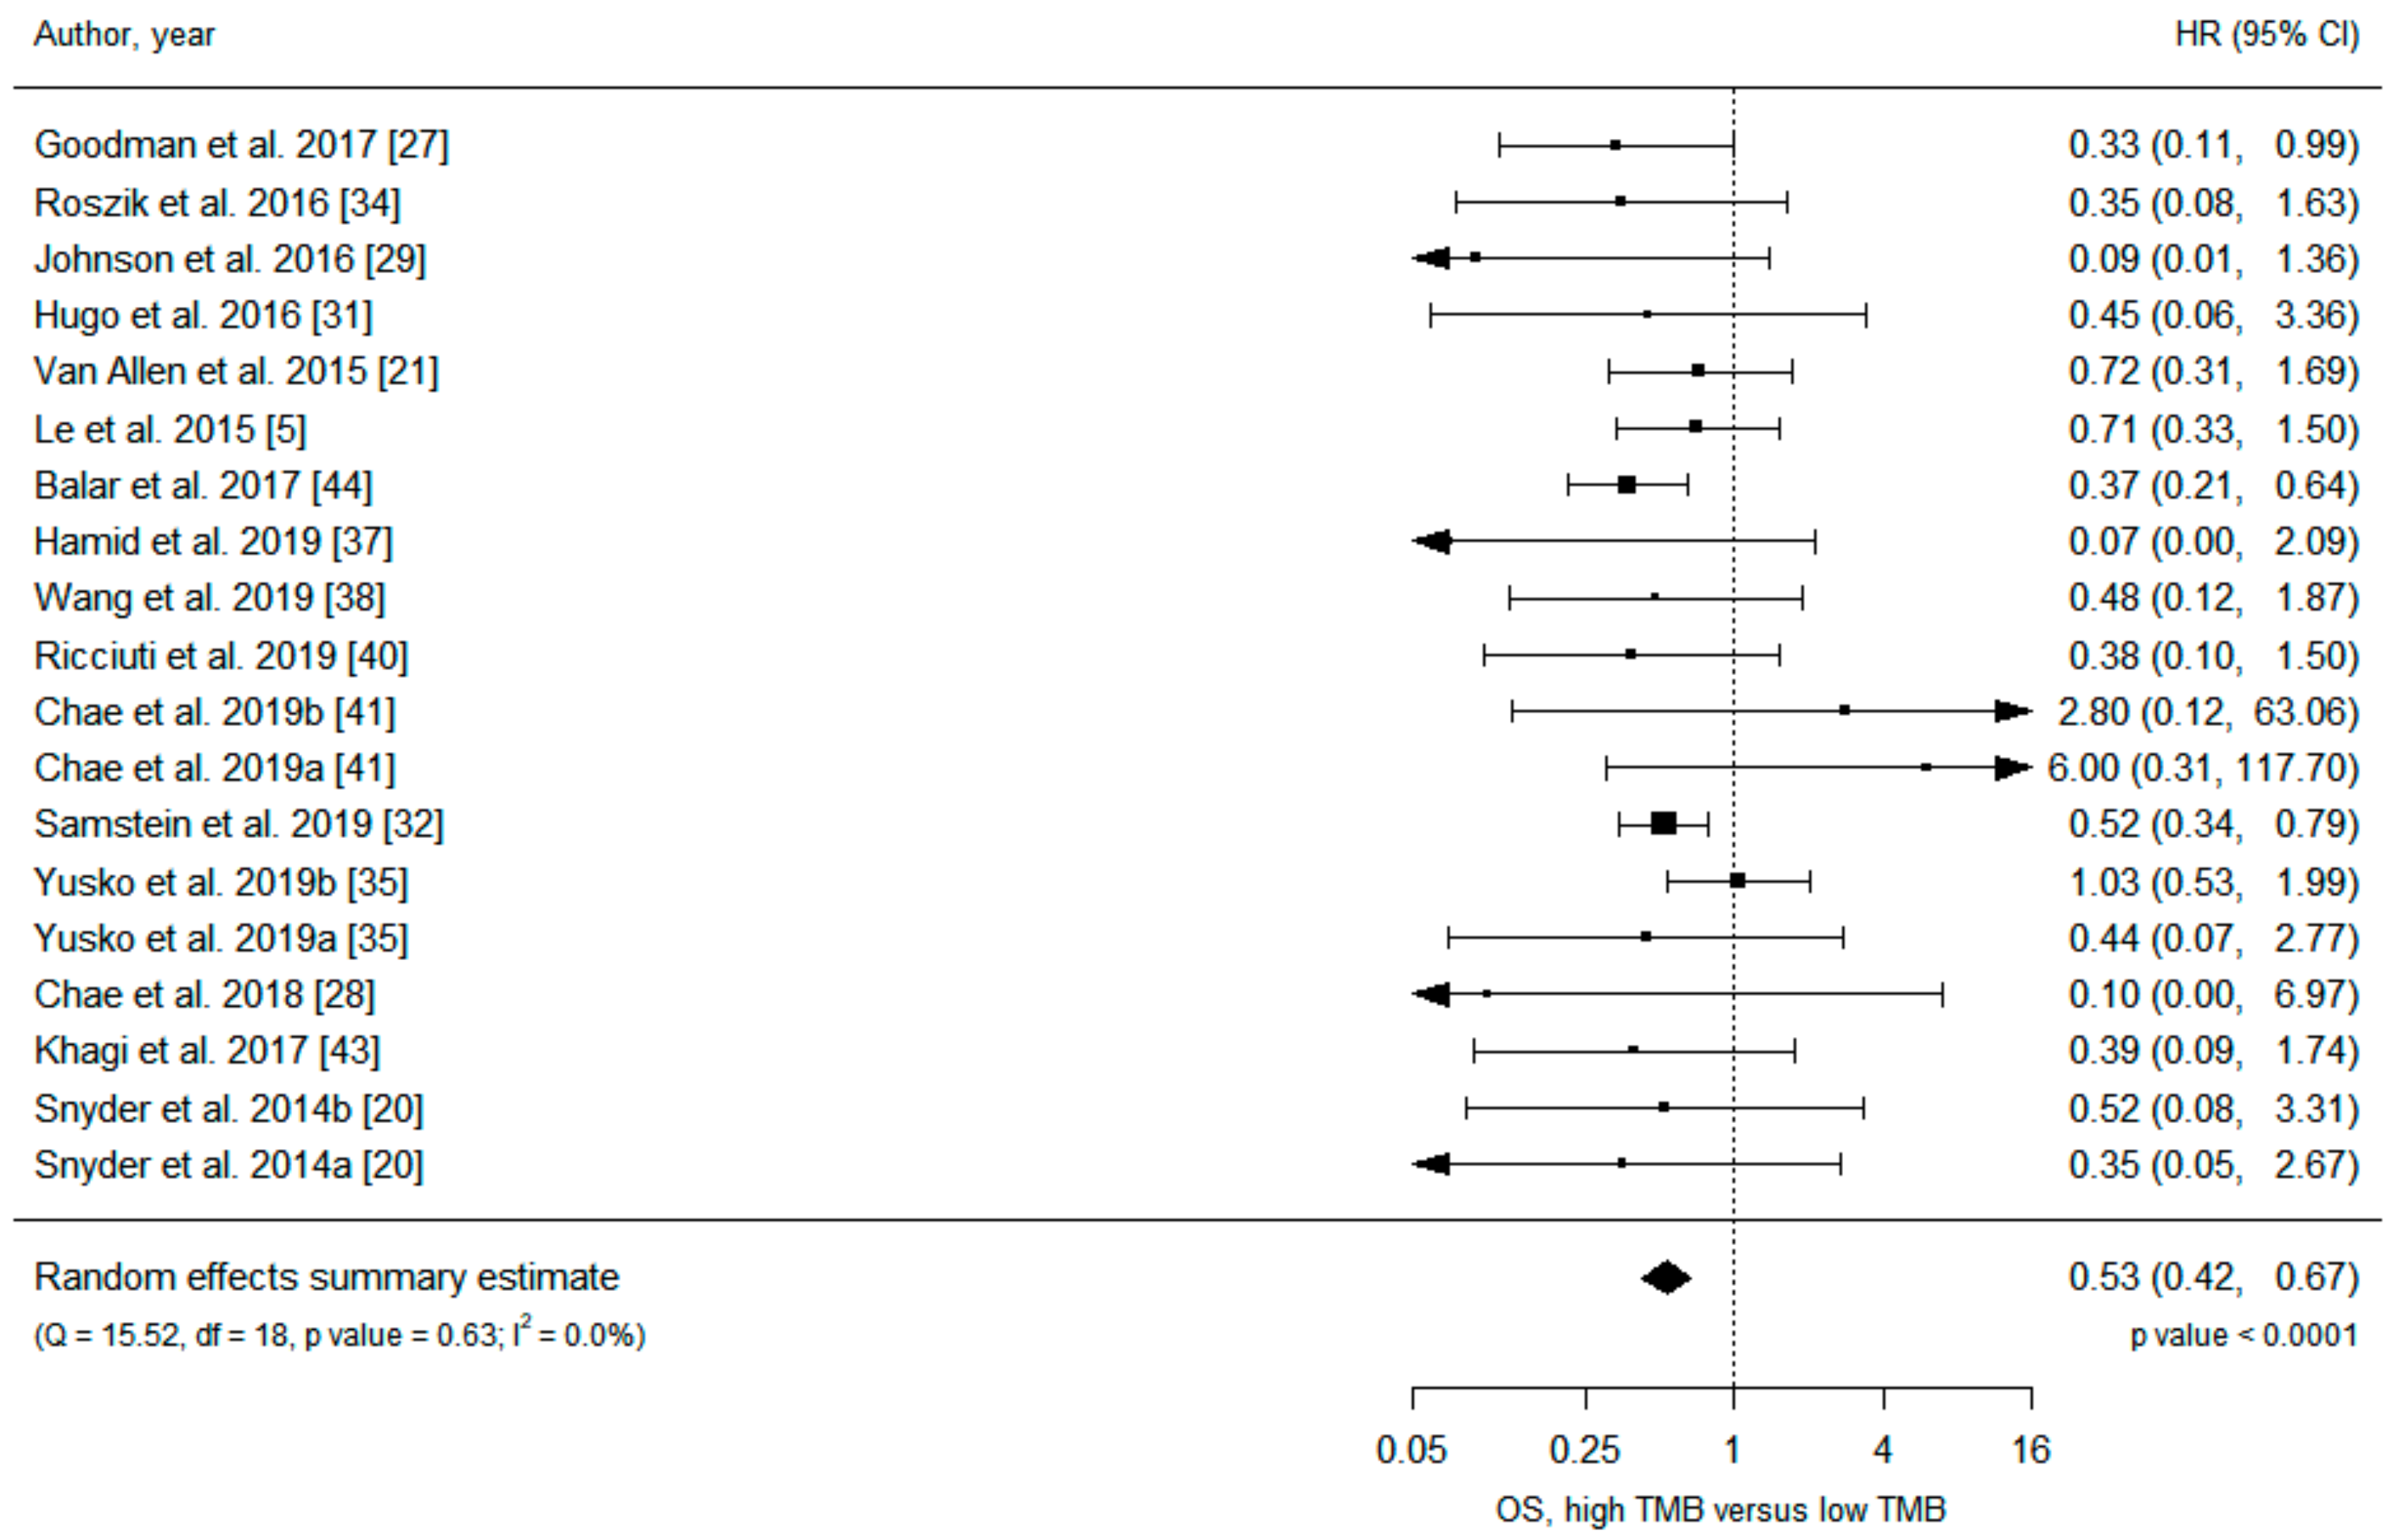
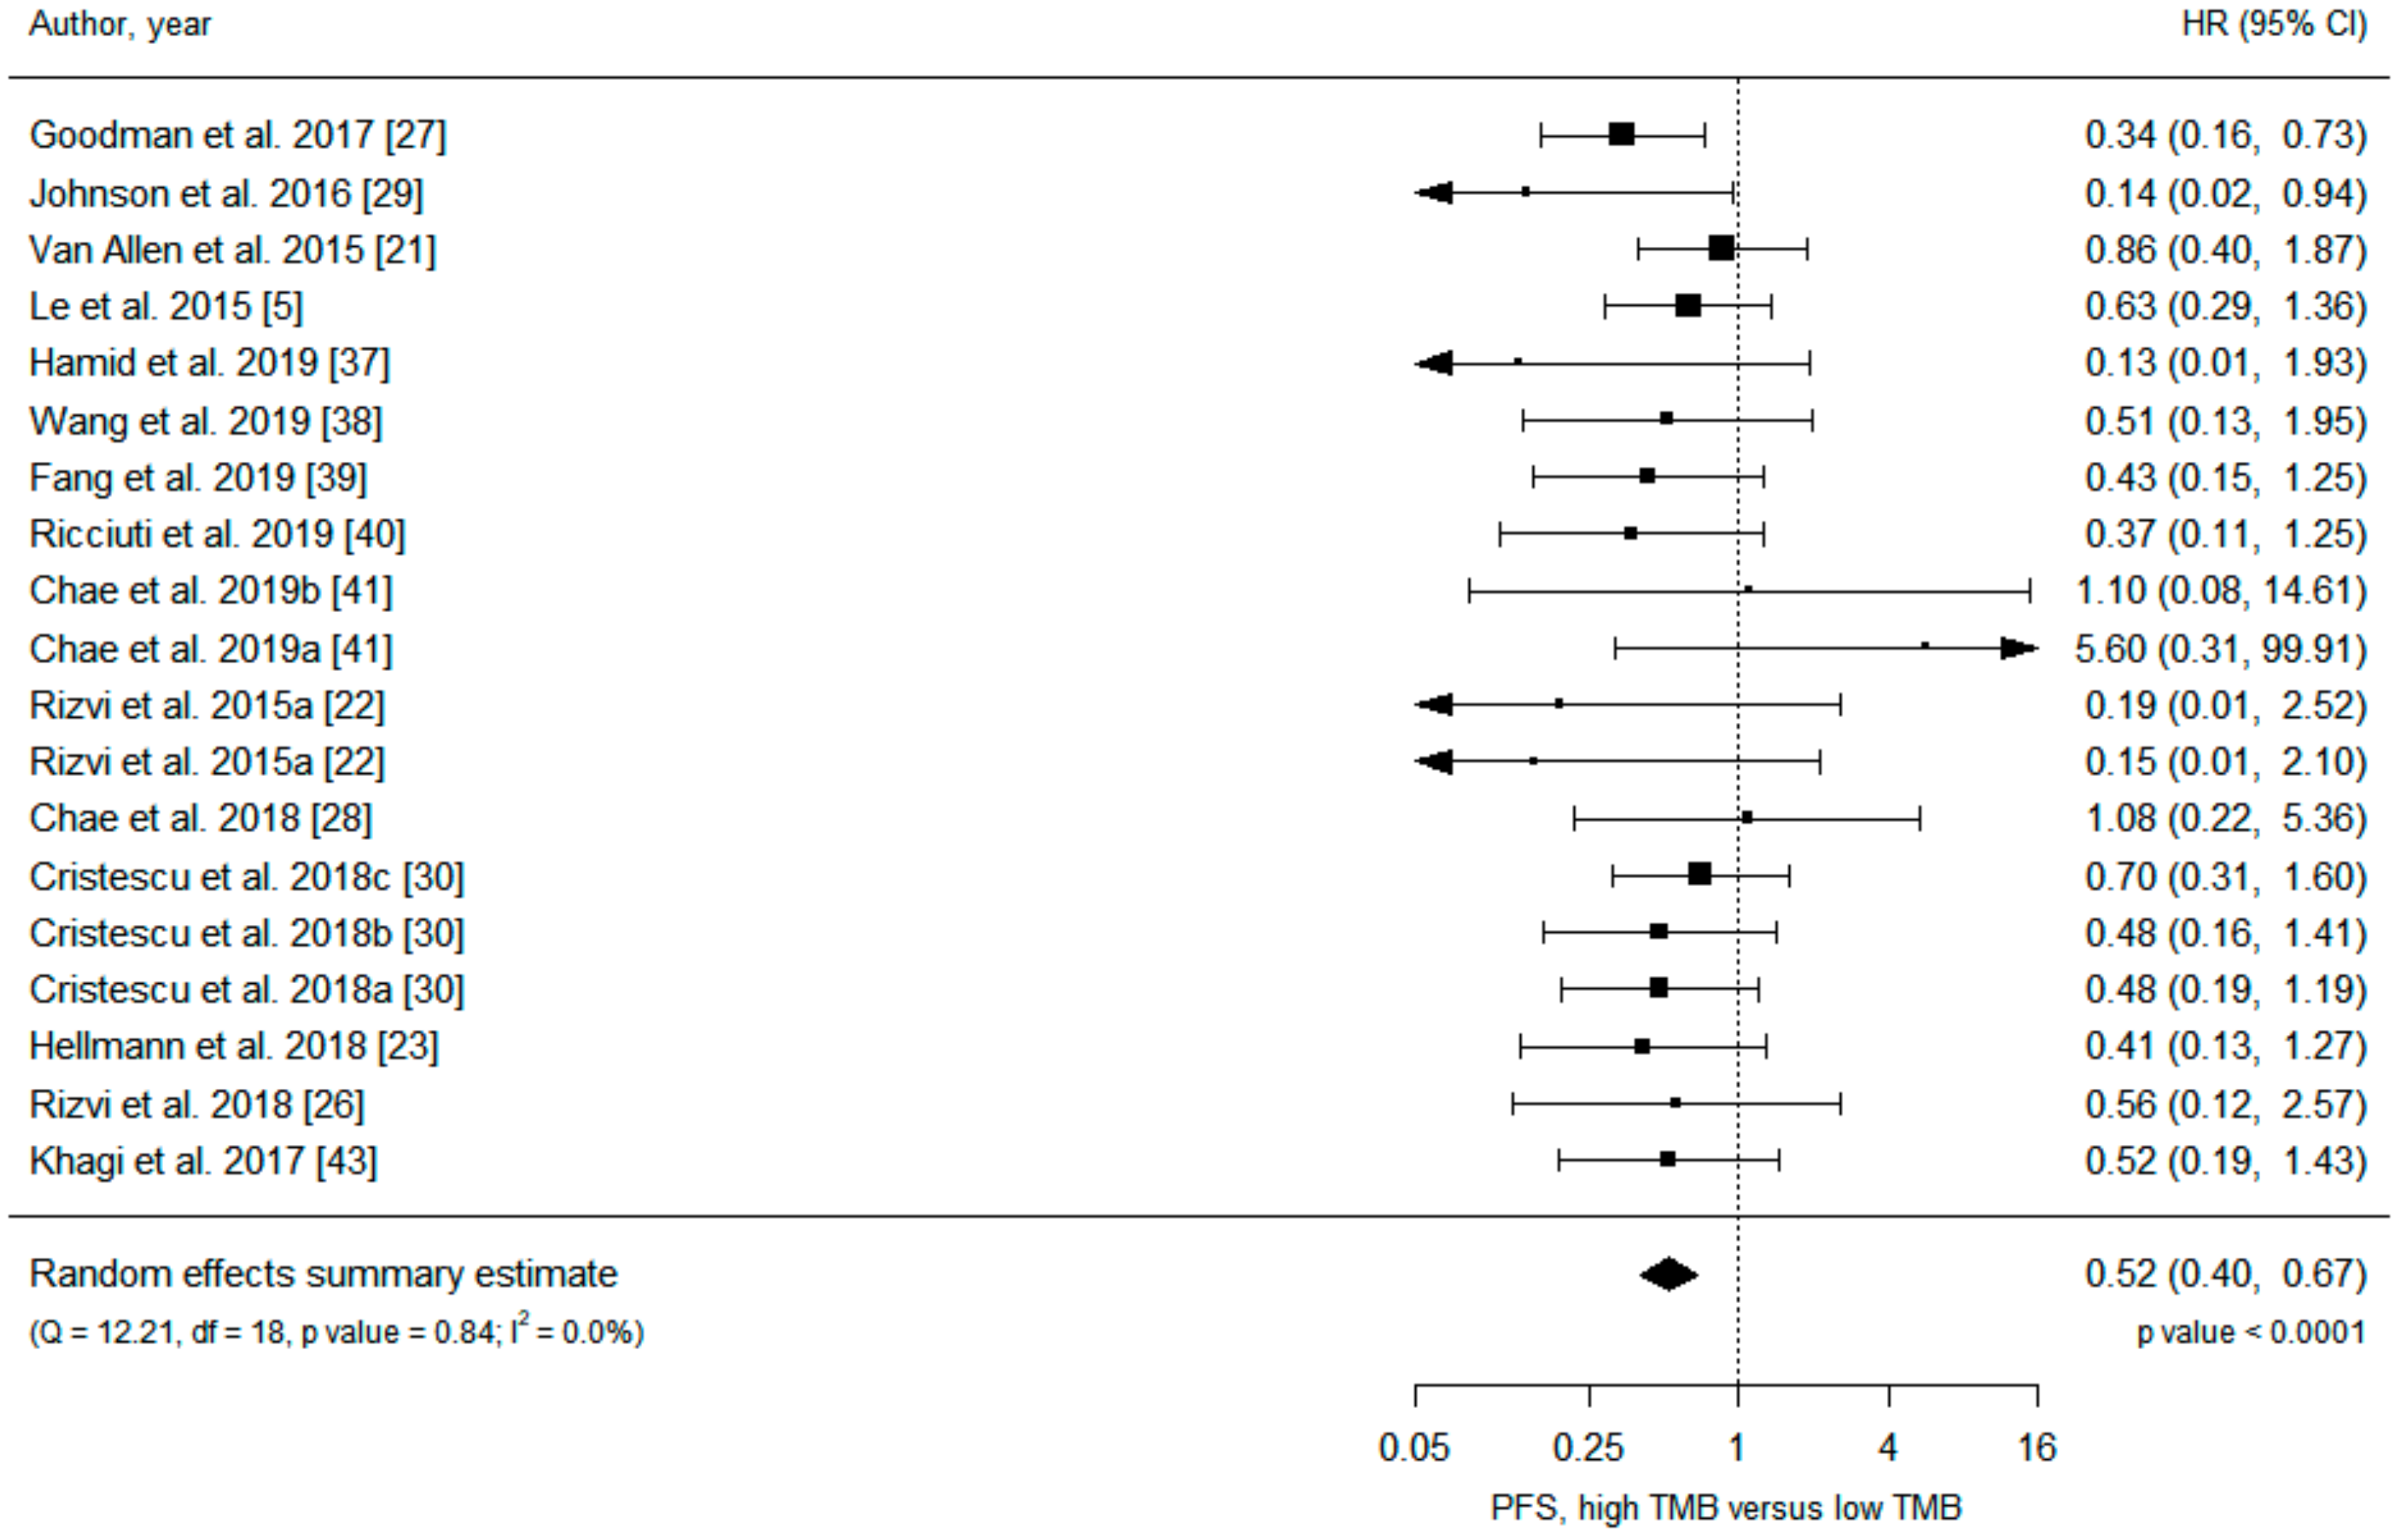
| Results of individual studies | 20 | For all outcomes considered (benefits or harms), present, for each study: (a) simple summary data for each intervention group (b) effect estimates and confidence intervals, ideally with a forest plot. | Figure 2 and Figure 3, Figures S3–S6 |
| Synthesis of results | 21 | Present results of each meta-analysis done, including confidence intervals and measures of consistency. | 2, Table 1 and Table 2, Table S1 |
| Risk of bias across studies | 22 | Present results of any assessment of risk of bias across studies (see Item 15). | 2, Table S1, Figures S1, S2, S7–S10 |
| Additional analysis | 23 | Give results of additional analyses, if done (e.g., sensitivity or subgroup analyses, meta-regression [see Item 16]). | Table 3 |
| DISCUSSION | |||
| Summary of evidence | 24 | Summarize the main findings including the strength of evidence for each main outcome; consider their relevance to key groups (e.g., healthcare providers, users, and policy makers). | 9–11 |
| Limitations | 25 | Discuss limitations at study and outcome level (e.g., risk of bias), and at review-level (e.g., incomplete retrieval of identified research, reporting bias). | 11 |
| Conclusions | 26 | Provide a general interpretation of the results in the context of other evidence, and implications for future research. | 12 |
| FUNDING | |||
| Funding | 27 | Describe sources of funding for the systematic review and other support (e.g., supply of data); role of funders for the systematic review. | 13(none) |
Appendix B
Full Search Strategy in PubMed
References
- Gibney, G.T.; Weiner, L.M.; Atkins, M.B. Predictive biomarkers for checkpoint inhibitor-based immunotherapy. Lancet Oncol. 2016, 17, e542–e551. [Google Scholar] [CrossRef]
- Wei, S.C.; Duffy, C.R.; Allison, J.P. Fundamental Mechanisms of Immune Checkpoint Blockade Therapy. Cancer Discov. 2018, 8, 1069–1086. [Google Scholar] [CrossRef] [PubMed]
- Robert, C.; Long, G.V.; Brady, B.; Dutriaux, C.; Maio, M.; Mortier, L.; Hassel, J.C.; Rutkowski, P.; McNeil, C.; Kalinka-Warzocha, E.; et al. Nivolumab in previously untreated melanoma without BRAF mutation. N. Engl. J. Med. 2015, 372, 320–330. [Google Scholar] [CrossRef] [PubMed]
- Brahmer, J.; Reckamp, K.L.; Baas, P.; Crino, L.; Eberhardt, W.E.; Poddubskaya, E.; Antonia, S.; Pluzanski, A.; Vokes, E.E.; Holgado, E.; et al. Nivolumab versus Docetaxel in Advanced Squamous-Cell Non-Small-Cell Lung Cancer. N. Engl. J. Med. 2015, 373, 123–135. [Google Scholar] [CrossRef] [PubMed]
- Le, D.T.; Uram, J.N.; Wang, H.; Bartlett, B.R.; Kemberling, H.; Eyring, A.D.; Skora, A.D.; Luber, B.S.; Azad, N.S.; Laheru, D.; et al. PD-1 Blockade in Tumors with Mismatch-Repair Deficiency. N. Engl. J. Med. 2015, 372, 2509–2520. [Google Scholar] [CrossRef] [PubMed]
- Hansen, A.R.; Siu, L.L. PD-L1 Testing in Cancer: Challenges in Companion Diagnostic Development. JAMA Oncol. 2016, 2, 15–16. [Google Scholar] [CrossRef]
- Reck, M.; Rodriguez-Abreu, D.; Robinson, A.G.; Hui, R.; Csoszi, T.; Fulop, A.; Gottfried, M.; Peled, N.; Tafreshi, A.; Cuffe, S.; et al. Pembrolizumab versus Chemotherapy for PD-L1-Positive Non-Small-Cell Lung Cancer. N. Engl. J. Med. 2016, 375, 1823–1833. [Google Scholar] [CrossRef]
- Shen, X.; Zhao, B. Efficacy of PD-1 or PD-L1 inhibitors and PD-L1 expression status in cancer: Meta-analysis. BMJ 2018, 362, k3529. [Google Scholar] [CrossRef]
- Brody, R.; Zhang, Y.; Ballas, M.; Siddiqui, M.K.; Gupta, P.; Barker, C.; Midha, A.; Walker, J. PD-L1 expression in advanced NSCLC: Insights into risk stratification and treatment selection from a systematic literature review. Lung Cancer 2017, 112, 200–215. [Google Scholar] [CrossRef]
- Buttner, R.; Gosney, J.R.; Skov, B.G.; Adam, J.; Motoi, N.; Bloom, K.J.; Dietel, M.; Longshore, J.W.; Lopez-Rios, F.; Penault-Llorca, F.; et al. Programmed Death-Ligand 1 Immunohistochemistry Testing: A Review of Analytical Assays and Clinical Implementation in Non-Small-Cell Lung Cancer. J. Clin. Oncol. 2017, 35, 3867–3876. [Google Scholar] [CrossRef]
- Rimm, D.L.; Han, G.; Taube, J.M.; Yi, E.S.; Bridge, J.A.; Flieder, D.B.; Homer, R.; West, W.W.; Wu, H.; Roden, A.C.; et al. A Prospective, Multi-institutional, Pathologist-Based Assessment of 4 Immunohistochemistry Assays for PD-L1 Expression in Non-Small Cell Lung Cancer. JAMA Oncol. 2017, 3, 1051–1058. [Google Scholar] [CrossRef] [PubMed]
- Tumeh, P.C.; Harview, C.L.; Yearley, J.H.; Shintaku, I.P.; Taylor, E.J.; Robert, L.; Chmielowski, B.; Spasic, M.; Henry, G.; Ciobanu, V.; et al. PD-1 blockade induces responses by inhibiting adaptive immune resistance. Nature 2014, 515, 568–571. [Google Scholar] [CrossRef] [PubMed]
- Horn, L.; Spigel, D.R.; Vokes, E.E.; Holgado, E.; Ready, N.; Steins, M.; Poddubskaya, E.; Borghaei, H.; Felip, E.; Paz-Ares, L.; et al. Nivolumab Versus Docetaxel in Previously Treated Patients With Advanced Non-Small-Cell Lung Cancer: Two-Year Outcomes From Two Randomized, Open-Label, Phase III Trials (CheckMate 017 and CheckMate 057). J. Clin. Oncol. 2017, 35, 3924–3933. [Google Scholar] [CrossRef] [PubMed]
- Motzer, R.J.; Escudier, B.; McDermott, D.F.; George, S.; Hammers, H.J.; Srinivas, S.; Tykodi, S.S.; Sosman, J.A.; Procopio, G.; Plimack, E.R.; et al. Nivolumab versus Everolimus in Advanced Renal-Cell Carcinoma. N. Engl. J. Med. 2015, 373, 1803–1813. [Google Scholar] [CrossRef]
- Rittmeyer, A.; Barlesi, F.; Waterkamp, D.; Park, K.; Ciardiello, F.; von Pawel, J.; Gadgeel, S.M.; Hida, T.; Kowalski, D.M.; Dols, M.C.; et al. Atezolizumab versus docetaxel in patients with previously treated non-small-cell lung cancer (OAK): A phase 3, open-label, multicentre randomised controlled trial. Lancet 2017, 389, 255–265. [Google Scholar] [CrossRef]
- Topalian, S.L.; Taube, J.M.; Anders, R.A.; Pardoll, D.M. Mechanism-driven biomarkers to guide immune checkpoint blockade in cancer therapy. Nat. Rev. Cancer 2016, 16, 275–287. [Google Scholar] [CrossRef]
- Wang, J.; Chmielowski, B.; Pellissier, J.; Xu, R.; Stevinson, K.; Liu, F.X. Cost-Effectiveness of Pembrolizumab Versus Ipilimumab in Ipilimumab-Naive Patients with Advanced Melanoma in the United States. J. Manag. Care Spec. Pharm. 2017, 23, 184–194. [Google Scholar] [CrossRef]
- Oh, A.; Tran, D.M.; McDowell, L.C.; Keyvani, D.; Barcelon, J.A.; Merino, O.; Wilson, L. Cost-Effectiveness of Nivolumab-Ipilimumab Combination Therapy Compared with Monotherapy for First-Line Treatment of Metastatic Melanoma in the United States. J. Manag. Care Spec. Pharm. 2017, 23, 653–664. [Google Scholar] [CrossRef]
- Khoja, L.; Day, D.; Wei-Wu Chen, T.; Siu, L.L.; Hansen, A.R. Tumour- and class-specific patterns of immune-related adverse events of immune checkpoint inhibitors: A systematic review. Ann. Oncol. 2017, 28, 2377–2385. [Google Scholar] [CrossRef]
- Snyder, A.; Makarov, V.; Merghoub, T.; Yuan, J.; Zaretsky, J.M.; Desrichard, A.; Walsh, L.A.; Postow, M.A.; Wong, P.; Ho, T.S.; et al. Genetic basis for clinical response to CTLA-4 blockade in melanoma. N. Engl. J. Med. 2014, 371, 2189–2199. [Google Scholar] [CrossRef]
- Van Allen, E.M.; Miao, D.; Schilling, B.; Shukla, S.A.; Blank, C.; Zimmer, L.; Sucker, A.; Hillen, U.; Foppen, M.H.G.; Goldinger, S.M.; et al. Genomic correlates of response to CTLA-4 blockade in metastatic melanoma. Science 2015, 350, 207–211. [Google Scholar] [CrossRef] [PubMed]
- Rizvi, N.A.; Hellmann, M.D.; Snyder, A.; Kvistborg, P.; Makarov, V.; Havel, J.J.; Lee, W.; Yuan, J.; Wong, P.; Ho, T.S.; et al. Cancer immunology. Mutational landscape determines sensitivity to PD-1 blockade in non-small cell lung cancer. Science 2015, 348, 124–128. [Google Scholar] [CrossRef] [PubMed]
- Hellmann, M.D.; Nathanson, T.; Rizvi, H.; Creelan, B.C.; Sanchez-Vega, F.; Ahuja, A.; Ni, A.; Novik, J.B.; Mangarin, L.M.B.; Abu-Akeel, M.; et al. Genomic Features of Response to Combination Immunotherapy in Patients with Advanced Non-Small-Cell Lung Cancer. Cancer Cell 2018, 33, 843–852.e844. [Google Scholar] [CrossRef] [PubMed]
- Yarchoan, M.; Hopkins, A.; Jaffee, E.M. Tumor Mutational Burden and Response Rate to PD-1 Inhibition. N. Engl. J. Med. 2017, 377, 2500–2501. [Google Scholar] [CrossRef]
- Hellmann, M.D.; Ciuleanu, T.E.; Pluzanski, A.; Lee, J.S.; Otterson, G.A.; Audigier-Valette, C.; Minenza, E.; Linardou, H.; Burgers, S.; Salman, P.; et al. Nivolumab plus Ipilimumab in Lung Cancer with a High Tumor Mutational Burden. N. Engl. J. Med. 2018, 378, 2093–2104. [Google Scholar] [CrossRef]
- Rizvi, H.; Sanchez-Vega, F.; La, K.; Chatila, W.; Jonsson, P.; Halpenny, D.; Plodkowski, A.; Long, N.; Sauter, J.L.; Rekhtman, N.; et al. Molecular Determinants of Response to Anti-Programmed Cell Death (PD)-1 and Anti-Programmed Death-Ligand 1 (PD-L1) Blockade in Patients With Non-Small-Cell Lung Cancer Profiled With Targeted Next-Generation Sequencing. J. Clin. Oncol. 2018, 36, 633–641. [Google Scholar] [CrossRef]
- Goodman, A.M.; Kato, S.; Bazhenova, L.; Patel, S.P.; Frampton, G.M.; Miller, V.; Stephens, P.J.; Daniels, G.A.; Kurzrock, R. Tumor Mutational Burden as an Independent Predictor of Response to Immunotherapy in Diverse Cancers. Mol. Cancer 2017, 16, 2598–2608. [Google Scholar] [CrossRef]
- Chae, Y.K.; Davis, A.A.; Raparia, K.; Agte, S.; Pan, A.; Mohindra, N.; Villaflor, V.; Giles, F. Association of Tumor Mutational Burden with DNA Repair Mutations and Response to Anti-PD-1/PD-L1 Therapy in Non-Small-Cell Lung Cancer. Clin. Lung Cancer 2018. [Google Scholar] [CrossRef]
- Johnson, D.B.; Frampton, G.M.; Rioth, M.J.; Yusko, E.; Xu, Y.; Guo, X.; Ennis, R.C.; Fabrizio, D.; Chalmers, Z.R.; Greenbowe, J.; et al. Targeted Next Generation Sequencing Identifies Markers of Response to PD-1 Blockade. Cancer Immunol. Res. 2016, 4, 959–967. [Google Scholar] [CrossRef]
- Cristescu, R.; Mogg, R.; Ayers, M.; Albright, A.; Murphy, E.; Yearley, J.; Sher, X.; Liu, X.Q.; Lu, H.; Nebozhyn, M.; et al. Pan-tumor genomic biomarkers for PD-1 checkpoint blockade-based immunotherapy. Science 2018, 362. [Google Scholar] [CrossRef]
- Hugo, W.; Zaretsky, J.M.; Sun, L.; Song, C.; Moreno, B.H.; Hu-Lieskovan, S.; Berent-Maoz, B.; Pang, J.; Chmielowski, B.; Cherry, G.; et al. Genomic and Transcriptomic Features of Response to Anti-PD-1 Therapy in Metastatic Melanoma. Cell 2016, 165, 35–44. [Google Scholar] [CrossRef] [PubMed]
- Samstein, R.M.; Lee, C.H.; Shoushtari, A.N.; Hellmann, M.D.; Shen, R.; Janjigian, Y.Y.; Barron, D.A.; Zehir, A.; Jordan, E.J.; Omuro, A.; et al. Tumor mutational load predicts survival after immunotherapy across multiple cancer types. Nat. Genet. 2019. [Google Scholar] [CrossRef] [PubMed]
- Carbone, D.P.; Reck, M.; Paz-Ares, L.; Creelan, B.; Horn, L.; Steins, M.; Felip, E.; van den Heuvel, M.M.; Ciuleanu, T.E.; Badin, F.; et al. First-Line Nivolumab in Stage IV or Recurrent Non-Small-Cell Lung Cancer. N. Engl. J. Med. 2017, 376, 2415–2426. [Google Scholar] [CrossRef] [PubMed]
- Roszik, J.; Haydu, L.E.; Hess, K.R.; Oba, J.; Joon, A.Y.; Siroy, A.E.; Karpinets, T.V.; Stingo, F.C.; Baladandayuthapani, V.; Tetzlaff, M.T.; et al. Novel algorithmic approach predicts tumor mutation load and correlates with immunotherapy clinical outcomes using a defined gene mutation set. BMC Med. 2016, 14, 168. [Google Scholar] [CrossRef]
- Yusko, E.; Vignali, M.; Wilson, R.K.; Mardis, E.R.; Hodi, F.S.; Horak, C.E.; Chang, H.; Woods, D.; Robins, H.; Weber, J.S. Association of Tumor Microenvironment T-Cell Repertoire and Mutational Load With Clinical Outcome After Sequential Checkpoint Blockade in Melanoma. Cancer Immunol. Res. 2019. [Google Scholar] [CrossRef]
- Powles, T.; Duran, I.; van der Heijden, M.S.; Loriot, Y.; Vogelzang, N.J.; De Giorgi, U.; Oudard, S.; Retz, M.M.; Castellano, D.; Bamias, A.; et al. Atezolizumab versus chemotherapy in patients with platinum-treated locally advanced or metastatic urothelial carcinoma (IMvigor211): A multicentre, open-label, phase 3 randomised controlled trial. Lancet 2018, 391, 748–757. [Google Scholar] [CrossRef]
- Hamid, O.; Molinero, L.; Bolen, C.R.; Sosman, J.A.; Munoz-Couselo, E.; Kluger, H.M.; McDermott, D.F.; Powderly, J.; Sarkar, I.; Ballinger, M.; et al. Safety, Clinical Activity, and Biological Correlates of Response in Patients With Metastatic Melanoma: Results From a Phase I trial of Atezolizumab. Clin. Cancer Res. 2019. [Google Scholar] [CrossRef]
- Wang, F.; Wei, X.L.; Wang, F.H.; Xu, N.; Shen, L.; Dai, G.H.; Yuan, X.L.; Chen, Y.; Yang, S.J.; Shi, J.H.; et al. Safety, efficacy and tumor mutational burden as a biomarker of overall survival benefit in chemo-refractory gastric cancer treated with toripalimab, a PD1 antibody in phase Ib/II clinical trial NCT02915432. Ann. Oncol. 2019. [Google Scholar] [CrossRef]
- Fang, W.; Ma, Y.; Yin, J.C.; Hong, S.; Zhou, H.; Wang, A.; Wang, F.; Bao, H.; Wu, X.; Yang, Y.; et al. Comprehensive Genomic Profiling Identifies Novel Genetic Predictors of Response to Anti-PD-(L)1 Therapies in Non-Small Cell Lung Cancer. Clin Cancer Res 2019. [Google Scholar] [CrossRef]
- Ricciuti, B.; Kravets, S.; Dahlberg, S.E.; Umeton, R.; Albayrak, A.; Subegdjo, S.J.; Johnson, B.E.; Nishino, M.; Sholl, L.M.; Awad, M.M. Use of targeted next generation sequencing to characterize tumor mutational burden and efficacy of immune checkpoint inhibition in small cell lung cancer. J. Immunother. Cancer 2019, 7, 87. [Google Scholar] [CrossRef]
- Chae, Y.K.; Davis, A.A.; Agte, S.; Pan, A.; Simon, N.I.; Iams, W.T.; Cruz, M.R.; Tamragouri, K.; Rhee, K.; Mohindra, N.; et al. Clinical Implications of Circulating Tumor DNA Tumor Mutational Burden (ctDNA TMB) in Non-Small Cell Lung Cancer. Oncologist 2019, 24, 820–828. [Google Scholar] [CrossRef] [PubMed]
- Gandara, D.R.; Paul, S.M.; Kowanetz, M.; Schleifman, E.; Zou, W.; Li, Y.; Rittmeyer, A.; Fehrenbacher, L.; Otto, G.; Malboeuf, C.; et al. Blood-based tumor mutational burden as a predictor of clinical benefit in non-small-cell lung cancer patients treated with atezolizumab. Nat. Med. 2018, 24, 1441–1448. [Google Scholar] [CrossRef] [PubMed]
- Khagi, Y.; Goodman, A.M.; Daniels, G.A.; Patel, S.P.; Sacco, A.G.; Randall, J.M.; Bazhenova, L.A.; Kurzrock, R. Hypermutated Circulating Tumor DNA: Correlation with Response to Checkpoint Inhibitor-Based Immunotherapy. Clin. Cancer Res. 2017, 23, 5729–5736. [Google Scholar] [CrossRef] [PubMed]
- Balar, A.V.; Galsky, M.D.; Rosenberg, J.E.; Powles, T.; Petrylak, D.P.; Bellmunt, J.; Loriot, Y.; Necchi, A.; Hoffman-Censits, J.; Perez-Gracia, J.L.; et al. Atezolizumab as first-line treatment in cisplatin-ineligible patients with locally advanced and metastatic urothelial carcinoma: A single-arm, multicentre, phase 2 trial. Lancet 2017, 389, 67–76. [Google Scholar] [CrossRef]
- Hellmann, M.D.; Paz-Ares, L.; Bernabe Caro, R.; Zurawski, B.; Kim, S.W.; Carcereny Costa, E.; Park, K.; Alexandru, A.; Lupinacci, L.; de la Mora Jimenez, E.; et al. Nivolumab plus Ipilimumab in Advanced Non-Small-Cell Lung Cancer. N. Engl. J. Med. 2019. [Google Scholar] [CrossRef]
- Cao, D.; Xu, H.; Xu, X.; Guo, T.; Ge, W. High tumor mutation burden predicts better efficacy of immunotherapy: A pooled analysis of 103078 cancer patients. Oncoimmunology 2019, 8, e1629258. [Google Scholar] [CrossRef]
- Frampton, G.M.; Fichtenholtz, A.; Otto, G.A.; Wang, K.; Downing, S.R.; He, J.; Schnall-Levin, M.; White, J.; Sanford, E.M.; An, P.; et al. Development and validation of a clinical cancer genomic profiling test based on massively parallel DNA sequencing. Nat. Biotechnol. 2013, 31, 1023–1031. [Google Scholar] [CrossRef]
- Cheng, D.T.; Mitchell, T.N.; Zehir, A.; Shah, R.H.; Benayed, R.; Syed, A.; Chandramohan, R.; Liu, Z.Y.; Won, H.H.; Scott, S.N.; et al. Memorial Sloan Kettering-Integrated Mutation Profiling of Actionable Cancer Targets (MSK-IMPACT): A Hybridization Capture-Based Next-Generation Sequencing Clinical Assay for Solid Tumor Molecular Oncology. J. Mol. Diagn. 2015, 17, 251–264. [Google Scholar] [CrossRef]
- Chan, T.A.; Yarchoan, M.; Jaffee, E.; Swanton, C.; Quezada, S.A.; Stenzinger, A.; Peters, S. Development of tumor mutation burden as an immunotherapy biomarker: Utility for the oncology clinic. Ann. Oncol. 2019, 30, 44–56. [Google Scholar] [CrossRef]
- Hendriks, L.E.; Rouleau, E.; Besse, B. Clinical utility of tumor mutational burden in patients with non-small cell lung cancer treated with immunotherapy. Transl. Lung Cancer Res. 2018, 7, 647–660. [Google Scholar] [CrossRef]
- Chalmers, Z.R.; Connelly, C.F.; Fabrizio, D.; Gay, L.; Ali, S.M.; Ennis, R.; Schrock, A.; Campbell, B.; Shlien, A.; Chmielecki, J.; et al. Analysis of 100,000 human cancer genomes reveals the landscape of tumor mutational burden. Genome Med. 2017, 9, 34. [Google Scholar] [CrossRef] [PubMed]
- Rosenberg, J.E.; Hoffman-Censits, J.; Powles, T.; van der Heijden, M.S.; Balar, A.V.; Necchi, A.; Dawson, N.; O’Donnell, P.H.; Balmanoukian, A.; Loriot, Y.; et al. Atezolizumab in patients with locally advanced and metastatic urothelial carcinoma who have progressed following treatment with platinum-based chemotherapy: A single-arm, multicentre, phase 2 trial. Lancet 2016, 387, 1909–1920. [Google Scholar] [CrossRef]
- Buchhalter, I.; Rempel, E.; Endris, V.; Allgauer, M.; Neumann, O.; Volckmar, A.L.; Kirchner, M.; Leichsenring, J.; Lier, A.; von Winterfeld, M.; et al. Size matters: Dissecting key parameters for panel-based tumor mutational burden analysis. Int. J. Cancer 2019, 144, 848–858. [Google Scholar] [CrossRef] [PubMed]
- Chang, H.; Sasson, A.; Srinivasan, S.; Golhar, R.; Greenawalt, D.M.; Geese, W.J.; Green, G.; Zerba, K.; Kirov, S.; Szustakowski, J. Bioinformatic Methods and Bridging of Assay Results for Reliable Tumor Mutational Burden Assessment in Non-Small-Cell Lung Cancer. Mol. Diagn. 2019, 23, 507–520. [Google Scholar] [CrossRef] [PubMed]
- Alsaab, H.O.; Sau, S.; Alzhrani, R.; Tatiparti, K.; Bhise, K.; Kashaw, S.K.; Iyer, A.K. PD-1 and PD-L1 Checkpoint Signaling Inhibition for Cancer Immunotherapy: Mechanism, Combinations, and Clinical Outcome. Front Pharm. 2017, 8, 561. [Google Scholar] [CrossRef] [PubMed]
- Hartley, G.P.; Chow, L.; Ammons, D.T.; Wheat, W.H.; Dow, S.W. Programmed Cell Death Ligand 1 (PD-L1) Signaling Regulates Macrophage Proliferation and Activation. Cancer Immunol. Res. 2018, 6, 1260–1273. [Google Scholar] [CrossRef]
- Conforti, F.; Pala, L.; Bagnardi, V.; De Pas, T.; Martinetti, M.; Viale, G.; Gelber, R.D.; Goldhirsch, A. Cancer immunotherapy efficacy and patients’ sex: A systematic review and meta-analysis. Lancet Oncol. 2018, 19, 737–746. [Google Scholar] [CrossRef]
- Carrera, C.; Potrony, M.; Puig, S. Sex as a predictor of response to cancer immunotherapy. Lancet Oncol. 2018, 19, e375. [Google Scholar] [CrossRef]
- Wallis CJ, D.; Butaney, M.; Satkunasivam, R.; Freedland, S.J.; Patel, S.P.; Hamid, O.; Pal, S.K.; Klaassen, Z. Association of Patient Sex with Efficacy of Immune Checkpoint Inhibitors and Overall Survival in Advanced Cancers: A Systematic Review and Meta-analysis. JAMA Oncol. 2019. [Google Scholar] [CrossRef]
- Alexandrov, L.B.; Nik-Zainal, S.; Wedge, D.C.; Aparicio, S.A.; Behjati, S.; Biankin, A.V.; Bignell, G.R.; Bolli, N.; Borg, A.; Borresen-Dale, A.L.; et al. Signatures of mutational processes in human cancer. Nature 2013, 500, 415–421. [Google Scholar] [CrossRef]
- Gupta, S.; Artomov, M.; Goggins, W.; Daly, M.; Tsao, H. Gender Disparity and Mutation Burden in Metastatic Melanoma. J. Natl. Cancer Inst. 2015, 107. [Google Scholar] [CrossRef] [PubMed]
- Luchini, C.; Bibeau, F.; Ligtenberg MJ, L.; Singh, N.; Nottegar, A.; Bosse, T.; Miller, R.; Riaz, N.; Douillard, J.Y.; Andre, F.; et al. ESMO recommendations on microsatellite instability testing for immunotherapy in cancer, and its relationship with PD-1/PD-L1 expression and tumour mutational burden: A systematic review-based approach. Ann. Oncol. 2019. [Google Scholar] [CrossRef] [PubMed]
- Yu, Y.; Zeng, D.; Ou, Q.; Liu, S.; Li, A.; Chen, Y.; Lin, D.; Gao, Q.; Zhou, H.; Liao, W.; et al. Association of Survival and Immune-Related Biomarkers With Immunotherapy in Patients With Non-Small Cell Lung Cancer: A Meta-analysis and Individual Patient-Level Analysis. JAMA Netw. Open 2019, 2, e196879. [Google Scholar] [CrossRef] [PubMed]
- Yarchoan, M.; Albacker, L.A.; Hopkins, A.C.; Montesion, M.; Murugesan, K.; Vithayathil, T.T.; Zaidi, N.; Azad, N.S.; Laheru, D.A.; Frampton, G.M.; et al. PD-L1 expression and tumor mutational burden are independent biomarkers in most cancers. JCI Insight 2019, 4. [Google Scholar] [CrossRef]
- McQuade, J.L.; Daniel, C.R.; Hess, K.R.; Mak, C.; Wang, D.Y.; Rai, R.R.; Park, J.J.; Haydu, L.E.; Spencer, C.; Wongchenko, M.; et al. Association of body-mass index and outcomes in patients with metastatic melanoma treated with targeted therapy, immunotherapy, or chemotherapy: A retrospective, multicohort analysis. Lancet Oncol. 2018, 19, 310–322. [Google Scholar] [CrossRef]
- Pinato, D.J.; Gramenitskaya, D.; Altmann, D.M.; Boyton, R.J.; Mullish, B.H.; Marchesi, J.R.; Bower, M. Antibiotic therapy and outcome from immune-checkpoint inhibitors. J. Immunother. Cancer 2019, 7, 287. [Google Scholar] [CrossRef]
- Miao, D.; Margolis, C.A.; Vokes, N.I.; Liu, D.; Taylor-Weiner, A.; Wankowicz, S.M.; Adeegbe, D.; Keliher, D.; Schilling, B.; Tracy, A.; et al. Genomic correlates of response to immune checkpoint blockade in microsatellite-stable solid tumors. Nat. Genet. 2018, 50, 1271–1281. [Google Scholar] [CrossRef]
- Conway, J.R.; Kofman, E.; Mo, S.S.; Elmarakeby, H.; Van Allen, E. Genomics of response to immune checkpoint therapies for cancer: Implications for precision medicine. Genome Med. 2018, 10, 93. [Google Scholar] [CrossRef]
- Zhai, T.T.; van Dijk, L.V.; Huang, B.T.; Lin, Z.X.; Ribeiro, C.O.; Brouwer, C.L.; Oosting, S.F.; Halmos, G.B.; Witjes MJ, H.; Langendijk, J.A.; et al. Improving the prediction of overall survival for head and neck cancer patients using image biomarkers in combination with clinical parameters. Radiother. Oncol. 2017, 124, 256–262. [Google Scholar] [CrossRef]
- Beukinga, R.J.; Hulshoff, J.B.; Mul VE, M.; Noordzij, W.; Kats-Ugurlu, G.; Slart, R.; Plukker, J.T.M. Prediction of Response to Neoadjuvant Chemotherapy and Radiation Therapy with Baseline and Restaging (18)F-FDG PET Imaging Biomarkers in Patients with Esophageal Cancer. Radiology 2018, 287, 983–992. [Google Scholar] [CrossRef]
- Hur, H.; Tulina, I.; Cho, M.S.; Min, B.S.; Koom, W.S.; Lim, J.S.; Ahn, J.B.; Kim, N.K. Biomarker-Based Scoring System for Prediction of Tumor Response After Preoperative Chemoradiotherapy in Rectal Cancer by Reverse Transcriptase Polymerase Chain Reaction Analysis. Dis. Colon Rectum 2016, 59, 1174–1182. [Google Scholar] [CrossRef] [PubMed]
- Panda, A.; Betigeri, A.; Subramanian, K.; Ross, J.S.; Pavlick, D.C.; Ali, S.; Markowski, P.; Silk, A.; Kaufman, H.L.; Lattime, E.; et al. Identifying a Clinically Applicable Mutational Burden Threshold as a Potential Biomarker of Response to Immune Checkpoint Therapy in Solid Tumors. JCO Precis. Oncol. 2017, 2017. [Google Scholar] [CrossRef] [PubMed]
- Nathanson, T.; Ahuja, A.; Rubinsteyn, A.; Aksoy, B.A.; Hellmann, M.D.; Miao, D.; Van Allen, E.; Merghoub, T.; Wolchok, J.D.; Snyder, A.; et al. Somatic Mutations and Neoepitope Homology in Melanomas Treated with CTLA-4 Blockade. Cancer Immunol. Res. 2017, 5, 84–91. [Google Scholar] [CrossRef]
- Moher, D.; Liberati, A.; Tetzlaff, J.; Altman D., G. Preferred reporting items for systematic reviews and meta-analyses: The PRISMA statement. BMJ 2009, 339, b2535. [Google Scholar] [CrossRef] [PubMed]
- Viechtbauer, W. Conducting meta-analyses in R with, the metafor package. J. Stat. Softw. 2010, 36. [Google Scholar] [CrossRef]
- Higgins, J.P.; Thompson, S.G.; Deeks, J.J.; Altman, D.G. Measuring inconsistency in meta-analyses. BMJ 2003, 327, 557–560. [Google Scholar] [CrossRef]
- Egger, M.; Davey Smith, G.; Schneider, M.; Minder, C. Bias in meta-analysis detected by a simple, graphical test. BMJ 1997, 315, 629–634. [Google Scholar] [CrossRef]


| Study | Type of Study | Malignancy | Type of Immunotherapy | Sample Source | Detection Method | TMB Cutoff | Median TMB (range) | Number of Patients (High/Low TMB) | Outcome |
|---|---|---|---|---|---|---|---|---|---|
| Balar et al. 2017 [44] | Retrospective analysis of clinical trial | Urothelial carcinoma | Atezolizumab | Tumor | FoundationOne | ≥16/MB | 8.1 (0.9–62.2) | 97 (NR) | OS |
| Chae et al. 2018 [28] | Retrospective cohort | NSCLC | PD-1/PD-L1 inhibitor | Tumor | FoundationOne | ≥15/MB | 8 (1–55) | 34 (NR) | OS, PFS |
| Chae et al. 2019a [41] | Retrospective cohort | NSCLC | Immune checkpoint inhibitors | Blood | Guardant360 | NR (median) | NR | 20 (10/10) | OS, PFS |
| Chae et al. 2019b [41] | Retrospective cohort | NSCLC | Immune checkpoint inhibitors | Blood | Guardant360 | NR (median) | NR | 12 (6/6) | OS, PFS |
| Cristescu et al. 2018a [30] | Retrospective analysis of clinical trial | Pan-tumor | Pembrolizumab | Tumor | WES | >102.5 | NR | 119 (37/82) | PFS |
| Cristescu et al. 2018b [30] | Retrospective analysis of clinical trial | Melanoma | Pembrolizumab | Tumor | WES | >191.5 | NR | 89 (59/30) | PFS |
| Cristescu et al. 2018c [30] | Retrospective analysis of clinical trial | HNSCC | Pembrolizumab | Tumor | WES | >86 | NR | 107 (54/53) | PFS |
| Fang et al. 2019 [39] | Retrospective analysis of clinical trial | NSCLC | PD-1/PD-L1 inhibitor | Tumor | WES | ≥157 (top tertile) | 87 (4–1528) | 73 (25/48) | PFS |
| Goodman et al. 2017 [27] | Retrospective cohort | Various | Various | Tumor | FoundationOne | ≥20/MB | 6 (1–347) | 151 (38/113) | OS, PFS |
| Hamid et al. 2019 [37] | Retrospective analysis of clinical trial | Melanoma | Atezolizumab | Tumor | FoundationOne | ≥16/MB | NR | 23 (12/11) | OS, PFS |
| Hellmann et al. 2018 [23] | Retrospective analysis of clinical trial | NSCLC | Nivolumab plus ipilimumab | Tumor | WES | >158 (median) | 158 | 75 (37/38) | PFS |
| Hugo et al. 2016 [31] | Retrospective cohort | Melanoma | Pembrolizumab or nivolumab | Tumor | WES | ≥577 (bottom tertile) | 489 (73–3985) | 37 (13/24) | OS |
| Johnson et al. 2016 [29] | Retrospective cohort | Melanoma | PD-1/PD-L1 inhibitor | Tumor | FoundationOne | >23.1/MB | NR | 65 (27/38) | OS, PFS |
| Khagi et al. 2017 [43] | Retrospective cohort | Various | Various | Blood | Guardant360 | >3 total ctDNR alterations | 2 (0–20) | 69 (20/49) | OS, PFS |
| Le et al. 2015 [5] | Clinical trial | Various | Pembrolizumab | Tumor | WES | NR | NR | 15 (NR) | OS, PFS |
| Ricciuti et al. 2019 [40] | Retrospective cohort | Small-cell lung cancer | Immune checkpoint inhibitors | Tumor | NGS (OncoPanel) | >9.7/MB (median) | 9.8 (1.2–31.2) | 52 (26/26) | OS, PFS |
| Rizvi et al. 2015a [22] | Retrospective cohort | NSCLC | Pembrolizumab | Tumor | WES | >209 (median) | NR | 18 (9/9) | PFS |
| Rizvi et al. 2015b [22] | Retrospective cohort | NSCLC | Pembrolizumab | Tumor | WES | >200 (median) | NR | 16 (8/8) | PFS |
| Rizvi et al. 2018 [26] | Retrospective cohort | NSCLC | Immune checkpoint inhibitors | Tumor | WES | >324 | 171 (1–1147) | 49 (12/37) | PFS |
| Roszik et al. 2016 [34] | Retrospective cohort | Melanoma | Ipilimumab | Tumor | NGS | >100 | NR | 76 (57/19) | OS |
| Samstein et al. 2019 [32] | Retrospective cohort | Various | Immune checkpoint inhibitors | Tumor | NGS (MSK-IMPACT) | 90th percentile of each histology | NR | 1662 (NR) | OS |
| Snyder, et al. 2014a [20] | Retrospective cohort | Melanoma | Ipilimumab or tremelimumab | Tumor | WES | >100 | NR | 25 (10/15) | OS |
| Snyder et al. 2014b [20] | Retrospective cohort | Melanoma | Ipilimumab or tremelimumab | Tumor | WES | >100 | NR | 39 (17/22) | OS |
| Van Allen et al. 2015 [21] | Retrospective cohort | Melanoma | Ipilimumab | Tumor | WES | ≥202 (median) | 197 (7–5854) | 110 (55/55) | OS, PFS |
| Wang et al. 2019 [38] | Retrospective analysis of clinical trial | Gastric cancer | Toripalimab | Tumor | WES | ≥12/MB | NR | 54 (12/42) | OS, PFS |
| Yusko et al. 2019a [35] | Retrospective analysis of clinical trial | Melanoma | Nivolumab or ipilimumab | Tumor | WES | NR | 171 | 30 (NR) | OS |
| Yusko et al. 2019b [35] | Retrospective analysis of clinical trial | Melanoma | Nivolumab or ipilimumab | Tumor | WES | NR | 159 | 38 (NR) | OS |
| Study | Type of Study | Malignancy | Immunotherapy versus Chemotherapy Comparison | Sample Source | Detection Method | TMB Cutoff | Number of Patients with High/Low TMB | Outcome |
|---|---|---|---|---|---|---|---|---|
| Carbone et al. 2017 [33] | Retrospective analysis of RCT | NSCLC | Nivolumab versus platinum-based chemotherapy | Tumor | WES | ≥243 (top tertile) | 107/205 | OS, PFS |
| Gandara et al. 2018a [42] | Retrospective analysis of RCT | NSCLC | Atezolizumab versus docetaxel | Blood | FoundationOne | ≥16/MB | 63/148 | OS, PFS |
| Gandara et al. 2018b [42] | Retrospective analysis of RCT | NSCLC | Atezolizumab versus docetaxel | Blood | FoundationOne | ≥16/MB | 158/425 | OS, PFS |
| Hellmann et al. 2019 * [45] | RCT | NSCLC | Nivolumab plus ipilimumab versus platinum doublet chemotherapy | Tumor | FoundationOne | ≥10/MB | 299/380 | OS |
| Hellmann et al. 2018a * [25] | RCT | NSCLC | Nivolumab plus ipilimumab versus platinum doublet chemotherapy | Tumor | FoundationOne | ≥10/MB | 299/380 | PFS |
| Hellmann et al. 2018b [25] | RCT | NSCLC | Nivolumab versus platinum doublet chemotherapy | Tumor | FoundationOne | ≥13/MB | 150/78 | PFS |
| Powles et al. 2018 [36] | RCT | Urothelial carcinoma | Atezolizumab versus platinum-based chemotherapy | Blood | FoundationOne | ≥9.65/MB (median) | 274/270 | OS |
| Subgroup | Overall Survival | Progression-Free Survival | ||||||||
|---|---|---|---|---|---|---|---|---|---|---|
| Number of Study Estimates | HR (95% CI) | p-Value * | I2 (%) | I2 among Subgroups (%) | Number of Study Estimates | HR (95% CI) | p-Value * | I2 (%) | I2 among Subgroups (%) | |
| All studies | 19 | 0.53 (0.42 to 0.67) | <0.001 | 0 | 19 | 0.52 (0.40 to 0.67) | <0.001 | 0 | ||
| Subgroup analysis | ||||||||||
| Treatment | 0 | - | ||||||||
| PD-1/PD-L1 inhibitors | 7 | 0.43 (0.29 to 0.64) | <0.001 | 0 | 11 | 0.51 (0.35 to 0.73) | <0.001 | 0 | ||
| CTLA-4 inhibitors | 4 | 0.57 (0.30 to 1.09) | 0.087 | 0 | ||||||
| PD-1 inhibitors versus PD-L1 inhibitors | 44 | - | ||||||||
| PD-1 inhibitors | 3 | 0.62 (0.33 to 1.17) | 0.14 | 0 | 7 | 0.54 (0.36 to 0.81) | 0.003 | 0 | ||
| PD-L1 inhibitors | 2 | 0.35 (0.21 to 0.61) | <0.001 | 0 | ||||||
| Cancer type | 0 | 0 | ||||||||
| Melanoma | 9 | 0.66 (0.43 to 1.01) | 0.056 | 0 | 4 | 0.47 (0.21 to 1.05) | 0.066 | 32 | ||
| NSCLC | 3 | 1.80 (0.21 to 15.60) | 0.59 | 19 | 8 | 0.53 (0.30 to 0.93) | 0.028 | 0 | ||
| Sample source | 0 | 0 | ||||||||
| Tumor tissue | 16 | 0.52 (0.41 to 0.66) | <0.001 | 0 | 16 | 0.50 (0.38 to 0.66) | <0.001 | 0 | ||
| Blood | 3 | 1.22 (0.21 to 7.21) | 0.83 | 39 | 3 | 0.84 (0.26 to 2.70) | 0.77 | 18 | ||
| Detection method | 77 | 0 | ||||||||
| WES | 8 | 0.73 (0.50 to 1.06) | 0.094 | 0 | 11 | 0.56 (0.41 to 0.77) | <0.001 | 0 | ||
| NGS | 11 | 0.44 (0.33 to 0.59) | <0.001 | 0 | 8 | 0.44 (0.26 to 0.73) | 0.001 | 6 | ||
| Data source | 0 | 0 | ||||||||
| Clinical trials | 6 | 0.57 (0.35 to 0.92) | 0.020 | 32 | 8 | 0.52 (0.36 to 0.75) | <0.001 | 0 | ||
| Cohorts | 13 | 0.50 (0.37 to 0.68) | <0.001 | 0 | 11 | 0.51 (0.35 to 0.76) | <0.001 | 1 | ||
| Number of participants | 0 | 0 | ||||||||
| ≥100 participants | 3 | 0.53 (0.37 to 0.75) | <0.001 | 0 | 4 | 0.56 (0.37 to 0.85) | 0.007 | 7 | ||
| <100 participants | 16 | 0.53 (0.39 to 0.72) | <0.001 | 0 | 15 | 0.49 (0.34 to 0.69) | <0.001 | 0 | ||
© 2019 by the authors. Licensee MDPI, Basel, Switzerland. This article is an open access article distributed under the terms and conditions of the Creative Commons Attribution (CC BY) license (http://creativecommons.org/licenses/by/4.0/).
Share and Cite
Kim, J.Y.; Kronbichler, A.; Eisenhut, M.; Hong, S.H.; van der Vliet, H.J.; Kang, J.; Shin, J.I.; Gamerith, G. Tumor Mutational Burden and Efficacy of Immune Checkpoint Inhibitors: A Systematic Review and Meta-Analysis. Cancers 2019, 11, 1798. https://doi.org/10.3390/cancers11111798
Kim JY, Kronbichler A, Eisenhut M, Hong SH, van der Vliet HJ, Kang J, Shin JI, Gamerith G. Tumor Mutational Burden and Efficacy of Immune Checkpoint Inhibitors: A Systematic Review and Meta-Analysis. Cancers. 2019; 11(11):1798. https://doi.org/10.3390/cancers11111798
Chicago/Turabian StyleKim, Jong Yeob, Andreas Kronbichler, Michael Eisenhut, Sung Hwi Hong, Hans J. van der Vliet, Jeonghyun Kang, Jae Il Shin, and Gabriele Gamerith. 2019. "Tumor Mutational Burden and Efficacy of Immune Checkpoint Inhibitors: A Systematic Review and Meta-Analysis" Cancers 11, no. 11: 1798. https://doi.org/10.3390/cancers11111798
APA StyleKim, J. Y., Kronbichler, A., Eisenhut, M., Hong, S. H., van der Vliet, H. J., Kang, J., Shin, J. I., & Gamerith, G. (2019). Tumor Mutational Burden and Efficacy of Immune Checkpoint Inhibitors: A Systematic Review and Meta-Analysis. Cancers, 11(11), 1798. https://doi.org/10.3390/cancers11111798