Identification of SERPINE1 as a Regulator of Glioblastoma Cell Dispersal with Transcriptome Profiling

 , , , ,
  and
and 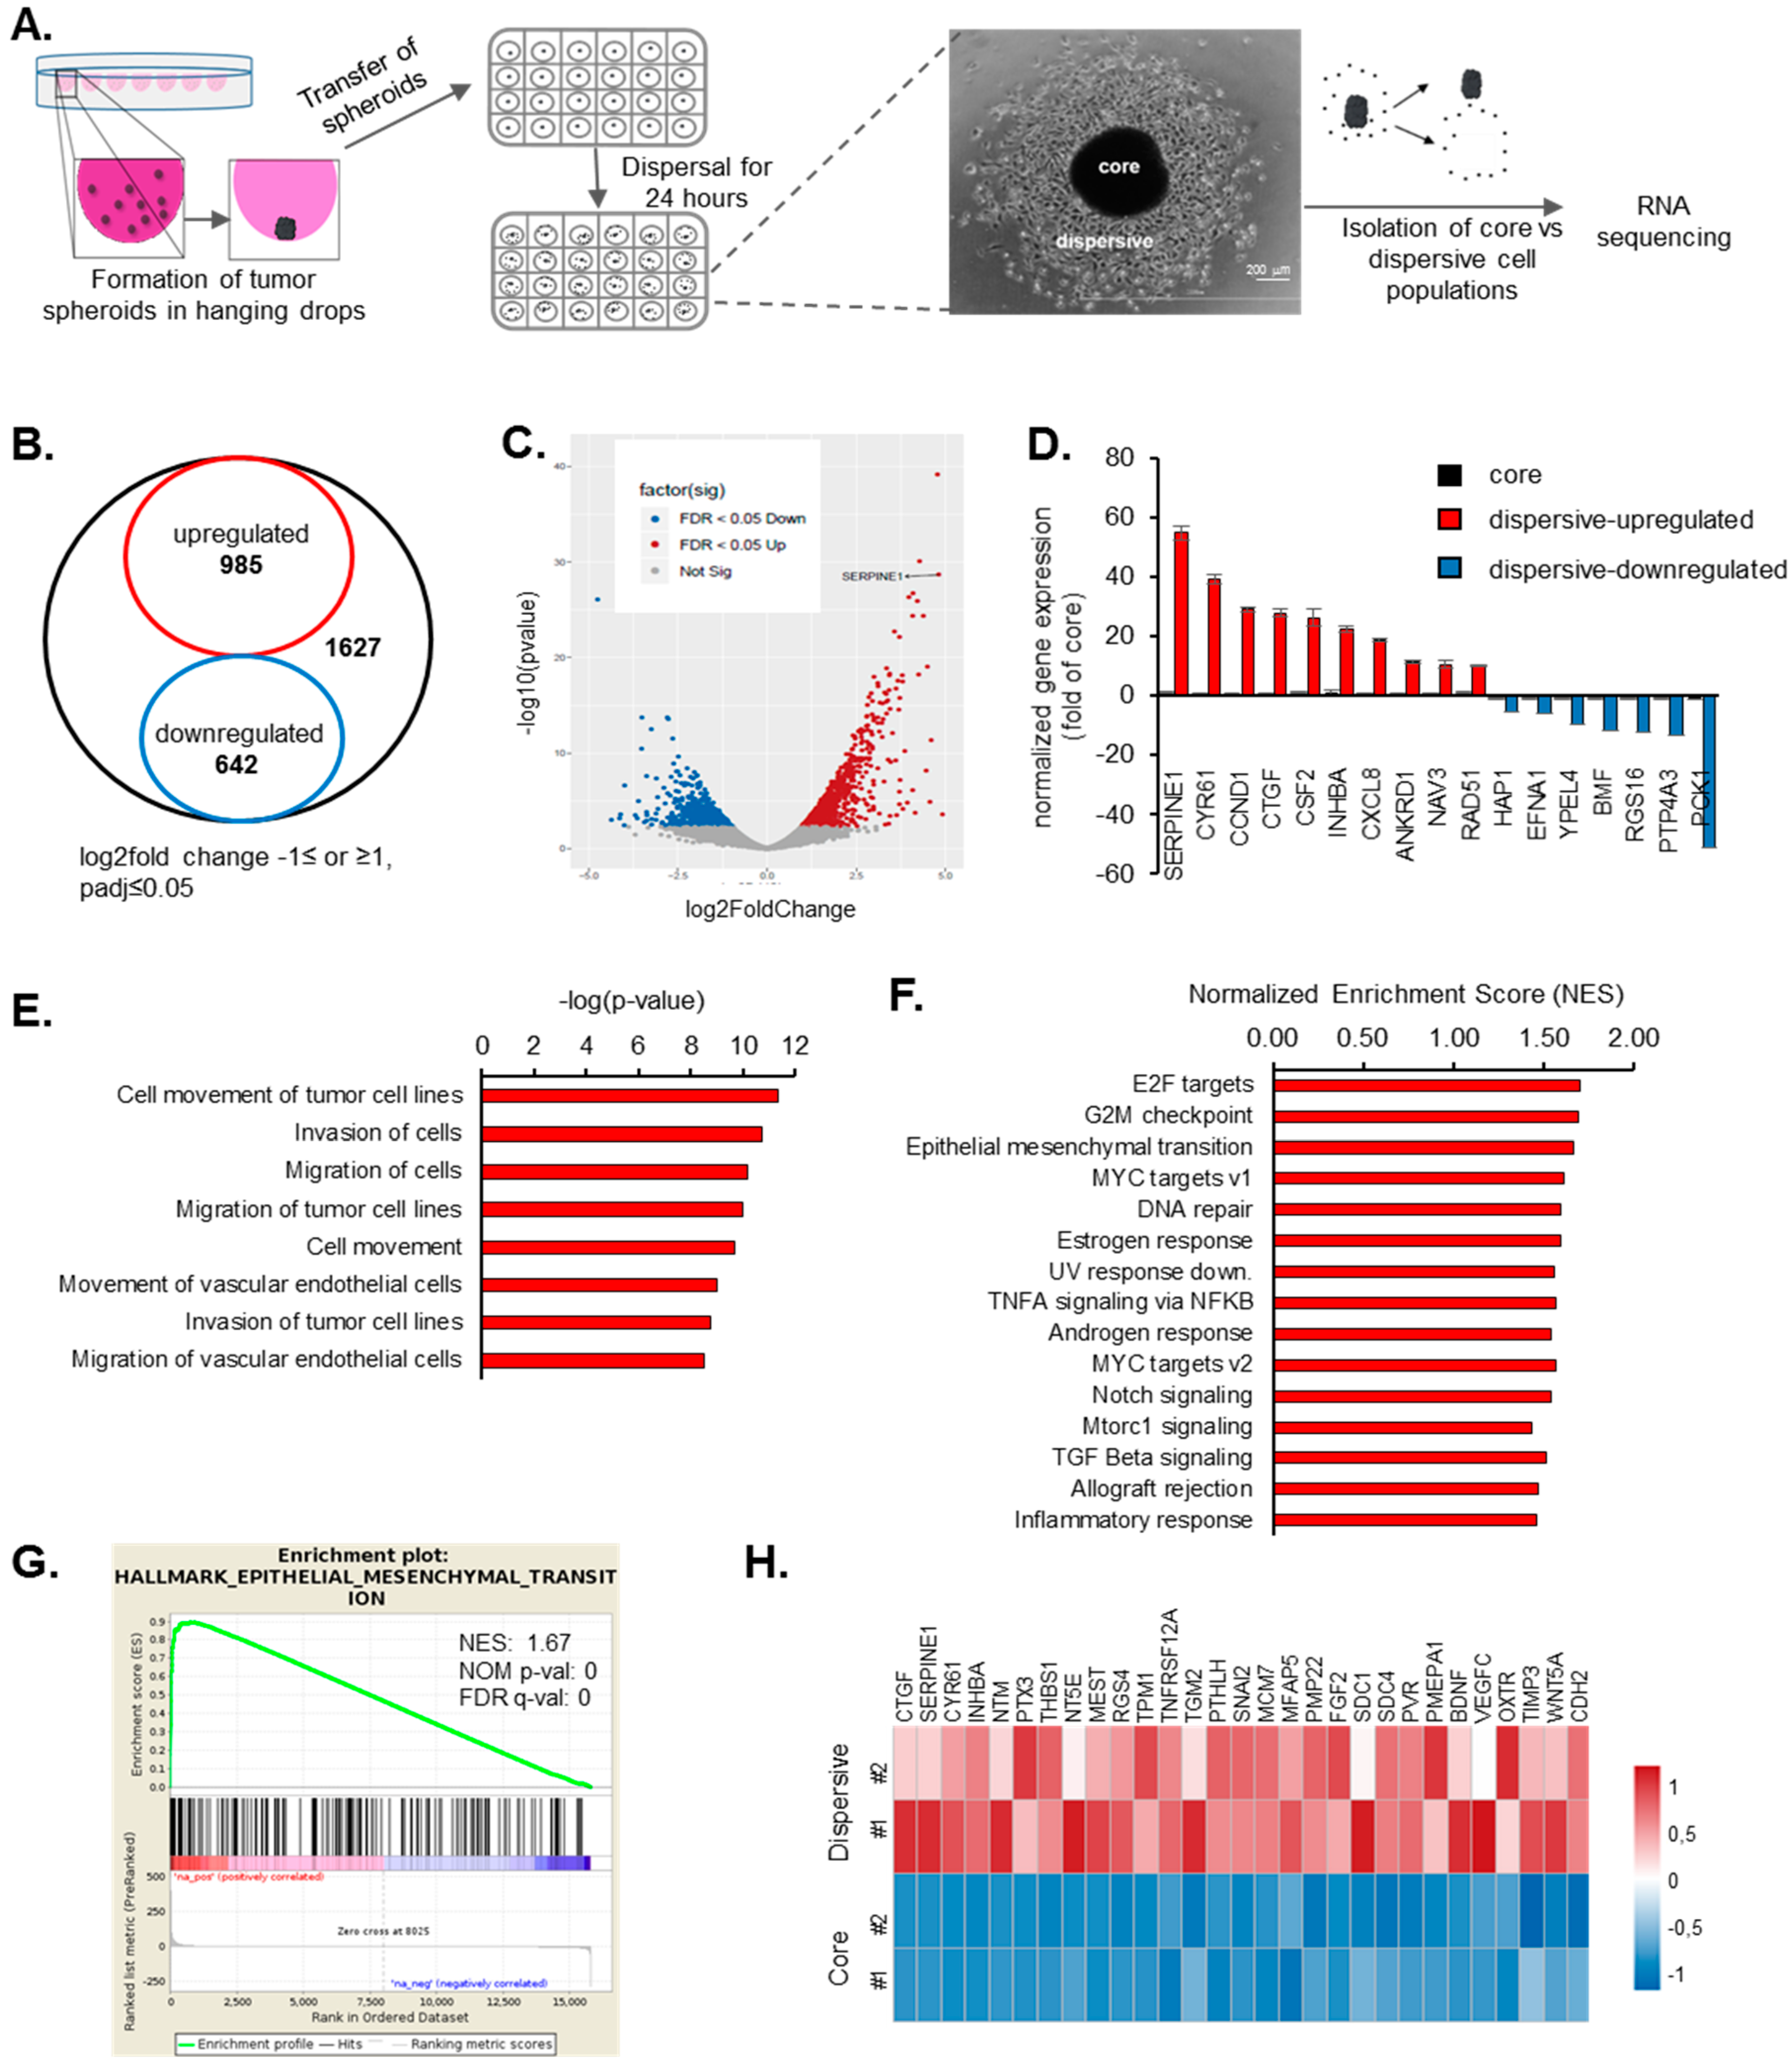
Abstract
1. Introduction
2. Results
2.1. Transcriptome Profiling of Motile and Non-Motile GBM Cells Reveal Major Alterations in Cell Proliferation and Movement Pathways
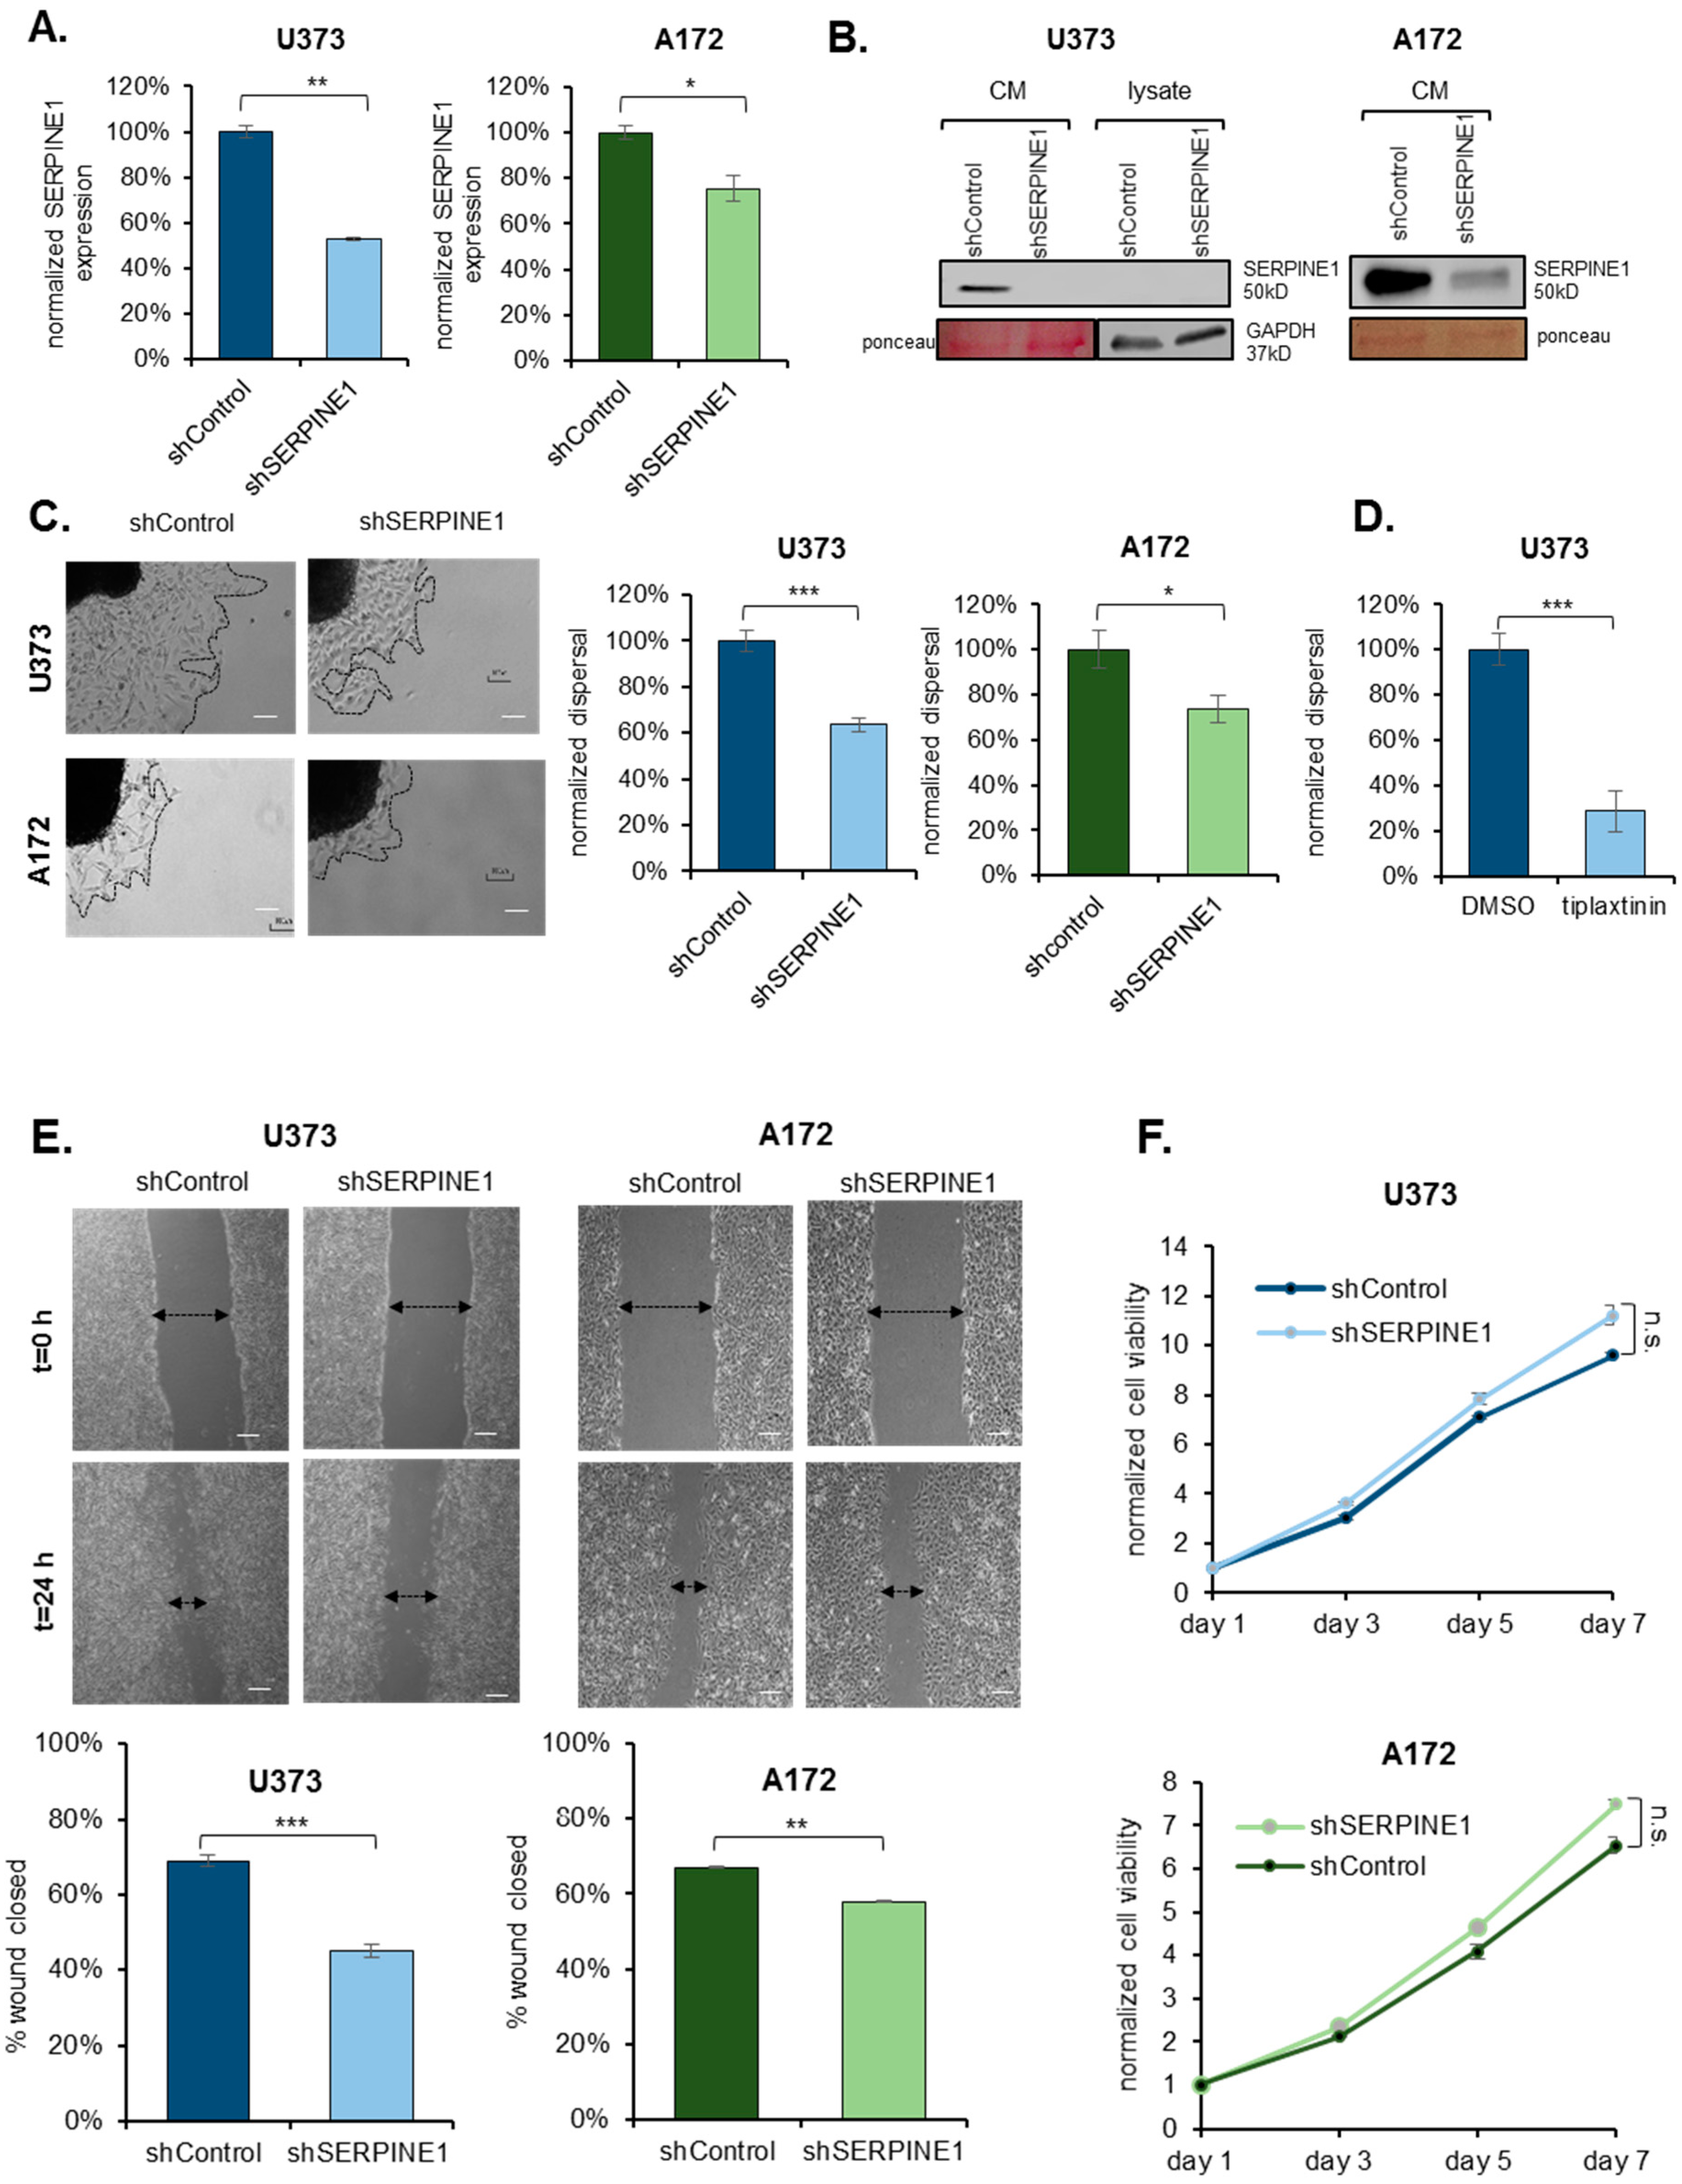
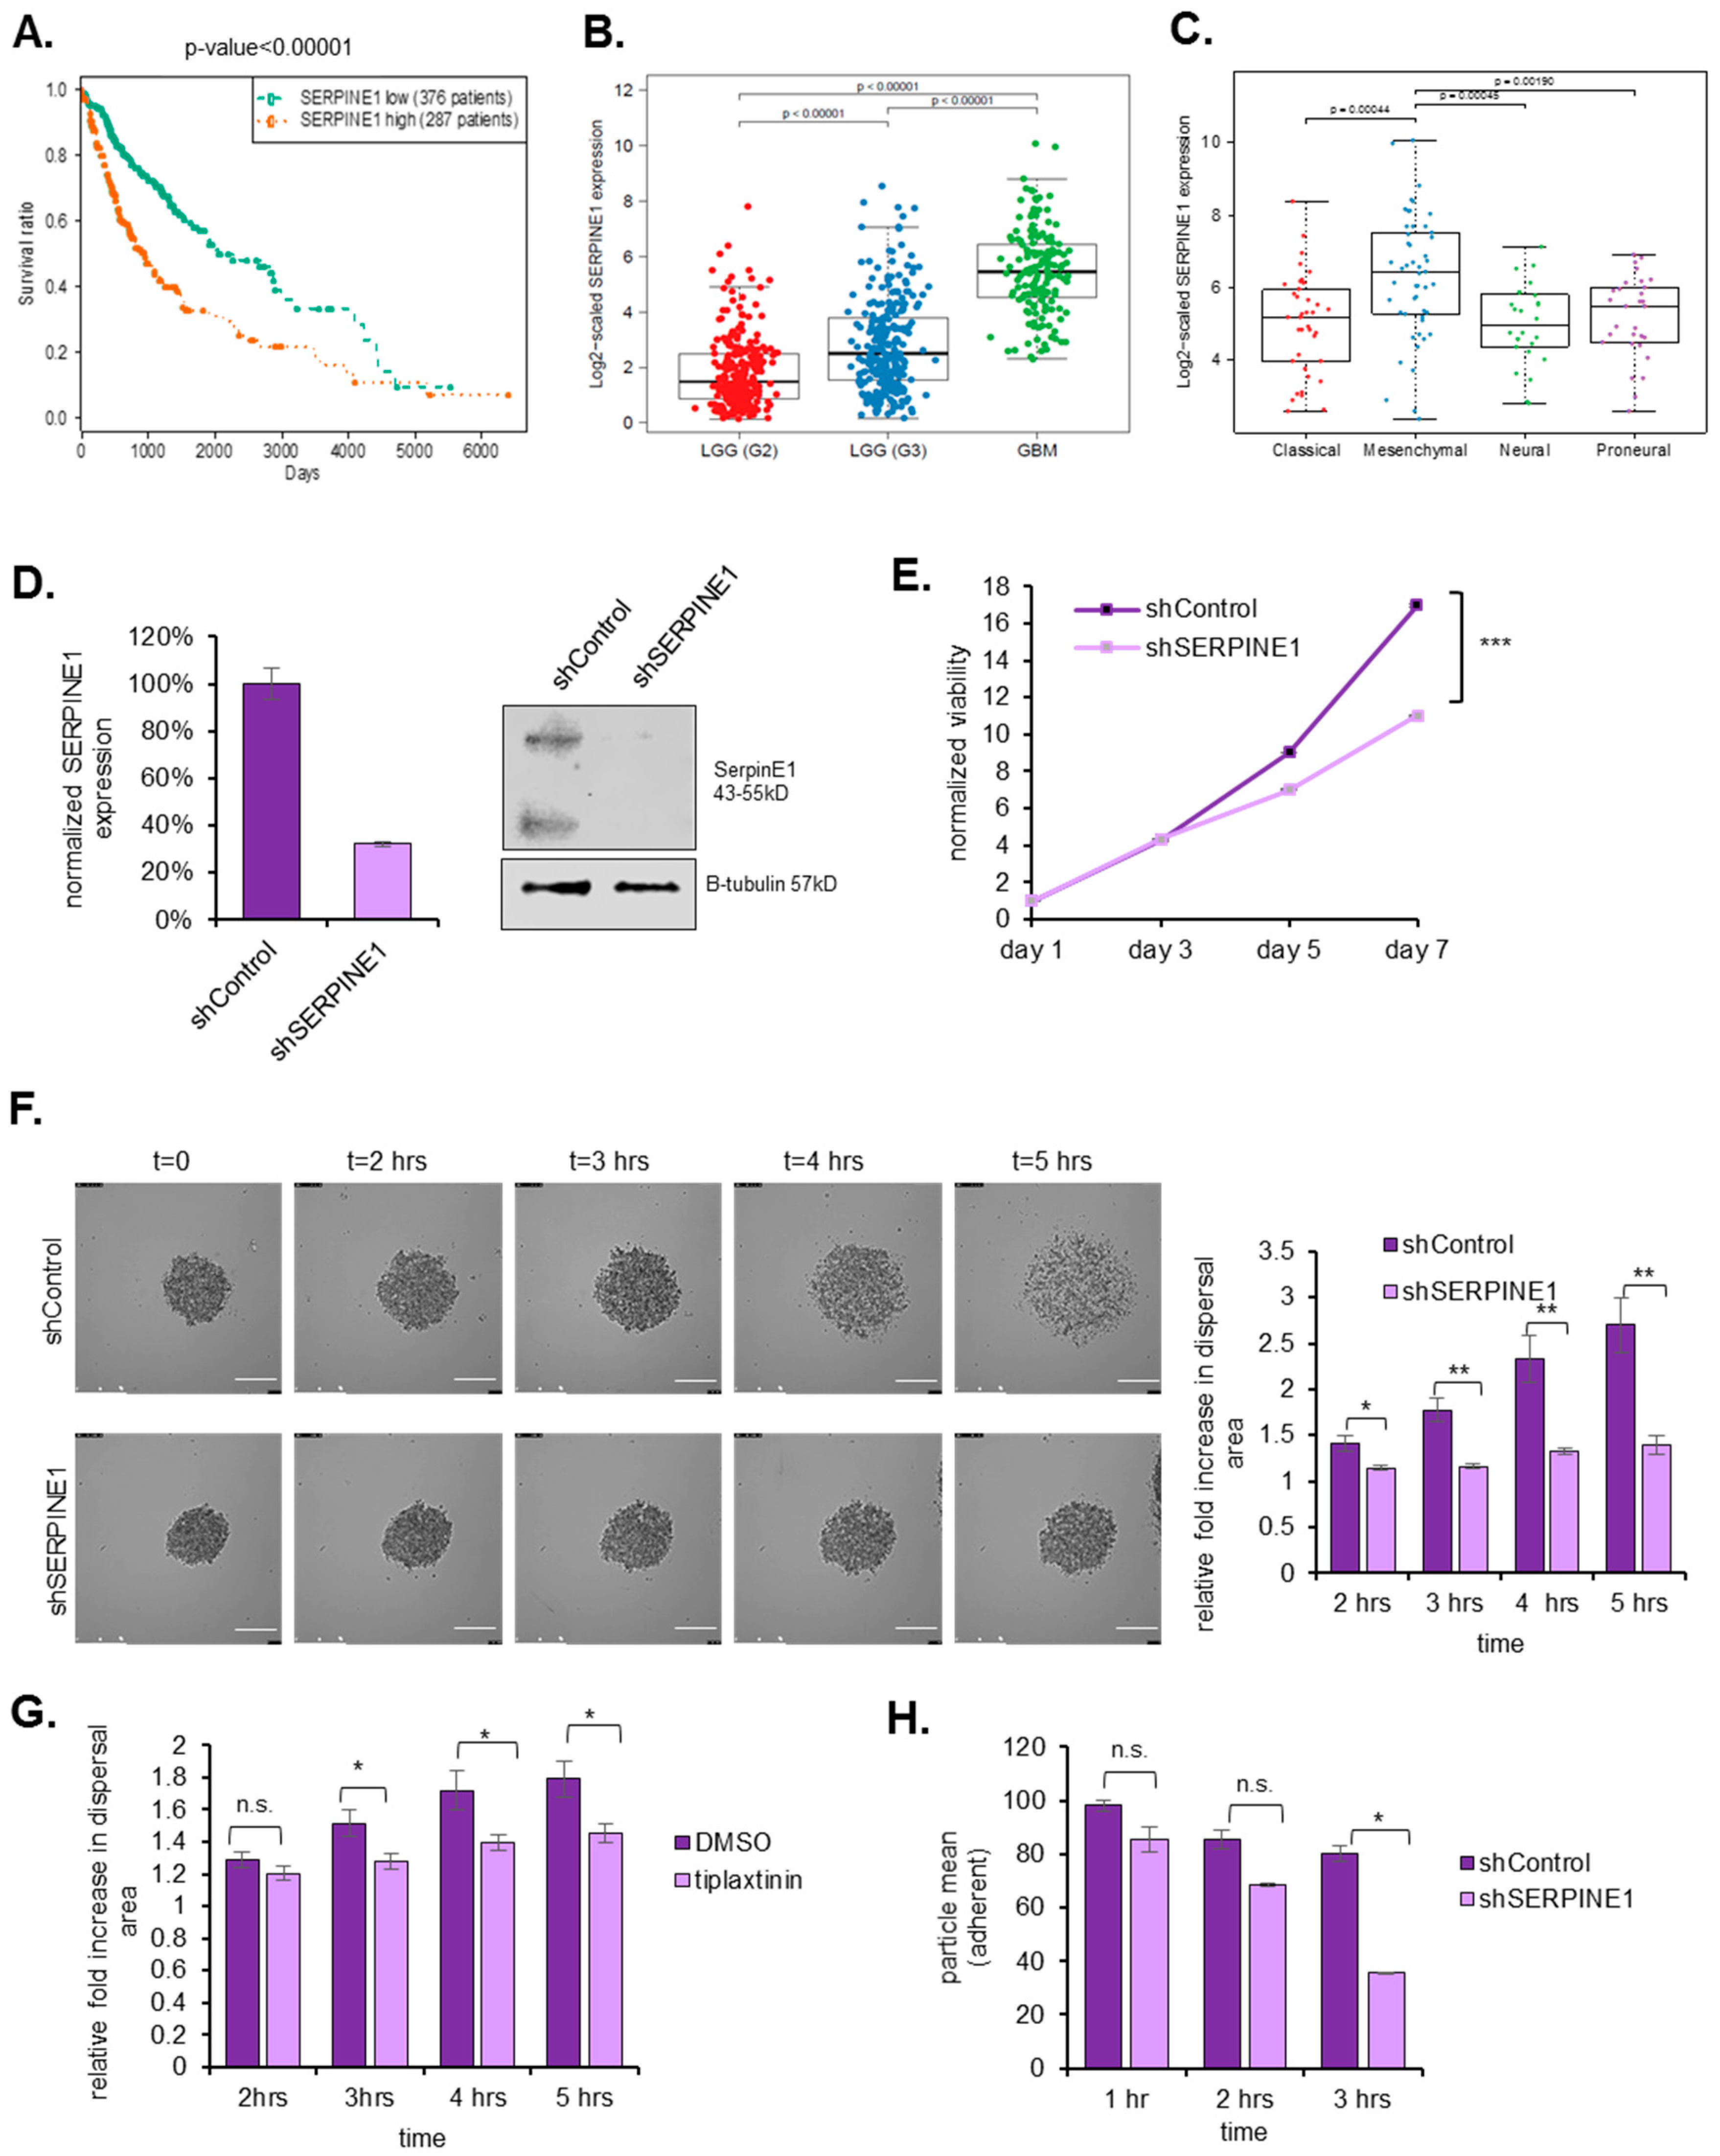
2.2. SERPINE1 Inhibition Reduces GBM Dispersal
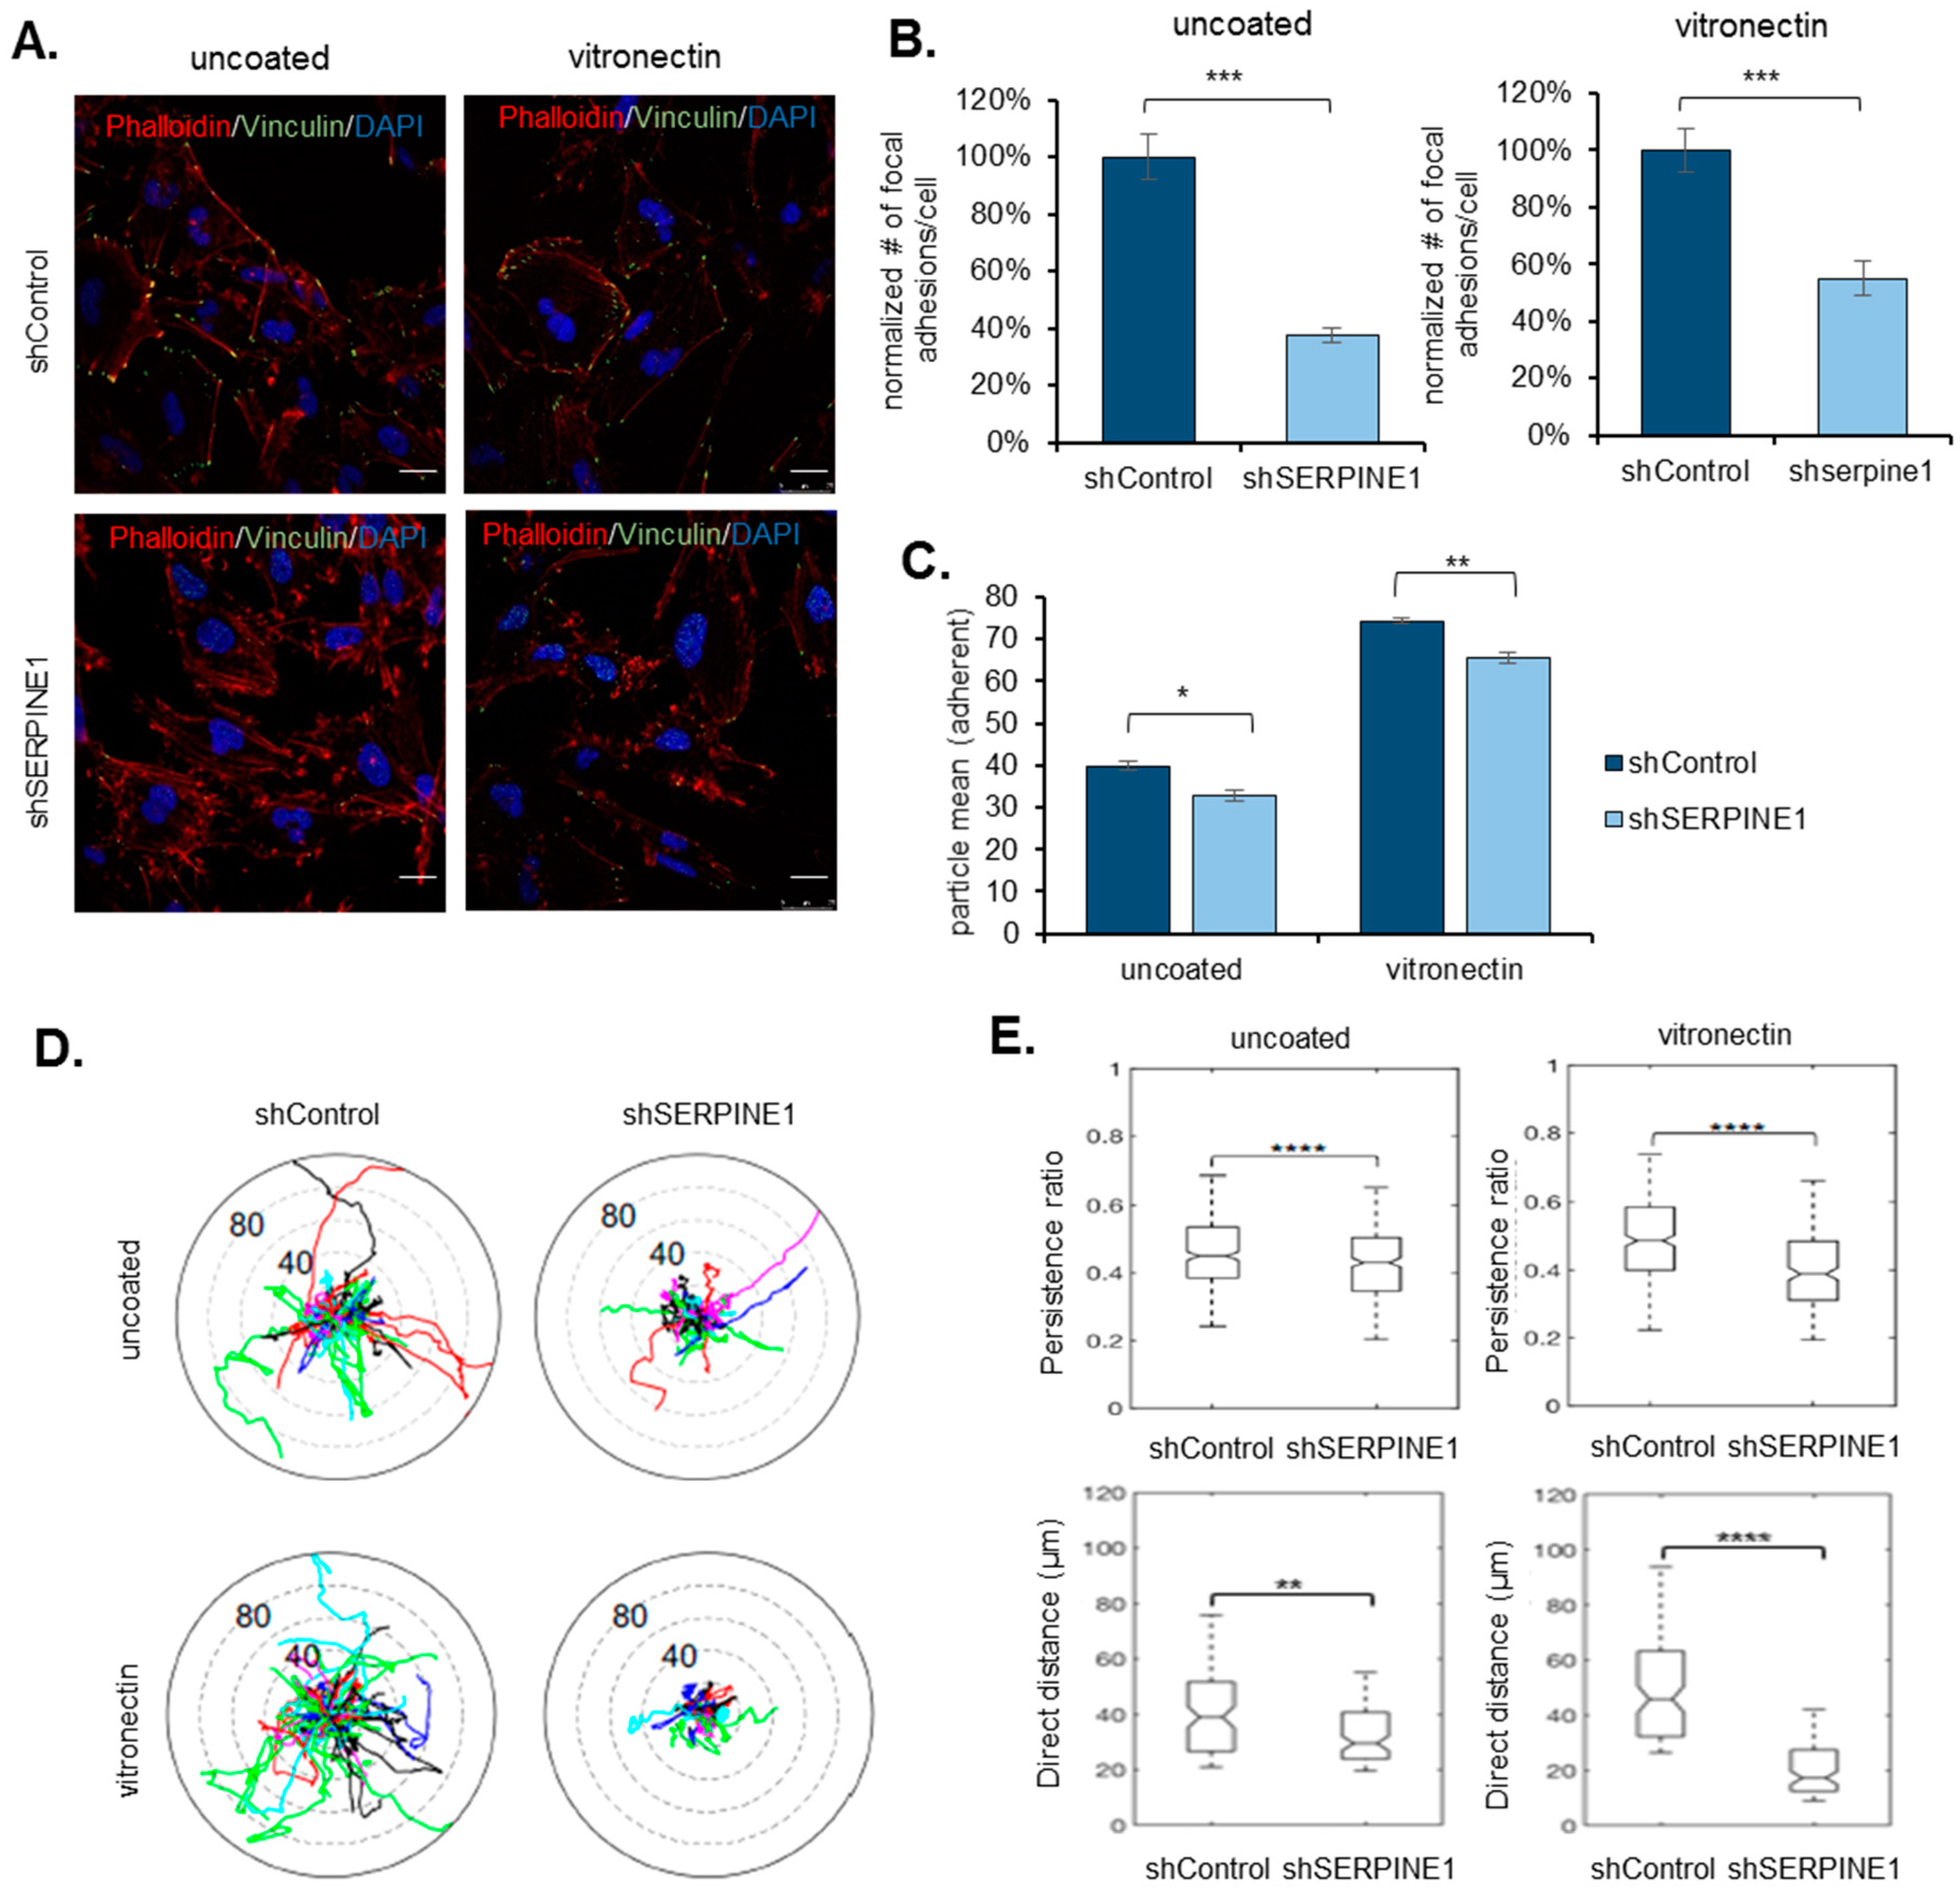
2.3. SERPINE1 Knock-Down Reduces Cell Adhesion and Directional Persistence of GBM Cells
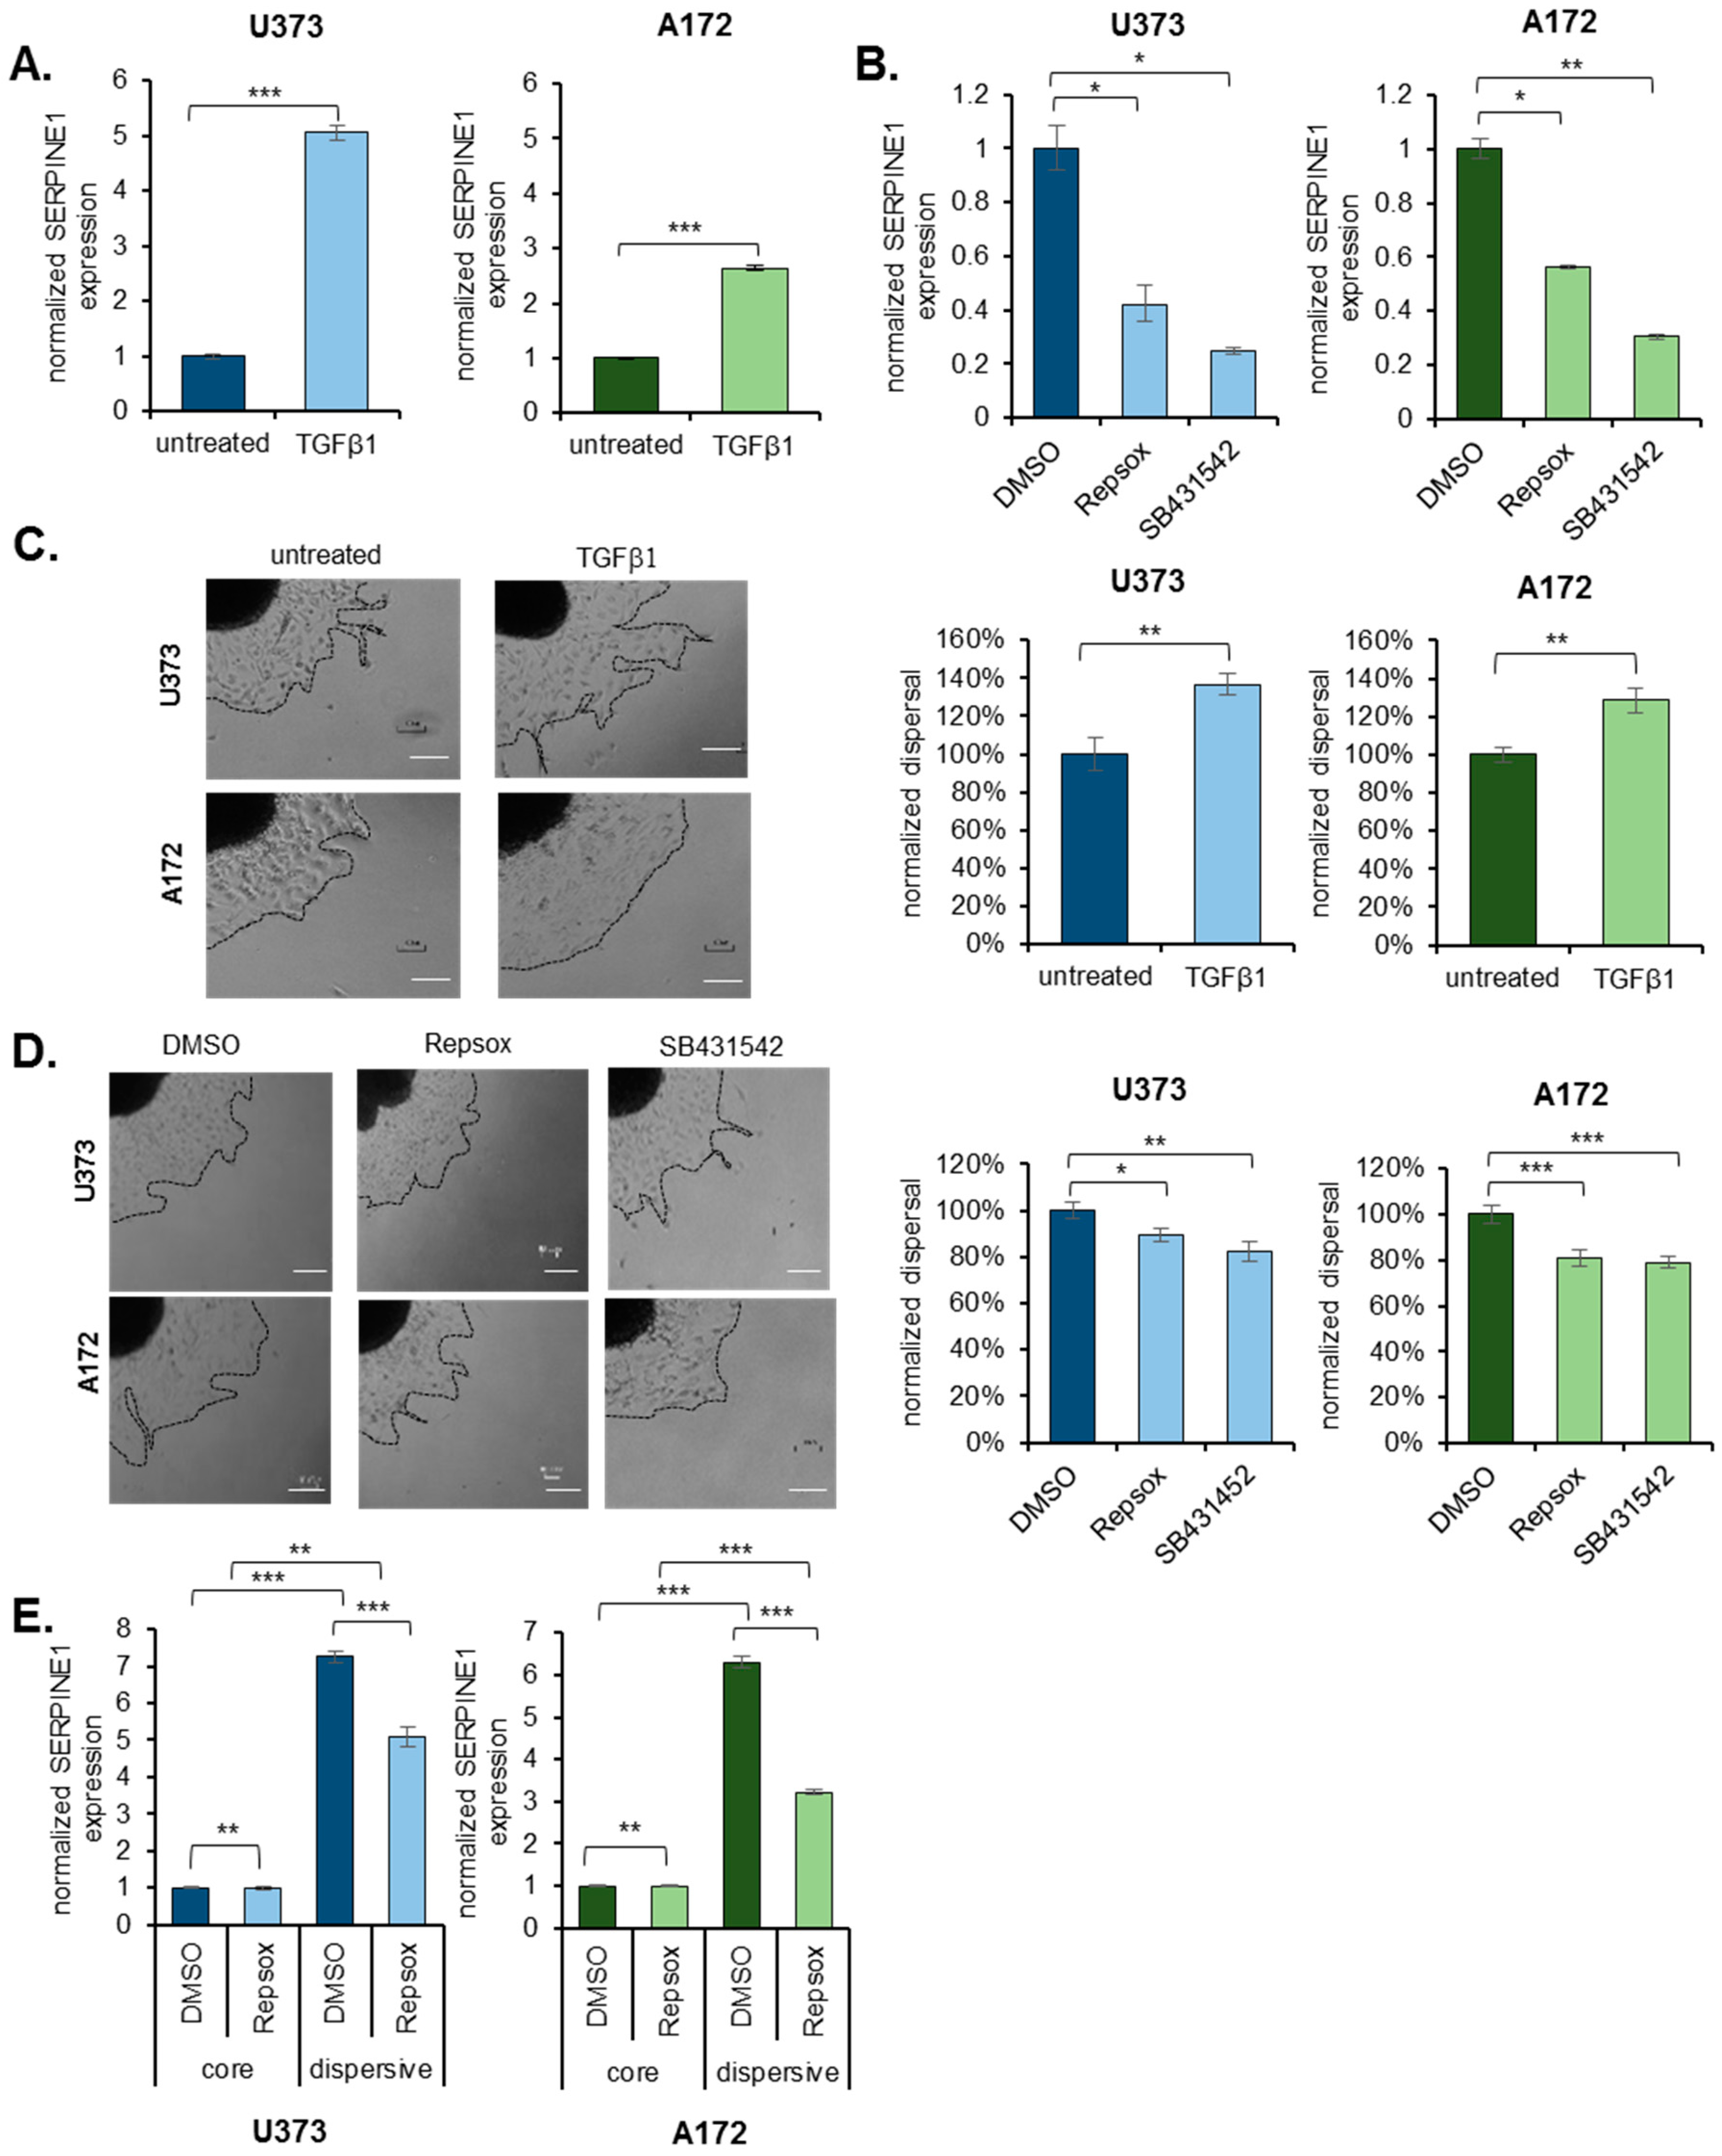
2.4. TGFβ Is an Upstream Regulator of SERPINE1
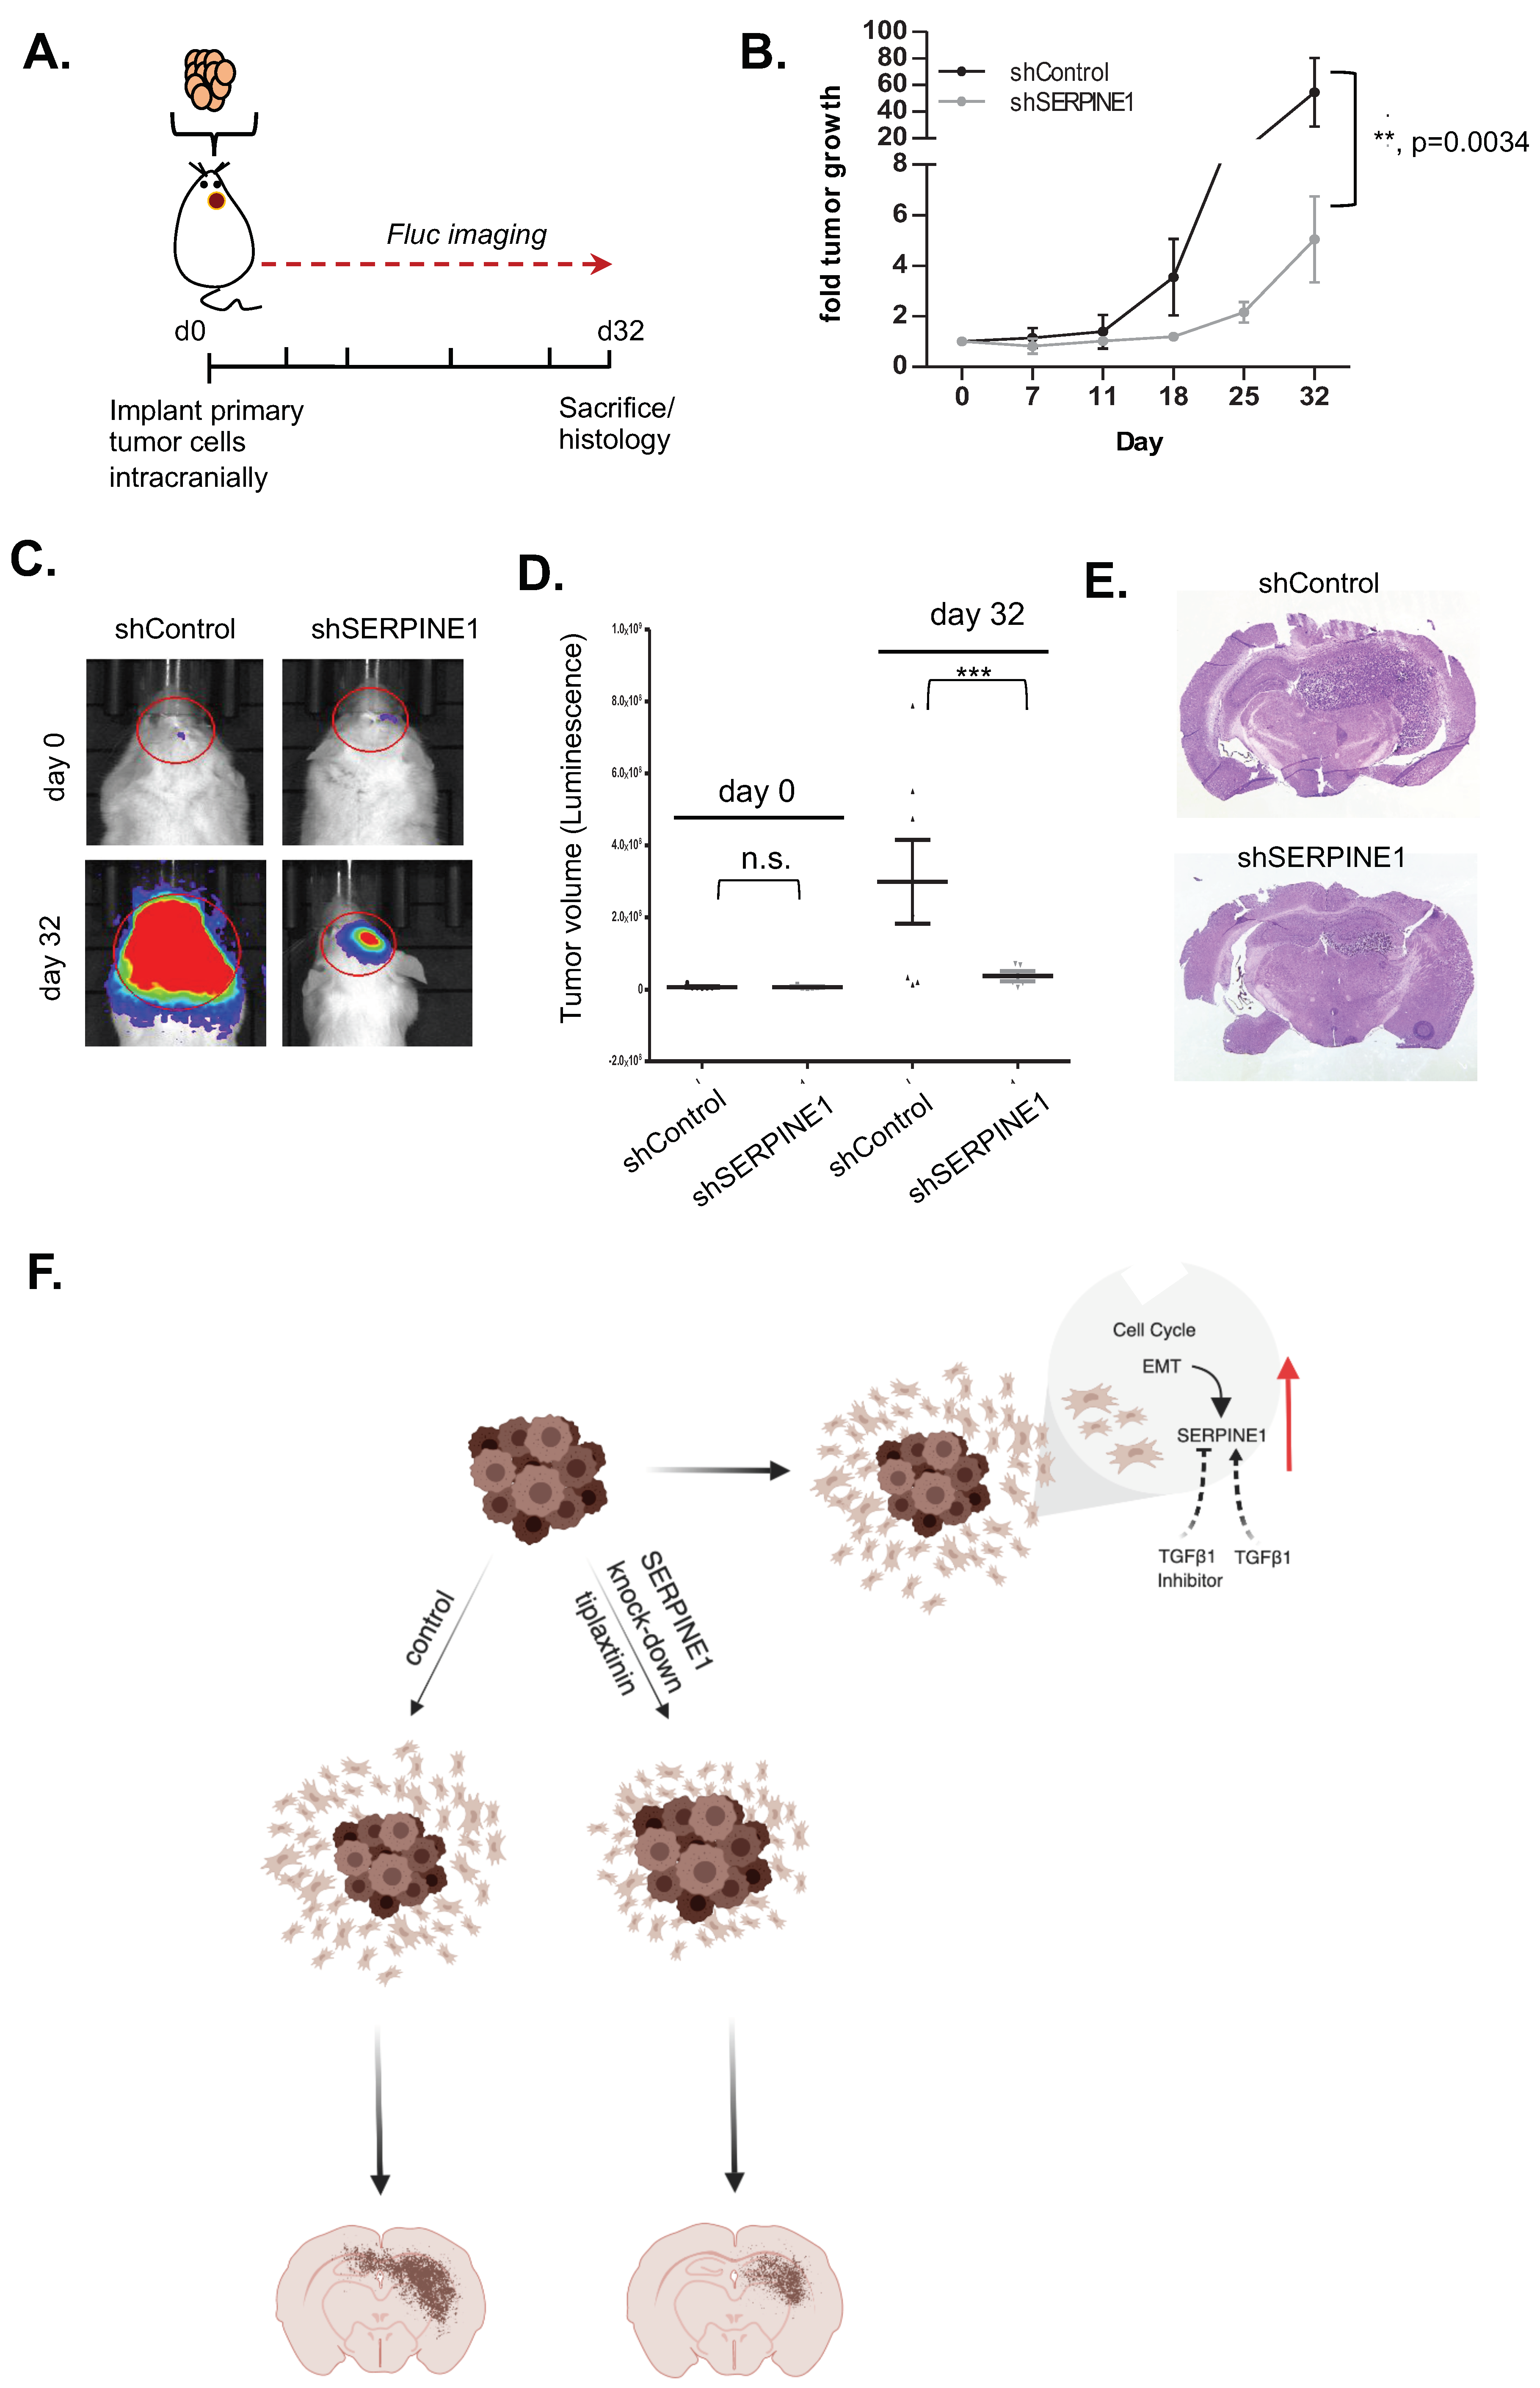
2.5. SERPINE1 Expression Is Associated with Poor Patient Survival and Its Silencing in A Clinically-Relevant Model Reduces Dispersal
2.6. SERPINE1 Knock-Down Reduces Tumor Progression In Vivo
3. Discussion
4. Materials and Methods
4.1. Cell Culture and Reagents
4.2. Generation of Tumor Cell Spheroids
4.3. Dispersal Assays
4.4. Dispersal Area Analysis
4.5. Wound Healing Assays
4.6. RNA Sequencing (RNA-seq) and Transcriptome Profiling of Core and Migratory Cells
4.7. qRT-PCR Experiments
4.8. Cloning and Packaging of Silencing Vectors
4.9. Western Blotting
4.10. Cell Viability Experiments
4.11. Immunofluorescence Staining
4.12. Adhesion Experiments
4.13. Single-Cell Tracking and Persistence Analysis
4.14. Patient Survival Analysis
4.15. Live Cell Imaging Experiments
4.16. In Vivo Experiments
5. Conclusions
Supplementary Materials
Author Contributions
Funding
Acknowledgments
Conflicts of Interest
References
- Ramirez, Y.P.; Weatherbee, J.L.; Wheelhouse, R.T.; Ross, A.H. Glioblastoma multiforme therapy and mechanisms of resistance. Pharmaceuticals 2013, 6, 1475–1506. [Google Scholar] [CrossRef] [PubMed]
- Demuth, T.; Rennert, J.L.; Hoelzinger, D.B.; Reavie, L.B.; Nakada, M.; Beaudry, C.; Nakada, S.; Anderson, E.M.; Henrichs, A.N.; McDonough, W.S.; et al. Glioma cells on the run—The migratory transcriptome of 10 human glioma cell lines. BMC Genom. 2008, 9, 1–15. [Google Scholar] [CrossRef] [PubMed]
- Cha, J.; Kang, S.G.; Kim, P. Strategies of Mesenchymal Invasion of Patient-derived Brain Tumors: Microenvironmental Adaptation. Sci. Rep. 2016, 6, 1–12. [Google Scholar] [CrossRef] [PubMed]
- Cheng, L.; Wu, Q.; Guryanova, O.A.; Huang, Z.; Rich, J.N.; Bao, S. Elevated invasive potential of glioblastoma stem cells. Biochem. Biophys. Res. Commun. 2011, 406, 643–648. [Google Scholar] [CrossRef]
- Nakada, M.; Nakada, S.; Demuth, T.; Tran, N.L.; Hoelzinger, D.B.; Berens, M.E. Molecular targets of glioma invasion. Cell. Mol. Life Sci. 2007, 64, 458–478. [Google Scholar] [CrossRef] [PubMed]
- O’Neill, G.M.; Zhong, J.; Paul, A.; Kellie, S.J. Mesenchymal migration as a therapeutic target in glioblastoma. J. Oncol. 2010, 2010, 430142. [Google Scholar]
- Xie, Q.; Thompson, R.; Hardy, K.; DeCamp, L.; Berghuis, B.; Sigler, R.; Knudsen, B.; Cottingham, S.; Zhao, P.; Dykema, K.; et al. A highly invasive human glioblastoma pre-clinical model for testing therapeutics. J. Transl. Med. 2008, 6, 1–13. [Google Scholar] [CrossRef]
- Xie, Q.; Mittal, S.; Berens, M.E. Targeting adaptive glioblastoma: An overview of proliferation and invasion. Neuro. Oncol. 2014, 16, 1575–1584. [Google Scholar] [CrossRef]
- Friedl, P.; Alexander, S. Cancer invasion and the microenvironment: Plasticity and reciprocity. Cell 2011, 147, 992–1009. [Google Scholar] [CrossRef]
- Gkretsi, V.; Stylianopoulos, T. Cell Adhesion and Matrix paintness: Coordinating Cancer Cell Invasion and Metastasis. Front. Oncol. 2018, 8, 145. [Google Scholar] [CrossRef]
- Mariani, L.; McDonough, W.S.; Hoelzinger, D.B.; Beudry, C.; Kaczmarek, E.; Coons, S.W.; Giese, A.; Moghaddam, M.; Seiler, R.W.; Berens, M.E. Identification and validation of P311 as a glioblastoma invasion gene using laser capture microdissection. Cancer Res. 2001, 61, 4190–4196. [Google Scholar] [PubMed]
- Hoelzinger, D.B.; Mariani, L.; Weis, J.; Woyke, T.; Berens, T.J.; McDonough, W.S.; Sloan, A.; Coons, S.W.; Berens, M.E. Gene Expression Profile of Glioblastoma Multiforme Invasive Phenotype Points to New Therapeutic Targets. Neoplasia 2006, 7, 7–16. [Google Scholar] [CrossRef] [PubMed]
- Gumireddy, K.; Sun, F.; Klein-Szanto, A.J.; Gibbins, J.M.; Gimotty, P.A.; Saunders, A.J.; Schultz, P.G.; Huang, Q. In vivo selection for metastasis promoting genes in the mouse. Proc. Natl. Acad. Sci. USA 2007, 104, 6696–6701. [Google Scholar] [CrossRef] [PubMed]
- Seo, M.; Lee, W.-H.; Suk, K. Identification of novel cell migration-promoting genes by a functional genetic screen. FASEB J. 2010, 24, 464–478. [Google Scholar] [CrossRef]
- Gobeil, S.; Zhu, X.; Doillon, C.J.; Green, M.R. A genome-wide shRNA screen identifies GAS1 as a novel melanoma metastasis suppressor gene. Genes Dev. 2008, 22, 2932–2940. [Google Scholar] [CrossRef]
- Li, N.; Zhang, Y.; Sidlauskas, K.; Ellis, M.; Evans, I.; Frankel, P.; Lau, J.; El-Hassan, T.; Guglielmi, L.; Broni, J.; et al. Inhibition of GPR158 by microRNA-449a suppresses neural lineage of glioma stem/progenitor cells and correlates with higher glioma grades. Oncogene 2018, 37, 4313–4333. [Google Scholar] [CrossRef]
- Kamikubo, Y.; Neels, J.G.; Degryse, B. Vitronectin inhibits plasminogen activator inhibitor-1-induced signalling and chemotaxis by blocking plasminogen activator inhibitor-1 binding to the low-density lipoprotein receptor-related protein. Int. J. Biochem. Cell Biol. 2009, 41, 578–585. [Google Scholar] [CrossRef]
- Verhaak, R.G.W.; Hoadley, K.A.; Purdom, E.; Wang, V.; Qi, Y.; Wilkerson, M.D.; Miller, C.R.; Ding, L.; Golub, T.; Mesirov, J.P.; et al. Integrated Genomic Analysis Identifies Clinically Relevant Subtypes of Glioblastoma Characterized by Abnormalities in PDGFRA, IDH1, EGFR, and NF1. Cancer Cell 2010, 17, 98–110. [Google Scholar] [CrossRef]
- Wakimoto, H.; Kesari, S.; Farrell, C.J.; Curry, W.T., Jr.; Zaupa, C.; Aghi, M.; Kuroda, T.; Stemmer-Rachamimov, A.; Shah, K.; Liu, T.C.; et al. Human glioblastoma-derived cancer stem cells: Establishment of invasive glioma models and treatment with oncolytic herpes simplex virus vectors. Cancer Res. 2009, 69, 3472–3481. [Google Scholar] [CrossRef]
- Del Duca, D.; Werbowetski, T.; Del Maestro, R.F. Spheroid preparation from hanging drops: Characterization of a model of brain tumor invasion. J. Neurooncol. 2004, 67, 295–303. [Google Scholar] [CrossRef]
- Van Roosmalen, W.; Le Devedec, S.E.; Golani, O.; Smid, M.; Pulyakhina, I.; Timmermans, A.M.; Look, M.P.; Zi, D.; Pont, C.; Graauw, M.; et al. Tumor cell migration screen identifies SRPK1 as breast cancer metastasis determinant. J. Clin. Invest. 2015, 125, 1648–1664. [Google Scholar] [CrossRef] [PubMed]
- Bagci, T.; Wu, J.K.; Pfannl, R.; Ilag, L.L.; Jay, D.G. Autocrine semaphorin 3A signaling promotes glioblastoma dispersal. Oncogene 2009, 28, 3537–3550. [Google Scholar] [CrossRef] [PubMed]
- Giese, A.; Loo, M.A.; Tran, N.; Haskett, D.; Coons, S.W.; Berens, M.E. Dichotomy of astrocytoma migration and proliferation. Int. J. Cancer 1996, 67, 275–282. [Google Scholar] [CrossRef]
- Duffy, M.J. The urokinase plasminogen activator system: Role in malignancy. Curr. Pharm. Des. 2004, 10, 39–49. [Google Scholar] [CrossRef] [PubMed]
- Garg, N.; Goyal, N.; Strawn, T.L.; Wu, J.; Mann, K.M.; Lawrence, D.A.; Fay, W.P. Plasminogen activator inhibitor-1 and vitronectin expression level and stoichiometry regulate vascular smooth muscle cell migration through physiological collagen matrices. Cell 2011, 8, 1847–1854. [Google Scholar] [CrossRef]
- Freytag, J.; Wilkins-Port, C.E.; Higgins, C.E.; Carlson, J.A.; Noel, A.; Foidart, J.M.; Higgins, S.P.; Samarakoon, R.; Higgins, P.J. PAI-1 Regulates the Invasive Phenotype in Human Cutaneous Squamous Cell Carcinoma. J. Oncol. 2009, 2009, 963209. [Google Scholar] [CrossRef]
- Andreasen, P.A.; Kjoller, L.; Christensen, L.; Duffy, M.J. The urokinase-type plasminogen activator system in cancer metastasis: A review. Int. J. Cancer 1997, 72, 1–22. [Google Scholar] [CrossRef]
- Hsu, J.B.; Chang, T.; Lee, G.A.; Lee, T.; Chen, C. Identification of potential biomarkers related to glioma survival by gene expression profile analysis. BMC Med. Genomics 2019, 11, 1–18. [Google Scholar] [CrossRef]
- Patil, V.; Mahalingam, K. Comprehensive analysis of Reverse Phase Protein Array data reveals characteristic unique proteomic signatures for glioblastoma subtypes. Gene 2019, 685, 85–95. [Google Scholar] [CrossRef]
- Providence, K.M.; Kutz, S.M.; Staiano-Coico, L.; Higgins, P.J. PAI-1 gene expression is regionally induced in wounded epithelial cell monolayers and required for injury repair. J. Cell. Physiol. 2000, 182, 269–280. [Google Scholar] [CrossRef]
- Providence, K.M.; White, L.A.; Tang, J.; Gonclaves, J.; Staiano-Coico, L.; Higgins, P.J. Epithelial monolayer wounding stimulates binding of USF-1 to an E-box motif in the plasminogen activator inhibitor type 1 gene. J. Cell Sci. 2002, 115, 3767–3777. [Google Scholar] [CrossRef] [PubMed]
- Providence, K.M.; Higgins, P.J. PAI-1 expression is required for epithelial cell migration in two distinct phases of in vitro wound repair. J. Cell. Physiol. 2004, 200, 297–308. [Google Scholar] [CrossRef] [PubMed]
- Wilkins-port, C.E.; Freytag, J.; Higgins, S.P.; Higgins, P.J. PAI-1: A Multifunctional seRpIn with complex Roles in cell signaling and Migration. Cell Commun. Insights 2010, 1–10. [Google Scholar] [CrossRef]
- Wakimoto, H.; Tanaka, S.; Curry, W.T.; Loebel, F.; Zhao, D.; Tateishi, K.; Chen, J.; Klofas, L.K.; Lelic, N.; Kim, J.C.; et al. Targetable signaling pathway mutations are associated with malignant phenotype in IDH-mutant gliomas. Clin. Cancer Res. 2014, 20, 2898–2909. [Google Scholar] [CrossRef]
- Li, H.; Handsaker, B.; Wysoker, A.; Fennell, T.; Ruan, J.; Homer, N.; Marth, G.; Abecasis, G.; Durbin, R.; 1000 Genome Project Data Processing Subgroup. The Sequence Alignment/Map format and SAMtools. Bioinformatics 2009, 25, 2078–2079. [Google Scholar] [CrossRef]
- Wu, D.M.; Wang, S.; Wen, X.; Han, X.R.; Wang, Y.J.; Fan, S.H.; Zhang, Z.F.; Shan, Q.; Lu, J.; Zheng, Y.L. MircoRNA-1275 promotes proliferation, invasion and migration of glioma cells via SERPINE1. J. Cell. Mol. Med. 2018, 4963–4974. [Google Scholar] [CrossRef]
- Codó, P.; Weller, M.; Kaulich, K.; Schraivogel, D.; Silginer, M.; Reifenberger, G.; Meister, G.; Roth, P. Control of glioma cell migration and invasiveness by GDF-15. Oncotarget 2016, 7, 7732. [Google Scholar] [CrossRef]
- Maziveyi, M.; Alahari, S.K. Cell matrix adhesions in cancer: the proteins that form the glue. Oncotarget 2017, 8, 48471–48487. [Google Scholar] [CrossRef]
- Arroyo De Prada, N.; Schroeck, F.; Sinner, E.K.; Muehlenweg, B.; Twellmeyer, J.; Sperl, S.; Wilhelm, O.G.; Schmitt, M.; Magdolen, V. Interaction of plasminogen activator inhibitor type-1 (PAI-1) with vitronectin. Eur. J. Biochem. 2002, 269, 184–192. [Google Scholar] [CrossRef]
- Akkawi, S.; Nassar, T.; Tarshis, M.; Cines, D.B.; Higazi, A.A.-R. LRP and alphavbeta3 mediate tPA activation of smooth muscle cells. Am. J. Physiol. Heart Circ. Physiol. 2006, 291, H1351–H1359. [Google Scholar] [CrossRef]
- Czekay, R.P.; Loskutoff, D.J. Plasminogen activator inhibitors regulate cell adhesion through a uPAR-dependent mechanism. J. Cell. Physiol. 2009, 220, 655–663. [Google Scholar] [CrossRef] [PubMed]
- Fink, T.; Kazlauskas, A.; Poellinger, L.; Ebbesen, P.; Zachar, V. Identification of a tightly regulated hypoxia-response element in the promoter of human plasminogen activator inhibitor-1. Blood 2002, 99, 2077–2083. [Google Scholar] [CrossRef] [PubMed]
- Pavón, M.A.; Arroyo-Solera, I.; Cespedes, M.V.; Casanova, I.; Leon, X.; Mangues, R. uPA/uPAR and SERPINE1 in head and neck cancer: Role in tumor resistance, metastasis, prognosis and therapy. Oncotarget 2016, 7, 57351–57366. [Google Scholar] [CrossRef] [PubMed]
- Wild-bode, C.; Weller, M.; Rimner, A.; Dichgans, J.; Wick, W. Sublethal Irradiation Promotes Migration and Invasiveness of Glioma Cells: Implications for Radiotherapy of Human Glioblastoma. Cancer Res. 2001, 61, 2744–2750. [Google Scholar]
- de Gooijer, M.C.; Guillén Navarro, M.; Bernards, R.; Wurdinger, T.; van Tellingen, O. An Experimenter’s Guide to Glioblastoma Invasion Pathways. Trends Mol. Med. 2018, 24, 763–780. [Google Scholar] [CrossRef]
- Levin, V.A.; Phuphanich, S.; Yung, W.K.A.; Forsyth, P.A.; Del Maestro, R.; Perry, J.R.; Fuller, G.N.; Baillet, M. Randomized, double-blind, placebo-controlled trial of marimastat in glioblastoma multiforme patients following surgery and irradiation. J. Neurooncol. 2006, 78, 295–302. [Google Scholar] [CrossRef]
- Stupp, R.; Hegi, M.E.; Gorlia, T.; Erridge, S.C.; Perry, J.; Hong, Y.K.; Aldape, K.D.; Lhermitte, B.; Pietsch, T.; Grujicic, D.; et al. Cilengitide combined with standard treatment for patients with newly diagnosed glioblastoma with methylated MGMT promoter (CENTRIC EORTC 26071-22072 study): A multicentre, randomised, open-label, phase 3 trial. Lancet Oncol. 2014, 15, 1100–1108. [Google Scholar] [CrossRef]
- Kim, D.; Langmead, B.; Salzberg, S.L. HISAT: A fast spliced aligner with low memory requirements. Nat. Methods 2016, 12, 357–360. [Google Scholar] [CrossRef]
- Liao, Y.; Smyth, G.K.; Shi, W. FeatureCounts: An efficient general purpose program for assigning sequence reads to genomic features. Bioinformatics 2014, 30, 923–930. [Google Scholar] [CrossRef]
- Love, M.I.; Huber, W.; Anders, S. Moderated estimation of fold change and dispersion for RNA-seq data with DESeq2. Genome Biol. 2014, 15, 1–21. [Google Scholar] [CrossRef]
- Krämer, A.; Green, J.; Pollard, J.; Tugendreich, S. Causal analysis approaches in ingenuity pathway analysis. Bioinformatics 2014, 30, 523–530. [Google Scholar] [CrossRef] [PubMed]
- Mootha, V.K.; Lindgren, C.M.; Eriksson, K.F.; Subramanian, A.; Sihag, S.; Lehar, J.; Puigserver, P.; Carlsson, E.; Ridderstrale, M.; Laurila, E.; et al. PGC-1-α responsive genes involved in oxidative phosphorylation are corrdinately downregulated in human diabetes. Nat. Genet. 2003, 34, 267–273. [Google Scholar] [CrossRef] [PubMed]
- Senbabaoglu, F.; Cingoz, A.; Kaya, E.; Kazancioglu, S.; Lack, N.A.; Acilan, C.; Bagci-Onder, T. Identification of Mitoxantrone as a TRAIL-sensitizing agent for Glioblastoma Multiforme. Cancer Biol. Ther. 2016, 17, 546–557. [Google Scholar] [CrossRef] [PubMed]
- Olson, A.; Sheth, N.; Lee, J.S.; Hannon, G.; Sachidanandam, R. RNAi Codex: A portal/database for short-hairpin RNA (shRNA) gene-silencing constructs. Nucleic Acids Res. 2006, 34, D153–D157. [Google Scholar] [CrossRef] [PubMed]
- Onder, T.T.; Kara, N.; Cherry, A.; Sinha, A.U.; Zhu, N.; Bernt, K.M.; Cahan, P.; Marcarci, B.O.; Unternaehrer, J.; Gupta, P.B.; et al. Chromatin-modifying enzymes as modulators of reprogramming. Nature 2012, 483, 598–602. [Google Scholar] [CrossRef]
- Bagci-Onder, T.; Agarwal, A.; Flusberg, D.; Wanningen, S.; Sorger, P.; Shah, K. Real-time imaging of the dynamics of death receptors and therapeutics that overcome TRAIL resistance in tumors. Oncogene 2012, 32, 2818–2827. [Google Scholar] [CrossRef] [PubMed]
- Weng, Y.; Sui, Z.; Shan, Y.; Jiang, H.; Zhou, Y.; Zhu, X.; Liang, Z.; Zhang, L.; Zhang, Y. In-Depth Proteomic Quantification of Cell Secretome in Serum-Containing Conditioned Medium. Anal. Chem. 2016, 88, 4971–4978. [Google Scholar] [CrossRef]
- Aydin, O.; Aksoy, B.; Akalin, O.B.; Bayraktar, H.; Alaca, B.E. Time-resolved local strain tracking microscopy for cell mechanics. Rev. Sci. Instrum. 2016, 87, 023905. [Google Scholar] [CrossRef]
- Ii, S.; Iv, S. Methods of Digital Video Microscopy for Colloidal Studies. J. Colloid Interface Sci. 1996, 310, 298–310. [Google Scholar]
- Bagci-Onder, T.; Wakimoto, H.; Anderegg, M.; Cameron, C.; Shah, K. A dual PI3K/mTOR inhibitor, PI-103, cooperates with stem cell-delivered TRAIL in experimental glioma models. Cancer Res. 2011, 71, 154–163. [Google Scholar] [CrossRef]
- Onder, T.T.; Gupta, P.B.; Mani, S.A.; Yang, J.; Lander, E.S.; Weinberg, R.A. Loss of E-cadherin promotes metastasis via multiple downstream transcriptional pathways. Cancer Res. 2008, 68, 3645–3654. [Google Scholar] [CrossRef] [PubMed]


© 2019 by the authors. Licensee MDPI, Basel, Switzerland. This article is an open access article distributed under the terms and conditions of the Creative Commons Attribution (CC BY) license (http://creativecommons.org/licenses/by/4.0/).
Share and Cite
Seker, F.; Cingoz, A.; Sur-Erdem, İ.; Erguder, N.; Erkent, A.; Uyulur, F.; Esai Selvan, M.; Gümüş, Z.H.; Gönen, M.; Bayraktar, H.; et al. Identification of SERPINE1 as a Regulator of Glioblastoma Cell Dispersal with Transcriptome Profiling. Cancers 2019, 11, 1651. https://doi.org/10.3390/cancers11111651
Seker F, Cingoz A, Sur-Erdem İ, Erguder N, Erkent A, Uyulur F, Esai Selvan M, Gümüş ZH, Gönen M, Bayraktar H, et al. Identification of SERPINE1 as a Regulator of Glioblastoma Cell Dispersal with Transcriptome Profiling. Cancers. 2019; 11(11):1651. https://doi.org/10.3390/cancers11111651
Chicago/Turabian StyleSeker, Fidan, Ahmet Cingoz, İlknur Sur-Erdem, Nazli Erguder, Alp Erkent, Fırat Uyulur, Myvizhi Esai Selvan, Zeynep Hülya Gümüş, Mehmet Gönen, Halil Bayraktar, and et al. 2019. "Identification of SERPINE1 as a Regulator of Glioblastoma Cell Dispersal with Transcriptome Profiling" Cancers 11, no. 11: 1651. https://doi.org/10.3390/cancers11111651
APA StyleSeker, F., Cingoz, A., Sur-Erdem, İ., Erguder, N., Erkent, A., Uyulur, F., Esai Selvan, M., Gümüş, Z. H., Gönen, M., Bayraktar, H., Wakimoto, H., & Bagci-Onder, T. (2019). Identification of SERPINE1 as a Regulator of Glioblastoma Cell Dispersal with Transcriptome Profiling. Cancers, 11(11), 1651. https://doi.org/10.3390/cancers11111651