A Toolbox for Functional Analysis and the Systematic Identification of Diagnostic and Prognostic Gene Expression Signatures Combining Meta-Analysis and Machine Learning

 , ,
, , 
Abstract
1. Introduction
2. Results
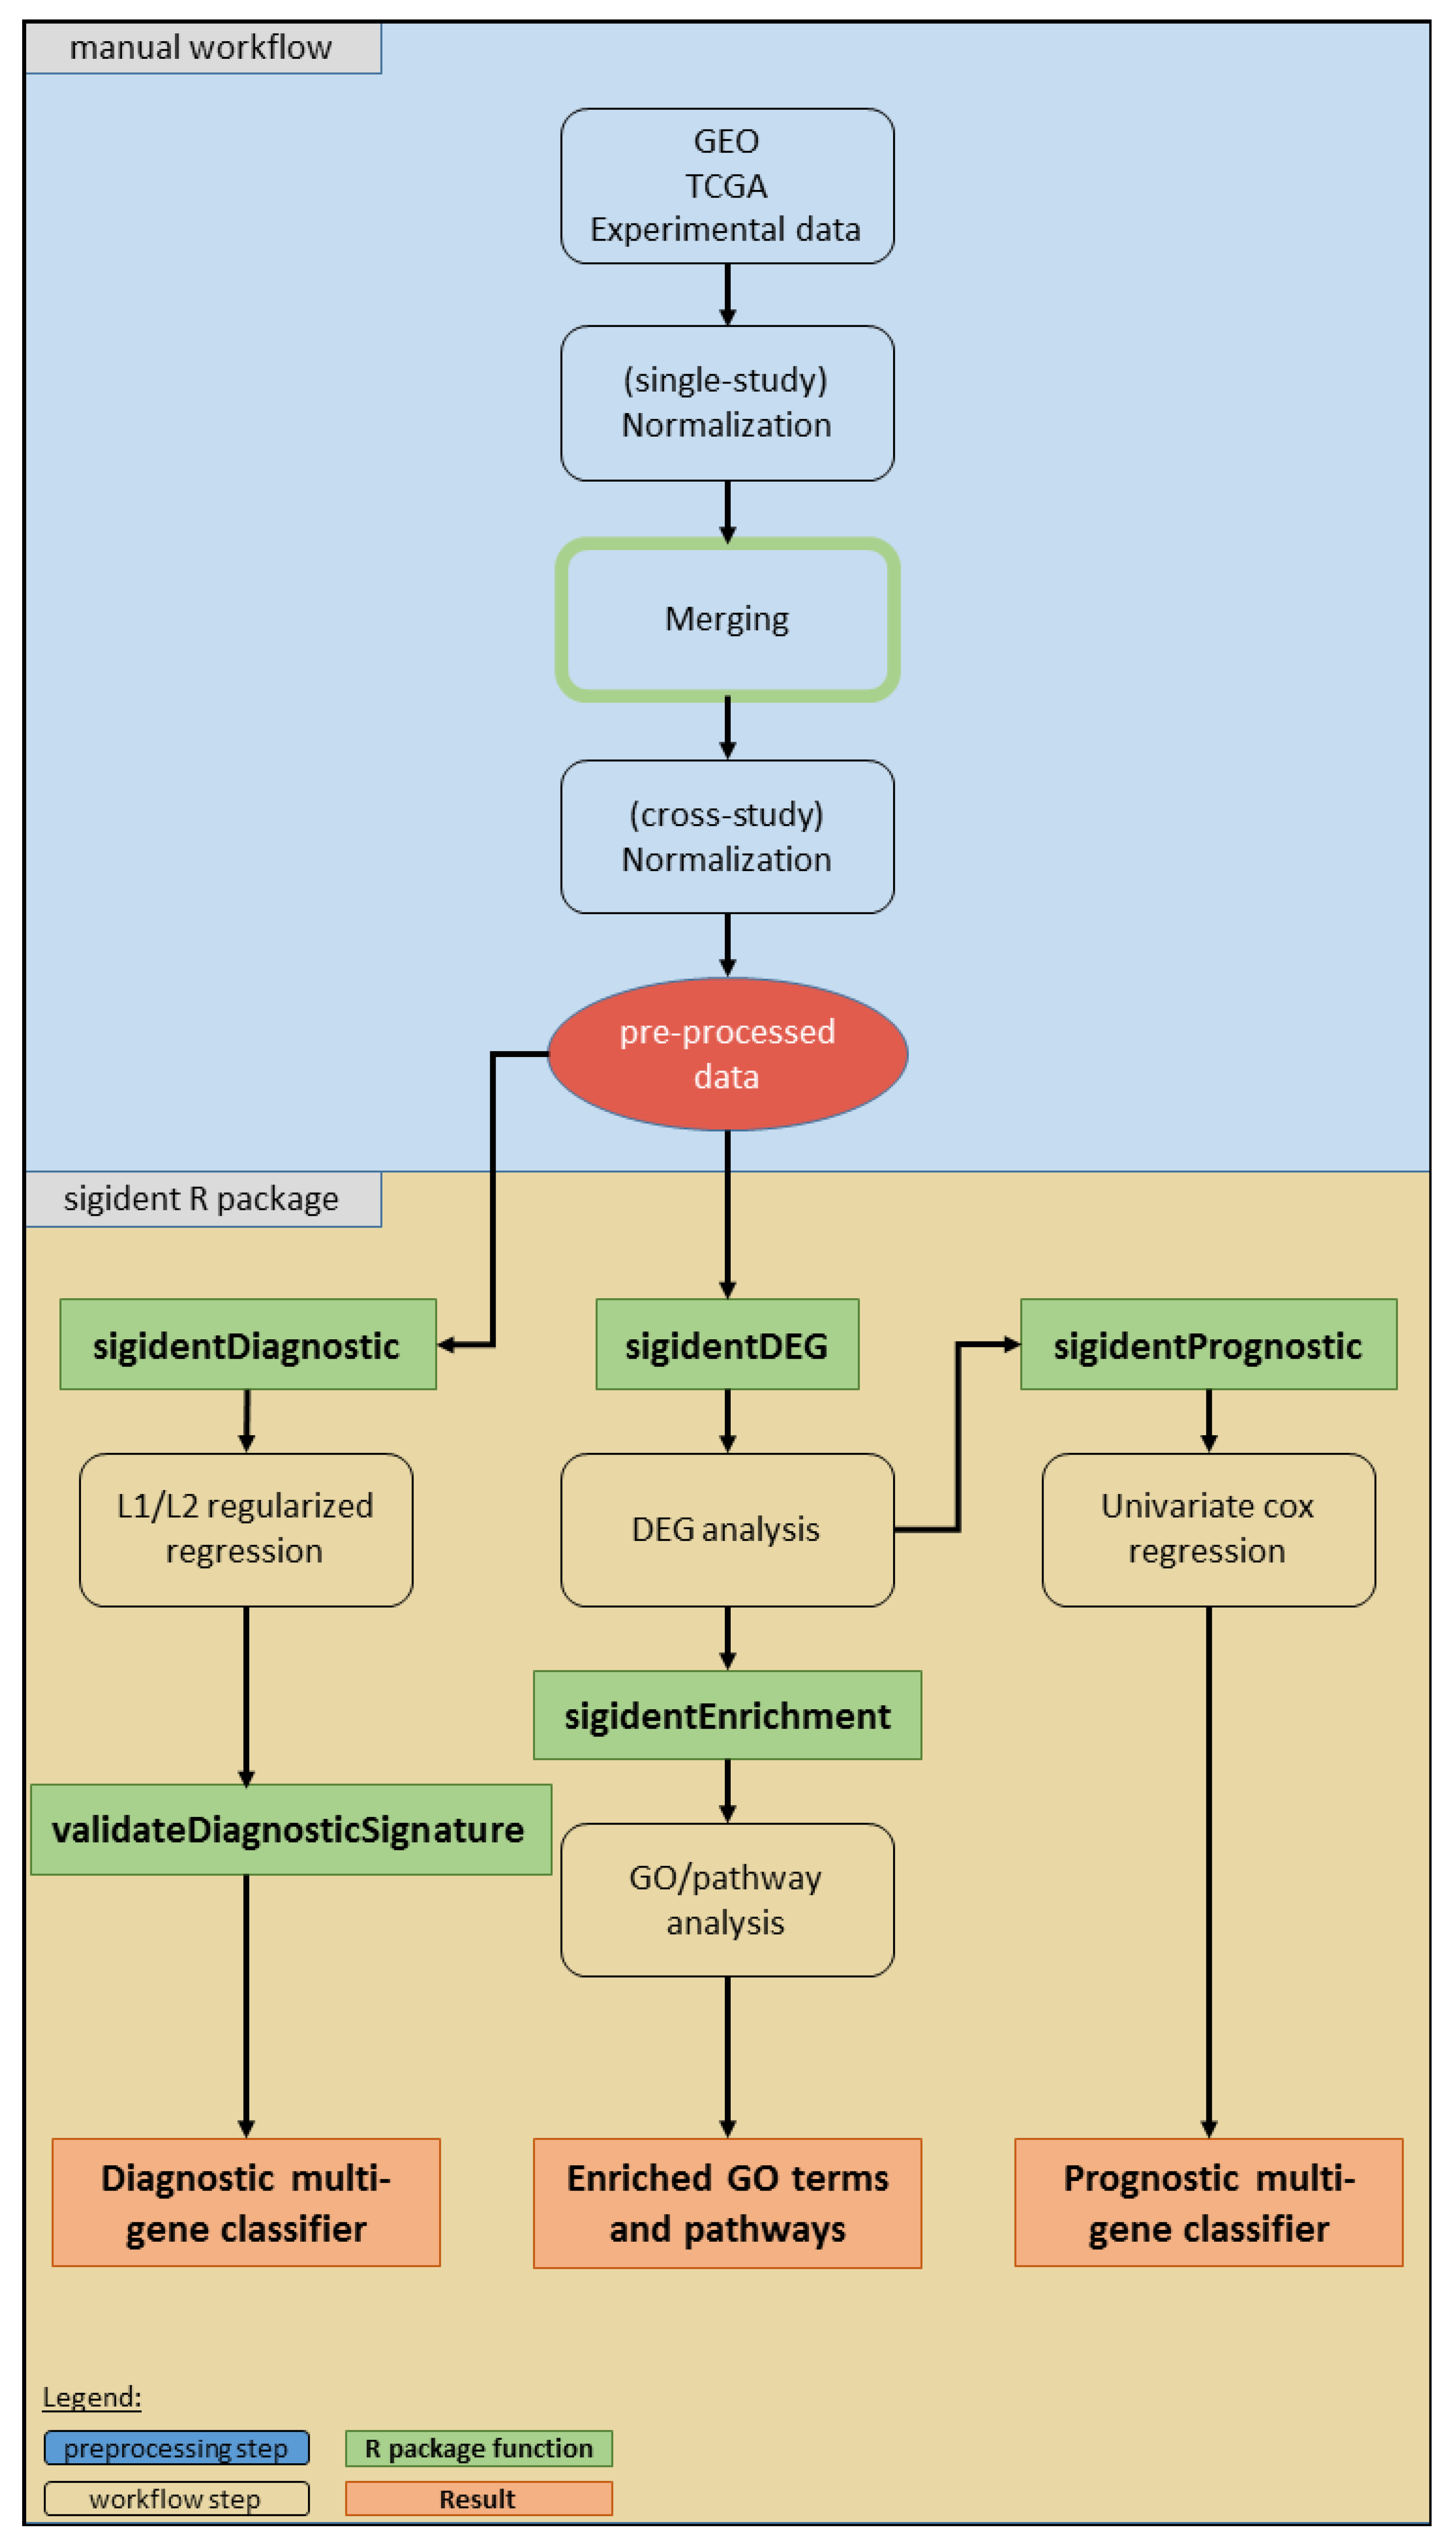
2.1. Meta-Analysis (Dataset Download, Normalization, Merging, Batch Effect Correction)
2.2. Functional Gene Expression Analysis
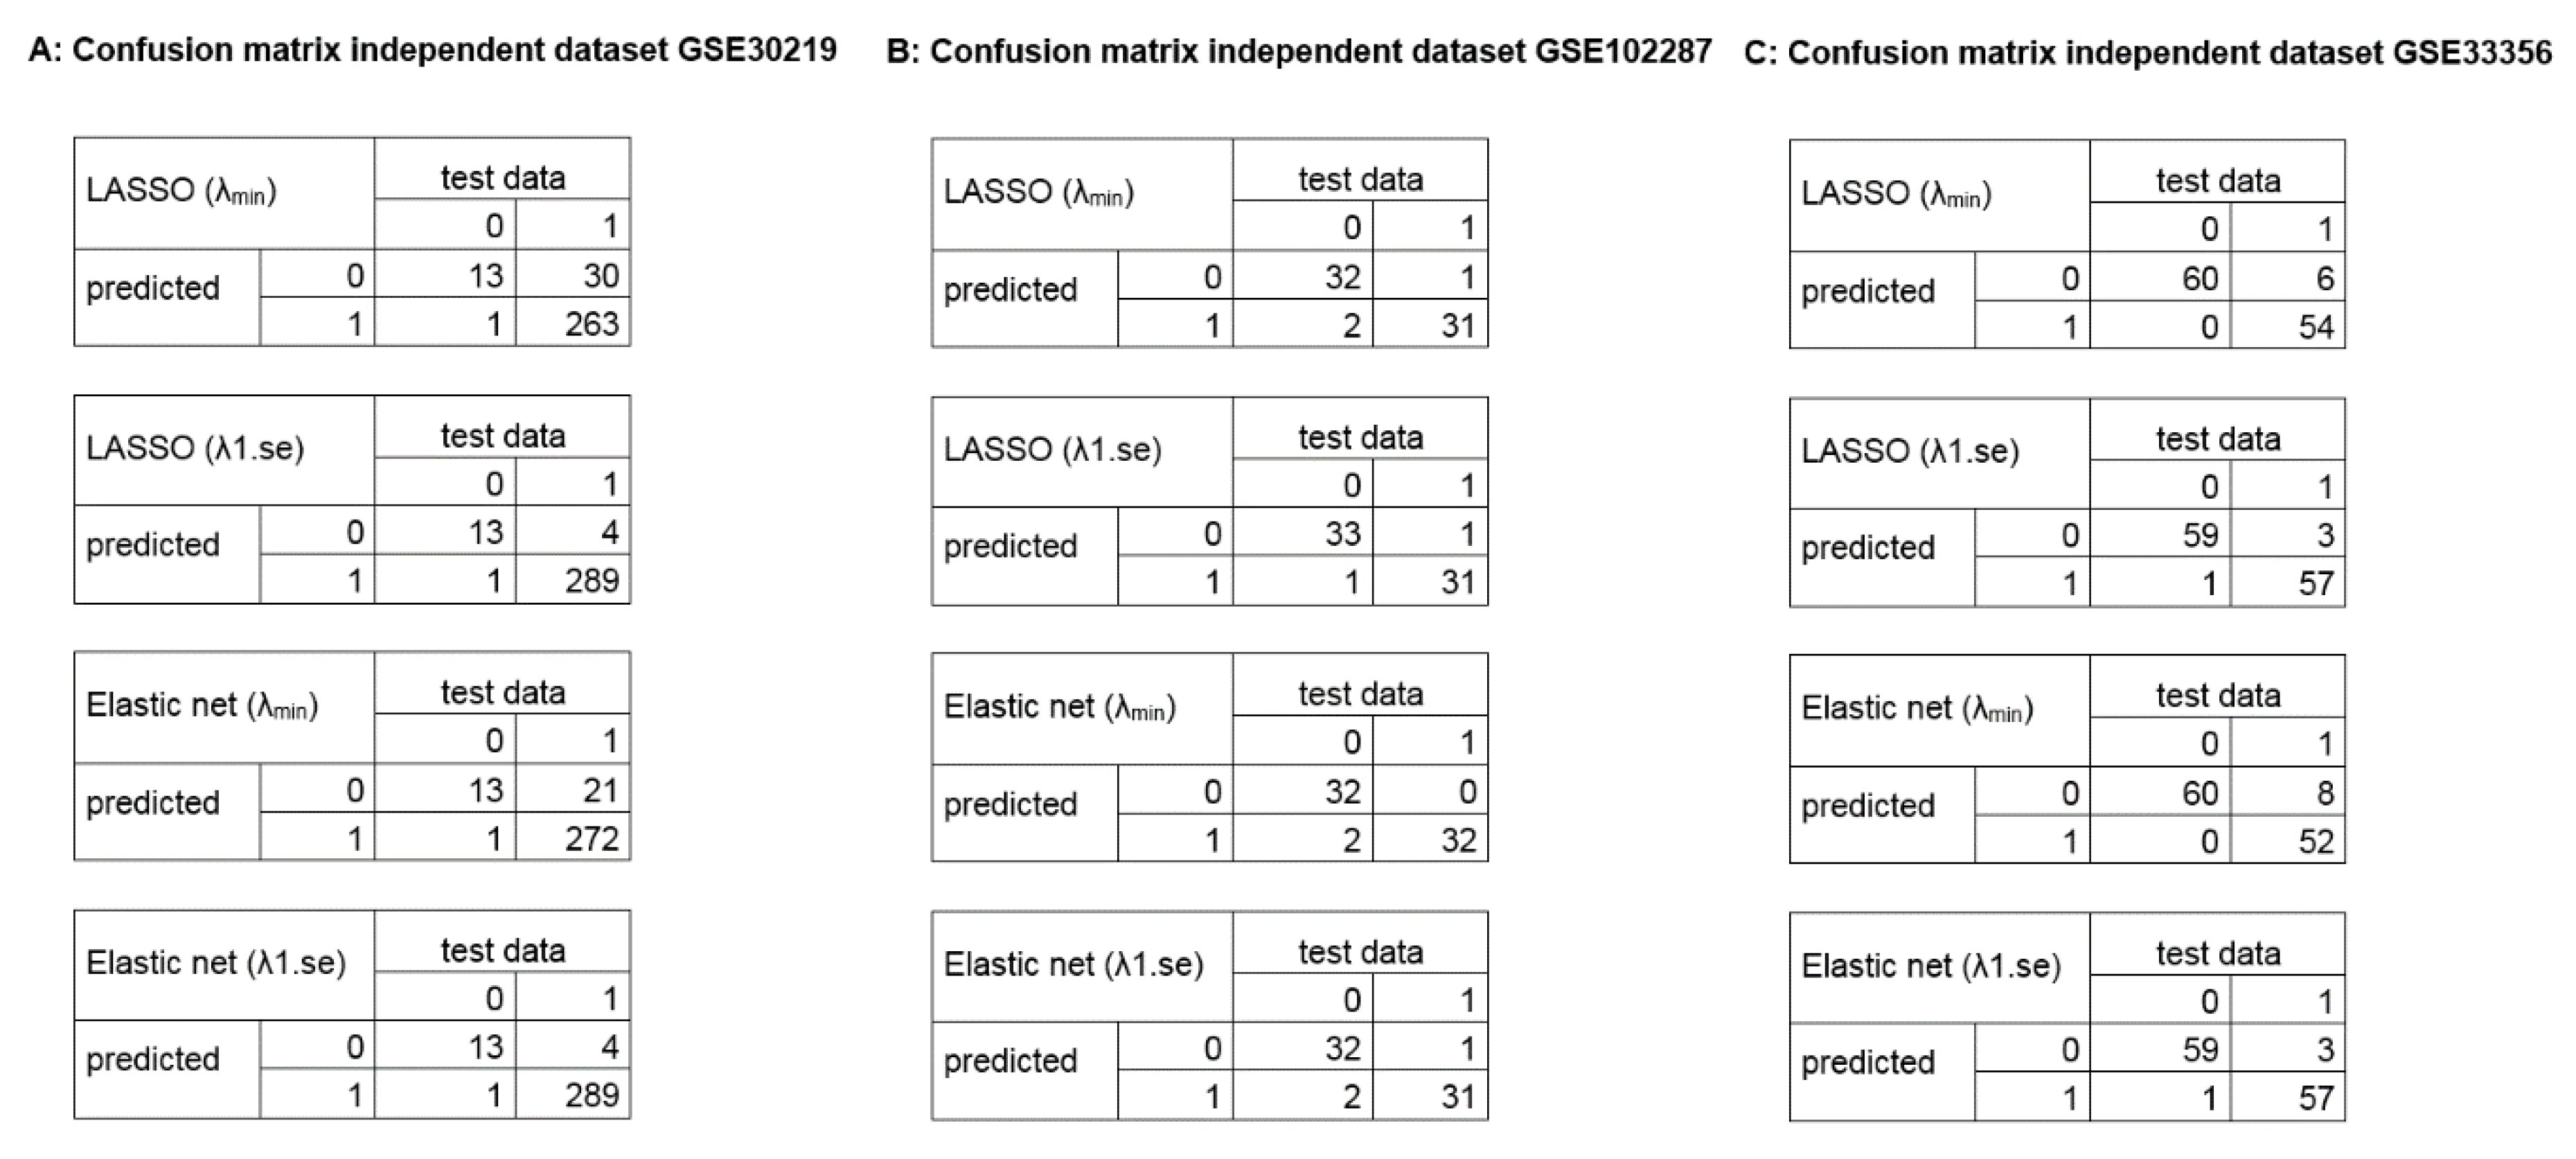
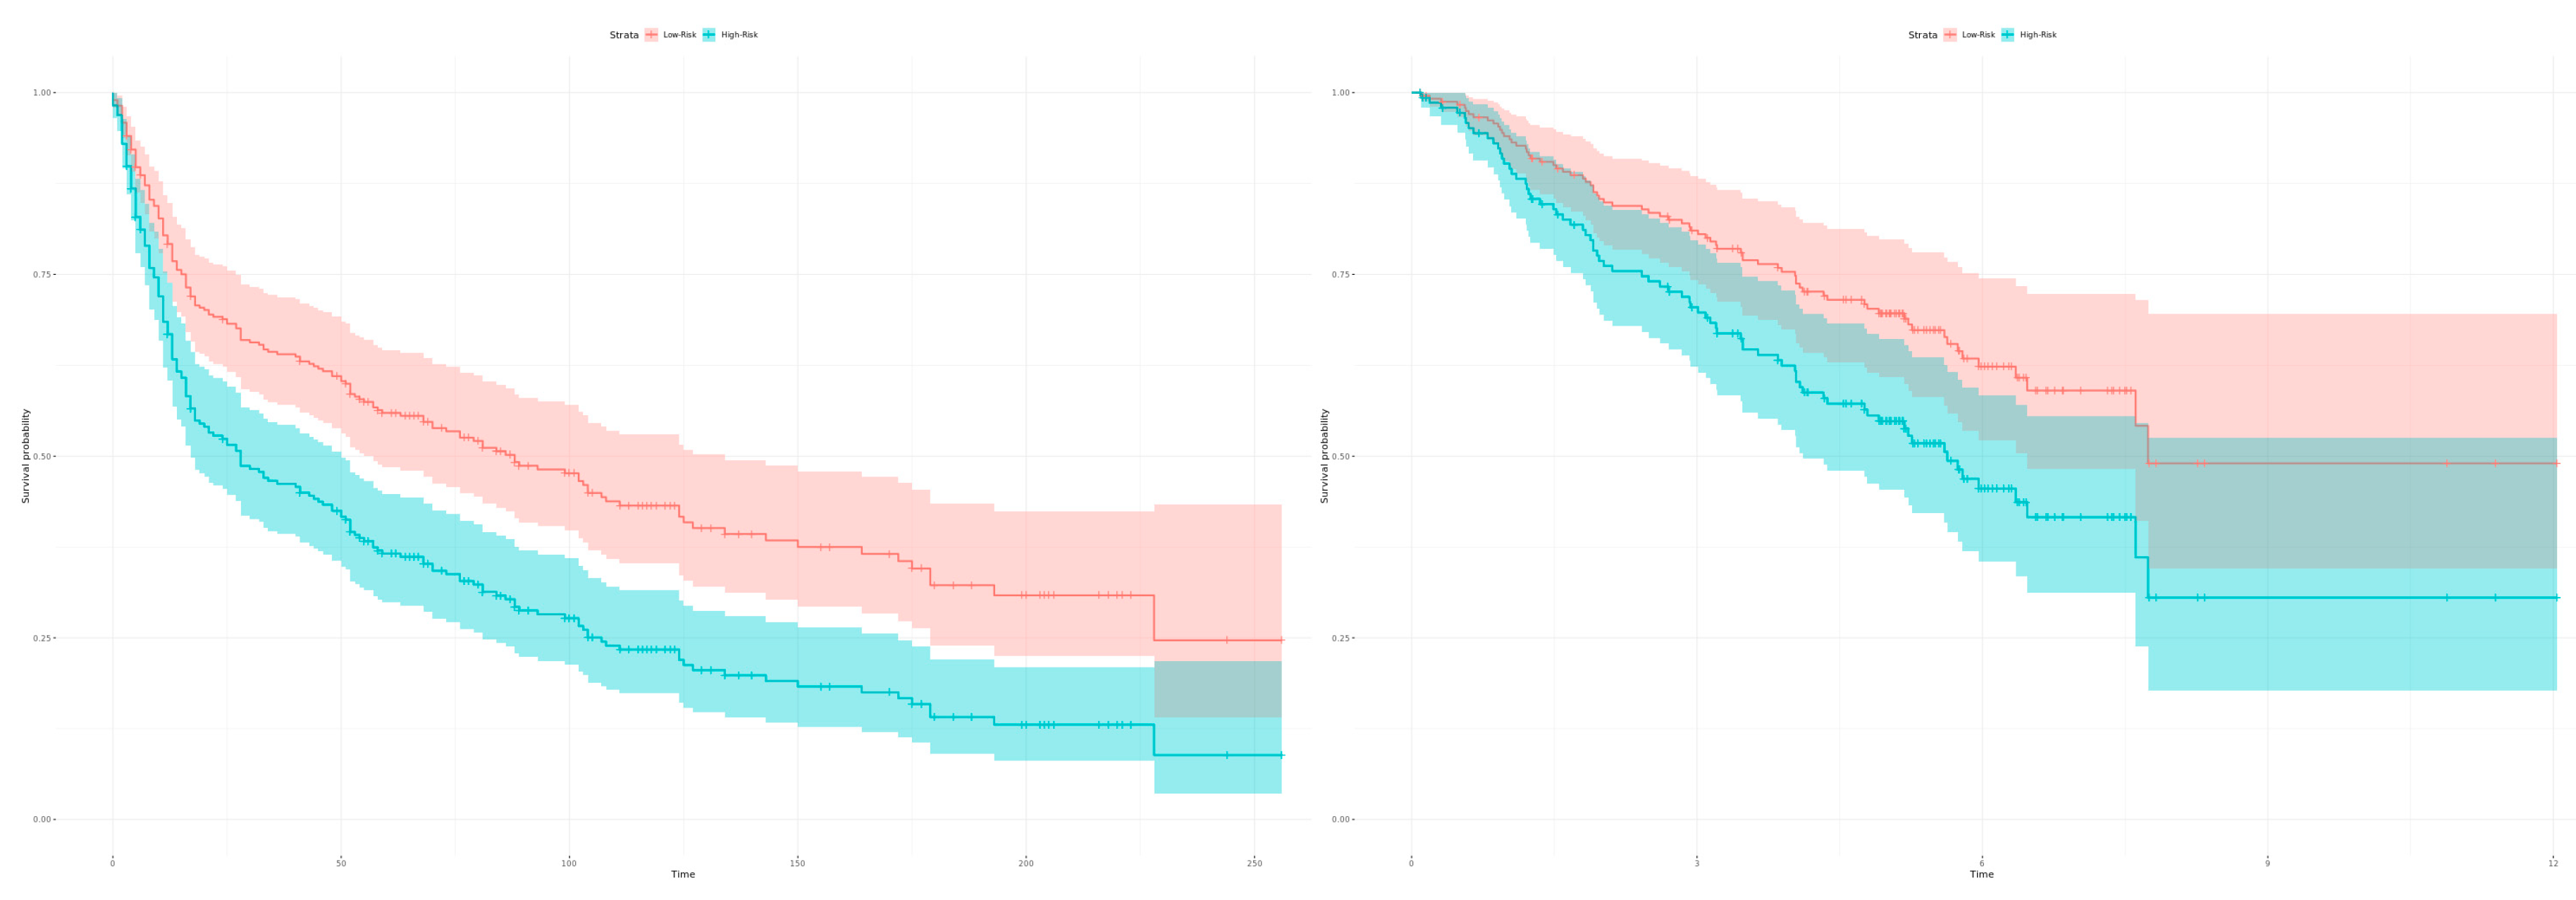
2.3. Calculation of Diagnostic and Prognostic Signatures
3. Discussion
4. Materials and Methods
5. Conclusions
Supplementary Materials
Data Availability
Author Contributions
Funding
Acknowledgments
Conflicts of Interest
References
- Borrebaeck, C.A.K. Precision diagnostics: Moving towards protein biomarker signatures of clinical utility in cancer. Nat. Rev. Cancer 2017, 17, 199–204. [Google Scholar] [CrossRef] [PubMed]
- Kunz, M.; Wolf, B.; Schulze, H.; Atlan, D.; Walles, T.; Walles, H.; Dandekar, T. Non-coding rnas in lung cancer: Contribution of bioinformatics analysis to the development of non-invasive diagnostic tools. Genes 2016, 8, 8. [Google Scholar] [CrossRef] [PubMed]
- Aguirre-Gamboa, R.; Trevino, V. Survmicro: Assessment of miRNA-based prognostic signatures for cancer clinical outcomes by multivariate survival analysis. Bioinformatics 2014, 30, 1630–1632. [Google Scholar] [CrossRef] [PubMed][Green Version]
- Cusumano, P.G.; Generali, D.; Ciruelos, E.; Manso, L.; Ghanem, I.; Lifrange, E.; Jerusalem, G.; Klaase, J.; de Snoo, F.; Stork-Sloots, L.; et al. European inter-institutional impact study of mammaprint. Breast 2014, 23, 423–428. [Google Scholar] [CrossRef]
- Montani, F.; Marzi, M.J.; Dezi, F.; Dama, E.; Carletti, R.M.; Bonizzi, G.; Bertolotti, R.; Bellomi, M.; Rampinelli, C.; Maisonneuve, P.; et al. miR-test: A blood test for lung cancer early detection. J. Natl. Cancer Inst. 2015, 107. [Google Scholar] [CrossRef]
- Taminau, J.; Lazar, C.; Meganck, S.; Nowé, A. Comparison of merging and meta-analysis as alternative approaches for integrative gene expression analysis. ISRN Bioinform. 2014, 2014, 345601. [Google Scholar] [CrossRef]
- Xu, L.; Tan, A.C.; Winslow, R.L.; Geman, D. Merging microarray data from separate breast cancer studies provides a robust prognostic test. BMC Bioinform. 2008, 9, 125. [Google Scholar] [CrossRef]
- Hughey, J.J.; Butte, A.J. Robust meta-analysis of gene expression using the elastic net. Nucleic Acids Res. 2015, 43, e79. [Google Scholar] [CrossRef]
- Ramasamy, A.; Mondry, A.; Holmes, C.C.; Altman, D.G. Key issues in conducting a meta-analysis of gene expression microarray datasets. PLoS Med. 2008, 5, e184. [Google Scholar] [CrossRef]
- Tseng, G.C.; Ghosh, D.; Feingold, E. Comprehensive literature review and statistical considerations for microarray meta-analysis. Nucleic Acids Res. 2012, 40, 3785–3799. [Google Scholar] [CrossRef]
- Heider, A.; Alt, R. virtuAlarray: A R/Bioconductor package to merge raw data from different microarray platforms. BMC Bioinform. 2013, 14, 75. [Google Scholar] [CrossRef] [PubMed]
- Taminau, J.; Meganck, S.; Lazar, C.; Steenhoff, D.; Coletta, A.; Molter, C.; Duque, R.; de Schaetzen, V.; Weiss Solis, D.Y.; Bersini, H.; et al. Unlocking the potential of publicly available microarray data using inSilicoDb and inSilicoMerging R/Bioconductor packages. BMC Bioinform. 2012, 13, 335. [Google Scholar] [CrossRef] [PubMed]
- Huber, W.; Carey, V.J.; Gentleman, R.; Anders, S.; Carlson, M.; Carvalho, B.S.; Bravo, H.C.; Davis, S.; Gatto, L.; Girke, T.; et al. Orchestrating high-throughput genomic analysis with bioconductor. Nat. Methods 2015, 12, 115–121. [Google Scholar] [CrossRef] [PubMed]
- Aguirre-Gamboa, R.; Gomez-Rueda, H.; Martínez-Ledesma, E.; Martínez-Torteya, A.; Chacolla-Huaringa, R.; Rodriguez-Barrientos, A.; Tamez-Peña, J.G.; Treviño, V. Survexpress: An online biomarker validation tool and database for cancer gene expression data using survival analysis. PLoS ONE 2013, 8, e74250. [Google Scholar] [CrossRef] [PubMed]
- Lanczky, A.; Nagy, A.; Bottai, G.; Munkacsy, G.; Szabo, A.; Santarpia, L.; Gyorffy, B. miRpower: A web-tool to validate survival-associated miRNAs utilizing expression data from 2178 breast cancer patients. Breast Cancer Res. Treat. 2016, 160, 439–446. [Google Scholar] [CrossRef]
- Ringner, M.; Fredlund, E.; Hakkinen, J.; Borg, A.; Staaf, J. Gobo: Gene expression-based outcome for breast cancer online. PLoS ONE 2011, 6, e17911. [Google Scholar] [CrossRef]
- Gyorffy, B.; Lanczky, A.; Szallasi, Z. Implementing an online tool for genome-wide validation of survival-associated biomarkers in ovarian-cancer using microarray data from 1287 patients. Endocr. Relat. Cancer 2012, 19, 197–208. [Google Scholar] [CrossRef]
- Schweitzer, S.; Kunz, M.; Kurlbaum, M.; Vey, J.; Kendl, S.; Deutschbein, T.; Hahner, S.; Fassnacht, M.; Dandekar, T.; Kroiss, M. Plasma steroid metabolome profiling for the diagnosis of adrenocortical carcinoma. Eur. J. Endocrinol. 2019, 180, 117–125. [Google Scholar] [CrossRef]
- Beck, A.H.; Sangoi, A.R.; Leung, S.; Marinelli, R.J.; Nielsen, T.O.; van de Vijver, M.J.; West, R.B.; van de Rijn, M.; Koller, D. Systematic analysis of breast cancer morphology uncovers stromal features associated with survival. Sci. Transl. Med. 2011, 3, 108ra113. [Google Scholar] [CrossRef]
- Huang, C.; Mezencev, R.; McDonald, J.F.; Vannberg, F. Open source machine-learning algorithms for the prediction of optimal cancer drug therapies. PLoS ONE 2017, 12, e0186906. [Google Scholar] [CrossRef]
- Mortazavi, B.J.; Downing, N.S.; Bucholz, E.M.; Dharmarajan, K.; Manhapra, A.; Li, S.X.; Negahban, S.N.; Krumholz, H.M. Analysis of machine learning techniques for heart failure readmissions. Circulation. Cardiovasc. Qual. Outcomes 2016, 9, 629–640. [Google Scholar] [CrossRef] [PubMed]
- Tibshirani, R. Regression shrinkage and selection via the lasso. J. R. Stat. Soc. Ser. B 1996, 58, 267–288. [Google Scholar] [CrossRef]
- Zou, H.; Hastie, T. Regularization and variable selection via the elastic net. J. R. Statist. Soc. B 2005, 67, 301–320. [Google Scholar] [CrossRef]
- Bradburn, M.J.; Clark, T.G.; Love, S.B.; Altman, D.G. Survival analysis part II: Multivariate data analysis—An introduction to concepts and methods. Br. J. Cancer 2003, 89, 431–436. [Google Scholar] [CrossRef] [PubMed]
- Clark, T.G.; Bradburn, M.J.; Love, S.B.; Altman, D.G. Survival analysis part I: Basic concepts and first analyses. Br. J. Cancer 2003, 89, 232–238. [Google Scholar] [CrossRef]
- Cox, D.R. Regression models and life-tables. J. R. Stat. Society. Ser. B 1972, 34, 187–220. [Google Scholar] [CrossRef]
- Kunz, M.; Pittroff, A.; Dandekar, T. Systems biology analysis to understand regulatory miRNA networks in lung cancer. In Computational Cell Biology; Humana Press: New York, NY, USA, 2018; pp. 235–247. [Google Scholar]
- Wu, J.; Gentry, R. Gcrma: Background Adjustment Using Sequence Information. Available online: https://bioc.ism.ac.jp/packages/3.7/bioc/html/gcrma.html (accessed on 27 September 2019).
- Conesa, A.; Madrigal, P.; Tarazona, S.; Gomez-Cabrero, D.; Cervera, A.; McPherson, A.; Szcześniak, M.W.; Gaffney, D.J.; Elo, L.L.; Zhang, X.; et al. A survey of best practices for RNA-seq data analysis. Genome Biol. 2016, 17, 13. [Google Scholar] [CrossRef]
- Jiang, L.-P.; Fan, S.-Q.; Xiong, Q.-X.; Zhou, Y.-C.; Yang, Z.-Z.; Li, G.-F.; Huang, Y.-C.; Wu, M.-G.; Shen, Q.-S.; Liu, K.; et al. Grk5 functions as an oncogenic factor in non-small-cell lung cancer. Cell Death Dis. 2018, 9, 295. [Google Scholar] [CrossRef]
- Kim, K.Y.; Lee, G.; Yoon, M.; Cho, E.H.; Park, C.-S.; Kim, M.G. Expression analyses revealed thymic stromal co-transporter/Slc46A2 is in stem cell populations and is a putative tumor suppressor. Mol. Cells 2015, 38, 548–561. [Google Scholar] [CrossRef]
- Shen, L.; Yang, M.; Lin, Q.; Zhang, Z.; Zhu, B.; Miao, C. COL11A1 is overexpressed in recurrent non-small cell lung cancer and promotes cell proliferation, migration, invasion and drug resistance. Oncol. Rep. 2016, 36, 877–885. [Google Scholar] [CrossRef]
- Trost, Z.; Sok, M.; Marc, J.; Cerne, D. Increased lipoprotein lipase activity in non-small cell lung cancer tissue predicts shorter patient survival. Arch. Med Res. 2009, 40, 364–368. [Google Scholar] [CrossRef] [PubMed]
- Li, L.; Liu, Y.D.; Zhan, Y.T.; Zhu, Y.H.; Li, Y.; Xie, D.; Guan, X.Y. High levels of CCL2 or CCL4 in the tumor microenvironment predict unfavorable survival in lung adenocarcinoma. Thorac. Cancer 2018, 9, 775–784. [Google Scholar] [CrossRef] [PubMed]
- Chen, T.; Guestrin, C. Xgboost: A scalable tree boosting system. In Proceedings of the 22nd Acm Sigkdd International Conference on Knowledge Discovery and Data Mining, San Francisco, CA, USA, 13–17 August 2016; pp. 785–794. [Google Scholar]
- Chibon, F. Cancer gene expression signatures—The rise and fall? Eur. J. Cancer 2013, 49, 2000–2009. [Google Scholar] [CrossRef] [PubMed]
- Ching, T.; Huang, S.; Garmire, L.X. Power analysis and sample size estimation for RNA-seq differential expression. Rna 2014, 20, 1684–1696. [Google Scholar] [CrossRef]
- Wirapati, P.; Sotiriou, C.; Kunkel, S.; Farmer, P.; Pradervand, S.; Haibe-Kains, B.; Desmedt, C.; Ignatiadis, M.; Sengstag, T.; Schutz, F.; et al. Meta-analysis of gene expression profiles in breast cancer: Toward a unified understanding of breast cancer subtyping and prognosis signatures. Breast Cancer Res. 2008, 10, R65. [Google Scholar] [CrossRef]
- Chen, R.; Khatri, P.; Mazur, P.K.; Polin, M.; Zheng, Y.; Vaka, D.; Hoang, C.D.; Shrager, J.; Xu, Y.; Vicent, S.; et al. A meta-analysis of lung cancer gene expression identifies PTK7 as a survival gene in lung adenocarcinoma. Cancer Res. 2014, 74, 2892–2902. [Google Scholar] [CrossRef]
- Sorlie, T.; Tibshirani, R.; Parker, J.; Hastie, T.; Marron, J.S.; Nobel, A.; Deng, S.; Johnsen, H.; Pesich, R.; Geisler, S.; et al. Repeated observation of breast tumor subtypes in independent gene expression data sets. Proc. Natl. Acad. Sci. USA 2003, 100, 8418–8423. [Google Scholar] [CrossRef]
- Jia, B.; Lynn, H.S. A sample size planning approach that considers both statistical significance and clinical significance. Trials 2015, 16, 213. [Google Scholar] [CrossRef]
- Van’t Veer, L.J.; Dai, H.; van de Vijver, M.J.; He, Y.D.; Hart, A.A.; Mao, M.; Peterse, H.L.; van der Kooy, K.; Marton, M.J.; Witteveen, A.T.; et al. Gene expression profiling predicts clinical outcome of breast cancer. Nature 2002, 415, 530–536. [Google Scholar] [CrossRef]
- Kundu, S.T.; Grzeskowiak, C.L.; Fradette, J.J.; Gibson, L.A.; Rodriguez, L.B.; Creighton, C.J.; Scott, K.L.; Gibbons, D.L. TMEM106B drives lung cancer metastasis by inducing TFEB-dependent lysosome synthesis and secretion of cathepsins. Nat. Commun. 2018, 9, 2731. [Google Scholar] [CrossRef]
- Andriani, F.; Landoni, E.; Mensah, M.; Facchinetti, F.; Miceli, R.; Tagliabue, E.; Giussani, M.; Callari, M.; de Cecco, L.; Colombo, M.P.; et al. Diagnostic role of circulating extracellular matrix-related proteins in non-small cell lung cancer. BMC Cancer 2018, 18, 899. [Google Scholar] [CrossRef] [PubMed]
- Liang, F.; Yue, J.; Wang, J.; Zhang, L.; Fan, R.; Zhang, H.; Zhang, Q. GPCR48/LGR4 promotes tumorigenesis of prostate cancer via PI3K/Akt signaling pathway. Med Oncol. 2015, 32, 49. [Google Scholar] [CrossRef]
- Zhou, W.; Han, L.; Altman, R.B. Imputing gene expression to maximize platform compatibility. Bioinformatics 2016, 33, 522–528. [Google Scholar] [CrossRef] [PubMed]
- Garnett, M.J.; Edelman, E.J.; Heidorn, S.J.; Greenman, C.D.; Dastur, A.; Lau, K.W.; Greninger, P.; Thompson, I.R.; Luo, X.; Soares, J.; et al. Systematic identification of genomic markers of drug sensitivity in cancer cells. Nature 2012, 483, 570–575. [Google Scholar] [CrossRef] [PubMed]
- Davis, S.; Meltzer, P.S. GEOquery: A bridge between the Gene Expression Omnibus (GEO) and bioconductor. Bioinformatics 2007, 23, 1846–1847. [Google Scholar] [CrossRef] [PubMed]
- Warnes, G.; Bolker, B.; Bonebakker, L.; Gentleman, R.; Liaw, W.; Lumley, T.; Maechler, M.; Magnusson, A.; Moeller, S.; Schwartz, M.; et al. Gplots: Various R Programming Tools for Plotting Data; R package version 3.0.1. Available online: https://cran.r-project.org/web/packages/gPCA/index.html (accessed on 27 September 2019).
- Ritchie, M.E.; Phipson, B.; Wu, D.; Hu, Y.; Law, C.W.; Shi, W.; Smyth, G.K. Limma powers differential expression analyses for RNA-sequencing and microarray studies. Nucleic Acids Res. 2015, 43, e47. [Google Scholar] [CrossRef] [PubMed]
- Reese, S. Batch Effect Detection via Guided Principal Components Analysis, R package version 1.0; Available online: https://rdrr.io/cran/gPCA/man/gPCA-package.html (accessed on 27 September 2019).
- Leek, J.T.; Johnson, W.E.; Parker, H.S.; Jaffe, A.E.; Storey, J.D. The sva package for removing batch effects and other unwanted variation in high-throughput experiments. Bioinformatics 2012, 28, 882–883. [Google Scholar] [CrossRef]
- Benjamini, Y.; Hochberg, Y. Controlling the false discovery rate: A practical and powerful approach to multiple testing. J. R. Stat. Society. Ser. B 1995, 57, 289–300. [Google Scholar] [CrossRef]
- Yu, G.; Wang, L.G.; Han, Y.; He, Q.Y. clusterProfiler: An R package for comparing biological themes among gene clusters. Omics A J. Integr. Biol. 2012, 16, 284–287. [Google Scholar] [CrossRef]
- Luo, W.; Brouwer, C. Pathview: An R/Bioconductor package for pathway-based data integration and visualization. Bioinformatics 2013, 29, 1830–1831. [Google Scholar] [CrossRef]
- Friedman, J.; Hastie, T.; Tibshirani, R. Regularization paths for generalized linear models via coordinate descent. J. Stat. Softw. 2010, 33, 1–22. [Google Scholar] [CrossRef] [PubMed]
- Kuhn, M. Classification and Regression Training, R package version 6.0-80; Available online: https://cran.r-project.org/web/packages/caret/index.html (accessed on 27 September 2019).
- Robin, X.; Turck, N.; Hainard, A.; Tiberti, N.; Lisacek, F.; Sanchez, J.-C.; Müller, M. pROC: An open-source package for R and S+ to analyze and compare ROC curves. BMC Bioinform. 2011, 12, 77. [Google Scholar] [CrossRef] [PubMed]
- Therneau, T. A Package for Survival Analysis in S, R package version 2.38; Available online: https://CRAN.R-Proj..Org/Package=Surviv (accessed on 27 September 2019).
- Alboukadel, K.; Marcin, K. Survminer: “Drawing Survival Curves Using ‘Ggplot2’”, R package version 0.3.1; Available online: https://cran.r-project.org/web/packages/survminer/index.html (accessed on 27 September 2019).


© 2019 by the authors. Licensee MDPI, Basel, Switzerland. This article is an open access article distributed under the terms and conditions of the Creative Commons Attribution (CC BY) license (http://creativecommons.org/licenses/by/4.0/).
Share and Cite
Vey, J.; Kapsner, L.A.; Fuchs, M.; Unberath, P.; Veronesi, G.; Kunz, M. A Toolbox for Functional Analysis and the Systematic Identification of Diagnostic and Prognostic Gene Expression Signatures Combining Meta-Analysis and Machine Learning. Cancers 2019, 11, 1606. https://doi.org/10.3390/cancers11101606
Vey J, Kapsner LA, Fuchs M, Unberath P, Veronesi G, Kunz M. A Toolbox for Functional Analysis and the Systematic Identification of Diagnostic and Prognostic Gene Expression Signatures Combining Meta-Analysis and Machine Learning. Cancers. 2019; 11(10):1606. https://doi.org/10.3390/cancers11101606
Chicago/Turabian StyleVey, Johannes, Lorenz A. Kapsner, Maximilian Fuchs, Philipp Unberath, Giulia Veronesi, and Meik Kunz. 2019. "A Toolbox for Functional Analysis and the Systematic Identification of Diagnostic and Prognostic Gene Expression Signatures Combining Meta-Analysis and Machine Learning" Cancers 11, no. 10: 1606. https://doi.org/10.3390/cancers11101606
APA StyleVey, J., Kapsner, L. A., Fuchs, M., Unberath, P., Veronesi, G., & Kunz, M. (2019). A Toolbox for Functional Analysis and the Systematic Identification of Diagnostic and Prognostic Gene Expression Signatures Combining Meta-Analysis and Machine Learning. Cancers, 11(10), 1606. https://doi.org/10.3390/cancers11101606