A Network Analysis of Multiple Myeloma Related Gene Signatures

 ,
,
Abstract
1. Introduction
2. Results
2.1. QC of the MMRC Dataset for Integrative Network Analysis
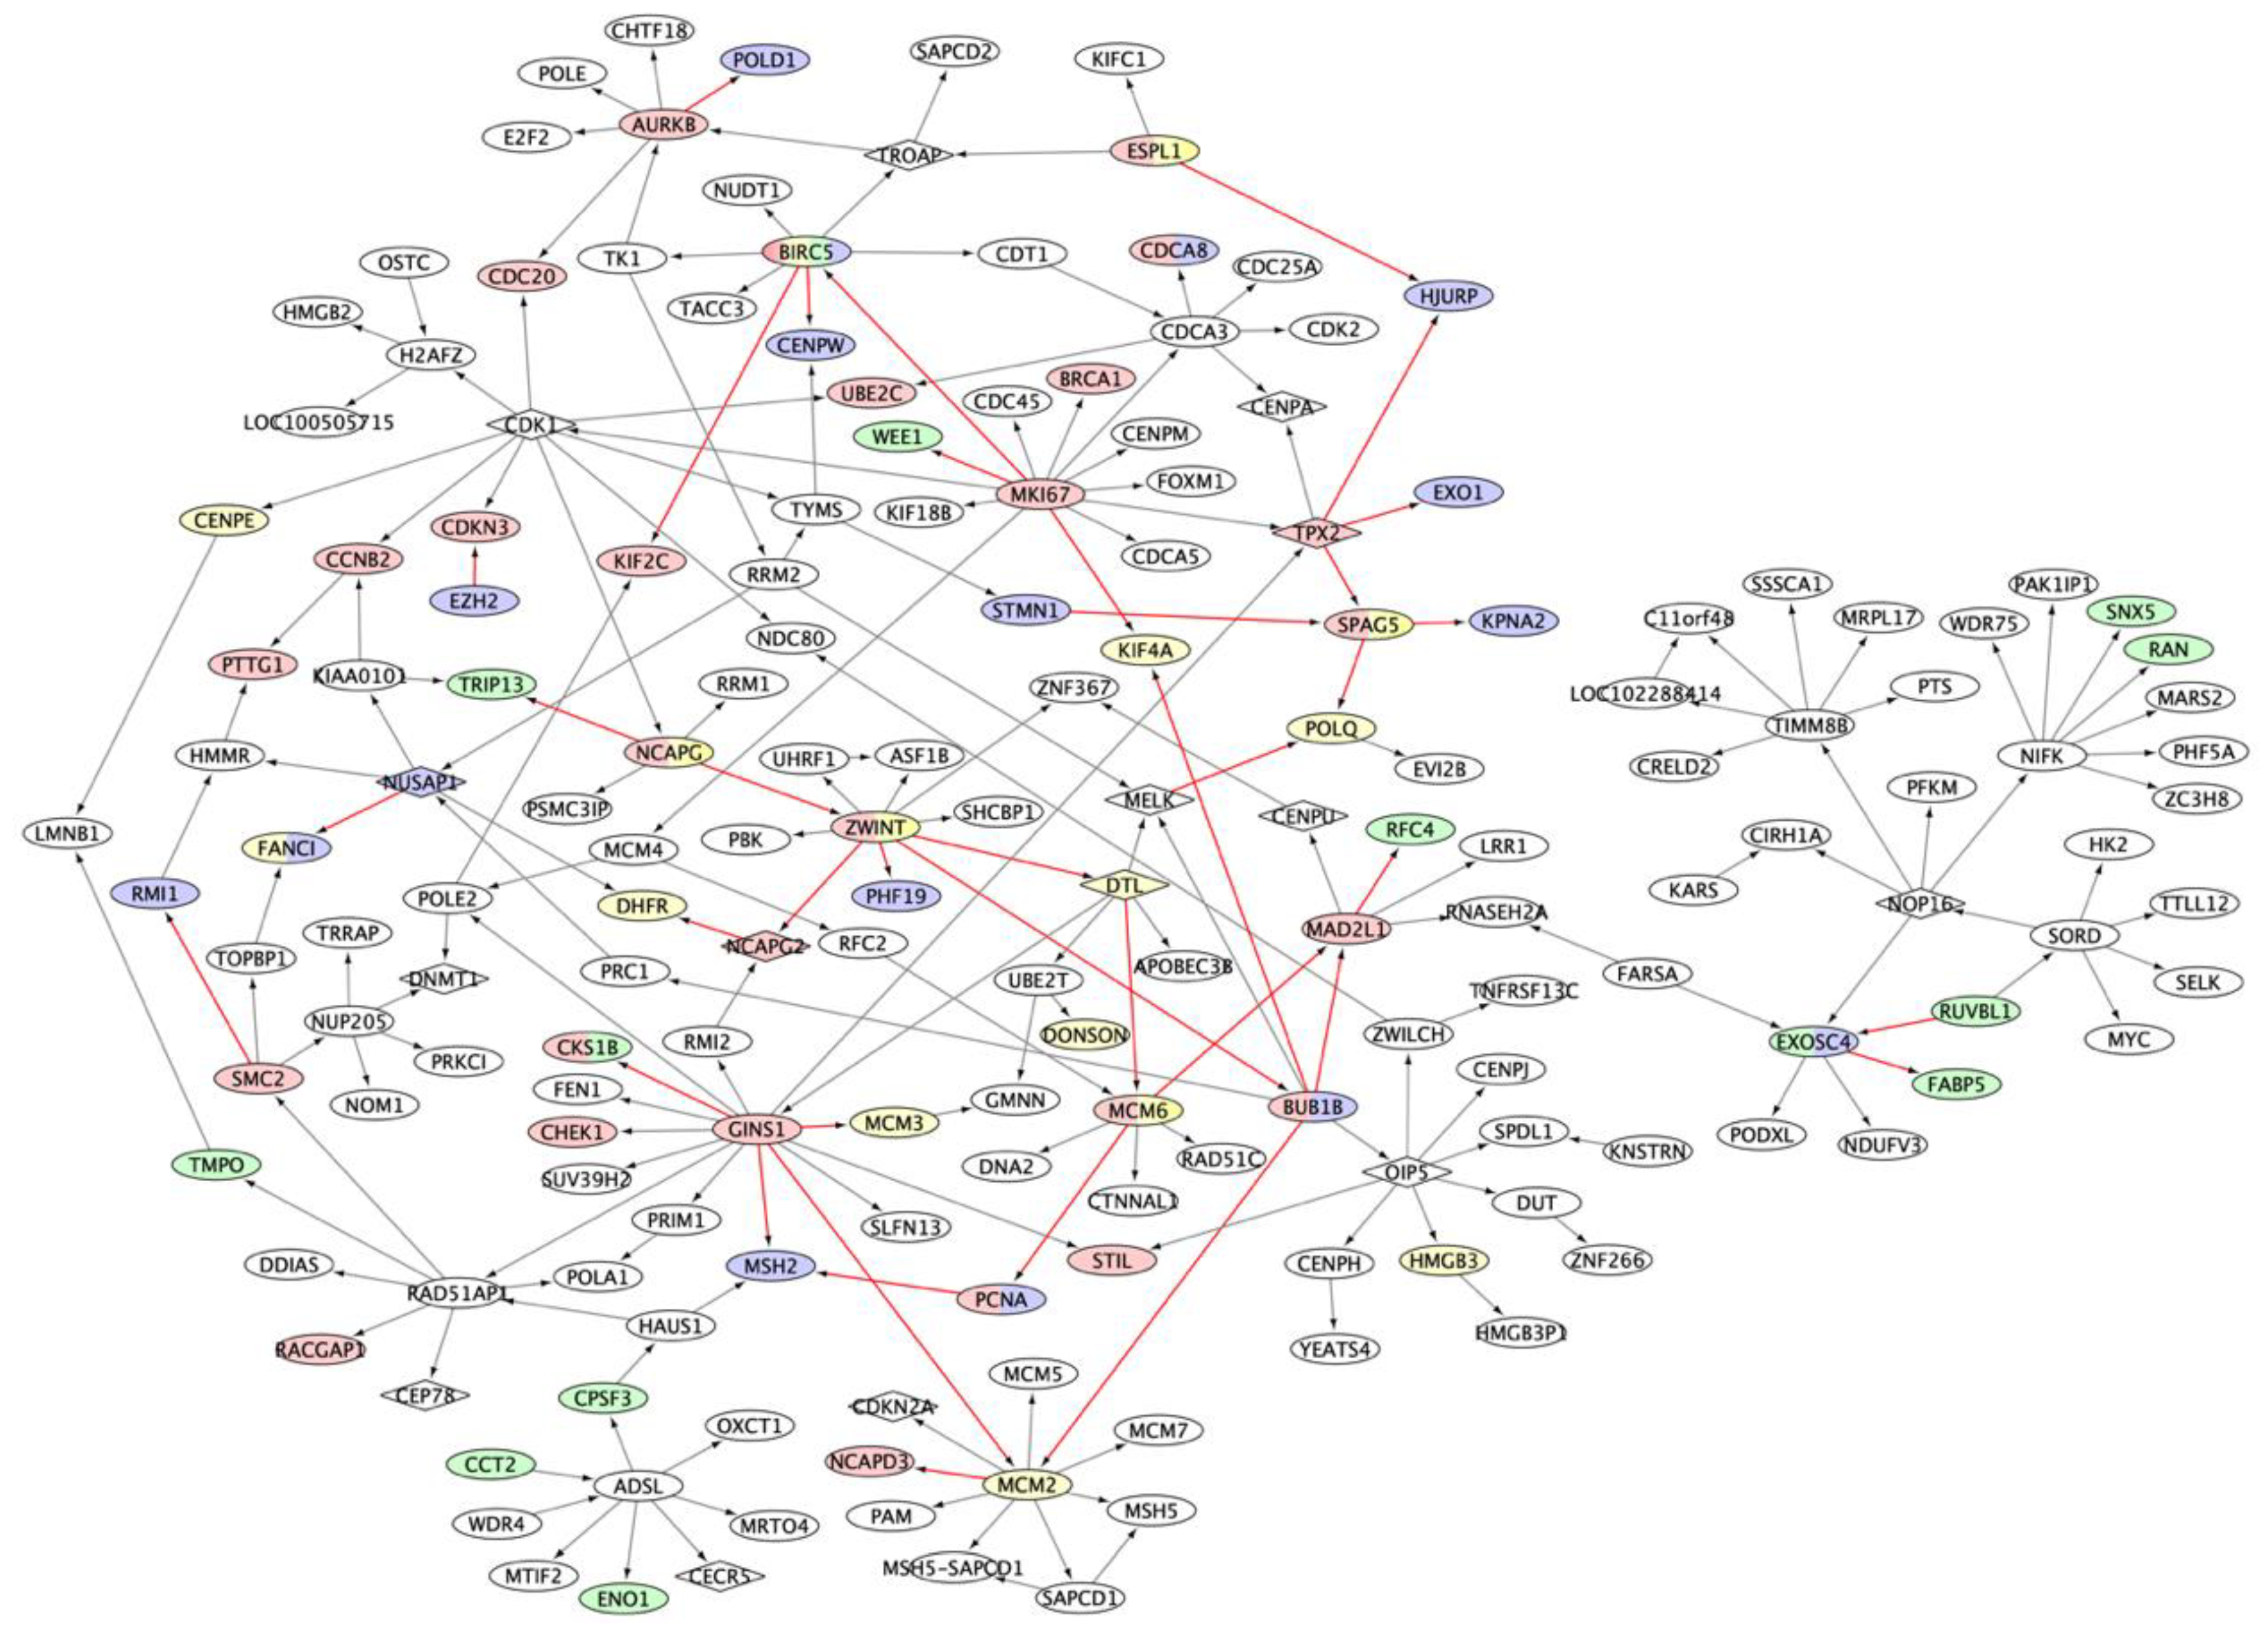
2.2. Multiple Myeloma Molecular Causal Network (M3CN)
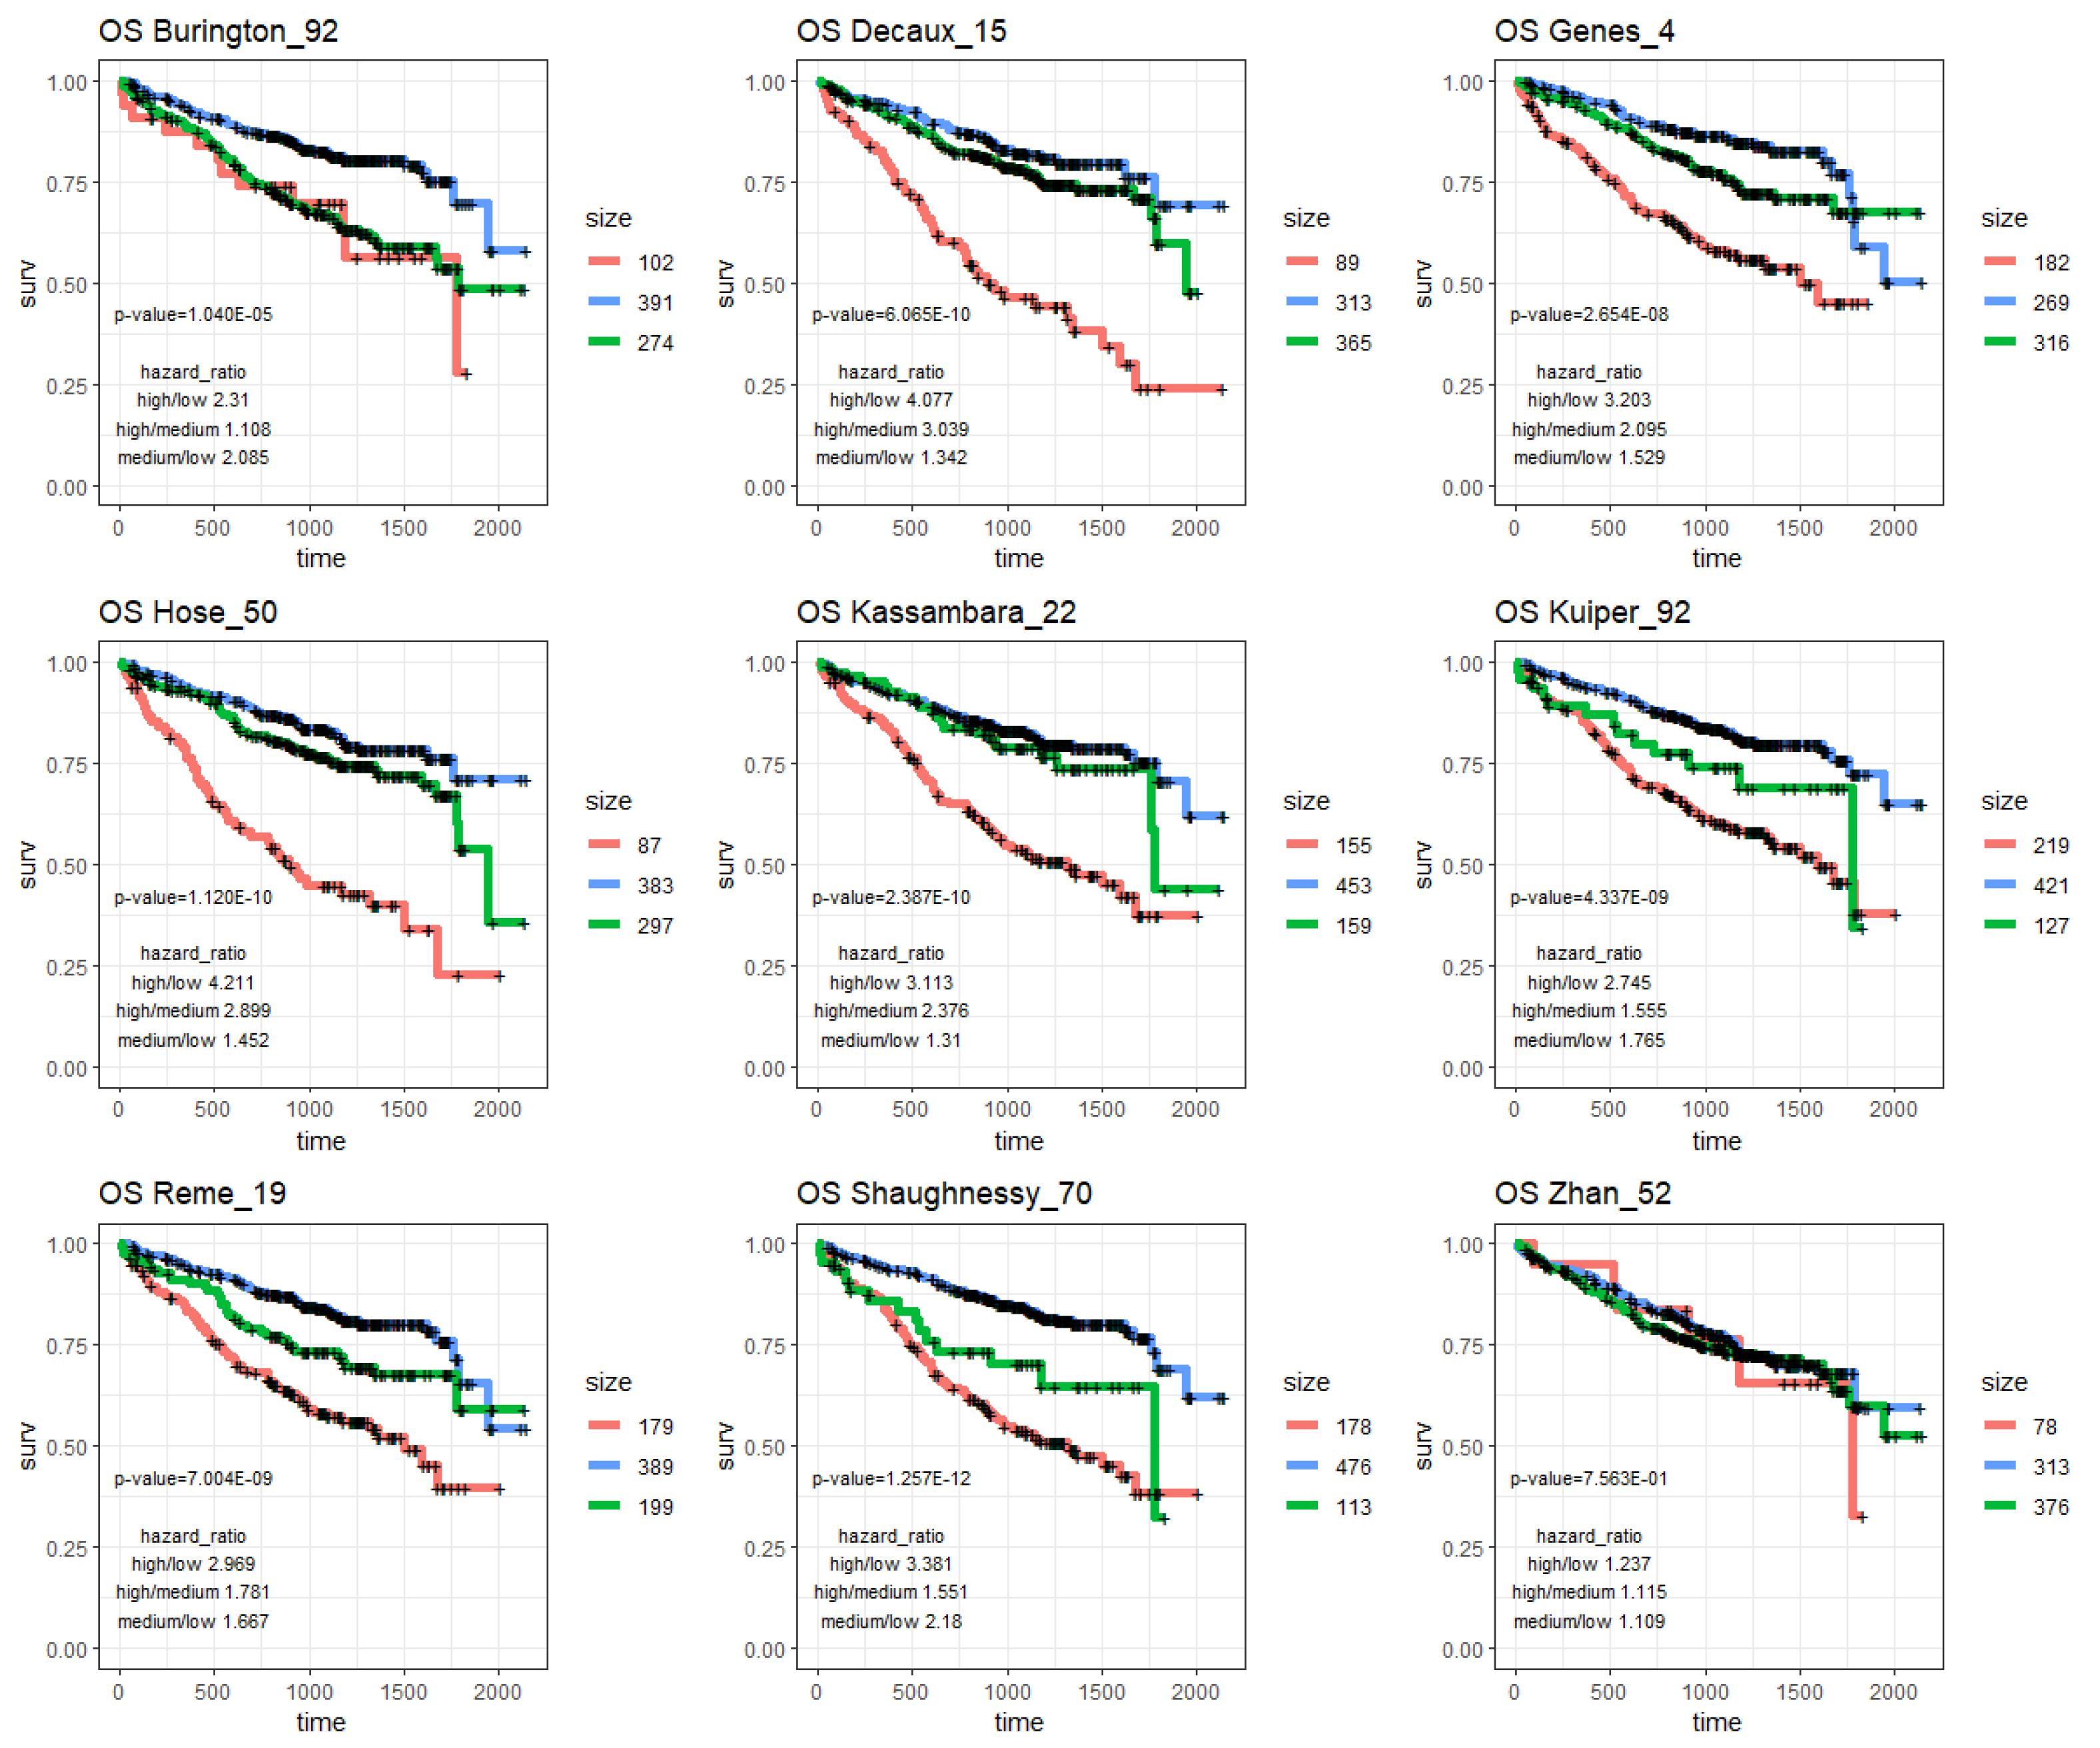
2.3. MM Prognostic Signature Genes in the M3CN
2.4. MM Treatment Response Signature Genes in the M3CN Network
2.4.1. Immunomodulatory Drugs (IMiDs) Response Signatures
2.4.2. Proteasome Inhibitor (PI) Response Signatures
2.4.3. Drug-Combination Response Signatures
3. Discussion
4. Materials and Methods
4.1. The Preprocess of Gene Expression, and CNV Data and Omics Data Matching
4.2. Gene Signatures for MM
4.3. M3CN Construction and Network Analysis
4.4. The Identification of Key Regulators for Signature Genes
4.5. Pathway Analysis
4.6. The MMRF-CoMMpass Cohort
5. Conclusions
Supplementary Materials
Author Contributions
Funding
Acknowledgments
Conflicts of Interest
References
- Siegel, R.L.; Miller, K.D.; Jemal, A. Cancer statistics, 2018. CA Cancer J. Clin. 2018, 68, 7–30. [Google Scholar] [CrossRef] [PubMed]
- Drach, J.; Schuster, J.; Nowotny, H.; Angerler, J.; Rosenthal, F.; Fiegl, M.; Rothermundt, C.; Gsur, A.; Jäger, U.; Heinz, R. Multiple myeloma: High incidence of chromosomal aneuploidy as detected by interphase fluorescence in situ hybridization. Cancer Res. 1995, 55, 3854–3859. [Google Scholar] [PubMed]
- Kuehl, W.M.; Bergsagel, P.L. Early genetic events provide the basis for a clinical classification of multiple myeloma. Hematol. Am. Soc. Hematol. Educ. Program 2005, 2005, 346–352. [Google Scholar] [CrossRef] [PubMed]
- Manier, S.; Salem, K.Z.; Park, J.; Landau, D.A.; Getz, G.; Ghobrial, I.M. Genomic complexity of multiple myeloma and its clinical implications. Nat. Rev. Clin. Oncol. 2017, 14, 100–113. [Google Scholar] [CrossRef] [PubMed]
- Keats, J.J.; Reiman, T.; Maxwell, C.A.; Taylor, B.J.; Larratt, L.M.; Mant, M.J.; Belch, A.R.; Pilarski, L.M. In multiple myeloma, t(4;14)(p16;q32) is an adverse prognostic factor irrespective of FGFR3 expression. Blood 2003, 101, 1520–1529. [Google Scholar] [CrossRef] [PubMed]
- Gaballa, S.; Saliba, R.M.; Srour, S.; Lu, G.; Brammer, J.E.; Shah, N.; Bashir, Q.; Patel, K.; Bock, F.; Parmar, S.; et al. Outcomes in patients with multiple myeloma with TP53 deletion after autologous hematopoietic stem cell transplant. Am. J. Hematol. 2016, 91, E442–E447. [Google Scholar] [CrossRef] [PubMed]
- Thakurta, A.; Ortiz, M.; Blecua, P.; Towfic, F.; Corre, J.; Serbina, N.V.; Flynt, E.; Yu, Z.; Yang, Z.; Palumbo, A.; et al. High subclonal fraction of 17p deletion is associated with poor prognosis in multiple myeloma. Blood 2019, 133, 1217–1221. [Google Scholar] [CrossRef]
- Avet-Loiseau, H.; Malard, F.; Campion, L.; Magrangeas, F.; Sebban, C.; Lioure, B.; Decaux, O.; Lamy, T.; Legros, L.; Fuzibet, J.G.; et al. Translocation t(14;16) and multiple myeloma: Is it really an independent prognostic factor? Blood 2011, 117, 2009–2011. [Google Scholar] [CrossRef]
- Hanamura, I.; Stewart, J.P.; Huang, Y.; Zhan, F.; Santra, M.; Sawyer, J.R.; Hollmig, K.; Zangarri, M.; Pineda-Roman, M.; Van Rhee, F.; et al. Frequent gain of chromosome band 1q21 in plasma-cell dyscrasias detected by fluorescence in situ hybridization: Incidence increases from MGUS to relapsed myeloma and is related to prognosis and disease progression following tandem stem-cell transplantation. Blood 2006, 108, 1724–1732. [Google Scholar] [CrossRef]
- Avet-Loiseau, H.; Attal, M.; Moreau, P.; Charbonnel, C.; Garban, F.; Hulin, C.; Leyvraz, S.; Michallet, M.; Yakoub-Agha, I.; Garderet, L.; et al. Genetic abnormalities and survival in multiple myeloma: The experience of the Intergroupe Francophone du Myélome. Blood 2007, 109, 3489–3495. [Google Scholar] [CrossRef]
- Walker, B.A.; Mavrommatis, K.; Wardell, C.P.; Ashby, T.C.; Bauer, M.; Davies, F.; Rosenthal, A.; Wang, H.; Qu, P.; Hoering, A.; et al. A high-risk, Double-Hit, group of newly diagnosed myeloma identified by genomic analysis. Leukemia 2019, 33, 159–170. [Google Scholar] [CrossRef] [PubMed]
- Barwick, B.G.; Neri, P.; Bahlis, N.J.; Nooka, A.K.; Dhodapkar, M.V.; Jaye, D.L.; Hofmeister, C.C.; Kaufman, J.L.; Gupta, V.A.; Auclair, D.; et al. Multiple myeloma immunoglobulin lambda translocations portend poor prognosis. Nat. Commun. 2019, 10, 1911. [Google Scholar] [CrossRef] [PubMed]
- Kumar, S. Emerging options in multiple myeloma: Targeted, immune, and epigenetic therapies. ASH Educ. Progr. Book 2017, 2017, 518–524. [Google Scholar] [CrossRef] [PubMed]
- Kumar, S.K.; Rajkumar, S.V. The multiple myelomas—Current concepts in cytogenetic classification and therapy. Nat. Rev. Clin. Oncol. 2018, 15, 409–421. [Google Scholar] [CrossRef] [PubMed]
- Plesner, T.; Krejcik, J. Daratumumab for the Treatment of Multiple Myeloma. Front. Immunol. 2018, 9, 1228. [Google Scholar] [CrossRef] [PubMed]
- Durie, B.G.; Hoering, A.; Abidi, M.H.; Rajkumar, S.V.; Epstein, J.; Kahanic, S.P.; Thakuri, M.; Reu, F.; Reynolds, C.M.; Sexton, R.; et al. Bortezomib with lenalidomide and dexamethasone versus lenalidomide and dexamethasone alone in patients with newly diagnosed myeloma without intent for immediate autologous stem-cell transplant (SWOG S0777): A randomised, open-label, phase 3 trial. Lancet 2017, 389, 519–527. [Google Scholar] [CrossRef]
- Attal, M.; Lauwers-Cances, V.; Hulin, C.; Leleu, X.; Caillot, D.; Escoffre, M.; Arnulf, B.; Macro, M.; Belhadj, K.; Garderet, L.; et al. Lenalidomide, Bortezomib, and Dexamethasone with Transplantation for Myeloma. N. Engl. J. Med. 2017, 376, 1311–1320. [Google Scholar] [CrossRef] [PubMed]
- Goldschmidt, H.; Lokhorst, H.M.; Mai, E.K.; van der Holt, B.; Blau, I.W.; Zweegman, S.; Weisel, K.C.; Vellenga, E.; Pfreundschuh, M.; Kersten, M.J.; et al. Bortezomib before and after high-dose therapy in myeloma: Long-term results from the phase III HOVON-65/GMMG-HD4 trial. Leukemia 2018, 32, 383–390. [Google Scholar] [CrossRef] [PubMed]
- Kumar, S.K.; Therneau, T.M.; Gertz, M.A.; Lacy, M.Q.; Dispenzieri, A.; Rajkumar, S.V.; Fonseca, R.; Witzig, T.E.; Lust, J.A.; Larson, D.R.; et al. Clinical Course of Patients with Relapsed Multiple Myeloma. Mayo Clin. Proc. 2004, 79, 867–874. [Google Scholar] [CrossRef] [PubMed]
- Sonneveld, P.; Broijl, A. Treatment of relapsed and refractory multiple myeloma. Haematologica 2016, 101, 396–406. [Google Scholar] [CrossRef]
- Bhutani, M.; Zhang, Q.; Friend, R.; Voorhees, P.M.; Druhan, L.J.; Barlogie, B.; Sonneveld, P.; Morgan, G.J.; Symanowski, J.T.; Avalos, B.R.; et al. Investigation of a gene signature to predict response to immunomodulatory derivatives for patients with multiple myeloma: An exploratory, retrospective study using microarray datasets from prospective clinical trials. Lancet Haematol. 2017, 4, e443–e451. [Google Scholar] [CrossRef]
- Burington, B.; Barlogie, B.; Zhan, F.; Crowley, J.; Shaughnessy, J.D. Tumor cell gene expression changes following short-term in vivo exposure to single agent chemotherapeutics are related to survival in multiple myeloma. Clin. Cancer Res. 2008, 14, 4821–4829. [Google Scholar] [CrossRef] [PubMed]
- Chapman, M.A.; Sive, J.; Ambrose, J.; Roddie, C.; Counsell, N.; Lach, A.; Abbasian, M.; Popat, R.; Cavenagh, J.D.; Oakervee, H.; et al. RNA-seq of newly diagnosed patients in the PADIMAC study leads to a bortezomib/lenalidomide decision signature. Blood 2018, 132, 2154–2165. [Google Scholar] [CrossRef] [PubMed]
- Chng, W.J.; Dispenzieri, A.; Chim, C.S.; Fonseca, R.; Goldschmidt, H.; Lentzsch, S.; Munshi, N.; Palumbo, A.; Miguel, J.S.; Sonneveld, P.; et al. IMWG consensus on risk stratification in multiple myeloma. Leukemia 2014, 28, 269–277. [Google Scholar] [CrossRef] [PubMed]
- Decaux, O.; Lode, L.; Magrangeas, F.; Charbonnel, C.; Gouraud, W.; Jézéquel, P.; Attal, M.; Harousseau, J.L.; Moreau, P.; Bataille, R.; et al. Prediction of Survival in Multiple Myeloma Based on Gene Expression Profiles Reveals Cell Cycle and Chromosomal Instability Signatures in High-Risk Patients and Hyperdiploid Signatures in Low-Risk Patients: A Study of the Intergroupe Francophone du Myelome. J. Clin. Oncol. 2008, 26, 4798–4805. [Google Scholar] [CrossRef] [PubMed]
- Dickens, N.J.; Walker, B.A.; Leone, P.E.; Johnson, D.C.; Brito, J.L.; Zeisig, A.; Jenner, M.W.; Boyd, K.D.; Gonzalez, D.; Gregory, W.M.; et al. Homozygous deletion mapping in myeloma samples identifies genes and an expression signature relevant to pathogenesis and outcome. Clin. Cancer Res. 2010, 16, 1856–1864. [Google Scholar] [CrossRef]
- Hofman, I.J.F.; van Duin, M.; De Bruyne, E.; Fancello, L.; Mulligan, G.; Geerdens, E.; Garelli, E.; Mancini, C.; Lemmens, H.; Delforge, M.; et al. RPL5 on 1p22.1 is recurrently deleted in multiple myeloma and its expression is linked to bortezomib response. Leukemia 2017, 31, 1706–1714. [Google Scholar] [CrossRef] [PubMed]
- Hose, D.; Reme, T.; Hielscher, T.; Moreaux, J.; Messner, T.; Seckinger, A.; Benner, A.; Shaughnessy, J.D., Jr.; Barlogie, B.; Zhou, Y.; et al. Proliferation is a central independent prognostic factor and target for personalized and risk-adapted treatment in multiple myeloma. Haematologica 2011, 96, 87–95. [Google Scholar] [CrossRef] [PubMed]
- Kassambara, A.; Gourzones-Dmitriev, C.; Sahota, S.; Rème, T.; Moreaux, J.; Goldschmidt, H.; Constantinou, A.; Pasero, P.; Hose, D.; Klein, B. A DNA repair pathway score predicts survival in human multiple myeloma: The potential for therapeutic strategy. Oncotarget 2014, 5, 2487–2498. [Google Scholar] [CrossRef]
- Kronke, J.; Kuchenbauer, F.; Kull, M.; Teleanu, V.; Bullinger, L.; Bunjes, D.; Greiner, A.; Kolmus, S.; Kopff, S.; Schreder, M.; et al. IKZF1 expression is a prognostic marker in newly diagnosed standard-risk multiple myeloma treated with lenalidomide and intensive chemotherapy: A study of the German Myeloma Study Group (DSMM). Leukemia 2017, 31, 1363–1367. [Google Scholar] [CrossRef]
- Kuiper, R.; Broyl, A.; De Knegt, Y.; Van Vliet, M.H.; Van Beers, E.H.; Van Der Holt, B.; El Jarari, L.; Mulligan, G.; Gregory, W.; Morgan, G.; et al. A gene expression signature for high-risk multiple myeloma. Leukemia 2012, 26, 2406–2413. [Google Scholar] [CrossRef]
- Mitra, A.K.; Harding, T.; Mukherjee, U.K.; Jang, J.S.; Li, Y.; HongZheng, R.; Jen, J.; Sonneveld, P.; Kumar, S.; Kuehl, W.M.; et al. A gene expression signature distinguishes innate response and resistance to proteasome inhibitors in multiple myeloma. Blood Cancer J. 2017, 7, e581. [Google Scholar] [CrossRef]
- Mulligan, G.; Mitsiades, C.; Bryant, B.; Zhan, F.; Chng, W.J.; Roels, S.; Koenig, E.; Fergus, A.; Huang, Y.; Richardson, P.; et al. Gene expression profiling and correlation with outcome in clinical trials of the proteasome inhibitor bortezomib. Blood 2007, 109, 3177–3188. [Google Scholar] [CrossRef]
- Narita, T.; Ri, M.; Masaki, A.; Mori, F.; Ito, A.; Kusumoto, S.; Ishida, T.; Komatsu, H.; Iida, S. Lower expression of activating transcription factors 3 and 4 correlates with shorter progression-free survival in multiple myeloma patients receiving bortezomib plus dexamethasone therapy. Blood Cancer J. 2015, 5, e373. [Google Scholar] [CrossRef]
- Rème, T.; Hose, D.; Theillet, C.; Klein, B. Modeling risk stratification in human cancer. Bioinformatics 2013, 29, 1149–1157. [Google Scholar] [CrossRef]
- Samur, M.K.; Minvielle, S.; Gullà, A.; Fulciniti, M.; Cleynen, A.; Samur, A.A.; Szalat, R.; Shammas, M.; Magrangeas, F.; Tai, Y.T.; et al. Long Intergenic Non-Coding RNAs have an Independent Impact on Survival in Multiple Myeloma. Leukemia 2018, 32, 2626–2635. [Google Scholar] [CrossRef]
- Shaughnessy, J.D.; Qu, P.; Usmani, S.; Heuck, C.J.; Zhang, Q.; Zhou, Y.; Tian, E.; Hanamura, I.; Van Rhee, F.; Anaissie, E.; et al. Pharmacogenomics of bortezomib test-dosing identifies hyperexpression of proteasome genes, especially PSMD4, as novel high-risk feature in myeloma treated with Total Therapy 3. Blood 2011, 118, 3512–3524. [Google Scholar] [CrossRef]
- Shaughnessy, J.D.; Zhan, F.; Burington, B.E.; Huang, Y.; Colla, S.; Hanamura, I.; Stewart, J.P.; Kordsmeier, B.; Randolph, C.; Williams, D.R.; et al. A validated gene expression model of high-risk multiple myeloma is defined by deregulated expression of genes mapping to chromosome 1. Blood 2007, 109, 2276–2284. [Google Scholar] [CrossRef]
- Terragna, C.; Remondini, D.; Martello, M.; Zamagni, E.; Pantani, L.; Patriarca, F.; Pezzi, A.; Levi, G.; Offidani, M.; Proserpio, I.; et al. The genetic and genomic background of multiple myeloma patients achieving complete response after induction therapy with bortezomib, thalidomide and dexamethasone (VTD). Oncotarget 2016, 7, 9666–9679. [Google Scholar] [CrossRef]
- Wu, S.P.; Pfeiffer, R.M.; Ahn, I.E.; Mailankody, S.; Sonneveld, P.; van Duin, M.; Munshi, N.C.; Walker, B.A.; Morgan, G.; Landgren, O. Impact of Genes Highly Correlated with MMSET Myeloma on the Survival of Non-MMSET Myeloma Patients. Clin. Cancer Res. 2016, 22, 4039–4044. [Google Scholar] [CrossRef]
- Zhan, F.; Barlogie, B.; Arzoumanian, V.; Huang, Y.; Williams, D.R.; Hollmig, K.; Pineda-Roman, M.; Tricot, G.; van Rhee, F.; Zangari, M.; et al. Gene-expression signature of benign monoclonal gammopathy evident in multiple myeloma is linked to good prognosis. Blood 2007, 109, 1692–1700. [Google Scholar] [CrossRef] [PubMed]
- Zhu, Y.X.; Braggio, E.; Shi, C.X.; Kortuem, K.M.; Bruins, L.A.; Schmidt, J.E.; Chang, X.B.; Langlais, P.; Luo, M.; Jedlowski, P.; et al. Identification of cereblon-binding proteins and relationship with response and survival after IMiDs in multiple myeloma. Blood 2014, 124, 536–545. [Google Scholar] [CrossRef] [PubMed]
- Heuck, C.J.; Qu, P.; Van Rhee, F.; Waheed, S.; Usmani, S.Z.; Epstein, J.; Zhang, Q.; Edmondson, R.; Hoering, A.; Crowley, J.; et al. Five gene probes carry most of the discriminatory power of the 70-gene risk model in multiple myeloma. Leukemia 2014, 28, 2410–2413. [Google Scholar] [CrossRef] [PubMed][Green Version]
- Bolli, N.; Biancon, G.; Moarii, M.; Gimondi, S.; Li, Y.; De Philippis, C.; Maura, F.; Sathiaseelan, V.; Tai, Y.T.; Mudie, L.; et al. Analysis of the genomic landscape of multiple myeloma highlights novel prognostic markers and disease subgroups. Leukemia 2018, 32, 2604–2616. [Google Scholar] [CrossRef] [PubMed]
- Zhan, F.; Tian, E.; Bumm, K.; Smith, R.; Barlogie, B.; Shaughnessy, J., Jr. Gene expression profiling of human plasma cell differentiation and classification of multiple myeloma based on similarities to distinct stages of late-stage B-cell development. Blood 2003, 101, 1128–1140. [Google Scholar] [CrossRef] [PubMed]
- Kuiper, R.; Van Duin, M.; Van Vliet, M.H.; Broijl, A.; Van Der Holt, B.; El Jarari, L.; Van Beers, E.H.; Mulligan, G.; Avet-Loiseau, H.; Gregory, W.M.; et al. Prediction of high- and low-risk multiple myeloma based on gene expression and the International Staging System. Blood 2015, 126, 1996–2004. [Google Scholar] [CrossRef] [PubMed]
- Chng, W.J.; Chung, T.H.; Kumar, S.; Usmani, S.; Munshi, N.; Avet-Loiseau, H.; Goldschmidt, H.; Durie, B.; Sonneveld, P. Gene signature combinations improve prognostic stratification of multiple myeloma patients. Leukemia 2016, 30, 1071–1078. [Google Scholar] [CrossRef] [PubMed]
- Lagana, A.; Perumal, D.; Melnekoff, D.; Readhead, B.; Kidd, B.A.; Leshchenko, V.; Kuo, P.Y.; Keats, J.; DeRome, M.; Yesil, J.; et al. Integrative network analysis identifies novel drivers of pathogenesis and progression in newly diagnosed multiple myeloma. Leukemia 2018, 32, 120–130. [Google Scholar] [CrossRef] [PubMed]
- Chapman, M.A.; Lawrence, M.S.; Keats, J.J.; Cibulskis, K.; Sougnez, C.; Schinzel, A.C.; Harview, C.L.; Brunet, J.P.; Ahmann, G.J.; Adli, M.; et al. Initial genome sequencing and analysis of multiple myeloma. Nature 2011, 471, 467–472. [Google Scholar] [CrossRef] [PubMed]
- Zhu, J.; Zhang, B.; Smith, E.N.; Drees, B.; Brem, R.B.; Kruglyak, L.; Bumgarner, R.E.; Schadt, E.E. Integrating large-scale functional genomic data to dissect the complexity of yeast regulatory networks. Nat. Genet. 2008, 40, 854–861. [Google Scholar] [CrossRef]
- Yoo, S.; Huang, T.; Campbell, J.D.; Lee, E.; Tu, Z.; Geraci, M.W.; Powell, C.A.; Schadt, E.E.; Spira, A.; Zhu, J. MODMatcher: Multi-omics data matcher for integrative genomic analysis. PLoS Comput. Boil. 2014, 10, e1003790. [Google Scholar] [CrossRef] [PubMed]
- Lee, E.; Yoo, S.; Wang, W.; Tu, Z.; Zhu, J. A probabilistic multi-omics data matching method for detecting sample errors in integrative analysis. GigaScience 2019, 8, giz080. [Google Scholar] [CrossRef] [PubMed]
- Szalat, R.; Avet-Loiseau, H.; Munshi, N.C. Gene Expression Profiles in Myeloma: Ready for the Real World? Clin. Cancer Res. 2016, 22, 5434–5442. [Google Scholar] [CrossRef] [PubMed]
- Smetana, J.; Fröhlich, J.; Zaoralova, R.; Vallová, V.; Greslikova, H.; Kupska, R.; Němec, P.; Mikulášová, A.; Almasi, M.; Pour, L.; et al. Genome-Wide Screening of Cytogenetic Abnormalities in Multiple Myeloma Patients Using Array-CGH Technique: A Czech Multicenter Experience. BioMed Res. Int. 2014, 2014, 1–9. [Google Scholar] [CrossRef] [PubMed]
- Redon, R.; Ishikawa, S.; Fitch, K.R.; Feuk, L.; Perry, G.H.; Andrews, T.D.; Fiegler, H.; Shapero, M.H.; Carson, A.R.; Chen, W.; et al. Global variation in copy number in the human genome. Nature 2006, 444, 444–454. [Google Scholar] [CrossRef] [PubMed]
- Ohshima, K.; Hatakeyama, K.; Nagashima, T.; Watanabe, Y.; Kanto, K.; Doi, Y.; Ide, T.; Shimoda, Y.; Tanabe, T.; Ohnami, S.; et al. Integrated analysis of gene expression and copy number identified potential cancer driver genes with amplification-dependent overexpression in 1,454 solid tumors. Sci. Rep. 2017, 7, 1546. [Google Scholar] [CrossRef] [PubMed]
- Zhou, C.; Zhang, W.; Chen, W.; Yin, Y.; Atyah, M.; Liu, S.; Guo, L.; Shi, Y.; Ye, Q.; Dong, Q.; et al. Integrated analysis of copy number variations and gene expression profiling in hepatocellular carcinoma. Sci. Rep. 2017, 7, 10570. [Google Scholar] [CrossRef] [PubMed]
- Gong, Y.; Wang, L.; Chippada-Venkata, U.; Dai, X.; Oh, W.K.; Zhu, J. Constructing Bayesian networks by integrating gene expression and copy number data identifies NLGN4Y as a novel regulator of prostate cancer progression. Oncotarget 2016, 7, 68688–68707. [Google Scholar] [CrossRef] [PubMed]
- Tran, L.M.; Zhang, B.; Zhang, Z.; Zhang, C.; Xie, T.; Lamb, J.R.; Dai, H.; Schadt, E.E.; Zhu, J. Inferring causal genomic alterations in breast cancer using gene expression data. BMC Syst. Boil. 2011, 5, 121. [Google Scholar] [CrossRef] [PubMed]
- Kuehl, W.M.; Bergsagel, P.L. Multiple myeloma: Evolving genetic events and host interactions. Nat. Rev. Cancer 2002, 2, 175–187. [Google Scholar] [CrossRef] [PubMed]
- Agnelli, L.; Bicciato, S.; Mattioli, M.; Fabris, S.; Intini, D.; Verdelli, D.; Baldini, L.; Morabito, F.; Callea, V.; Lombardi, L.; et al. Molecular Classification of Multiple Myeloma: A Distinct Transcriptional Profile Characterizes Patients ExpressingCCND1and Negative for 14q32 Translocations. J. Clin. Oncol. 2005, 23, 7296–7306. [Google Scholar] [CrossRef]
- Agnelli, L.; Mosca, L.; Fabris, S.; Lionetti, M.; Andronache, A.; Kwee, I.; Todoerti, K.; Verdelli, D.; Battaglia, C.; Bertoni, F.; et al. A SNP microarray and FISH-based procedure to detect allelic imbalances in multiple myeloma: An integrated genomics approach reveals a wide gene dosage effect. Genes Chromosom. Cancer 2009, 48, 603–614. [Google Scholar] [CrossRef]
- Musgrove, E.A.; Caldon, C.E.; Barraclough, J.; Stone, A.; Sutherland, R.L. Cyclin D as a therapeutic target in cancer. Nat. Rev. Cancer 2011, 11, 558–572. [Google Scholar] [CrossRef]
- Zhan, F.; Huang, Y.; Colla, S.; Stewart, J.P.; Hanamura, I.; Gupta, S.; Epstein, J.; Yaccoby, S.; Sawyer, J.; Burington, B.; et al. The molecular classification of multiple myeloma. Blood 2006, 108, 2020–2028. [Google Scholar] [CrossRef]
- Kuo, A.J.; Cheung, P.; Chen, K.; Zee, B.M.; Kioi, M.; Lauring, J.; Xi, Y.; Park, B.H.; Shi, X.; Garcia, B.A.; et al. NSD2 links dimethylation of histone H3 at lysine 36 to oncogenic programming. Mol. Cell 2011, 44, 609–620. [Google Scholar] [CrossRef]
- De Vet, E.C.; Hilkes, Y.H.; Fraaije, M.W.; van den Bosch, H. Alkyl-dihydroxyacetonephosphate synthase. Presence and role of flavin adenine dinucleotide. J. Biol. Chem. 2000, 275, 6276–6283. [Google Scholar] [CrossRef]
- Falank, C.; Fairfield, H.; Reagan, M.R. Signaling interplay between bone marrow adipose tissue and multiple myeloma cells. Front. Endocrinol. 2016, 7, 57. [Google Scholar] [CrossRef]
- Piano, V.; Benjamin, D.I.; Valente, S.; Nenci, S.; Mai, A.; Aliverti, A.; Nomura, D.K.; Mattevi, A. Discovery of Inhibitors for the Ether Lipid-Generating Enzyme AGPS as Anti-Cancer Agents. ACS Chem. Boil. 2015, 10, 2589–2597. [Google Scholar] [CrossRef]
- Walker, B.A.; Mavrommatis, K.; Wardell, C.P.; Ashby, T.C.; Bauer, M.; Davies, F.E.; Rosenthal, A.; Wang, H.; Qu, P.; Hoering, A.; et al. Identification of novel mutational drivers reveals oncogene dependencies in multiple myeloma. Blood 2018, 132, 587–597. [Google Scholar] [CrossRef]
- Marzin, Y.; Jamet, D.; Douet-Guilbert, N.; Morel, F.; Le Bris, M.J.; Morice, P.; Abgrall, J.F.; Berthou, C.; De Braekeleer, M. Chromosome 1 abnormalities in multiple myeloma. Anticancer. Res. 2006, 26, 953–959. [Google Scholar]
- Evans, R.; Naber, C.; Steffler, T.; Checkland, T.; Keats, J.; Maxwell, C.; Perry, T.; Chau, H.; Belch, A.; Pilarski, L.; et al. Aurora A kinase RNAi and small molecule inhibition of Aurora kinases with VE-465 induce apoptotic death in multiple myeloma cells. Leuk. Lymphoma 2008, 49, 559–569. [Google Scholar] [CrossRef]
- Maxwell, C.A.; Rasmussen, E.; Zhan, F.; Keats, J.J.; Adamia, S.; Strachan, E.; Crainie, M.; Walker, R.; Belch, A.R.; Pilarski, L.M.; et al. RHAMM expression and isoform balance predict aggressive disease and poor survival in multiple myeloma. Blood 2004, 104, 1151–1158. [Google Scholar] [CrossRef]
- Santo, L.; Hideshima, T.; Cirstea, D.; Bandi, M.; Nelson, E.A.; Gorgun, G.; Rodig, S.; Vallet, S.; Pozzi, S.; Patel, K.; et al. Antimyeloma activity of a multitargeted kinase inhibitor, AT9283, via potent Aurora kinase and STAT3 inhibition either alone or in combination with lenalidomide. Clin. Cancer Res. 2011, 17, 3259–3271. [Google Scholar] [CrossRef]
- Goga, A.; Yang, D.; Tward, A.D.; Morgan, D.O.; Bishop, J.M. Inhibition of CDK1 as a potential therapy for tumors over-expressing MYC. Nat. Med. 2007, 13, 820–827. [Google Scholar] [CrossRef]
- McMillin, D.W.; Delmore, J.; Negri, J.; Buon, L.; Jacobs, H.M.; Laubach, J.; Jakubikova, J.; Ooi, M.; Hayden, P.; Schlossman, R.; et al. Molecular and cellular effects of multi-targeted cyclin-dependent kinase inhibition in myeloma: Biological and clinical implications. Br. J. Haematol. 2011, 152, 420–432. [Google Scholar] [CrossRef][Green Version]
- Pruneri, G.; Carboni, N.; Baldini, L.; Intini, D.; Colombi, M.; Bertolini, F.; Valentini, S.; Maisonneuve, P.; Viale, G.; Neri, A. Cell cycle regulators in multiple myeloma: Prognostic implications of p53 nuclear accumulation. Hum. Pathol. 2003, 34, 41–47. [Google Scholar] [CrossRef]
- Quach, H.; Ritchie, D.; Stewart, A.K.; Neeson, P.; Harrison, S.; Smyth, M.J.; Prince, H.M. Mechanism of action of immunomodulatory drugs (IMiDS) in multiple myeloma. Leukemia 2010, 24, 22–32. [Google Scholar] [CrossRef]
- Drach, J.; Slany, A.; Sagaster, V.; Gundacker, N.; Haudek, V.; Odelga, V.; Wimmer, H.; Zielinski, C.; Gerner, C. A cellular proteome map of human multiple myeloma. Blood 2007, 110, 111. [Google Scholar]
- Moreaux, J.; Rème, T.; Leonard, W.; Veyrune, J.L.; Requirand, G.; Goldschmidt, H.; Hose, D.; Klein, B. Development of Gene Expression-Based Score to Predict Sensitivity of Multiple Myeloma Cells to DNA Methylation Inhibitors. Mol. Cancer Ther. 2012, 11, 2685–2692. [Google Scholar] [CrossRef]
- Lin, L.; Cao, L.; Liu, Y.; Wang, K.; Zhang, X.; Qin, X.; Zhao, D.; Hao, J.; Chang, Y.; Huang, X.; et al. B7-H3 promotes multiple myeloma cell survival and proliferation by ROS-dependent activation of Src/STAT3 and c-Cbl-mediated degradation of SOCS3. Leukemia 2019, 33, 1475–1486. [Google Scholar] [CrossRef]
- Wilop, S.; Van Gemmeren, T.B.; Lentjes, M.H.; Van Engeland, M.; Herman, J.G.; Brümmendorf, T.H.; Jost, E.; Galm, O. Methylation-associated dysregulation of the suppressor of cytokine signaling-3 gene in multiple myeloma. Epigenetics 2011, 6, 1047–1052. [Google Scholar] [CrossRef]
- Nardiello, T.; Jungbluth, A.A.; Mei, A.; DiLiberto, M.; Huang, X.; Dabrowski, A.; Andrade, V.C.C.; Wasserstrum, R.; Ely, S.; Niesvizky, R.; et al. MAGE-A inhibits apoptosis in proliferating myeloma cells through repression of Bax and maintenance of survivin. Clin. Cancer Res. 2011, 17, 4309–4319. [Google Scholar] [CrossRef]
- Chauhan, D.; Hideshima, T.; Anderson, K.C. PROTEASOME INHIBITION IN MULTIPLE MYELOMA: Therapeutic Implication. Annu. Rev. Pharmacol. Toxicol. 2005, 45, 465–476. [Google Scholar] [CrossRef]
- Zhan, F.; Hardin, J.; Kordsmeier, B.; Bumm, K.; Zheng, M.; Tian, E.; Sanderson, R.; Yang, Y.; Wilson, C.; Zangari, M.; et al. Global gene expression profiling of multiple myeloma, monoclonal gammopathy of undetermined significance, and normal bone marrow plasma cells. Blood 2002, 99, 1745–1757. [Google Scholar] [CrossRef]
- Broyl, A.; Hose, D.; Lokhorst, H.; De Knegt, Y.; Peeters, J.; Jauch, A.; Bertsch, U.; Buijs, A.; Stevens-Kroef, M.; Beverloo, H.B.; et al. Gene expression profiling for molecular classification of multiple myeloma in newly diagnosed patients. Blood 2010, 116, 2543–2553. [Google Scholar] [CrossRef]
- Khoo, W.H.; Ledergor, G.; Weiner, A.; Roden, D.L.; Terry, R.L.; McDonald, M.M.; Chai, R.C.; De Veirman, K.; Owen, K.L.; Opperman, K.S.; et al. A niche-dependent myeloid transcriptome signature defines dormant myeloma cells. Blood 2019, 134, 30–43. [Google Scholar] [CrossRef]
- Layfield, L.J.; Anderson, G.M. Specimen labeling errors in surgical pathology: An 18-month experience. Am. J. Clin. Pathol. 2010, 134, 466–470. [Google Scholar] [CrossRef]
- Yelland, L.N.; Kahan, B.C.; Dent, E.; Lee, K.J.; Voysey, M.; Forbes, A.B.; Cook, J.A. Prevalence and reporting of recruitment, randomisation and treatment errors in clinical trials: A systematic review. Clin. Trials 2018, 15, 278–285. [Google Scholar] [CrossRef]
- Suba, E.J.; Pfeifer, J.D.; Raab, S.S. Patient Identification Error Among Prostate Needle Core Biopsy Specimens—Are We Ready for a DNA Time-Out? J. Urol. 2007, 178, 1245–1248. [Google Scholar] [CrossRef]
- Lippi, G.; Chiozza, L.; Mattiuzzi, C.; Plebani, M. Patient and Sample Identification. Out of the Maze? J. Med. Biochem. 2017, 36, 107–112. [Google Scholar] [CrossRef]
- Ubels, J.; Sonneveld, P.; Van Beers, E.H.; Broijl, A.; Van Vliet, M.H.; De Ridder, J. Predicting treatment benefit in multiple myeloma through simulation of alternative treatment effects. Nat. Commun. 2018, 9, 2943. [Google Scholar] [CrossRef] [PubMed]
- Basak, G.W.; Srivastava, A.S.; Malhotra, R.; Carrier, E. Multiple myeloma bone marrow niche. Curr. Pharm. Biotechnol. 2009, 10, 345–346. [Google Scholar] [CrossRef] [PubMed]
- Ramsköld, D.; Luo, S.; Wang, Y.C.; Li, R.; Deng, Q.; Faridani, O.R.; Daniels, G.A.; Khrebtukova, I.; Loring, J.F.; Laurent, L.C.; et al. Full-length mRNA-Seq from single-cell levels of RNA and individual circulating tumor cells. Nat. Biotechnol. 2012, 30, 777–782. [Google Scholar] [CrossRef] [PubMed]
- Ledergor, G.; Weiner, A.; Zada, M.; Wang, S.Y.; Cohen, Y.C.; Gatt, M.E.; Snir, N.; Magen, H.; Koren-Michowitz, M.; Herzog-Tzarfati, K.; et al. Single cell dissection of plasma cell heterogeneity in symptomatic and asymptomatic myeloma. Nat. Med. 2018, 24, 1867–1876. [Google Scholar] [CrossRef] [PubMed]
- Jang, J.S.; Li, Y.; Mitra, A.K.; Bi, L.; Abyzov, A.; van Wijnen, A.J.; Baughn, L.B.; Van Ness, B.; Rajkumar, V.; Kumar, S.; et al. Molecular signatures of multiple myeloma progression through single cell RNA-Seq. Blood Cancer J. 2019, 9, 2. [Google Scholar] [CrossRef] [PubMed]
- Staedtler, F.; Hartmann, N.; Letzkus, M.; Bongiovanni, S.; Scherer, A.; Marc, P.; Johnson, K.J.; Schumacher, M.M. Robust and tissue-independent gender-specific transcript biomarkers. Biomarkers 2013, 18, 436–445. [Google Scholar] [CrossRef] [PubMed]
- Li, Y.; Wang, X.; Zheng, H.; Wang, C.; Minvielle, S.; Magrangeas, F.; Avet-Loiseau, H.; Shah, P.K.; Zhang, Y.; Munshi, N.C.; et al. Classify hyperdiploidy status of multiple myeloma patients using gene expression profiles. PLoS ONE 2013, 8, e58809. [Google Scholar] [CrossRef] [PubMed]
- Zhu, J.; Wiener, M.C.; Zhang, C.; Fridman, A.; Minch, E.; Lum, P.Y.; Sachs, J.R.; Schadt, E.E. Increasing the power to detect causal associations by combining genotypic and expression data in segregating populations. PLoS Comput. Boil. 2007, 3, 69. [Google Scholar] [CrossRef] [PubMed]
- Zhu, J.; Sova, P.; Xu, Q.; Dombek, K.M.; Xu, E.Y.; Vu, H.; Tu, Z.; Brem, R.B.; Bumgarner, R.E.; Schadt, E.E. Stitching together multiple data dimensions reveals interacting metabolomic and transcriptomic networks that modulate cell regulation. PLoS Biol. 2012, 10, e1001301. [Google Scholar] [CrossRef] [PubMed]
- Friedman, N.; Linial, M.; Nachman, I.; Pe’Er, D. Using Bayesian networks to analyze expression data. J. Comput. Biol. 2000, 7, 127–135. [Google Scholar] [CrossRef]
- Su, G.; Morris, J.H.; Demchak, B.; Bader, G.D. Biological network exploration with cytoscape 3. Curr. Protoc. Bioinform. 2014, 47, 8–13. [Google Scholar] [CrossRef] [PubMed]
- Yang, X.; Peterson, L.; Thieringer, R.; Deignan, J.L.; Wang, X.; Zhu, J.; Wang, S.; Zhong, H.; Stepaniants, S.; Beaulaurier, J.; et al. Identification and validation of genes affecting aortic lesions in mice. J. Clin. Investig. 2010, 120, 2414–2422. [Google Scholar] [CrossRef] [PubMed]
- Yang, X.; Tu, Z.; Zhu, J. Systems Biology Approaches to Studying Diet x Genome Interactions. In Nutritional Genomics; CRC Press: Boca Raton, FL, USA, 2011; pp. 63–76. [Google Scholar] [CrossRef]
- Mi, H.; Muruganujan, A.; Ebert, D.; Huang, X.; Thomas, P.D. PANTHER version 14: More genomes, a new PANTHER GO-slim and improvements in enrichment analysis tools. Nucleic Acids Res. 2019, 47, D419–D426. [Google Scholar] [CrossRef] [PubMed]


| Signature | PMID | Num. of sig. Genes | Num. of Genes in M3CN | Num. of Genes in Subnet | p-Values |
|---|---|---|---|---|---|
| Burington_92 | 18676754 | 92 | 62 | 0 | 0.41 |
| Decaux_15 | 18591550 | 15 | 6 | 1 | 0.13 |
| Hose_50 | 20884712 | 50 | 30 | 28 | 2.2 × 10⁻¹⁶ |
| Kassambara_22 | 24809299 | 22 | 14 | 6 | 4.8 × 10⁻⁷ |
| Kuiper_92 | 22722715 | 92 | 55 | 16 | 2.1 × 10⁻¹³ |
| Reme_19 | 23493321 | 19 | 12 | 6 | 1.6 × 10⁻⁷ |
| Shaughnessy_70 | 17105813 | 70 | 33 | 14 | 1.5 × 10⁻¹⁴ |
| Zhan_52 | 17023574 | 52 | 31 | 0 | 1.0 |
| Signature | OS | PFS | ||||||
|---|---|---|---|---|---|---|---|---|
| p-Value | HR High/Low | HR High/Med. | HR Med./Low | p-Value | HR High/Low | HR High/Med. | HR Med./Low | |
| progNet | 1.78 × 10⁻¹² | 4.657 | 3.204 | 1.454 | 1.73 × 10⁻¹⁰ | 3.312 | 2.487 | 1.331 |
| Burington_92 | 1.04 × 10⁻⁵ | 2.31 | 1.108 | 2.085 | 5.09 × 10⁻⁴ | 1.529 | 0.968 | 1.58 |
| Decaux_15 | 6.07 × 10⁻¹⁰ | 4.077 | 3.039 | 1.342 | 1.81 × 10⁻⁶ | 2.657 | 2.022 | 1.314 |
| Genes_4 | 2.65 × 10⁻⁸ | 3.203 | 2.095 | 1.529 | 9.91 × 10⁻⁶ | 2.108 | 1.551 | 1.359 |
| Hose_50 | 1.12 × 10⁻¹⁰ | 4.211 | 2.899 | 1.452 | 1.46 × 10⁻⁸ | 2.955 | 2.391 | 1.236 |
| Kassambara_22 | 2.39 × 10⁻¹⁰ | 3.113 | 2.376 | 1.31 | 8.66 × 10⁻⁶ | 1.87 | 2.067 | 0.905 |
| Kuiper_92 | 4.34 × 10⁻⁹ | 2.745 | 1.555 | 1.765 | 3.35 × 10⁻⁷ | 1.977 | 1.662 | 1.19 |
| Reme_19 | 7.00 × 10⁻⁹ | 2.969 | 1.781 | 1.667 | 3.03 × 10⁻⁶ | 1.985 | 1.356 | 1.464 |
| Shaughnessy_70 | 1.26 × 10⁻¹² | 3.381 | 1.551 | 2.18 | 2.03 × 10⁻⁶ | 1.964 | 1.651 | 1.19 |
| Zhan_52 | 7.56 × 10⁻¹ | 1.237 | 1.115 | 1.109 | 7.43 × 10⁻¹ | 1.255 | 1.209 | 1.038 |
| Signature | PMID | Num. of Sig. Genes | Num. Genes in M3CN | Treatment | Patients |
|---|---|---|---|---|---|
| Bhutani_176 | 28863804 | 176 | 132 | IMiDs | Mixed |
| Zhu_244 | 24914135 | 244 | 143 | IMiDs | Mixed |
| Mitra_42 | 28665416 | 42 | 29 | PI | Mixed |
| Mulligan_100 | 17185464 | 100 | 30 | PI | Mixed |
| Shaughnessy_80 | 21628408 | 80 | 40 | TT2/TT3 | NDMM |
© 2019 by the authors. Licensee MDPI, Basel, Switzerland. This article is an open access article distributed under the terms and conditions of the Creative Commons Attribution (CC BY) license (http://creativecommons.org/licenses/by/4.0/).
Share and Cite
Liu, Y.; Yu, H.; Yoo, S.; Lee, E.; Laganà, A.; Parekh, S.; Schadt, E.E.; Wang, L.; Zhu, J. A Network Analysis of Multiple Myeloma Related Gene Signatures. Cancers 2019, 11, 1452. https://doi.org/10.3390/cancers11101452
Liu Y, Yu H, Yoo S, Lee E, Laganà A, Parekh S, Schadt EE, Wang L, Zhu J. A Network Analysis of Multiple Myeloma Related Gene Signatures. Cancers. 2019; 11(10):1452. https://doi.org/10.3390/cancers11101452
Chicago/Turabian StyleLiu, Yu, Haocheng Yu, Seungyeul Yoo, Eunjee Lee, Alessandro Laganà, Samir Parekh, Eric E. Schadt, Li Wang, and Jun Zhu. 2019. "A Network Analysis of Multiple Myeloma Related Gene Signatures" Cancers 11, no. 10: 1452. https://doi.org/10.3390/cancers11101452
APA StyleLiu, Y., Yu, H., Yoo, S., Lee, E., Laganà, A., Parekh, S., Schadt, E. E., Wang, L., & Zhu, J. (2019). A Network Analysis of Multiple Myeloma Related Gene Signatures. Cancers, 11(10), 1452. https://doi.org/10.3390/cancers11101452