Metabolomics Biomarkers for Detection of Colorectal Neoplasms: A Systematic Review


Abstract
1. Introduction
2. Methods
2.1. Systematic Literature Research
2.2. Exclusion Criteria
2.3. Data Extraction
2.4. Quality Assessment of Diagnostic Accuracy Studies
3. Results
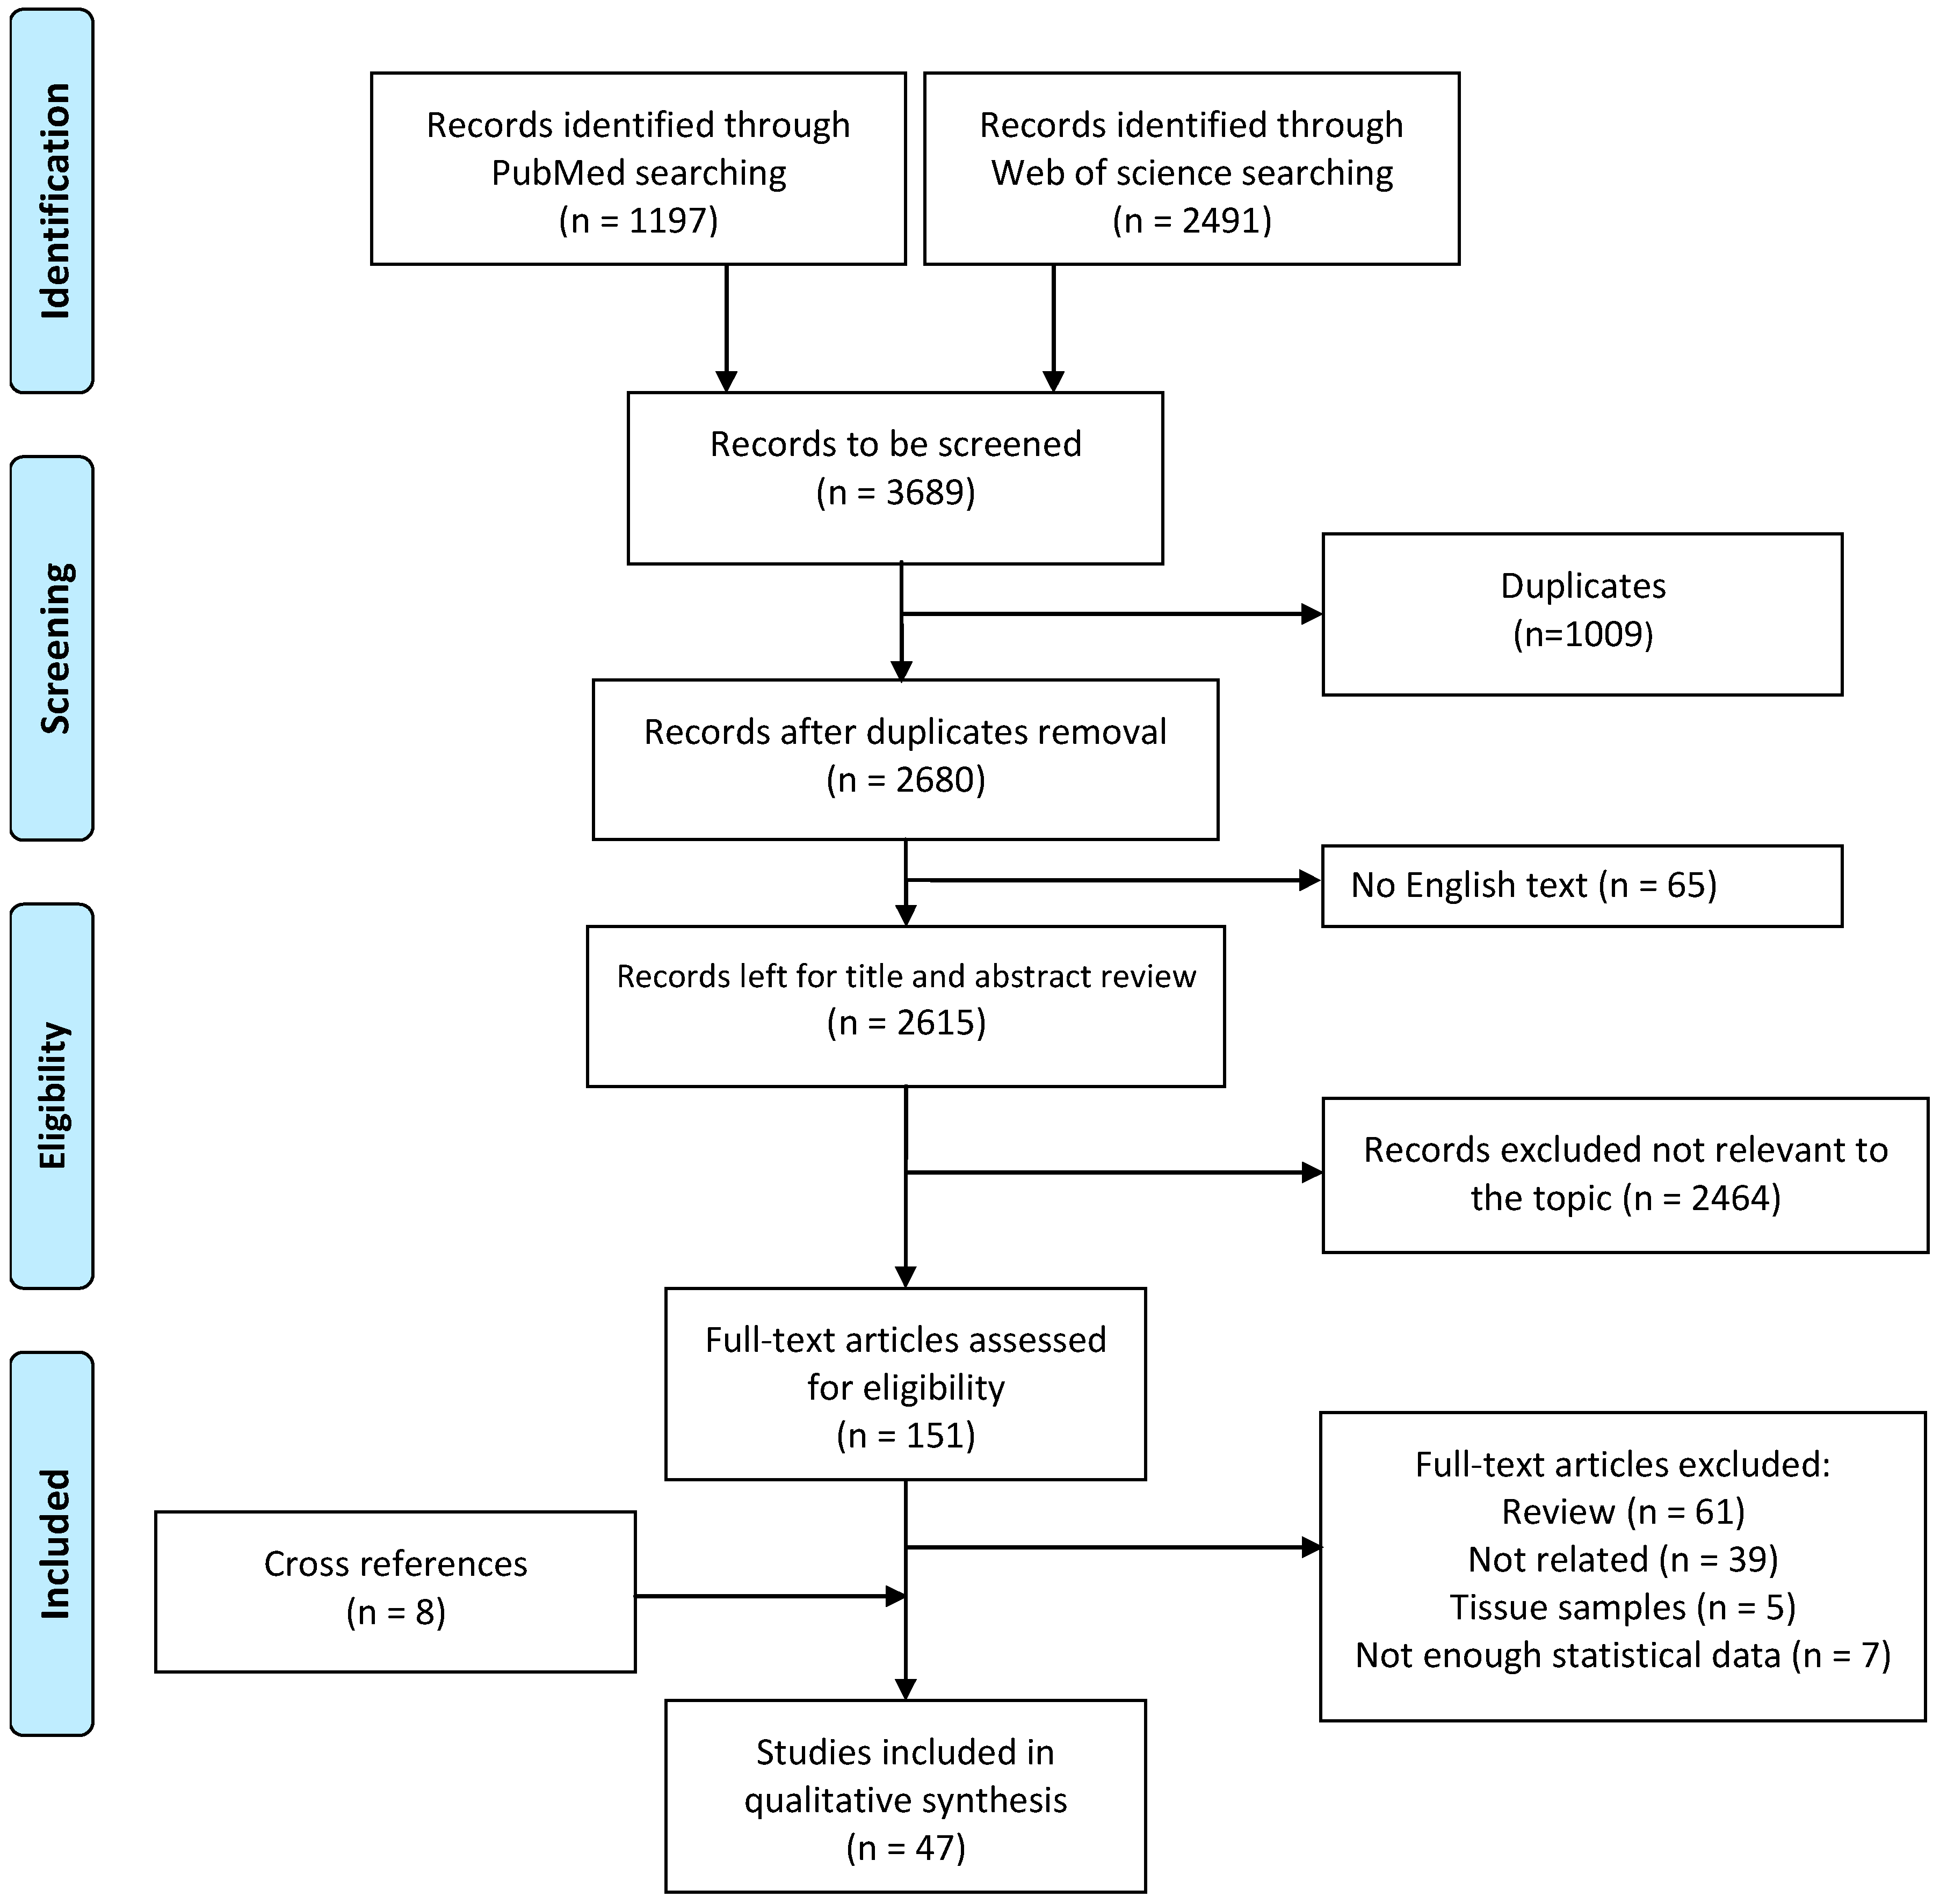
3.1. Study Selection
3.2. Study Design and Population Characteristics
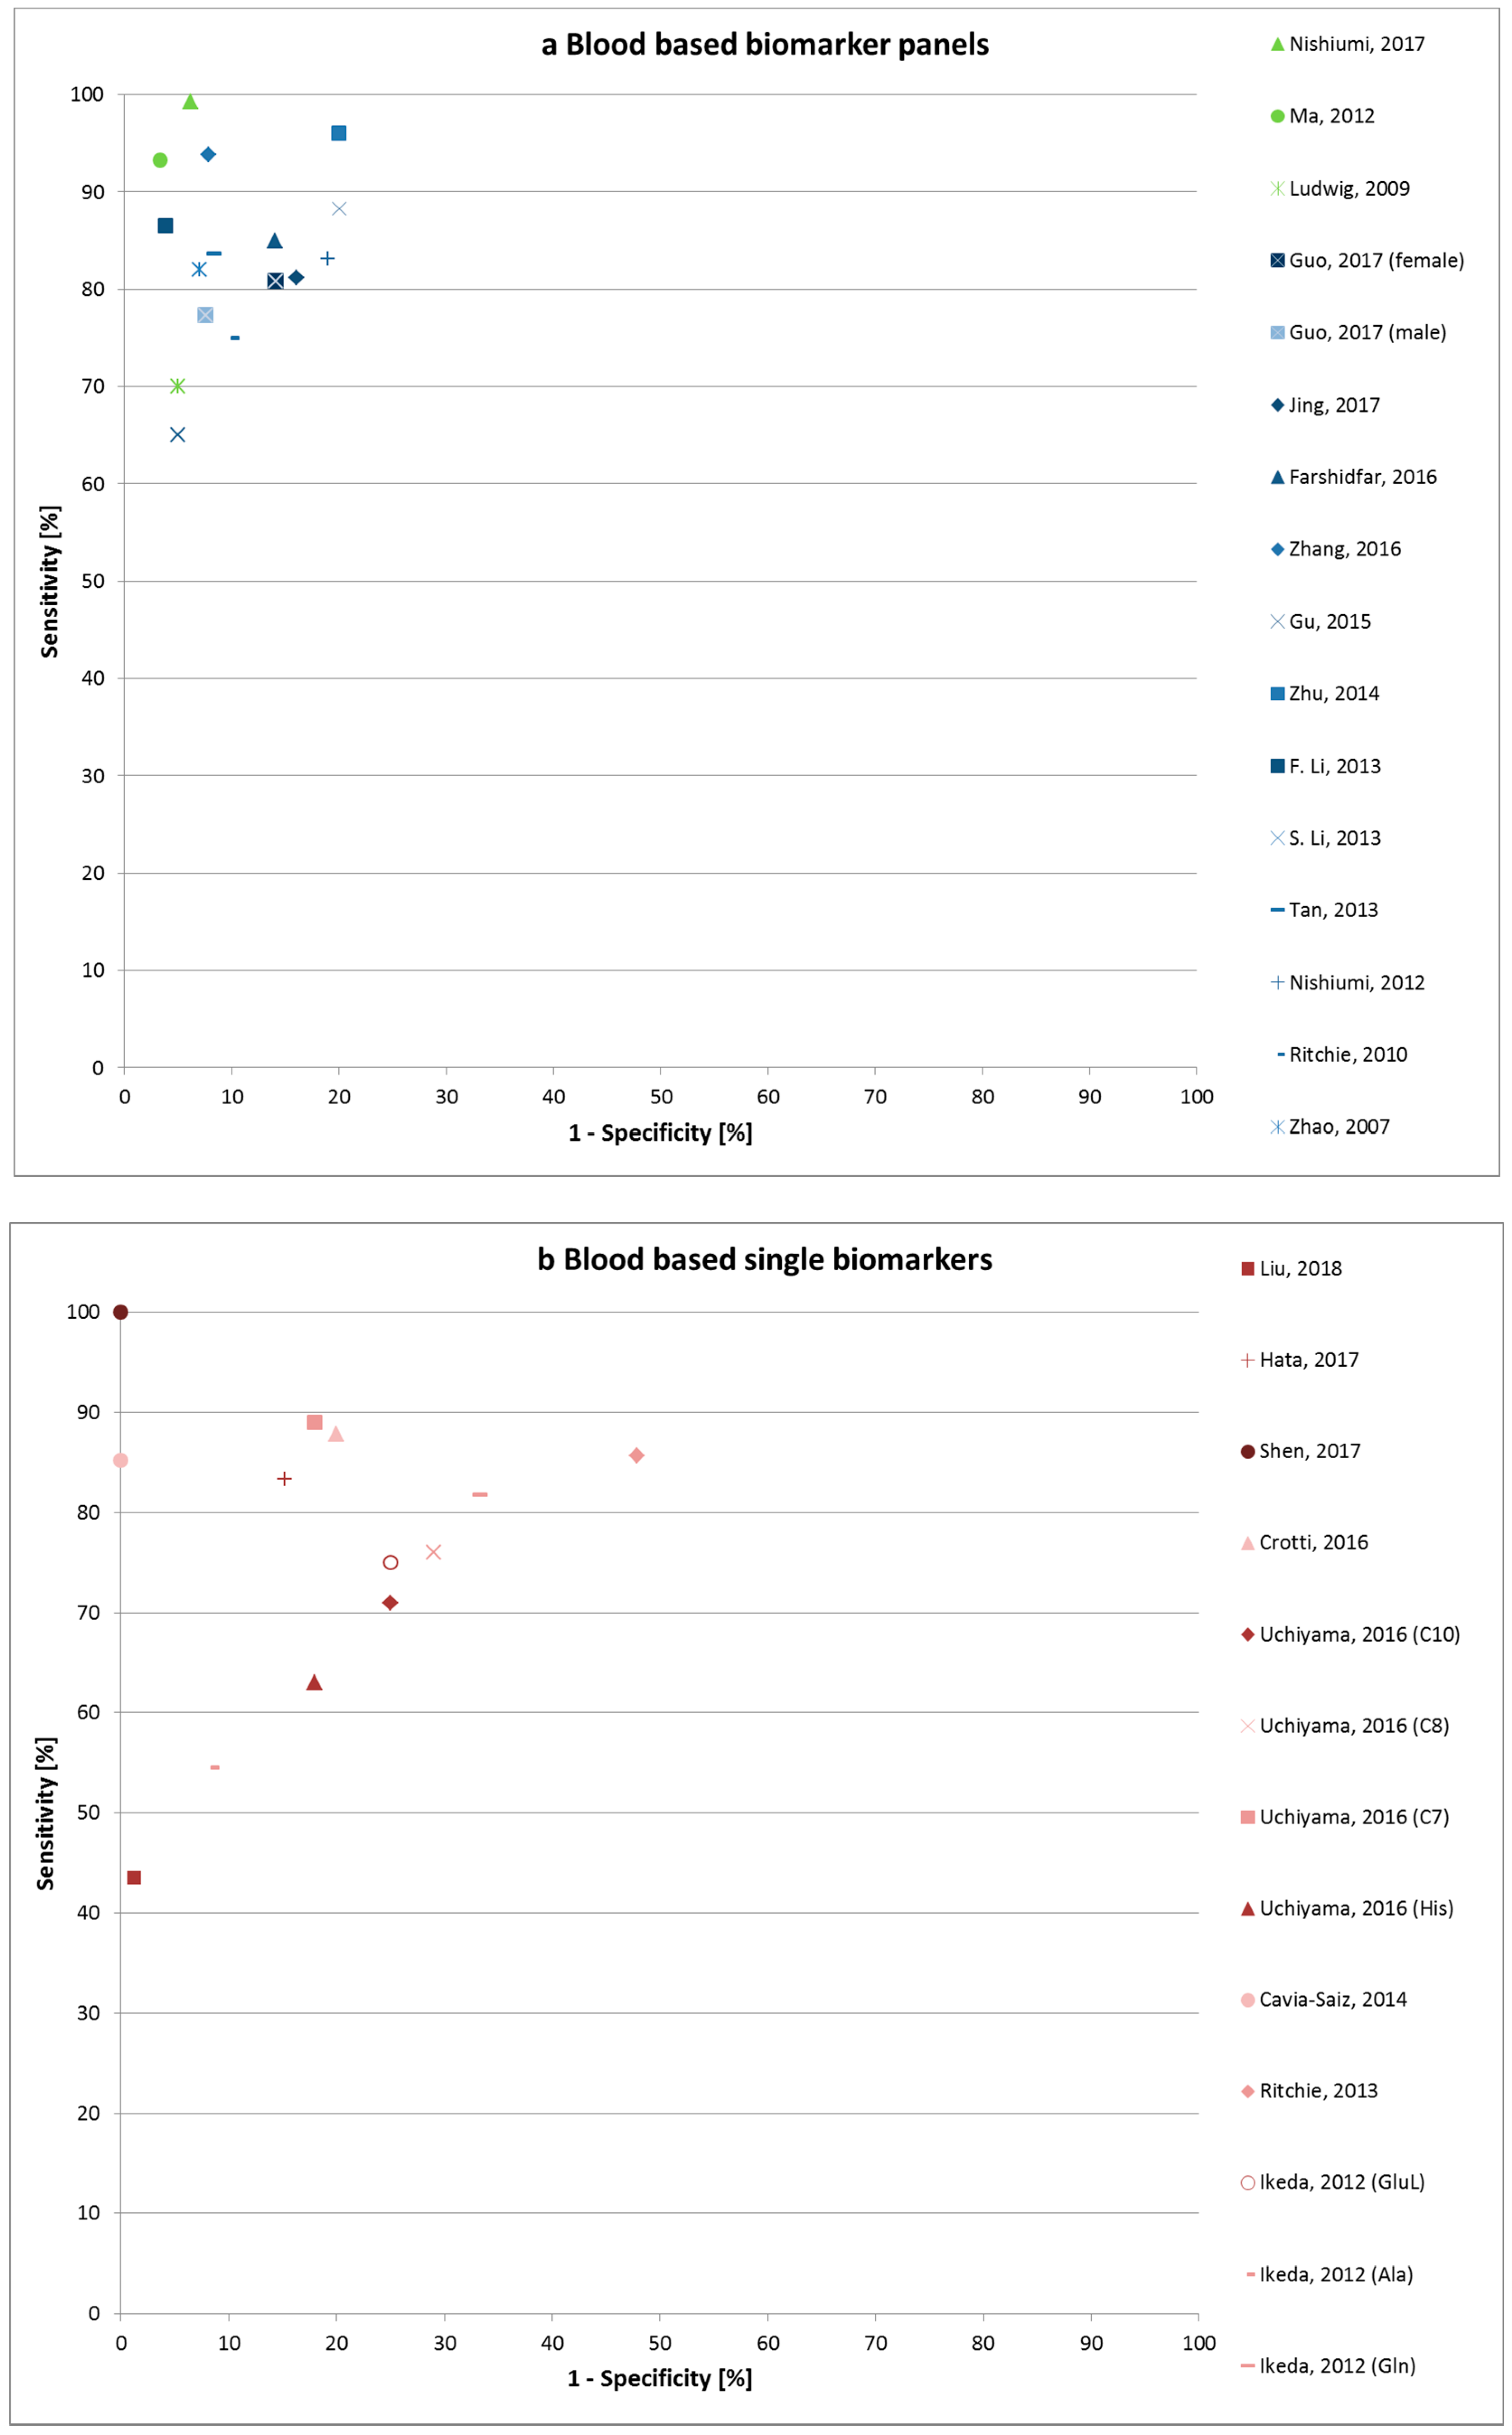
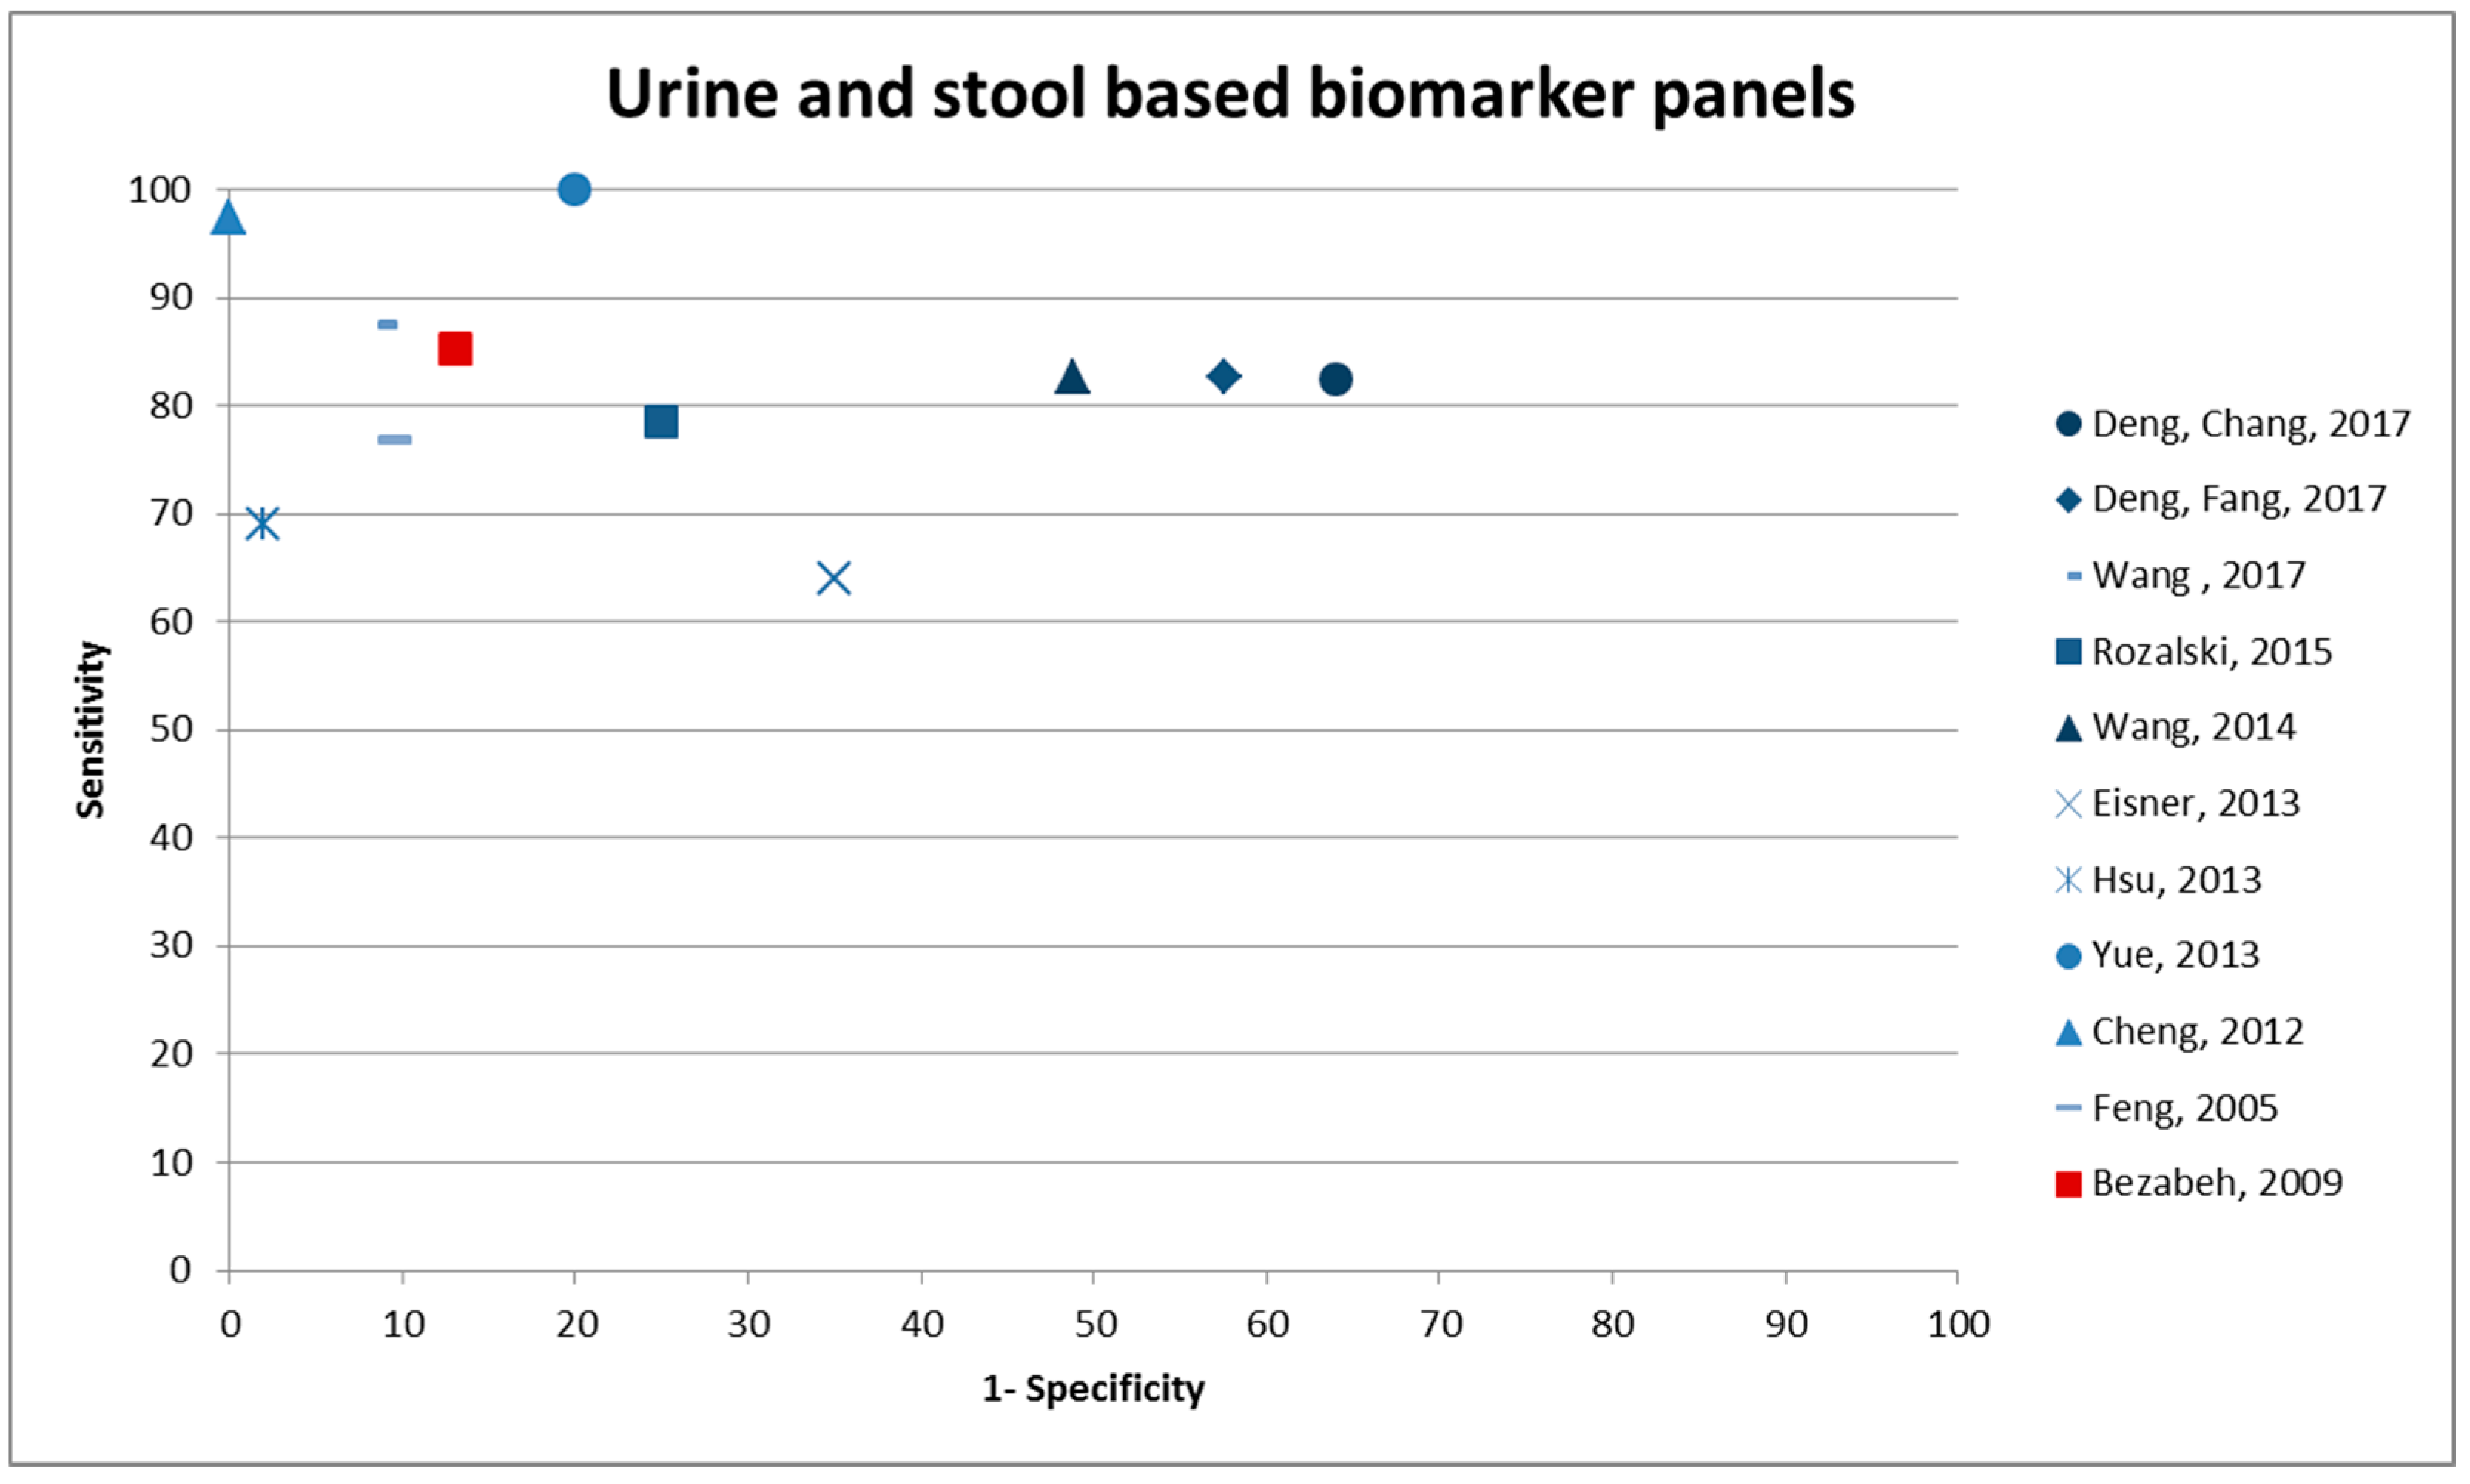
3.3. Diagnostic Performance of Potential Biomarkers
3.4. Quality Assessment of Diagnostic Accuracy Studies
4. Discussion
4.1. Metabolomic Biomarkers of Cancer
4.2. Influences on Metabolomics Profiles
4.3. Comparison of Blood versus Urine
4.4. Limitations
5. Conclusions
Supplementary Materials
Author Contributions
Funding
Conflicts of Interest
References
- Torre, L.A.; Bray, F.; Siegel, R.L.; Ferlay, J.; Lortet-Tieulent, J.; Jemal, A. Global cancer statistics, 2012. CA Cancer J. Clin. 2015, 65, 87–108. [Google Scholar] [CrossRef] [PubMed]
- Majek, O.; Gondos, A.; Jansen, L.; Emrich, K.; Holleczek, B.; Katalinic, A.; Nennecke, A.; Eberle, A.; Brenner, H.; Group, G.C.S.W. Survival from colorectal cancer in Germany in the early 21st century. Br. J. Cancer 2012, 106, 1875–1880. [Google Scholar] [CrossRef] [PubMed]
- Maida, M.; Macaluso, F.S.; Ianiro, G.; Mangiola, F.; Sinagra, E.; Hold, G.; Maida, C.; Cammarota, G.; Gasbarrini, A.; Scarpulla, G. Screening of colorectal cancer: Present and future. Expert Rev. Anticancer Ther. 2017, 17, 1131–1146. [Google Scholar] [CrossRef] [PubMed]
- Buzatto, A.Z.; de Sousa, A.C.; Guedes, S.F.; Cieslarova, Z.; Simionato, A.V. Metabolomic investigation of human diseases biomarkers by CE and LC coupled to MS. Electrophoresis 2014, 35, 1285–1307. [Google Scholar] [CrossRef] [PubMed]
- Pickhardt, P.J. Emerging stool-based and blood-based non-invasive DNA tests for colorectal cancer screening: The importance of cancer prevention in addition to cancer detection. Abdom. Radiol. 2016, 41, 1441–1444. [Google Scholar] [CrossRef] [PubMed]
- Aboud, O.A.; Weiss, R.H. New opportunities from the cancer metabolome. Clin. Chem. 2013, 59, 138–146. [Google Scholar] [CrossRef] [PubMed]
- Davis, V.W.; Bathe, O.F.; Schiller, D.E.; Slupsky, C.M.; Sawyer, M.B. Metabolomics and surgical oncology: Potential role for small molecule biomarkers. J. Surg. Oncol. 2011, 103, 451–459. [Google Scholar] [CrossRef] [PubMed]
- Altobelli, E.; Angeletti, P.M.; Latella, G. Role of urinary biomarkers in the diagnosis of adenoma and colorectal cancer: A systematic review and meta-analysis. J. Cancer 2016, 7, 1984–2004. [Google Scholar] [CrossRef] [PubMed]
- Suzuki, M.; Nishiumi, S.; Matsubara, A.; Azuma, T.; Yoshida, M. Metabolome analysis for discovering biomarkers of gastroenterological cancer. J. Chromatogr. B Anal. Technolo. Biomed. Life Sci. 2014, 966, 59–69. [Google Scholar] [CrossRef] [PubMed]
- Liesenfeld, D.B.; Habermann, N.; Owen, R.W.; Scalbert, A.; Ulrich, C.M. Review of mass spectrometry-based metabolomics in cancer research. Cancer Epidemiol. Biomark. Prev. 2013, 22, 2182–2201. [Google Scholar] [CrossRef] [PubMed]
- Zhang, A.; Sun, H.; Yan, G.; Wang, P.; Han, Y.; Wang, X. Metabolomics in diagnosis and biomarker discovery of colorectal cancer. Cancer Lett. 2014, 345, 17–20. [Google Scholar] [CrossRef] [PubMed]
- Moher, D.; Liberati, A.; Tetzlaff, J.; Altman, D.G. Preferred reporting items for systematic reviews and meta-analyses: The prisma statement. J. Clin. Epidemiol. 2009, 62, 1006–1012. [Google Scholar] [CrossRef] [PubMed]
- Whiting, P.F.; Rutjes, A.S.; Westwood, M.E.; Mallett, S.; Deeks, J.J.; Reitsma, J.B.; Leeflang, M.M.G.; Sterne, J.A.C.; Bossuyt, P.M.M.; The QUADAS-2 Group. Quadas-2: A revised tool for the quality assessment of diagnostic accuracy studies. Ann. Intern. Med. 2011, 155, 529–536. [Google Scholar] [CrossRef] [PubMed]
- Farshidfar, F.; Weljie, A.M.; Kopciuk, K.A.; Hilsden, R.; McGregor, S.E.; Buie, W.D.; MacLean, A.; Vogel, H.J.; Bathe, O.F. A validated metabolomic signature for colorectal cancer: Exploration of the clinical value of metabolomics. Br. J. Cancer 2016, 115, 848–857. [Google Scholar] [CrossRef] [PubMed]
- Phua, L.C.; Chue, X.P.; Koh, P.K.; Cheah, P.Y.; Ho, H.K.; Chan, E.C. Non-invasive fecal metabonomic detection of colorectal cancer. Cancer Biol. Ther. 2014, 15, 389–397. [Google Scholar] [CrossRef] [PubMed]
- Eisner, R.; Greiner, R.; Tso, V.; Wang, H.; Fedorak, R.N. A machine-learned predictor of colonic polyps based on urinary metabolomics. BioMed Res. Int. 2013, 2013, 303982. [Google Scholar] [CrossRef] [PubMed]
- Yue, H.; Wang, Y.; Zhang, Y.; Ren, H.; Wu, J.; Ma, L.; Liu, S.Y. A metabonomics study of colorectal cancer by rrlc-qtof/ms. J. Liq. Chromatogr. Relat. Technol. 2013, 36, 428–438. [Google Scholar]
- Jing, Y.; Wu, X.; Gao, P.; Fang, Z.; Wu, J.; Wang, Q.; Li, C.; Zhu, Z.; Cao, Y. Rapid differentiating colorectal cancer and colorectal polyp using dried blood spot mass spectrometry metabolomic approach. IUBMB life 2017, 69, 347–354. [Google Scholar] [CrossRef] [PubMed]
- Deng, L.; Fang, H.; Tso, V.K.; Sun, Y.; Foshaug, R.R.; Krahn, S.C.; Zhang, F.; Yan, Y.; Xu, H.; Chang, D.; et al. Clinical validation of a novel urine-based metabolomic test for the detection of colonic polyps on Chinese population. Int. J. Colorectal Dis. 2017, 32, 741–743. [Google Scholar] [CrossRef] [PubMed]
- Johnson, J.C.; Schmidt, C.R.; Shrubsole, M.J.; Billheimer, D.D.; Joshi, P.R.; Morrow, J.D.; Heslin, M.J.; Washington, M.K.; Ness, R.M.; Zheng, W.; et al. Urine PGE-M: A metabolite of prostaglandin E2 as a potential biomarker of advanced colorectal neoplasia. Clin. Gastroenterol. Hepatol. 2006, 4, 1358–1365. [Google Scholar] [CrossRef] [PubMed]
- Wang, W.; Feng, B.; Li, X.; Yin, P.; Gao, P.; Zhao, X.; Lu, X.; Zheng, M.; Xu, G. Urinary metabolic profiling of colorectal carcinoma based on online affinity solid phase extraction-high performance liquid chromatography and ultra performance liquid chromatography-mass spectrometry. Mol. Biosyst. 2010, 6, 1947–1955. [Google Scholar] [CrossRef] [PubMed]
- Zhang, J.J.; Yang, Q.J.; Li, J.; Zhong, Y.; Zhang, L.J.; Huang, Q.L.; Chen, B.; Mo, M.M.; Shen, S.S.; Zhong, Q.S.; et al. Distinct differences in serum eicosanoids in healthy, enteritis and colorectal cancer individuals. Metabolomics 2018, 14. [Google Scholar] [CrossRef]
- Uchiyama, K.; Yagi, N.; Mizushima, K.; Higashimura, Y.; Hirai, Y.; Okayama, T.; Yoshida, N.; Katada, K.; Kamada, K.; Handa, O.; et al. Serum metabolomics analysis for early detection of colorectal cancer. J. Gastroenterol. 2017, 52, 677–694. [Google Scholar] [CrossRef] [PubMed]
- Guo, Y.; Ren, J.; Li, X.; Liu, X.; Liu, N.; Wang, Y.; Li, Z. Simultaneous quantification of serum multi-phospholipids as potential biomarkers for differentiating different pathophysiological states of lung, stomach, intestine, and pancreas. J. Cancer 2017, 8, 2191–2204. [Google Scholar] [CrossRef] [PubMed]
- Hata, T.; Takemasa, I.; Takahashi, H.; Haraguchi, N.; Nishimura, J.; Hata, T.; Mizushima, T.; Doki, Y.; Mori, M. Downregulation of serum metabolite gta-446 as a novel potential marker for early detection of colorectal cancer. Br. J. Cancer 2017, 117, 227–232. [Google Scholar] [CrossRef] [PubMed]
- Zhang, Y.; He, C.; Qiu, L.; Wang, Y.; Qin, X.; Liu, Y.; Li, Z. Serum unsaturated free fatty acids: A potential biomarker panel for early-stage detection of colorectal cancer. J. Cancer 2016, 7, 477–483. [Google Scholar] [CrossRef] [PubMed]
- Gu, H.; Du, J.; Carnevale Neto, F.; Carroll, P.A.; Turner, S.J.; Chiorean, E.G.; Eisenman, R.N.; Raftery, D. Metabolomics method to comprehensively analyze amino acids in different domains. Analyst 2015, 140, 2726–2734. [Google Scholar] [CrossRef] [PubMed]
- Zhu, J.J.; Djukovic, D.; Deng, L.L.; Gu, H.W.; Himmati, F.; Chiorean, E.G.; Raftery, D. Colorectal cancer detection using targeted serum metabolic profiling. J. Proteome Res. 2014, 13, 4120–4130. [Google Scholar] [CrossRef] [PubMed]
- Li, F.; Qin, X.; Chen, H.; Qiu, L.; Guo, Y.; Liu, H.; Chen, G.; Song, G.; Wang, X.; Li, F.; et al. Lipid profiling for early diagnosis and progression of colorectal cancer using direct-infusion electrospray ionization fourier transform ion cyclotron resonance mass spectrometry. Rapid Commun. Mass. 2013, 27, 24–34. [Google Scholar] [CrossRef] [PubMed]
- Ritchie, S.A.; Tonita, J.; Alvi, R.; Lehotay, D.; Elshoni, H.; Myat, S.; McHattie, J.; Goodenowe, D.B. Low-serum gta-446 anti-inflammatory fatty acid levels as a new risk factor for colon cancer. Int. J. cancer 2013, 132, 355–362. [Google Scholar] [CrossRef] [PubMed]
- Tan, B.; Qiu, Y.; Zou, X.; Chen, T.; Xie, G.; Cheng, Y.; Dong, T.; Zhao, L.; Feng, B.; Hu, X.; et al. Metabonomics identifies serum metabolite markers of colorectal cancer. J. Proteome Res. 2013, 12, 3000–3009. [Google Scholar] [CrossRef] [PubMed]
- Ikeda, A.; Nishiumi, S.; Shinohara, M.; Yoshie, T.; Hatano, N.; Okuno, T.; Bamba, T.; Fukusaki, E.; Takenawa, T.; Azuma, T.; et al. Serum metabolomics as a novel diagnostic approach for gastrointestinal cancer. Biomed. Chromatogr. 2012, 26, 548–558. [Google Scholar] [CrossRef] [PubMed]
- Leichtle, A.B.; Nuoffer, J.M.; Ceglarek, U.; Kase, J.; Conrad, T.; Witzigmann, H.; Thiery, J.; Fiedler, G.M. Serum amino acid profiles and their alterations in colorectal cancer. Metabolomics 2012, 8, 643–653. [Google Scholar] [CrossRef] [PubMed]
- Ma, Y.; Zhang, P.; Wang, F.; Liu, W.; Yang, J.; Qin, H. An integrated proteomics and metabolomics approach for defining oncofetal biomarkers in the colorectal cancer. Ann. Surg. 2012, 255, 720–730. [Google Scholar] [CrossRef] [PubMed]
- Nishiumi, S.; Kobayashi, T.; Ikeda, A.; Yoshie, T.; Kibi, M.; Izumi, Y.; Okuno, T.; Hayashi, N.; Kawano, S.; Takenawa, T.; et al. A novel serum metabolomics-based diagnostic approach for colorectal cancer. PLoS ONE 2012, 7, e40459. [Google Scholar] [CrossRef] [PubMed]
- Ritchie, S.A.; Ahiahonu, P.W.; Jayasinghe, D.; Heath, D.; Liu, J.; Lu, Y.; Jin, W.; Kavianpour, A.; Yamazaki, Y.; Khan, A.M.; et al. Reduced levels of hydroxylated, polyunsaturated ultra long-chain fatty acids in the serum of colorectal cancer patients: Implications for early screening and detection. BMC Med. 2010, 8, 13–32. [Google Scholar] [CrossRef] [PubMed]
- Ludwig, C.; Ward, D.G.; Martin, A.; Viant, M.R.; Ismail, T.; Johnson, P.J.; Wakelam, M.J.; Gunther, U.L. Fast targeted multidimensional NMR metabolomics of colorectal cancer. Magn. Reson. Chem. 2009, 47 (Suppl. 1), S68–S73. [Google Scholar] [CrossRef] [PubMed]
- Liu, Z.; Cui, C.H.; Wang, X.Y.; Fernandez-Escobar, A.; Wu, Q.Z.; Xu, K.; Mao, J.J.; Jin, M.X.; Wang, K.X. Plasma levels of homocysteine and the occurrence and progression of rectal cancer. Med. Sci. Monit. 2018, 24, 1776–1783. [Google Scholar] [CrossRef] [PubMed]
- Nishiumi, S.; Kobayashi, T.; Kawana, S.; Unno, Y.; Sakai, T.; Okamoto, K.; Yamada, Y.; Sudo, K.; Yamaji, T.; Saito, Y.; et al. Investigations in the possibility of early detection of colorectal cancer by gas chromatography/triple-quadrupole mass spectrometry. Oncotarget 2017, 8, 17115–17126. [Google Scholar] [CrossRef] [PubMed]
- Shen, S.; Yang, L.; Li, L.; Bai, Y.; Cai, C.; Liu, H. A plasma lipidomics strategy reveals perturbed lipid metabolic pathways and potential lipid biomarkers of human colorectal cancer. J. Chromatogr. B Anal. Technol. Biomed. Life Sci. 2017, 1068–1069, 41–48. [Google Scholar] [CrossRef] [PubMed]
- Crotti, S.; Agnoletto, E.; Cancemi, G.; Di Marco, V.; Traldi, P.; Pucciarelli, S.; Nitti, D.; Agostini, M. Altered plasma levels of decanoic acid in colorectal cancer as a new diagnostic biomarker. Anal. Bioanal. Chem. 2016, 408, 6321–6328. [Google Scholar] [CrossRef] [PubMed]
- Cavia-Saiz, M.; Muniz Rodriguez, P.; Llorente Ayala, B.; Garcia-Gonzalez, M.; Coma-Del Corral, M.J.; Garcia Giron, C. The role of plasma ido activity as a diagnostic marker of patients with colorectal cancer. Mol. Biol. Rep. 2014, 41, 2275–2279. [Google Scholar] [CrossRef] [PubMed]
- Li, S.; Guo, B.; Song, J.W.; Deng, X.L.; Cong, Y.S.; Li, P.F.; Zhao, K.; Liu, L.H.; Xiao, G.; Xu, F.; et al. Plasma choline-containing phospholipids: Potential biomarkers for colorectal cancer progression. Metabolomics 2013, 9, 202–212. [Google Scholar] [CrossRef]
- Miyagi, Y.; Higashiyama, M.; Gochi, A.; Akaike, M.; Ishikawa, T.; Miura, T.; Saruki, N.; Bando, E.; Kimura, H.; Imamura, F.; et al. Plasma free amino acid profiling of five types of cancer patients and its application for early detection. PLoS ONE 2011, 6, e24143. [Google Scholar] [CrossRef] [PubMed]
- Okamoto, N.; Miyagi, Y.; Chiba, A.; Akaike, M.; Shiozawa, M.; Imaizumi, A.; Yamamoto, H.; Ando, T.; Yamakodo, M.; Tochikubo, O. Diagnostic modeling with differences in plasma amino acid profiles between non-cachectic colorectal/breast cancer patients and healthy individuals. Int. J. Med. Med. Sci. 2009, 1, 1–8. [Google Scholar]
- Zhao, Z.; Xiao, Y.; Elson, P.; Tan, H.; Plummer, S.J.; Berk, M.; Aung, P.P.; Lavery, I.C.; Achkar, J.P.; Li, L.; et al. Plasma lysophosphatidylcholine levels: Potential biomarkers for colorectal cancer. J. Clin. Oncol. 2007, 25, 2696–2701. [Google Scholar] [CrossRef] [PubMed]
- Nakajima, T.; Katsumata, K.; Kuwabara, H.; Soya, R.; Enomoto, M.; Ishizaki, T.; Tsuchida, A.; Mori, M.; Hiwatari, K.; Soga, T.; et al. Urinary polyamine biomarker panels with machine-learning differentiated colorectal cancers, benign disease, and healthy controls. Int. J. Mol. Sci. 2018, 19. [Google Scholar] [CrossRef] [PubMed]
- Deng, L.; Chang, D.; Foshaug, R.R.; Eisner, R.; Tso, V.K.; Wishart, D.S.; Fedorak, R.N. Development and validation of a high-throughput mass spectrometry based urine metabolomic test for the detection of colonic adenomatous polyps. Metabolites 2017, 7. [Google Scholar] [CrossRef] [PubMed]
- Wang, Z.; Lin, Y.; Liang, J.; Huang, Y.; Ma, C.; Liu, X.; Yang, J. Nmr-based metabolomic techniques identify potential urinary biomarkers for early colorectal cancer detection. Oncotarget 2017, 8, 105819–105831. [Google Scholar] [CrossRef] [PubMed]
- Rozalski, R.; Gackowski, D.; Siomek-Gorecka, A.; Starczak, M.; Modrzejewska, M.; Banaszkiewicz, Z.; Olinski, R. Urinary 5-hydroxymethyluracil and 8-oxo-7,8-dihydroguanine as potential biomarkers in patients with colorectal cancer. Biomarkers 2015, 20, 287–291. [Google Scholar] [CrossRef] [PubMed]
- Wang, H.; Tso, V.; Wong, C.; Sadowski, D.; Fedorak, R.N. Development and validation of a highly sensitive urine-based test to identify patients with colonic adenomatous polyps. Clin. Transl. Gastroenterol. 2014, 5, e54. [Google Scholar] [CrossRef] [PubMed]
- Hsu, W.Y.; Chen, C.J.; Huang, Y.C.; Tsai, F.J.; Jeng, L.B.; Lai, C.C. Urinary nucleosides as biomarkers of breast, colon, lung, and gastric cancer in Taiwanese. PLoS ONE 2013, 8, e81701. [Google Scholar] [CrossRef] [PubMed]
- Chen, J.L.; Fan, J.; Yan, L.S.; Guo, H.Q.; Xiong, J.J.; Ren, Y.; Hu, J.D. Urine metabolite profiling of human colorectal cancer by capillary electrophoresis mass spectrometry based on MRB. Gastroenterol. Res. Pract. 2012. [Google Scholar] [CrossRef] [PubMed]
- Cheng, Y.; Xie, G.; Chen, T.; Qiu, Y.; Zou, X.; Zheng, M.; Tan, B.; Feng, B.; Dong, T.; He, P.; et al. Distinct urinary metabolic profile of human colorectal cancer. J. Proteome Res. 2012, 11, 1354–1363. [Google Scholar] [CrossRef] [PubMed]
- Feng, B.; Zheng, M.H.; Zheng, Y.F.; Lu, A.G.; Li, J.W.; Wang, M.L.; Ma, J.J.; Xu, G.W.; Liu, B.Y.; Zhu, Z.G. Normal and modified urinary nucleosides represent novel biomarkers for colorectal cancer diagnosis and surgery monitoring. J. Gastroenterol. Hepatol. 2005, 20, 1913–1919. [Google Scholar] [CrossRef] [PubMed]
- Hiramatsu, K.; Takahashi, K.; Yamaguchi, T.; Matsumoto, H.; Miyamoto, H.; Tanaka, S.; Tanaka, C.; Tamamori, Y.; Imajo, M.; Kawaguchi, M.; et al. N(1),n(12)-diacetylspermine as a sensitive and specific novel marker for early- and late-stage colorectal and breast cancers. Clin. Cancer Res. 2005, 11, 2986–2990. [Google Scholar] [CrossRef] [PubMed]
- Zheng, Y.F.; Yang, J.; Zhao, X.J.; Feng, B.; Kong, H.W.; Chen, Y.J.; Lv, S.; Zheng, M.H.; Xu, G.W. Urinary nucleosides as biological markers for patients with colorectal cancer. World J. Gastroenterol. 2005, 11, 3871–3876. [Google Scholar] [CrossRef] [PubMed]
- Lin, Y.; Ma, C.; Liu, C.; Wang, Z.; Yang, J.; Liu, X.; Shen, Z.; Wu, R. Nmr-based fecal metabolomics fingerprinting as predictors of earlier diagnosis in patients with colorectal cancer. Oncotarget 2016, 7, 29454–29464. [Google Scholar] [CrossRef] [PubMed]
- Amiot, A.; Dona, A.C.; Wijeyesekera, A.; Tournigand, C.; Baumgaertner, I.; Lebaleur, Y.; Sobhani, I.; Holmes, E. (1)h nmr spectroscopy of fecal extracts enables detection of advanced colorectal neoplasia. J. Proteome Res. 2015, 14, 3871–3881. [Google Scholar] [CrossRef] [PubMed]
- Bezabeh, T.; Somorjai, R.; Dolenko, B.; Bryskina, N.; Levin, B.; Bernstein, C.N.; Jeyarajah, E.; Steinhart, A.H.; Rubin, D.T.; Smith, I.C. Detecting colorectal cancer by 1h magnetic resonance spectroscopy of fecal extracts. NMR Biomed. 2009, 22, 593–600. [Google Scholar] [CrossRef] [PubMed]
- Wishart, D.S. Is cancer a genetic disease or a metabolic disease? EBioMedicine 2015, 2, 478–479. [Google Scholar] [CrossRef] [PubMed]
- Nagrath, D.; Caneba, C.; Karedath, T.; Bellance, N. Metabolomics for mitochondrial and cancer studies. Biochim. Biophys. 2011, 1807, 650–663. [Google Scholar] [CrossRef] [PubMed]
- Bro, R.; Nielsen, H.J.; Savorani, F.; Kjeldahl, K.; Christensen, I.J.; Brunner, N.; Lawaetz, A.J. Data fusion in metabolomic cancer diagnostics. Metabolomics 2013, 9, 3–8. [Google Scholar] [CrossRef] [PubMed]
- Patel, N.R.; McPhail, M.J.; Shariff, M.I.; Keun, H.C.; Taylor-Robinson, S.D. Biofluid metabonomics using (1)h nmr spectroscopy: The road to biomarker discovery in gastroenterology and hepatology. Expert Rev. Gastroenterol. Hepatol. 2012, 6, 239–251. [Google Scholar] [CrossRef] [PubMed]
- Garcia-Perez, I.; Posma, J.M.; Gibson, R.; Chambers, E.S.; Hansen, T.H.; Vestergaard, H.; Hansen, T.; Beckmann, M.; Pedersen, O.; Elliott, P.; et al. Objective assessment of dietary patterns by use of metabolic phenotyping: A randomised, controlled, crossover trial. Lancet Diabetes Endocrinol. 2017, 5, 184–195. [Google Scholar] [CrossRef]
- Floegel, A.; von Ruesten, A.; Drogan, D.; Schulze, M.B.; Prehn, C.; Adamski, J.; Pischon, T.; Boeing, H. Variation of serum metabolites related to habitual diet: A targeted metabolomic approach in epic-potsdam. Eur. J. Clin. Nutr. 2013, 67, 1100–1108. [Google Scholar] [CrossRef] [PubMed]
- Weir, T.L.; Manter, D.K.; Sheflin, A.M.; Barnett, B.A.; Heuberger, A.L.; Ryan, E.P. Stool microbiome and metabolome differences between colorectal cancer patients and healthy adults. PLoS ONE 2013, 8, e70803. [Google Scholar] [CrossRef] [PubMed]
- Cipe, G.; Idiz, U.O.; Firat, D.; Bektasoglu, H. Relationship between intestinal microbiota and colorectal cancer. World J. Gastrointest. Oncol. 2015, 7, 233–240. [Google Scholar] [CrossRef] [PubMed]
- Sobhani, I.; Tap, J.; Roudot-Thoraval, F.; Roperch, J.P.; Letulle, S.; Langella, P.; Corthier, G.; Tran Van Nhieu, J.; Furet, J.P. Microbial dysbiosis in colorectal cancer (crc) patients. PLoS ONE 2011, 6, e16393. [Google Scholar] [CrossRef] [PubMed]
- Goedert, J.J.; Gong, Y.; Hua, X.; Zhong, H.; He, Y.; Peng, P.; Yu, G.; Wang, W.; Ravel, J.; Shi, J.; et al. Fecal microbiota characteristics of patients with colorectal adenoma detected by screening: A population-based study. EBioMedicine 2015, 2, 597–603. [Google Scholar] [CrossRef] [PubMed]
- Gu, F.; Derkach, A.; Freedman, N.D.; Landi, M.T.; Albanes, D.; Weinstein, S.J.; Mondul, A.M.; Matthews, C.E.; Guertin, K.A.; Xiao, Q.; et al. Cigarette smoking behaviour and blood metabolomics. Int. J. Epidemiol. 2016, 45, 1421–1432. [Google Scholar] [CrossRef] [PubMed]
- Cross, A.J.; Boca, S.; Freedman, N.D.; Caporaso, N.E.; Huang, W.Y.; Sinha, R.; Sampson, J.N.; Moore, S.C. Metabolites of tobacco smoking and colorectal cancer risk. Carcinogenesis 2014, 35, 1516–1522. [Google Scholar] [CrossRef] [PubMed]
- Liang, P.S.; Chen, T.Y.; Giovannucci, E. Cigarette smoking and colorectal cancer incidence and mortality: Systematic review and meta-analysis. Int. J. Cancer 2009, 124, 2406–2415. [Google Scholar] [CrossRef] [PubMed]
- Tsoi, K.K.; Pau, C.Y.; Wu, W.K.; Chan, F.K.; Griffiths, S.; Sung, J.J. Cigarette smoking and the risk of colorectal cancer: A meta-analysis of prospective cohort studies. Clin. Gastroenterol. Hepatol. 2009, 7, 682–688. [Google Scholar] [CrossRef] [PubMed]
- Wolin, K.Y.; Yan, Y.; Colditz, G.A. Physical activity and risk of colon adenoma: A meta-analysis. Br. J. Cancer 2011, 104, 882–885. [Google Scholar] [CrossRef] [PubMed]
- Boyle, T.; Keegel, T.; Bull, F.; Heyworth, J.; Fritschi, L. Physical activity and risks of proximal and distal colon cancers: A systematic review and meta-analysis. J. Natl. Cancer Inst. 2012, 104, 1548–1561. [Google Scholar] [CrossRef] [PubMed]
- Daskalaki, E.; Easton, C.; Watson, D.G. The application of metabolomic profiling to the effects of physical activity. Curr. Metab. 2014, 2, 233–263. [Google Scholar] [CrossRef]
- Smith, R.; Ventura, D.; Prince, J.T. Controlling for confounding variables in ms-omics protocol: Why modularity matters. Brief. Bioinform. 2014, 15, 768–770. [Google Scholar] [CrossRef] [PubMed]
- Thevenot, E.A.; Roux, A.; Xu, Y.; Ezan, E.; Junot, C. Analysis of the human adult urinary metabolome variations with age, body mass index, and gender by implementing a comprehensive workflow for univariate and opls statistical analyses. J. Proteome Res. 2015, 14, 3322–3335. [Google Scholar] [CrossRef] [PubMed]
- Kosmides, A.K.; Kamisoglu, K.; Calvano, S.E.; Corbett, S.A.; Androulakis, I.P. Metabolomic fingerprinting: Challenges and opportunities. Crit. Rev. Biomed. Eng. 2013, 41, 205–221. [Google Scholar] [CrossRef] [PubMed]
- Siskos, A.P.; Jain, P.; Romisch-Margl, W.; Bennett, M.; Achaintre, D.; Asad, Y.; Marney, L.; Richardson, L.; Koulman, A.; Griffin, J.L.; et al. Interlaboratory reproducibility of a targeted metabolomics platform for analysis of human serum and plasma. Anal. Chem. 2017, 89, 656–665. [Google Scholar] [CrossRef] [PubMed]
- Tighe, P.J.; Ryder, R.R.; Todd, I.; Fairclough, L.C. Elisa in the multiplex era: Potentials and pitfalls. Proteom. Clin. Appl. 2015, 9, 406–422. [Google Scholar] [CrossRef] [PubMed]
- Rotter, M.; Brandmaier, S.; Prehn, C.; Adam, J.; Rabstein, S.; Gawrych, K.; Bruning, T.; Illig, T.; Lickert, H.; Adamski, J.; et al. Stability of targeted metabolite profiles of urine samples under different storage conditions. Metabolomics 2017, 13, 4. [Google Scholar] [CrossRef] [PubMed]
- Anton, G.; Wilson, R.; Yu, Z.; Prehn, C.; Zukunft, S.; Adamski, J.; Heier, M.; Meisinger, C.; Römisch-Margl, W.; Wang-Sattler, R.; et al. Pre-analytical sample quality: Metabolite ratios as an intrinsic marker for prolonged room temperature exposure of serum samples. PLoS ONE 2015, 10. [Google Scholar] [CrossRef] [PubMed]
- Breier, M.; Wahl, S.; Prehn, C.; Fugmann, M.; Ferrari, U.; Weise, M.; Banning, F.; Seissler, J.; Grallert, H.; Adamski, J.; et al. Targeted metabolomics identifies reliable and stable metabolites in human serum and plasma samples. PLoS ONE 2014, 9, e89728. [Google Scholar] [CrossRef] [PubMed]
- Cuhadar, S.; Koseoglu, M.; Atay, A.; Dirican, A. The effect of storage time and freeze-thaw cycles on the stability of serum samples. Biochem. Med. 2013, 23, 70–77. [Google Scholar] [CrossRef]
- Floegel, A.; Drogan, D.; Wang-Sattler, R.; Prehn, C.; Illig, T.; Adamski, J.; Joost, H.G.; Boeing, H.; Pischon, T. Reliability of serum metabolite concentrations over a 4-month period using a targeted metabolomic approach. PLoS ONE 2011, 6, e21103. [Google Scholar] [CrossRef] [PubMed]
- Kühn, T.; Sookthai, D.; Rolle-Kampczyk, U.; Otto, W.; von Bergen, M.; Kaaks, R.; Johnson, T. Mid- and long-term correlations of plasma metabolite concentrations measured by a targeted metabolomics approach. Metabolomics 2016, 12, 184. [Google Scholar] [CrossRef]
- Gupta, A.K.; Brenner, D.E.; Turgeon, D.K. Early detection of colon cancer: New tests on the horizon. Mol. Diagn. Ther. 2008, 12, 77–85. [Google Scholar] [CrossRef] [PubMed]
- Issaq, H.J.; Waybright, T.J.; Veenstra, T.D. Cancer biomarker discovery: Opportunities and pitfalls in analytical methods. Electrophoresis 2011, 32, 967–975. [Google Scholar] [CrossRef] [PubMed]
- Ni, Y.; Xie, G.; Jia, W. Metabonomics of human colorectal cancer: New approaches for early diagnosis and biomarker discovery. J. Proteome Res. 2014, 13, 3857–3870. [Google Scholar] [CrossRef] [PubMed]
- Yu, Z.; Kastenmuller, G.; He, Y.; Belcredi, P.; Moller, G.; Prehn, C.; Mendes, J.; Wahl, S.; Roemisch-Margl, W.; Ceglarek, U.; et al. Differences between human plasma and serum metabolite profiles. PLoS ONE 2011, 6, e21230. [Google Scholar] [CrossRef] [PubMed]
- Psychogios, N.; Hau, D.D.; Peng, J.; Guo, A.C.; Mandal, R.; Bouatra, S.; Sinelnikov, I.; Krishnamurthy, R.; Eisner, R.; Gautam, B.; et al. The human serum metabolome. PLoS ONE 2011, 6, e16957. [Google Scholar] [CrossRef] [PubMed]
- O'Connell, T.M. Recent advances in metabolomics in oncology. Bioanalysis 2012, 4, 431–451. [Google Scholar] [CrossRef] [PubMed]
- Lindon, J.C.; Nicholson, J.K.; Holmes, E.; Keun, H.C.; Craig, A.; Pearce, J.T.; Bruce, S.J.; Hardy, N.; Sansone, S.A.; Antti, H.; et al. Summary recommendations for standardization and reporting of metabolic analyses. Nat. Biotechnol. 2005, 23, 833–838. [Google Scholar] [PubMed]
- Claudino, W.M.; Goncalves, P.H.; di Leo, A.; Philip, P.A.; Sarkar, F.H. Metabolomics in cancer: A bench-to-bedside intersection. Crit. Rev. Oncol. Hematol. 2012, 84, 1–7. [Google Scholar] [CrossRef] [PubMed]


| Characteristics of the Studies | Training Set (if Applicable) | Validation Set (if Applicable) | |||||||||
|---|---|---|---|---|---|---|---|---|---|---|---|
| First Author, Year | Study Type Country | Study Group | Population n | Age (Range/SD) | Male (%) | Stage (0)/I/II/III/IV/(?) | Population n | Age (Range/SD) | Male (%) | Stage (0)/I/II/III/IV/(?) | |
| Dried blood spot | |||||||||||
| 1 | Jing, 2017 [18] | Case-control Japan | CRC P | 85 81 | 61.0 (22–92) 57.9 (29–79) | 59 58 | 10/22/31/22 | ||||
| Serum | |||||||||||
| 2 | Zhang, 2018 [22] | Case-control China | CRC Enteritis Cn | 55 34 52 | 63.5 (±4.2) 56.9 (±8.2) 60.8 (±6.4) | 56 56 38 | n.a. | ||||
| 3 | Guo, 2017 [24] | Case-control China | CRC Cn | 144 144 | 62 ± 11/63 ± 9 62 ± 11/63 ± 10 | 46 46 | I + II/III + IV/(?) 58/77/(9) | ||||
| 4 | Hata, 2017 [25] | Case-control China | CRC Cn | 225 916 | n.a. n.a. | 60 62 | (21)/70/49/71/13/(1) | ||||
| 5 | Uchiyama, 2017 [23] | Case-control Japan | CRC A Cn | 56 59 60 | 70.4 1 69.9 (±8.2) 67.7 (±9.2) | 50 51 50 | 14/14/14/14 | ||||
| 6 | Farshidfar, 2016 [14] | Case-control Canada | CRC A Cn | 320 31 254 | n.a. 59.5 (±6.0) 61.7 (±9.3) | n.a. 68 58 | 47/60/71/142 | ||||
| 7 | Zhang, 2016 [26] | Case-control China | CRC BCD Cn | 59 0 69 | 59.1 (±11.4) n.a. 57.9 (±10.4) | 58 n.a. 52 | 1/3/23/15 | 80 55 116 | 59.5 (±10.3) 58.2 (±10.9) 58.9 (±10.4) | 45 62 62 | 21/14/23/14 |
| 8 | Gu, 2015 [27] | Case-control USA | CRC Cn | 28 28 | 56 med (29–88) 58 med (18–80) | 50 50 | 1/2/6/19 | ||||
| 9 | Zhu, 2014 [28] | Case-control USA | CRC P Cn | 66 76 92 | 58 med (27–88) 56 med (37–86) 57 med (18–80) | 45 49 49 | I + II/III/IV 21/17/28 | ||||
| 10 | F. Li, 2013 [29] | Case-control China | CRC Cn | 52 52 | 56 med (24–91) 52 med (22–88) | 54 54 | Early/late 26/26 | ||||
| 11 | Ritchie, 2013 [30] | Screening Canada | CRC Cn | 98 4825 | 57 med (18–92) 2 | 45 2 | 30/22/34/12 | ||||
| 12 | Tan, 2013 [31] | Case-control China | CRC Cn | 62 62 | 60.1 (24–82) 59.4 (31–75) | 55 45 | 16/25/17/4 | 39 40 | 61.8 (36–80) 55.9 (35–76) | 59 0 | 10/18/9/2 |
| 13 | Ikeda, 2012 [32] | Case-control Japan | CRC Cn | 12 12 | 71.3 med (63–83) 58.5 med (45–74) | 67 42 | 3/4/5/0 | ||||
| 14 | Leichtle, 2012 [33] | Case-control Germany | CRC Cn | 59 58 | 59 med (45–90) 58 med (38–75) | 63 45 | 5/18/20/16 | ||||
| 15 | Ma, 2012 [34] | Case-control China | CRC Cn | 30 30 | 65.03 mean (53–72) 64.97 mean (53–72) | 60 60 | 3/13/8/6 | ||||
| 16 | Nishiumi, 2012 [35] | Case-control Japan | CRC Cn | 60 60 | 67.7 mean (36–88) 64.5 mean (39–88) | 65 65 | (12)/12/12/12/12 | 59 63 | 64.8 mean (31–84) 62.8 mean (47–73) | 51 51 | (15)/11/3/11/19 |
| 17 | Ritchie, 2010 [36] | Case-control Japan, USA | CRC Cn | 112 110 | 62.0 (28–90) 3 n.a. | 56 36 | 23/38/35/11/(5) | 110 110 | 69.2 (35–91) 3 55.8 (26–86) 3 | 57 59 | 0+I/II/III/IV/(?) 22/39/36/9/(4) |
| 18 | Ludwig, 2009 [37] | Case-control UK | CRC +A Cn | 38 19 | 67 (±13) 63 (±10) | n.a. n.a. | A + B/C + D 18/20 (+ 8 A) | ||||
| Plasma | |||||||||||
| 19 | Liu, 2018 [38] | Case-control China | RC A Cn | 155 85 80 | 57.0 (±11.8) 55.0 (±10.9) 51.2 (±12.5) | 51 26 24 | 32/38/50/35 | ||||
| 20 | Nishiumi, 2017 [39] | Case-control Japan | CRC Cn | 282 291 | 67.0 mean (40–93) 66.8 mean (41–88) | 60 61 | (79)/80/123/0/0 | ||||
| 21 | Shen, 2017 [40] | Case-control China | CRC Cn | 25 10 | n.a. (31–80) n.a. (18–22) | 64 50 | n.a. | ||||
| 22 | Crotti, 2016 [41] | Case-control Italy | CRC Cn | 48 20 | 67 (49–90) 62 (35–83) | 56 50 | 11/9/16/12 | ||||
| 23 | Cavia-Saiz, 2014 [42] | Case-control Spain | CRC Cn | 78 4 70 | n.a. n.a. | 69 n.a. | I + II/III/IV 11/24/43/4 | ||||
| 24 | S. Li, 2013 [43] | Case-control China | CRC AP Cn | 120 120 120 | 55.7 (±11.8) 54.5 (±14.2) 55.7 (±7.5) | 59 63 68 | I + II/III + IV/(?) 15/93/(12) | ||||
| 25 | Miyagi, 2011 [44] | Case-control Japan | CRC P Cn | 199 34 995 | 63.7 (±9.5) 55.3 (±7.9) 62.4 (±9.5) | 57 21 57 | (8)/63/48/59/19/(2) | ||||
| 26 | Okamoto, 2009 [45] | Case-control Japan | CRC Cn | 49 49 | 64.1 (40-78) 59.6 (40–69) | 78 78 | (2)/7/19/14/6/(1) | 13 54 | 57.5 (33–75) 55.8 (40–69) | 31 26 | 2/3/8/0 |
| 27 | Zhao, 2007 [46] | Case-control USA | CRC Cn | 89 83 | 62.0 (±14.1) 46.3 (±15.4) | 64 45 | I + II/III + IV/(?) 37/49/(3) | 44 42 | 62.9 (±10.5) 45.4 (±16.6) | 70 48 | I+II/III+IV/(?) 16/26/(1) |
| Urine | |||||||||||
| 28 | Nakajima, 2018 [47] | Case-control Japan | CRC Benign Cn | 201 14 17 | 68.7 (±0.8) 65.0 (±3.1) 42.1 (±2.8) | 58 79 76 | (1)/27/28/109/34 Tis 2 | ||||
| 29 | Deng, Chang, 2017 [48] | Screening Canada | CRC/A Cn + HPP | 1/154 530 | 59.9 mean (±7.4) 56.1 mean (±8.2) | 61 42 | n.a. | ||||
| 30 | Deng, Fang, 2017 [19] | Screening China | A Cn | 345 316 | 65.1 mean (±6.6) 61.8 mean (±7.4) | 57 26 | n.a. | ||||
| 31 | Wang, 2017 [49] | Case-control China | CRC Cn | 55 40 | n.a. (27-84) 59 (28-78) | 47 48 | I + II/III + IV 23/32 | ||||
| 32 | Rozalski, 2015 [50] | Case-control Poland | CRC A Cn | 56 15 72 | 65 med 66 med 54 med | 58 53 41 | n.a. | ||||
| 33 | Wang, 2014 [51] | Screening Canada | A Cn | 162 422 | 59.1 (±0.6) 55.7 (±0.4) | 59 43 | n.a. | 81 211 | 60.4 (±0.8) 56.1 (±0.6) | 62 42 | n.a. |
| 34 | Eisner, 2013 [16] | Screening Canada | HPP/A/ CRC Cn | 110/243/2 633 | 58.9 mean (±8.2) 56.2 mean (±8.1) | 55 42 | n.a. | ||||
| 35 | Hsu, 2013 [52] | Case-control China | CRC Cn | 26 45 | 65.3 (±14.0) n.a. | 46 n.a. | 3/6/10/7 | ||||
| 36 | Yue, 2013 [17] | Case-control China | CRC Cn | 29 10 | n.a. n.a. | n.a. n.a. | n.a. | ||||
| 37 | Chen, 2012 [53] | Case-control China | CRC Cn | 20 14 | n.a. (37–87) 68 med (50–86) | 50 57 | I + II/III + IV 8/12 | ||||
| 38 | Cheng, 2012 [54] | Case-control China | CRC Cn | 61 62 | 59 med (24–83) 60 med (31–75) | 58 50 | 15/25/17/4 | 40 41 | 63.5 med (36–80) 57 med (35–76) | 60 0 | 9/20/10/1 |
| 39 | Wang, 2010 [21] | Case-control China | CRC BCT Cn | 50 34 34 | n.a. n.a. n.a. | n.a. n.a. n.a. | n.a. | ||||
| 40 | Johnson, 2006 [20] | Case-control USA | CRC BCD Cn | 58 28 72 | 60.9 (±10.0) 38.8 (±11.7) 60.9 (±7.5) | 55 46 74 | n.a. | ||||
| 41 | Feng, 2005 [55] | Case-control China | CRC Cn | 52 62 | 63 med (26–87) 59 med (24–78) | 52 53 | A/B/C/D 5/22/18/7 | ||||
| 42 | Hiramatsu, 2005 [56] | Case-control Japan | CRC BGD Cn | 248 51 52 | n.a. n.a. (22–52) | n.a. n.a. 52 | (20)/40/60/107/21 | ||||
| 43 | Zheng, 2005 [57] | Case-control China | CRC A Cn | 52 10 60 | 60.0 med (26–87) n.a. 52 med (21–71) | 56 n.a. 52 | 7/23/15/7 | ||||
| Feces | |||||||||||
| 44 | Lin, 2016 [58] | Case-control China | CRC Cn | 68 32 | 56 (±21) 57 (±23) | 53 47 | I + II/III/IV 20/2523 | ||||
| 45 | Amiot, 2015 [59] | Cohort France | ACN Cn | 33 22 | 59.4 med (±6.9) 52.0 med (±12.0) | 76 68 | n.a. | ||||
| 46 | Phua, 2014 [15] | Case-control China | CRC Cn | 11 10 | 64.5 mean (56–80) 57.4 mean (48–79) | 64 40 | A/B/C/D 0/6/5/0 | ||||
| 47 | Bezabeh, 2009 [60] | Screening China | CRC Cn | 111 412 | n.a. n.a. | n.a. n.a. | n.a. n.a. | ||||
| First Author, Year | Metabolites | Diagnostic Performance | |||||||||||
|---|---|---|---|---|---|---|---|---|---|---|---|---|---|
| Outcomes | Am A/ | FA | CH | Others | Sn | Sp | AUC-No | AUC with Validation | p-Value | ||||
| Pep | Validation | SS | CV | BS | EV | ||||||||
| Biomarker panels | |||||||||||||
| Dried blood spot | |||||||||||||
| Jing, 2017 [18] | CRC | 4 | 4 | 0 | 0 | 81.2 | 84.0 | 0.91 | <0.05 | ||||
| Serum | |||||||||||||
| Zhang, 2018 [22] | CRC | 0 | 2 | 0 | 0 | n.a. | n.a. | 0.90 | <0.05 | ||||
| Guo, 2017 [24] | CRC ♂ CRC ♀ | 0 0 | 5 2 | 0 0 | 0 0 | 77.3 80.8 | 92.4 85.9 | 0.90 0.90 | n.a. n.a. | ||||
| Farshidfar, 2016 [14] | CRC | 9 | 7 | 12 | 13 | 85.0 | 86.0 | 0.91 | 0.91 | <0.00001 | |||
| Y. Zhang, 2016 [26] | CRC | 0 | 6 | 0 | 0 | 93.8 | 92.2 | 0.98 | <0.001 | ||||
| H. Gu, 2015 [27] | CRC | 8 | 0 | 0 | 0 | 65.0 | 95.0 | 0.91 | <0.05 | ||||
| Zhu, 2014 [28] | CRC | 7 | 3 | 3 | 0 | 96.0 | 80.0 | 0.93 | 0.93 1 | <0.05 | |||
| F. Li, 2013 [29] | CRC | 0 | 9 | 0 | 0 | 86.5 | 96.2 | 0.96 | <0.05 | ||||
| Tan, 2013 [31] | CRC | 6 | 1 | 3 | 0 | 83.7 | 91.7 | n.a. | <0.05 | ||||
| Ma, 2012 [34] | CRC | 3 | 0 | 3 | 0 | 93.3 2 | 96.7 2 | n.a. | <0.05 | ||||
| Nishiumi, 2012 [35] | CRC | 3 | 0 | 1 | 0 | 83.1 | 81.0 | n.a. | <0.05 | ||||
| Ritchie, 2010 [36] | CRC | 0 | 3 | 0 | 0 | 75.0 | 90.0 | 0.91 | <0.05 | ||||
| Ludwig, 2009 [37] | CRC | 0 | 1 | 4 | 0 | 70.0 | 95.0 | n.a. | n.a. | ||||
| Plasma | |||||||||||||
| Nishiumi, 2017 [39] | Stage 0/I/II | 3 | 3 | 2 | 0 | 99.3 | 93.8 | 1.00 | 0.000781 | ||||
| S. Li, 2013 [43] | CRC | 0 | 3 | 0 | 0 | 88.3 | 80.0 | n.a. | <0.05 | ||||
| Miyagi, 2011 [44] | CRC | 10 | 0 | 0 | 0 | n.a. | n.a. | 0.87 3 | <0.001 | ||||
| Okamoto, 2009 [45] | CRC | 6 | 0 | 0 | 0 | n.a. | n.a. | 0.91 | <0.05 | ||||
| Zhao, 2007 [46] | CRC | 0 | 4 | 0 | 0 | 82.0 | 93.0 | n.a. | <0.001 | ||||
| Urine | |||||||||||||
| Nakajima, 2018 [47] | CRC | 2 | 0 | 0 | 0 | n.a. | n.a. | 0.79 | <0.0001 | ||||
| Deng, Chang, 2017 [48] | AP | 0 | 1 | 2 | 0 | 82.4 4 | 36.0 4 | 0.69 | <0.05 | ||||
| Deng, Fang, 2017 [19] | AP | 7 | 2 | 8 | 0 | 82.6 | 42.4 | 0.72 | n.a. | ||||
| Wang, 2017 [49] | CRC I/II | 3 | 0 | 1 | 0 | 87.5 | 91.3 | 0.93 | <0.01 | ||||
| Rozalski, 2015 [50] | CRC | 0 | 0 | 3 | 0 | 78.6 | 75.0 | 0.78 | <0.0001 | ||||
| Wang, 2014 [51] | AP | 7 | 2 | 8 | 0 | 82.7 | 51.2 | n.a. | n.a. | <0.05 | |||
| Eisner, 2013 [16] | P | 2 | 0 | 2 | 0 | 64.0 | 65.0 | 0.72 | <0.01 | ||||
| Hsu, 2013 [52] | CRC | 0 | 0 | 6 | 0 | 69.0 | 98.0 | n.a. | <0.01 | ||||
| Yue, 2013 [17] | CRC | 0 | 9 | 0 | 1 | 100.0 | 80.0 | n.a. | <0.05 | ||||
| Chen, 2012 [53] | CRC | 8 | 0 | 4 | 0 | n.a. | n.a. | 1.00 | <0.01 | ||||
| Cheng, 2012 [54] | CRC | 4 | 1 | 2 | 0 | 97.5 | 100.0 | 1.00 | 1.00 | <0.001 | |||
| Wang, 2010 [21] | CRC | 4 0 | 5 0 | 0 7 | 0 0 | n.a. n.a | n.a n.a | 0.96 0.89 | <0.05 <0.05 | ||||
| Feng, 2005 [55] | CRC | 0 | 0 | 2 | 0 | 71.2 | 93.3 | n.a. | <0.01 | ||||
| Zheng, 2005 [57] | CRC | 0 | 0 | 14 | 0 | 71.0 | 96.0 | n.a. | <0.05 | ||||
| Feces | |||||||||||||
| Amiot, 2015 [59] | ACN | 2 | 4 | 1 | 0 | n.a. | n.a. | 0.94 | <0.0001 | ||||
| Phua, 2014 [15] | CRC | 0 | 1 | 2 | 0 | n.a. | n.a. | 1.00 | <0.05 | ||||
| Bezabeh, 2009 [60] | CRC | 3 | 2 | 0 | 0 | 85.2 | 86.9 | 0.92 | 0.92 3 | n.a. | |||
| Single markers | |||||||||||||
| Serum | |||||||||||||
| Hata, 2017 [25] | CRC | 0 | 1 | 0 | 0 | 83.3 | 84.8 | 0.91 | <0.05 | ||||
| Uchiyama, 2017 [23] | CRC | 0 0 0 1 His | 1 C7 1 C8 1 C10 0 | 0 0 0 0 | 0 0 0 0 | 89.0 76.0 71.0 63.0 | 82.0 71.0 75.0 82.0 | 0.89 0.83 0.79 0.74 | <0.01 <0.01 <0.01 <0.01 | ||||
| Ritchie, 2013 [30] | CRC | 0 | 1 | 0 | 0 | 85.7 | ~52.1 5 | n.a. | <0.05 | ||||
| Ikeda, 2012 [32] | CRC | 1 Ala 0 1 Gln | 0 0 0 | 0 1 GluL 0 | 0 0 0 | 54.5 75.0 81.8 | 91.6 75.0 66.7 | n.a. | <0.05 | ||||
| Leichtle, 2012 [33] | CRC | 1 | 0 | 0 | 0 | n.a. | n.a. | 0.71 | <0.001 | ||||
| Plasma | |||||||||||||
| Liu, 2018 [38] | RC/A | 1 | 0 | 0 | 0 | 43.5 | 98.8 | 0.71 | <0.05 | ||||
| Shen, 2017 [40] | CRC | 0 0 | 1 PG 1 SM | 0 0 | 0 0 | 1.00 1.00 | 1.00 1.00 | 1.00 1.00 | <0.05 <0.05 | ||||
| Crotti, 2016 [41] | CRC | 0 | 1 | 0 | 0 | 87.8 | 80.0 | 0.82 | <0.01 | ||||
| Cavia-Saiz, 2014 [42] | CRC | 1 | 0 | 0 | 0 | 85.2 | 100.0 | 0.92 | <0.001 | ||||
| Urine | |||||||||||||
| Johnson, 2006 [20] | CRC | 0 | 1 | 0 | 0 | 90.0 | 45.0 | 0.64 | <0.05 | ||||
| Hiramatsu, 2005 [56] | CRC | 1 | 0 | 0 | 0 | 75.8 | 96.0 | n.a. | <0.0001 | ||||
| Feces | |||||||||||||
| Lin, 2016 [58] | Early stage | 0 0 | 1 Ace 1 Suc | 0 0 | 0 0 | 94.7 91.2 | 92.3 93.5 | 0.99 0.94 | 0.99 0.94 | <0.001 <0.001 | |||
| First Author, Year | Amino Acids | Carbo- Hydrates | Fatty Acids | ||||||||||||||||||
|---|---|---|---|---|---|---|---|---|---|---|---|---|---|---|---|---|---|---|---|---|---|
| Alanine | Arginine | Aspartate Aspartic acid | Glutamate Glutamic acid | Glutamine | Glycine | Histidine | Leucine Isoleucine | Lysine | Methionine | Ornithine | Phenylalanine | Proline /Hydroxyproline | (allo) Threonine Threonic acid | Tryptophan | Tyrosine | Valine | Lactate Lactic acid | Pyruvate Pyruvic acid | 2/3-Hydroxy-butyrate 3-Hydroxy-butyric acid | 18:2 LPC | |
| Liu, 2018 [38] | |||||||||||||||||||||
| Zhang, 2018 [22] | |||||||||||||||||||||
| Guo, 2017 [24] | |||||||||||||||||||||
| Hata, 2017 [25] | |||||||||||||||||||||
| Jing, 2017 [18] | ↓ | ↓ | ↑R | ↑R | ↓ | ||||||||||||||||
| Nishiumi, 2017 [39] | ↓ | ↑ | ↓ | ↑ | |||||||||||||||||
| Uchiyama, 2017 [23] | ↓ | ||||||||||||||||||||
| Shen, 2017 [40] | |||||||||||||||||||||
| Crotti, 2016 [41] | |||||||||||||||||||||
| Farshidfar, 2016 [14] | ↑ | ↑ | ↑ | ↑ | ↑ | ↑ | ↑ | ↑ | |||||||||||||
| Zhang, 2016 [26] | |||||||||||||||||||||
| Gu, 2015 [27] | ↓ | ↑ | ↑ | ↓ | ↓ | ↓R | ↓ | ||||||||||||||
| Cavia-Saiz, 2014 [42] | |||||||||||||||||||||
| Zhu, 2014 [28] | ↓ | ↓ | ↓ | ↓ | ↑ | ||||||||||||||||
| F. Li, 2013 [29] | ↓ | ||||||||||||||||||||
| S. Li, 2013 [43] | → | ||||||||||||||||||||
| Tan, 2013 [31] | ↓ | ↓ | ↓ | ↓ | ↓ | ↑ | |||||||||||||||
| Ikeda, 2012 [32] | ↑ | → | ↑ | → | → | → | → | ||||||||||||||
| Leichtle, 2012 [33] | ↓ | ↓ | ↓ | ↓ | ↓ | ↓ | ↓ | ↓ | ↓ | ↓ | |||||||||||
| Ma, 2012 [34] | ↓ | ↓ | ↓ | ↑ | |||||||||||||||||
| Nishiumi, 2012 [35] | ↑ | ↑ | |||||||||||||||||||
| Miyagi, 2011 [44] | ↑ | ↓ | ↓ | ↑ | ↑ | ↓ | ↓ | ↓ | |||||||||||||
| Ritchie, 2010 [36] | |||||||||||||||||||||
| Ludwig, 2009 [37] | → | → | → | ||||||||||||||||||
| Okamoto, 2009 [45] | ↑ | ↑ | ↑ | ↓ | ↓ | ||||||||||||||||
| Zhao, 2007 [46] | ↓ | ||||||||||||||||||||
| First Author, Year | Amino Acids | Carbohydrates | ||||||||
|---|---|---|---|---|---|---|---|---|---|---|
| Histidine | Serine | Trigonelline | Tyrosine | Acetone | Cytidine | Methyladenosine | Methanol | 2,2,-Methylguanosine | Pseudouridine | |
| Nakajima, 2018 [47] | ||||||||||
| Deng, Chang, 2017 [48] | ||||||||||
| Deng, Fang, 2017 [19] | → | ↓ | → | → | → | → | ||||
| Wang, 2017 [49] | ||||||||||
| Rozalski, 2015 [50] | ||||||||||
| Wang, 2014 [51] | → | ↓ | → | → | → | → | ||||
| Eisner, 2013 [16] | ↑ | ↑ | ↓ | ↓ | ||||||
| Hsu, 2013 [52] | ↑ | ↑ | ||||||||
| Yue, 2013 [17] | ||||||||||
| Chen, 2012 [53] | ↓ | ↓ | ||||||||
| Cheng, 2012 [54] | ||||||||||
| Wang, 2010 [21] | ↑ | ↑ | ↑ | ↑ | ||||||
| Johnson, 2006 [20] | ||||||||||
| Feng, 2005 [55] | ↑ | |||||||||
| Hiramatsu, 2005 [56] | ||||||||||
| Zheng, 2005 [57] | ↑ | ↑ | ↑ | ↑ | ||||||
| First Author, Year | Amino Acids | CH | Fatty Acids | |||||
|---|---|---|---|---|---|---|---|---|
| Glutamate Glutamic acid | Glutamine | Isoleucine | Valine | β-Glucose | Acetate | Butyrate Butyric acid | Propionate | |
| Lin, 2016 [58] | ↓ | ↓ | ↑ | ↓ | ↓ | ↓ | ↑ | ↑ |
| Amiot, 2015 [59] | ↓ | ↓ | ↓ | ↑ | ↓ | ↑ | ||
| Phua, 2014 [15] | ||||||||
| Bezabeh, 2009 [60] | → | → | → | → | ||||
© 2018 by the authors. Licensee MDPI, Basel, Switzerland. This article is an open access article distributed under the terms and conditions of the Creative Commons Attribution (CC BY) license (http://creativecommons.org/licenses/by/4.0/).
Share and Cite
Erben, V.; Bhardwaj, M.; Schrotz-King, P.; Brenner, H. Metabolomics Biomarkers for Detection of Colorectal Neoplasms: A Systematic Review. Cancers 2018, 10, 246. https://doi.org/10.3390/cancers10080246
Erben V, Bhardwaj M, Schrotz-King P, Brenner H. Metabolomics Biomarkers for Detection of Colorectal Neoplasms: A Systematic Review. Cancers. 2018; 10(8):246. https://doi.org/10.3390/cancers10080246
Chicago/Turabian StyleErben, Vanessa, Megha Bhardwaj, Petra Schrotz-King, and Hermann Brenner. 2018. "Metabolomics Biomarkers for Detection of Colorectal Neoplasms: A Systematic Review" Cancers 10, no. 8: 246. https://doi.org/10.3390/cancers10080246
APA StyleErben, V., Bhardwaj, M., Schrotz-King, P., & Brenner, H. (2018). Metabolomics Biomarkers for Detection of Colorectal Neoplasms: A Systematic Review. Cancers, 10(8), 246. https://doi.org/10.3390/cancers10080246