Localization Microscopy Analyses of MRE11 Clusters in 3D-Conserved Cell Nuclei of Different Cell Lines


 and
and 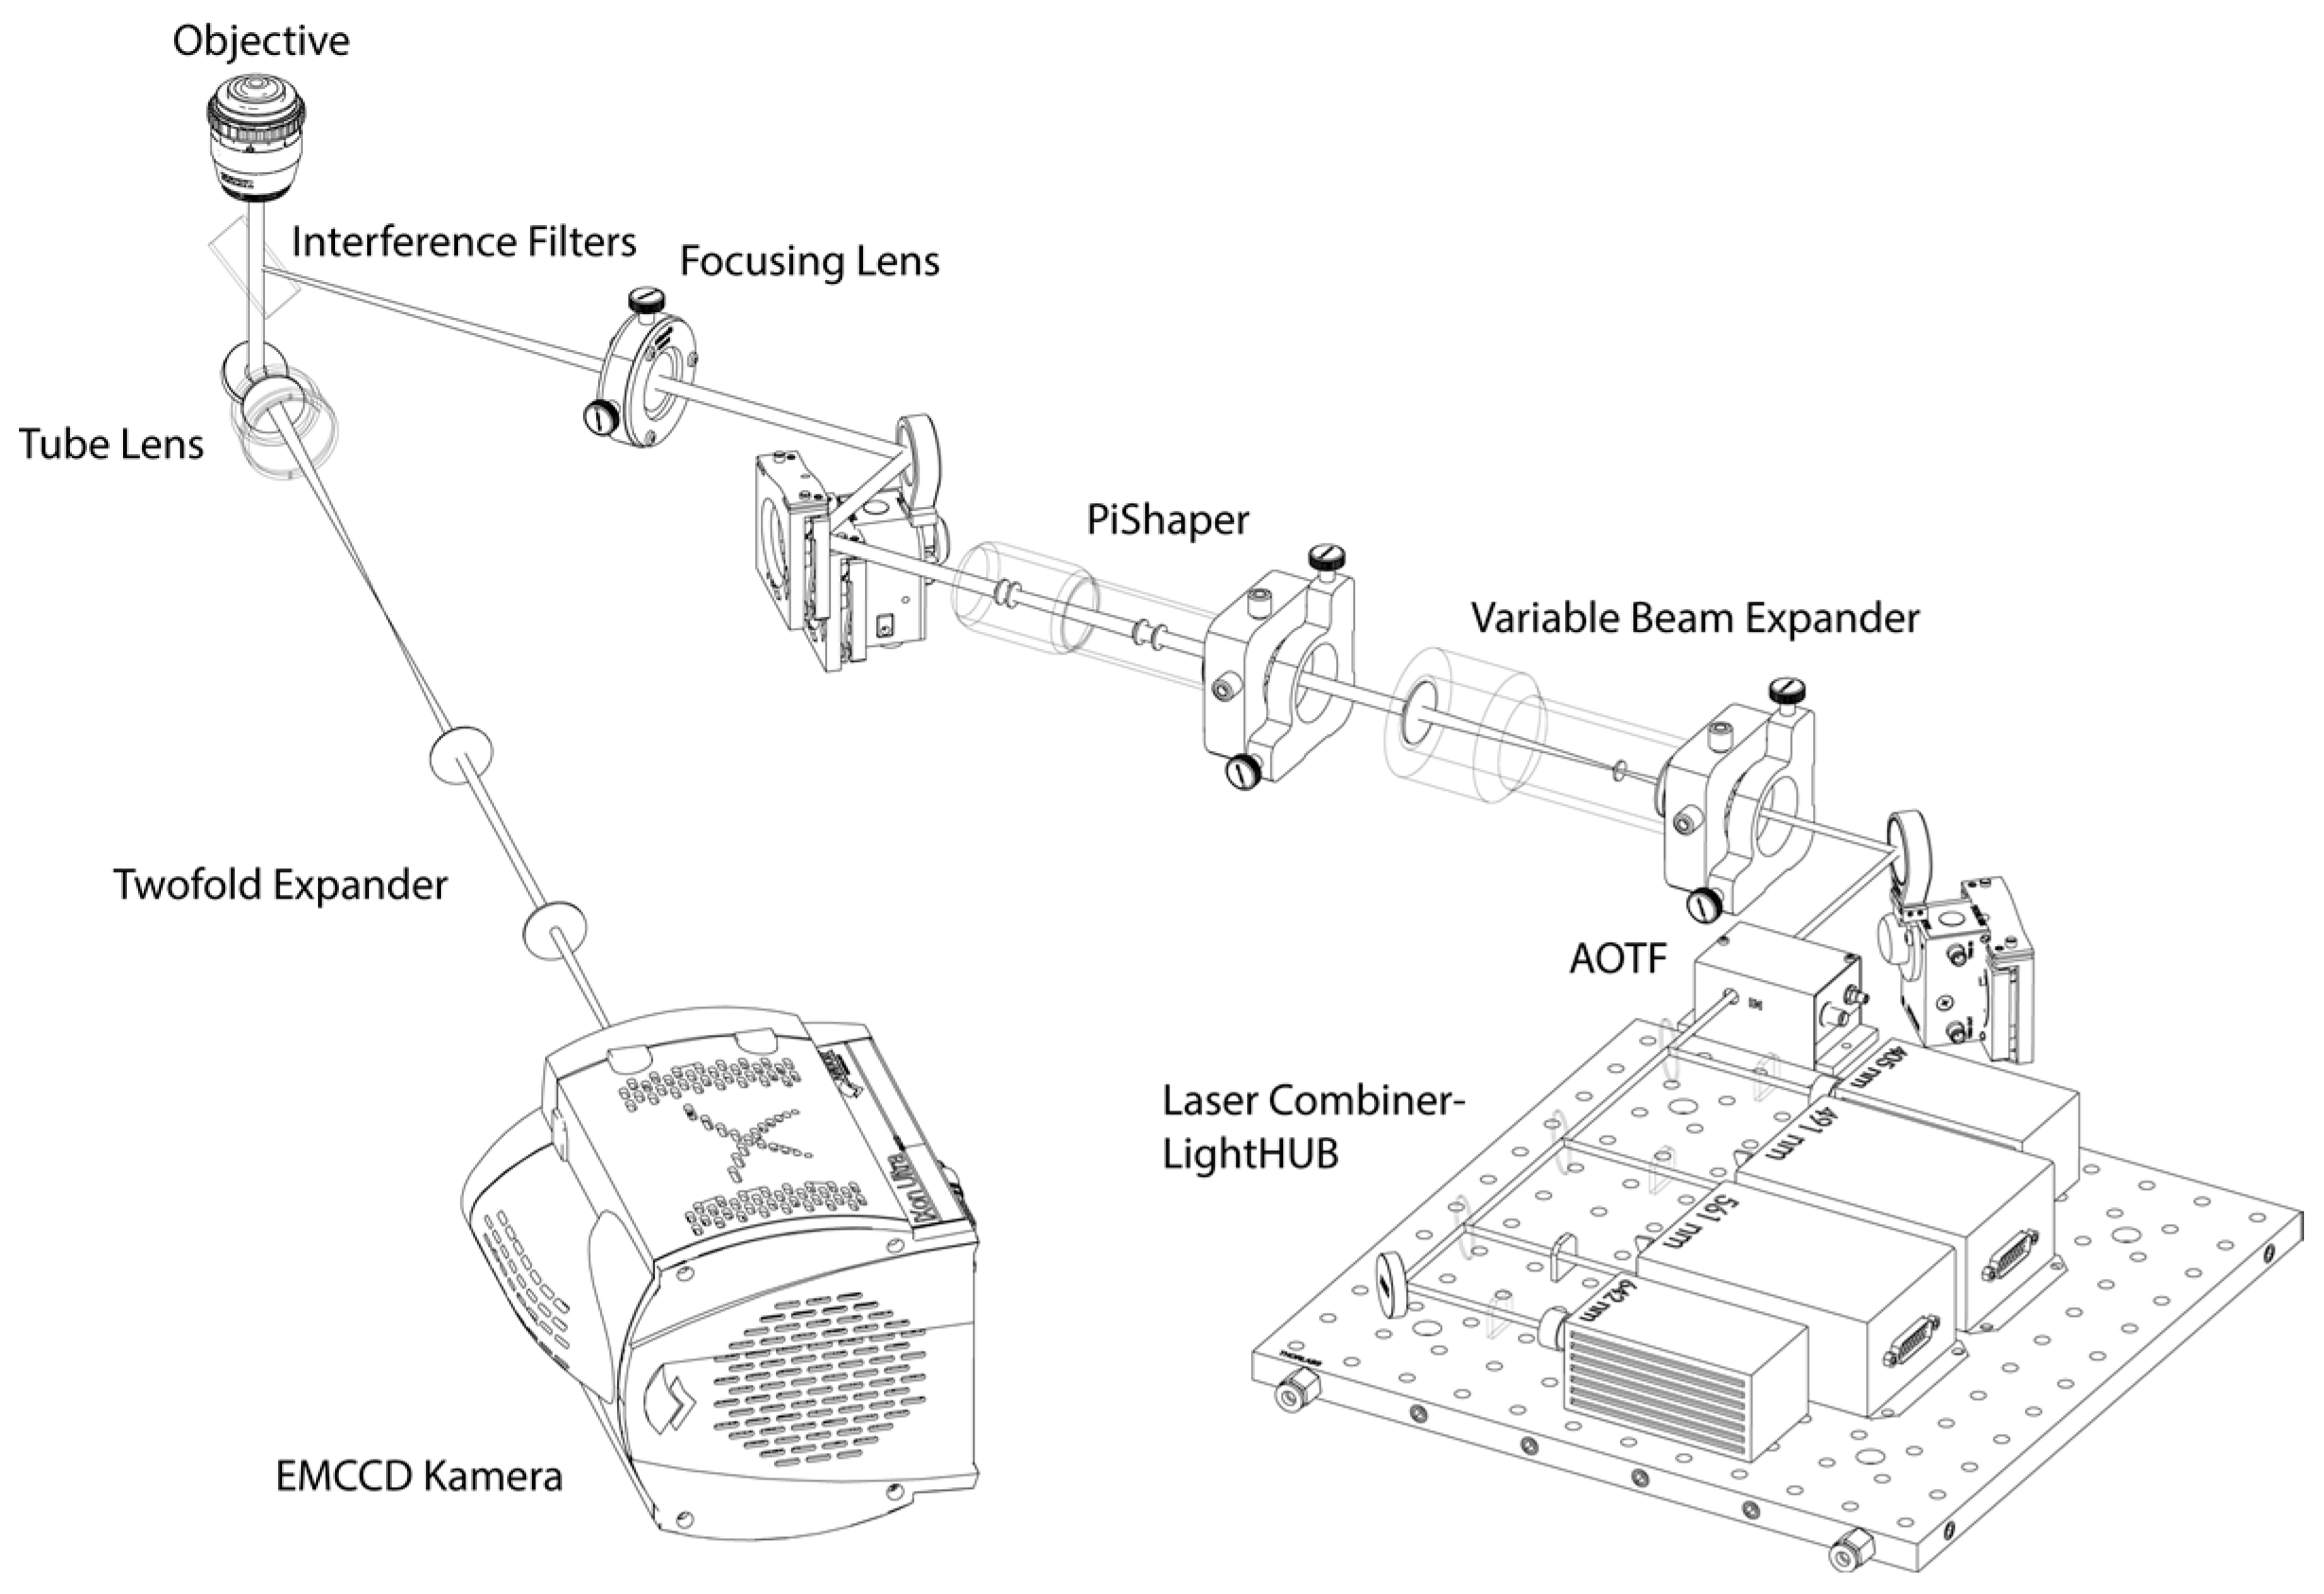
Abstract
:1. Introduction
2. Materials and Methods
2.1. Cell Culture and Specimen Preparation
2.2. Immunohistochemistry and Specimen Preparation for Single-Molecule Localization Microscopy
2.3. Single-Molecule Localization Microscopy
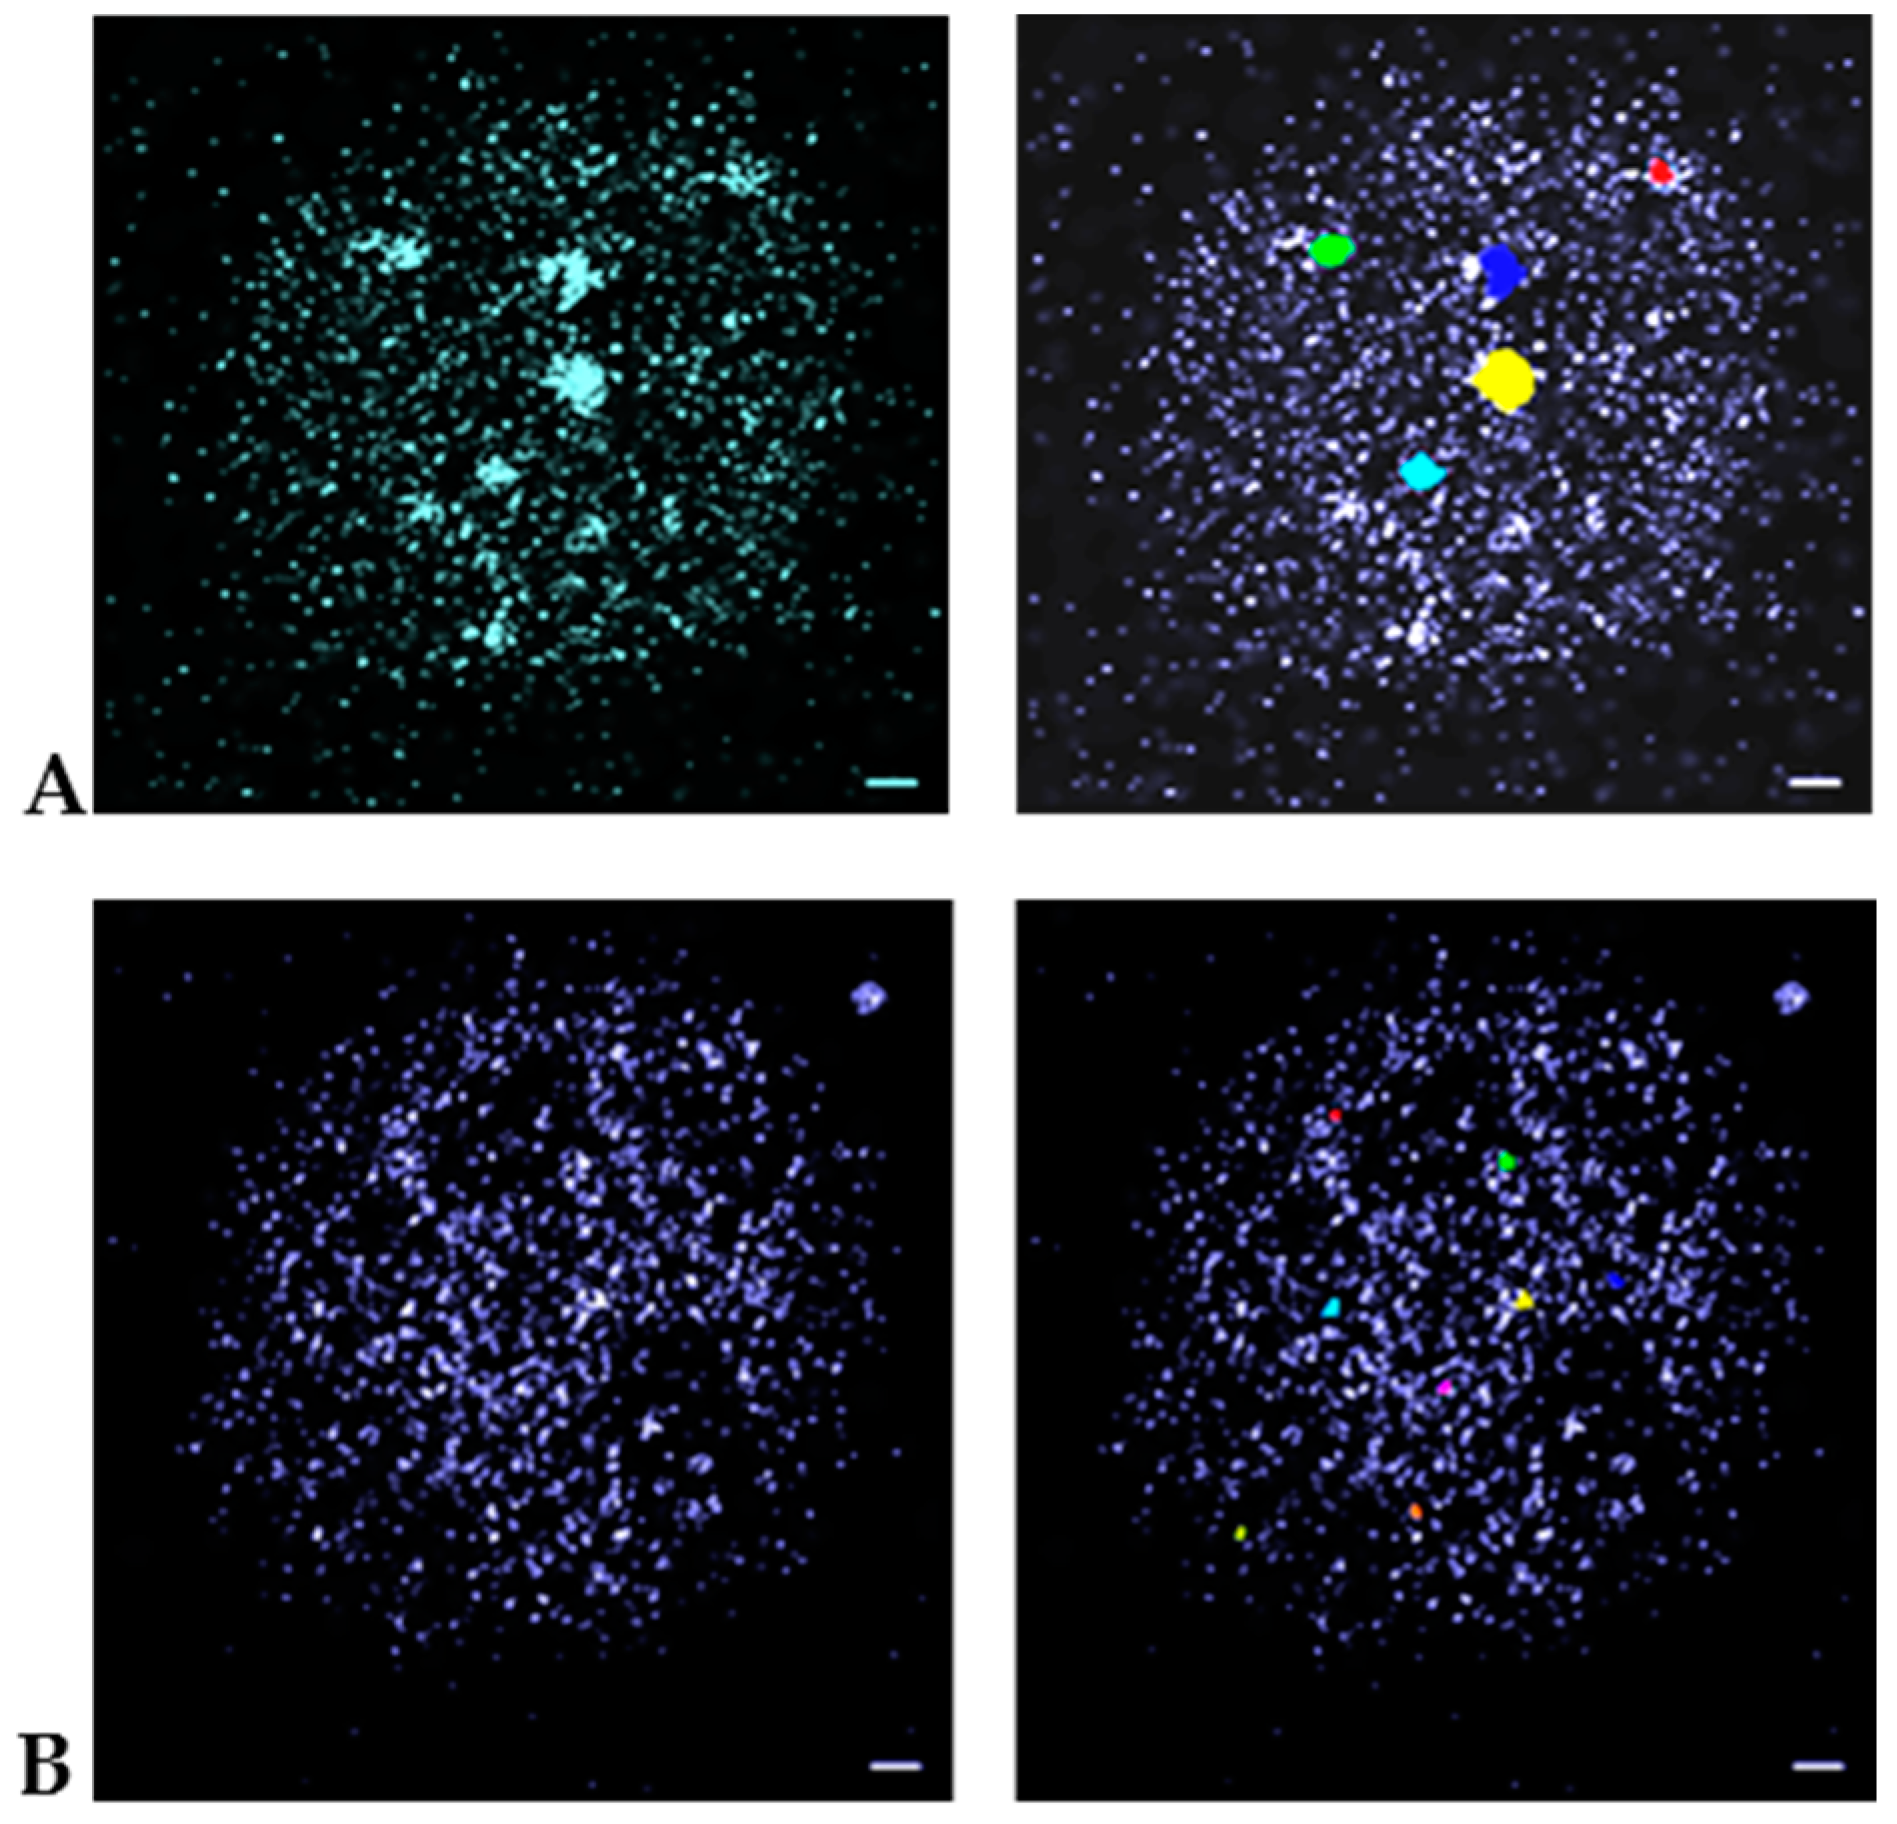
2.4. Data Evaluation
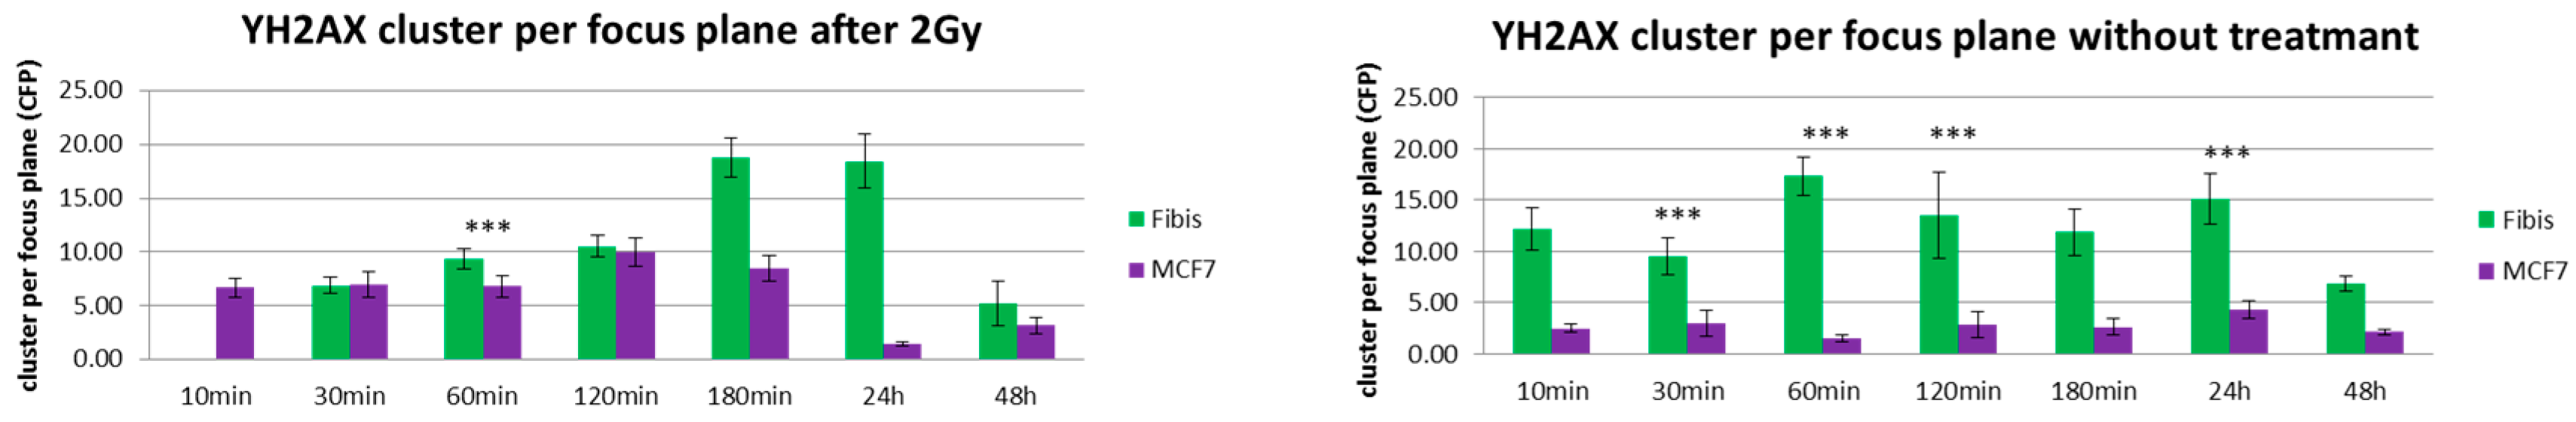
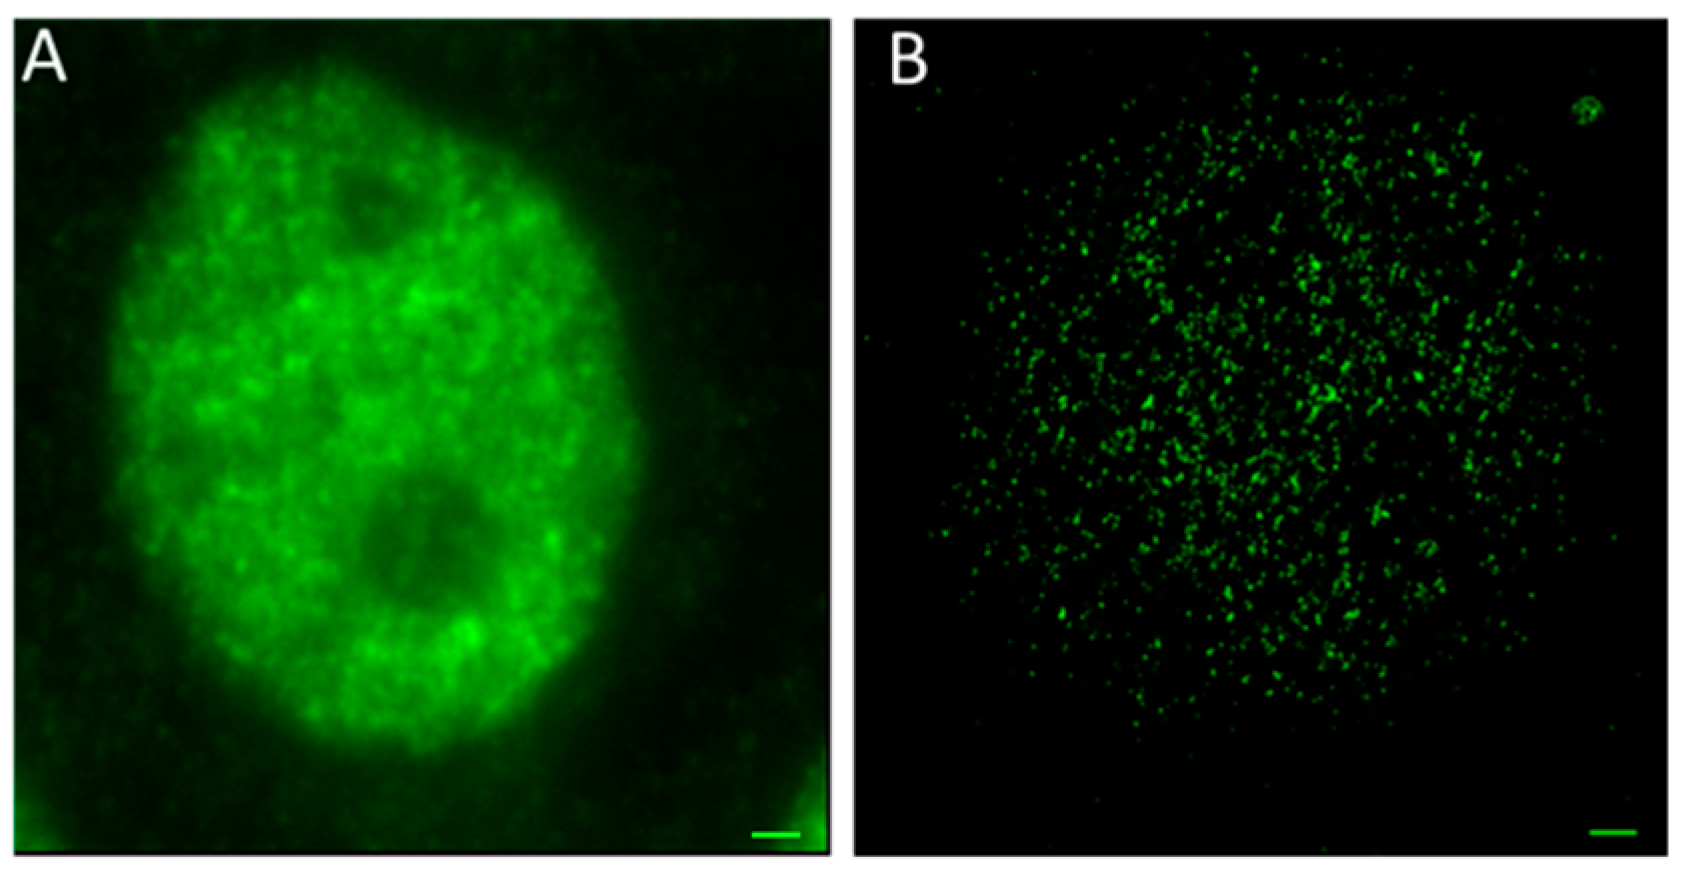
3. Results and Discussion
4. Conclusions
Acknowledgments
Author Contributions
Conflicts of Interest
References
- Knoll, M.; Ruska, E. Das Elektronenmikroskop. Zeitschrift für Physik 1932, 78, 318–339. [Google Scholar] [CrossRef]
- Synge, E.H. A suggested method for extending the microscopic resolution into the ultramicroscopic region. Philos. Mag. 1928, 6, 356–359. [Google Scholar] [CrossRef]
- Betzig, E.; Lewis, A.; Harootunian, A.; Isaacson, M.; Kratschmer, E. Near-field scanning optical microscopy (NSOM)—Development and biophysical applications. Biophs. J. 1986, 49, 269–279. [Google Scholar] [CrossRef]
- Reid, D.A.; Rothenberg, E. Single-molecule fluorescence imaging techniques. Encyclopedia Anal. Chem. 2015. [Google Scholar] [CrossRef]
- Hell, S.W.; Stelzer, E.H.K. Fundamental improvement of resolution with a 4Pi-confocal fluorescence microscope using two-photon excitation. Opt. Commun. 1992, 93, 277–282. [Google Scholar] [CrossRef]
- Klar, T.A.; Hell, S.W. Subdiffraction Resolution in Far-Field Fluorescence Microscopy. Opt. Lett. 1999, 24, 954–956. [Google Scholar] [CrossRef] [PubMed]
- Cremer, C. Optics far beyond the diffraction limit. In Springer Handbook of Lasers and Optics, 2nd ed.; Träger, F., Ed.; Springer: Heidelberg, Germany, 2012; pp. 1351–1389. [Google Scholar]
- Cremer, C.; Masters, B.R. Resolution enhancement techniques in microscopy. Eur. Phys. J. H 2013, 38, 281–344. [Google Scholar] [CrossRef]
- Cremer, C.; Hausmann, M.; Bradl, J.; Rinke, B. Method and Devices for Measuring Distances between Object Structures. US-Patent 6,424,421 B1, 23 July 2002. [Google Scholar]
- Esa, A.; Edelmann, P.; Kreth, G.; Trakhtenbrot, L.; Amariglio, N.; Rechavi, G.; Hausmann, M.; Cremer, C. Three-dimensional spectral precision distance microscopy of chromatin nano-structures after triple-colour DNA labelling: A study of the BCR region on chromosome 22 and the Philadelphia chromosome. J. Microsc. 2000, 199, 96–105. [Google Scholar] [CrossRef] [PubMed]
- Rauch, J.; Knoch, T.A.; Solovei, I.; Teller, K.; Stein, S.; Buiting, K.; Horsthemke, B.; Langowski, J.; Cremer, T.; Hausmann, M.; et al. Lightoptical precision measurements of the active and inactive Prader-Willi Syndrome imprinted regions in human cell nuclei. Differentiation 2008, 76, 66–82. [Google Scholar] [CrossRef] [PubMed]
- Cremer, C.; Kaufmann, R.; Gunkel, M.; Pres, S.; Weiland, Y.; Müller, P.; Ruckelshausen, T.; Lemmer, P.; Geiger, F.; Degenhard, M.; et al. Superresolution imaging of biological nanostructures by Spectral Precision Distance Microscopy (SPDM). Biotechnol. J. 2011, 6, 1037–1051. [Google Scholar] [CrossRef] [PubMed]
- Müller, P.; Weiland, Y.; Kaufmann, R.; Gunkel, M.; Hillebrandt, S.; Cremer, C.; Hausmann, M. Analysis of Fluorescent Nanostructures in Biological Systems by Means of Spectral Position Determination Microscopy (SPDM). In Current Microscopy Contributions to Advances in Science and Technology; Méndez-Vilas, A., Ed.; Formatex Research Center: Badajoz, Spain, 2012; Volume 1, pp. 3–12. [Google Scholar]
- Hausmann, M.; Ilić, N.; Pilarczyk, G.; Lee, J.-H.; Logeswaran, A.; Borroni, A.P.; Krufczik, M.; Theda, F.; Waltrich, N.; Bestvater, F.; et al. Challenges for super-resolution localization microscopy and biomolecular fluorescent nano-probing in cancer research. Int. J. Mol. Sci. 2017, 18, 2066. [Google Scholar] [CrossRef] [PubMed]
- Lemmer, P.; Gunkel, M.; Baddeley, D.; Kaufmann, R.; Urich, A.; Weiland, Y.; Reymann, J.; Müller, P.; Hausmann, M.; Cremer, C. SPDM—Light microscopy with single molecule resolution at the nanoscale. Appl. Phys. B 2018, 93, 1–12. [Google Scholar] [CrossRef]
- Lemmer, P.; Gunkel, M.; Weiland, Y.; Müller, P.; Baddeley, D.; Kaufmann, R.; Urich, A.; Eipel, H.; Amberger, R.; Hausmann, M.; et al. Using conventional fluorescent markers for far-field fluorescence localization nanoscopy allows resolution in the 10 nm range. J. Microsc. 2009, 235, 163–171. [Google Scholar] [CrossRef] [PubMed]
- Thompson, R.E.; Larson, D.R.; Webb, W.W. Precise nanometer localization analysis for individual fluorescent probes. Biophys. J. 2002, 82, 2775–2783. [Google Scholar] [CrossRef]
- Deschout, H.; Cella Zanacchi, F.; Mlodzianoski, M.; Diaspro, A.; Bewersdorf, J.; Hess, S.T.; Braeckmans, K. Precisely and accurately localizing single emitters in fluorescent microscopy. Nat. Methods 2014, 11, 253–266. [Google Scholar] [CrossRef] [PubMed]
- Kirmes, I.; Szcurek, A.T.; Prakash, K.; Charapitsa, I.; Heiser, C.; Musheev, M.; Schock, F.; Fornalczyk, K.; Ma, D.; Birk, U.; et al. A transient ischemic environment induces reversible compaction of chromatin. Genome Biol. 2015, 16, 246. [Google Scholar] [CrossRef] [PubMed]
- Szcurek, A.T.; Prakash, K.; Lee, H.K.; Zurek-Biesiada, D.; Best, G.; Hagmann, M.; Dobrucki, J.W.; Cremer, C.; Birk, U. Single molecule localization microscopy of the distribution of chromatin using Hoechst and DAPI fluorescent probes. Nucleus 2014, 5, 331–340. [Google Scholar] [CrossRef] [PubMed]
- Bohn, M.; Diesinger, P.; Kaufmann, R.; Weiland, Y.; Müller, P.; Gunkel, M.; von Ketteler, A.; Lemmer, P.; Hausmann, M.; Heermann, D.W.; et al. Localization microscopy reveals expression-dependent parameters of chromatin nanostructure. Biophys. J. 2010, 99, 1358–1367. [Google Scholar] [CrossRef] [PubMed]
- Stuhlmüller, M.; Schwarz-Finsterle, J.; Fey, E.; Lux, J.; Bach, M.; Cremer, C.; Hinderhofer, K.; Hausmann, M.; Hildenbrand, G. In situ optical sequencing and nano-structure analysis of a trinucleotide expansion region by localization microscopy after specific COMBO-FISH labelling. Nanoscale 2015, 7, 17938–17946. [Google Scholar] [CrossRef] [PubMed]
- Müller, P.; Lemmermann, N.A.; Kaufmann, R.; Gunkel, M.; Paech, D.; Hildenbrand, G.; Holtappels, R.; Cremer, C.; Hausmann, M. Spatial distribution and structural arrangement of a murine cytomegalovirus glycoprotein detected by SPDM localization microscopy. Histochem. Cell Biol. 2014, 142, 61–67. [Google Scholar] [CrossRef] [PubMed]
- Kaufmann, R.; Müller, P.; Hildenbrand, G.; Hausmann, M.; Cremer, C. Analysis of Her2/neu membrane protein clusters in different types of breast cancer cells using localization microscopy. J. Microsc. 2011, 242, 46–54. [Google Scholar] [CrossRef] [PubMed]
- Boyd, P.S.; Struve, N.; Bach, M.; Eberle, J.P.; Gote, M.; Schock, F.; Cremer, C.; Kriegs, M.; Hausmann, M. Clustered localization of EGFRvIII in glioblastoma cells as detected by high precision localization microscopy. Nanoscale 2016, 8, 20037–20047. [Google Scholar] [CrossRef] [PubMed]
- Falk, M.; Hausmann, M.; Lukášová, E.; Biswas, A.; Hildenbrand, G.; Davídková, M.; Krasavin, E.; Kleibl, Z.; Falková, I.; Ježková, L.; et al. Giving OMICS spatiotemporal dimensions by challenging microscopy: From functional networks to structural organization of cell nuclei elucidating mechanisms of complex radiation damage response and chromatin repair—PART A (Radiomics). Crit. Rev. Eukaryot. Gene Express. 2014, 24, 205–223. [Google Scholar] [CrossRef]
- Falk, M.; Hausmann, M.; Lukášová, E.; Biswas, A.; Hildenbrand, G.; Davídková, M.; Krasavin, E.; Kleibl, Z.; Falková, I.; Ježková, L.; et al. Giving OMICS spatiotemporal dimensions by challenging microscopy: From functional networks to structural organization of cell nuclei elucidating mechanisms of complex radiation damage response and chromatin repair—PART B (Structuromics). Crit. Rev. Eukaryot. Gene Express. 2014, 24, 225–247. [Google Scholar] [CrossRef]
- Zhang, Y.; Máté, G.; Müller, P.; Hillebrandt, S.; Krufczik, M.; Bach, M.; Kaufmann, R.; Hausmann, M.; Heermann, D.W. Radiation induced chromatin conformation changes analysed by fluorescent localization microscopy, statistical physics, and graph theory. PLoS ONE 2015, 10, e0128555. [Google Scholar] [CrossRef] [PubMed]
- Bach, M.; Savini, C.; Krufczik, M.; Cremer, C.; Rösl, F.; Hausmann, M. Super-resolution localization microscopy of γ-H2AX and heterochromatin after folate deficiency. Int. J. Mol. Sci. 2017, 18, 1726. [Google Scholar] [CrossRef] [PubMed]
- Pilarczyk, G.; Nesnidal, I.; Gunkel, M.; Bach, M.; Bestvater, F.; Hausmann, M. Localisation microscopy of breast epithelial ErbB-2 receptors and gap junctions: Trafficking after gamma-irradiation, Neuregulin-1b and Herceptin application. Int. J. Mol. Sci. 2017, 18, 362. [Google Scholar] [CrossRef] [PubMed]
- Moser, F.; Hildenbrand, G.; Müller, P.; Al Saroori, A.; Biswas, A.; Bach, M.; Wenz, F.; Cremer, C.; Burger, N.; Veldwijk, M.; et al. Cellular uptake of gold nanoparticles and their behavior as labels for localization microscopy. Biophys. J. 2016, 110, 947–953. [Google Scholar] [CrossRef] [PubMed]
- Burger, N.; Biswas, A.; Barzan, D.; Kirchner, A.; Hosser, H.; Hausmann, M.; Hildenbrand, G.; Herskind, C.; Wenz, F.; Veldwijk, M.R. A method for the efficient cellular uptake and retention of small modified gold nanoparticles for the radiosensitization of cells. Nanomed. Nanotechnol. Biol. Med. 2014, 10, 1365–1373. [Google Scholar] [CrossRef] [PubMed]
- Rogakou, E.P.; Pilch, D.R.; Orr, A.H.; Ivanova, V.S.; Bonner, W.M. DNA double-starnd breaks induce histone H2AX phosphorylation on serine 139. J. Biol. Chem. 1998, 273, 5858–5868. [Google Scholar] [CrossRef] [PubMed]
- Rogakou, E.P.; Boon, C.; Redon, C.; Bonner, W.M. Megabase chromatin domains involved in DNA double-strand breaks in vivo. J. Cell Biol. 1999, 146, 905–916. [Google Scholar] [CrossRef] [PubMed]
- Eberle, J.P.; Rapp, A.; Krufczik, M.; Eryilmaz, M.; Gunkel, M.; Erfle, H.; Hausmann, M. Super-resolution microscopy techniques and their potential for applications in radiation biophysics. Meth. Mol. Biol. 2017, 1663, 1–13. [Google Scholar]
- Ceccaldi, R.; Rondinelli, B.; Andrea, A.D.D. Repair pathway choices and consequences at the double-strand break. Trends Biol. 2016, 26, 52–64. [Google Scholar] [CrossRef] [PubMed]
- Bhattacharjee, S.; Nandi, S. Choices have consequences: The nexus between DNA repair pathways and genomic instability in cancer. Clin. Trans. Med. 2016, 5, 45. [Google Scholar] [CrossRef] [PubMed]
- Mladenov, E.; Magin, S.; Soni, A.; Iliakis, G. DNA double-strand-break repair in higher eukaryotes and its role in genomic instability and cancer: Cell cycle and proliferation-dependent regulation. Sem. Cancer Biol. 2016, 37–38, 51–64. [Google Scholar] [CrossRef] [PubMed]
- Schipler, A.; Iliakis, G. DNA double-strand–break complexity levels and their possible contributions to the probability for error-prone processing and repair pathway choice. Nucleic Acids Res. 2013, 41, 7589–7605. [Google Scholar] [CrossRef] [PubMed]
- Dueva, R.; Iliakis, G. Alternative pathways of non-homologous end joining (NHEJ) in genomic instability and cancer. Transl. Cancer Res. 2013, 2, 163–177. [Google Scholar]
- Mladenov, E.; Magin, S.; Soni, A.; Iliakis, G. DNA double-strand break repair as determinant of cellular radiosensitivity to killing and target in radiation therapy. Front. Oncol. 2013, 3, 113. [Google Scholar] [CrossRef] [PubMed]
- Bhattacharjee, S.; Nandi, S. DNA damage response and cancer therapeutics through the lens of the Fanconi Anemia DNA repair pathway. Cell Commun. Signal. 2017, 15, 41. [Google Scholar] [CrossRef] [PubMed]
- Bhattacharjee, S.; Nandi, S. Synthetic lethality in DNA repair network: A novel avenue in targeted cancer therapy and combination therapeutics. IUBMB Life 2017, 69, 929–937. [Google Scholar] [CrossRef] [PubMed]
- Reid, D.A.; Conlin, M.P.; Yin, Y.; Chang, H.H.; Watanabe, G.; Lieber, M.R.; Ramsden, D.A.; Rothenberg, E. Bridging of double-starnded breaks by the non-homologous end-joining ligation complex is modulated by DNA end chemistry. Nucl. Acids Res. 2017, 45, 1872–1878. [Google Scholar] [CrossRef] [PubMed]
- Reid, D.A.; Keegan, S.; Leo-Macias, A.; Watanabe, G.; Strande, N.T.; Chang, H.H.; Oksuz, B.A.; Fenyo, D.; Lieber, M.R.; Ramsden, D.A.; et al. Organization and dynamics of the non-homologous end-joining machinery during DNA double-strand break repair. Proc. Natl. Acad. Sci. USA 2015, 112, E2575–E2584. [Google Scholar] [CrossRef] [PubMed]
- Natale, F.; Rapp, A.; Yu, W.; Maiser, A.; Harz, H.; Schall, A.; Grulich, S.; Anton, T.; Hörl, D.; Chen, W.; et al. Identification of the elementary structural units of the DNA damage response. Nat. Commun. 2017, 8, 15760. [Google Scholar] [CrossRef] [PubMed]
- Du, G.; Drexler, G.A.; Friedland, W.; Greubel, C.; Hable, V.; Krücken, R.; Kugler, A.; Tonelli, L.; Friedl, A.A.; Dollinger, G. Spatial dynamics of DNA damage response protein foci along the ion trajectory of high-LET particles. Radiat. Res. 2011, 176, 706–715. [Google Scholar] [CrossRef] [PubMed]
- Reindl, J.S.; Girst, S.; Walsh, D.W.M.; Geubel, C.; Schwarz, B.; Siebenwirth, C.; Drexler, G.A.; Friedl, A.A.; Dollinger, G. Chromatin organization revealed by nanostructure of irradiation induced γH2AX, 53BP1 and Rad51 foci. Sci. Rep. 2017, 7, 40616. [Google Scholar] [CrossRef] [PubMed]
- Lorat, Y.; Bunner, C.U.; Schanz, S.; Jacob, B.; Taucher-Scholz, G.; Rübe, C.E. Nanoscale analysis of clustered DNA damage after high-LET irradiation by quantitative electron microscopy—The heavy burden to repair. DNA Repair 2015, 28, 93–106. [Google Scholar] [CrossRef] [PubMed]
- Lorat, Y.; Timm, S.; Jacob, B.; Taucher-Scholz, G.; Rübe, C.E. Clustered double-strand breaks in heterochromatin perturb DNA repair after high linear energy transfer irradiation. Radiother. Oncol. 2016, 121, 427–437. [Google Scholar] [CrossRef] [PubMed]
- Stracker, T.H.; Petrini, J.H.J. The MRE11 complex: Starting from the ends. Nat. Rev. 2011, 12, 90–103. [Google Scholar] [CrossRef] [PubMed]
- Symington, L.S.; Gautier, J. Double strand break end resection and repair pathway choice. Annu. Rev. Genet. 2011, 45, 247–271. [Google Scholar] [CrossRef] [PubMed]
- Williams, R.S.; Williams, J.S.; Tainer, J.A. MRE11-RAD50-NBS1 is a keystone complex connecting DNA repair machinery, doule-strand break signaling, and the chromatin template. Biochem. Cell Biol. 2007, 85, 509–520. [Google Scholar] [CrossRef] [PubMed]
- Garcia, A.; Phelps, S.E.; Gray, S.; Neale, M.J. Bidirectional resection of DNA double-strand breaks by Mre11 and Exo1. Nature 2011, 479, 241–244. [Google Scholar] [CrossRef] [PubMed]
- Nicolette, M.L.; Lee, K.; Guo, Z.; Rani, M.; Chow, J.M.; Lee, S.E.; Paull, T.T. Mre11-Rad50-Xrs2 and Sae2 promote 5´strand resection of DNA double-strand breaks. Nat. Struct. Mol. Biol. 2010, 17, 1478–1485. [Google Scholar] [CrossRef] [PubMed]
- Hopfner, K.P. DNA double-strand breaks come into focus. Cell 2009, 139, 25–27. [Google Scholar] [CrossRef] [PubMed]
- Yuan, S.-S.F.; Hou, M.-F.; Hsieh, Y.-C.; Huang, C.-Y.; Lee, Y.-C.; Chen, Y.-J.; Lo, S. Role of MRE11 in cell proliferation, tumor invasion, and DNA repair in breast cancer. J. Natl. Cancer Inst. 2012, 104, 1485–1502. [Google Scholar] [CrossRef] [PubMed]
- Grüll, F.; Kirchgessner, M.; Kaufmann, R.; Hausmann, M.; Kebschull, U. Accelerating image analysis for localization microscopy with FPGAs. In Proceedings of the 21st International Conference on Field Programmable Logic and Applications, Chania, Kreta, 5–7 September 2011; pp. 1–5. [Google Scholar]
- Krufczik, M.; Sievers, A.; Hausmann, A.; Lee, J.-H.; Hildenbrand, G.; Schaufler, W.; Hausmann, M. Combining low temperature fluorescence DNA-hybridization, immunostaining, and super-resolution localization microscopy for nano-structure analysis of ALU elements and their influence on chromatin structure. Int. J. Mol. Sci. 2017, 18, 1005. [Google Scholar] [CrossRef] [PubMed]
- Costes, S.V.; Boissière, A.; Ravani, S.; Romano, R.; Parvin, B.; Barcellos-Hoff, M.H. Imaging features that discriminate between foci induced by high- and low-LET radiation in human fibroblasts. Radiat. Res. 2006, 165, 505–515. [Google Scholar] [CrossRef] [PubMed]
- Mimitou, E.P.; Symington, L.S. DNA end resection: Many nucleases make light work. DNA Repair 2009, 8, 983–995. [Google Scholar] [CrossRef] [PubMed]
- Aymanrd, F.; Aguirrebengoa, M.; Guillou, E.; Javierre, B.M.; Bugler, B.; Arnould, C.; Rocher, V.; Iacovoni, J.S.; Biernacka, A.; Skrzypczak, M.; et al. Genome wide mapping of long range contacts unveils DNA double strand breaks clustering at damaged active genes. Nat. Struct. Mol. Biol. 2017, 24, 353–361. [Google Scholar] [CrossRef] [PubMed]
- Nelms, B.E. In situ visualization of DNA double-strand break repair in human fibroblasts. Science 1998, 280, 590–592. [Google Scholar] [CrossRef] [PubMed]
- Theda, F. Lokalisationsmikroskopische Analyse von Zellkernchromatin durch Reparaturfoci Während der Reparatur von Strahleninduzierten DNS-Schäden. Master’s Thesis, University of Heidelberg, Heidelberg, Germany, 2013. [Google Scholar]
- Eryilmaz, M. Investigation of DNA damage after ionizing radiation using localization microscopy. Master´s Thesis, University of Applied Sciences, Mannheim, Germany, 2015. [Google Scholar]
- Salawu, E.O.; Salawu, A.T. Degrading quality of abstracts and presentations at scientific conferences. IIOAB J. 2011, 2, 63–64. [Google Scholar]


© 2018 by the authors. Licensee MDPI, Basel, Switzerland. This article is an open access article distributed under the terms and conditions of the Creative Commons Attribution (CC BY) license (http://creativecommons.org/licenses/by/4.0/).
Share and Cite
Eryilmaz, M.; Schmitt, E.; Krufczik, M.; Theda, F.; Lee, J.-H.; Cremer, C.; Bestvater, F.; Schaufler, W.; Hausmann, M.; Hildenbrand, G. Localization Microscopy Analyses of MRE11 Clusters in 3D-Conserved Cell Nuclei of Different Cell Lines. Cancers 2018, 10, 25. https://doi.org/10.3390/cancers10010025
Eryilmaz M, Schmitt E, Krufczik M, Theda F, Lee J-H, Cremer C, Bestvater F, Schaufler W, Hausmann M, Hildenbrand G. Localization Microscopy Analyses of MRE11 Clusters in 3D-Conserved Cell Nuclei of Different Cell Lines. Cancers. 2018; 10(1):25. https://doi.org/10.3390/cancers10010025
Chicago/Turabian StyleEryilmaz, Marion, Eberhard Schmitt, Matthias Krufczik, Franziska Theda, Jin-Ho Lee, Christoph Cremer, Felix Bestvater, Wladimir Schaufler, Michael Hausmann, and Georg Hildenbrand. 2018. "Localization Microscopy Analyses of MRE11 Clusters in 3D-Conserved Cell Nuclei of Different Cell Lines" Cancers 10, no. 1: 25. https://doi.org/10.3390/cancers10010025
APA StyleEryilmaz, M., Schmitt, E., Krufczik, M., Theda, F., Lee, J.-H., Cremer, C., Bestvater, F., Schaufler, W., Hausmann, M., & Hildenbrand, G. (2018). Localization Microscopy Analyses of MRE11 Clusters in 3D-Conserved Cell Nuclei of Different Cell Lines. Cancers, 10(1), 25. https://doi.org/10.3390/cancers10010025