
Microfluidic Techniques for Analytes Concentration


Abstract
:1. Introduction
2. Stacking Methods
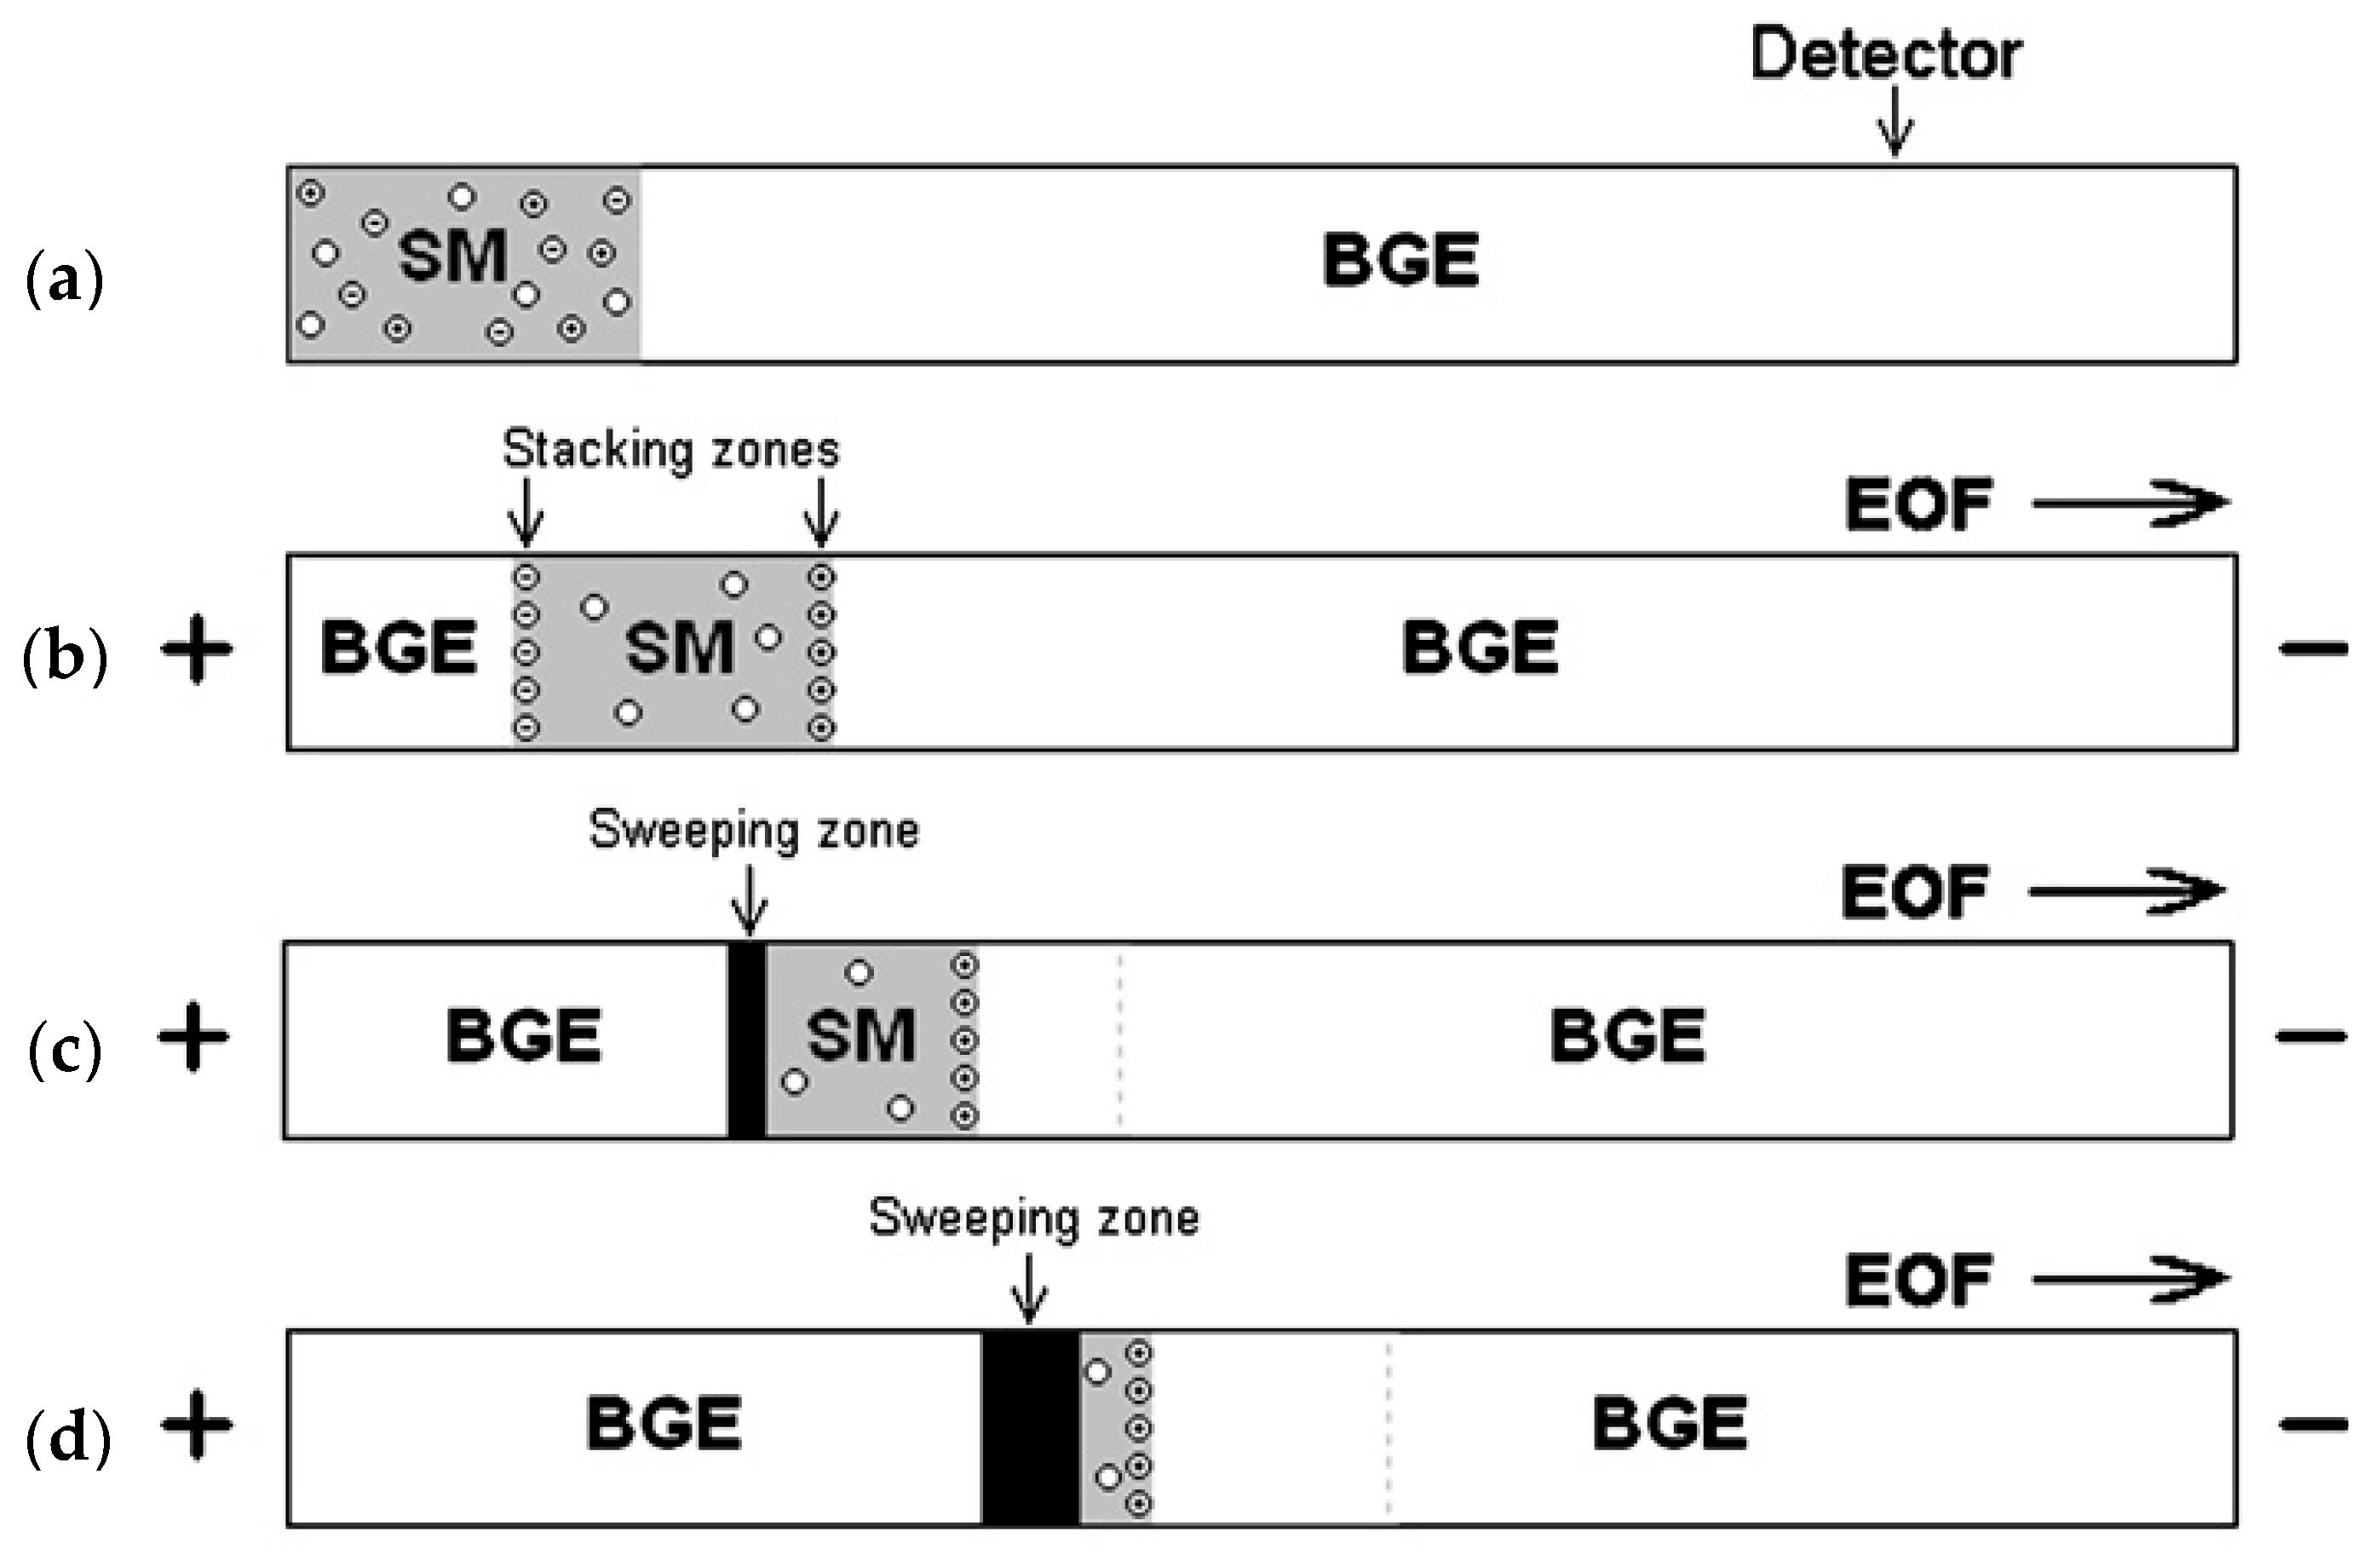
2.1. Sweeping
2.2. Field Amplified Sample Stacking (FASS)
2.3. Isotachophoresis (ITP)
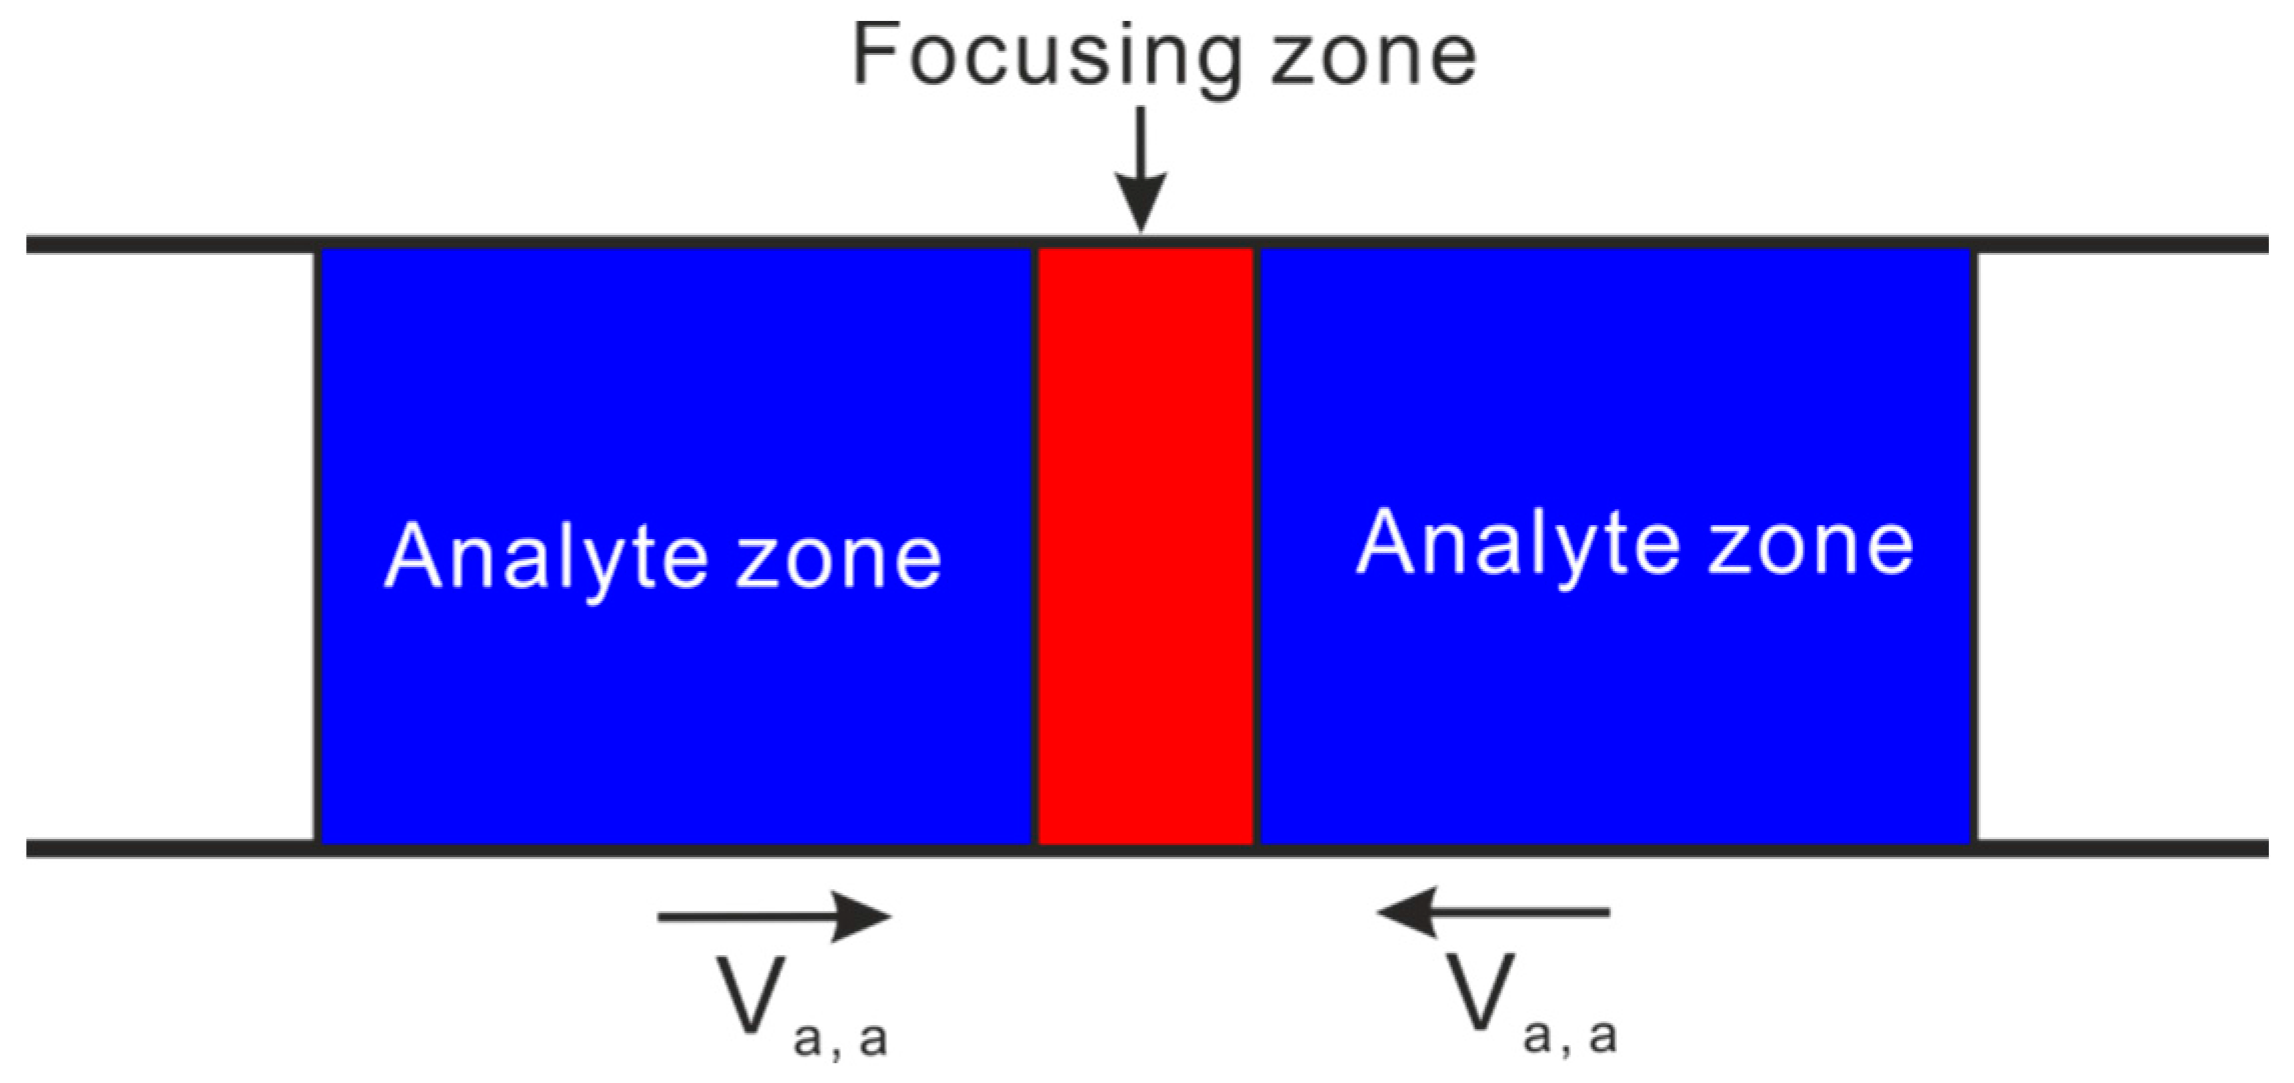
3. Gradient Focusing Methods
3.1. Isoelectric Focusing (IEF)
3.2. Electric Field Gradient Focusing (EFGF)
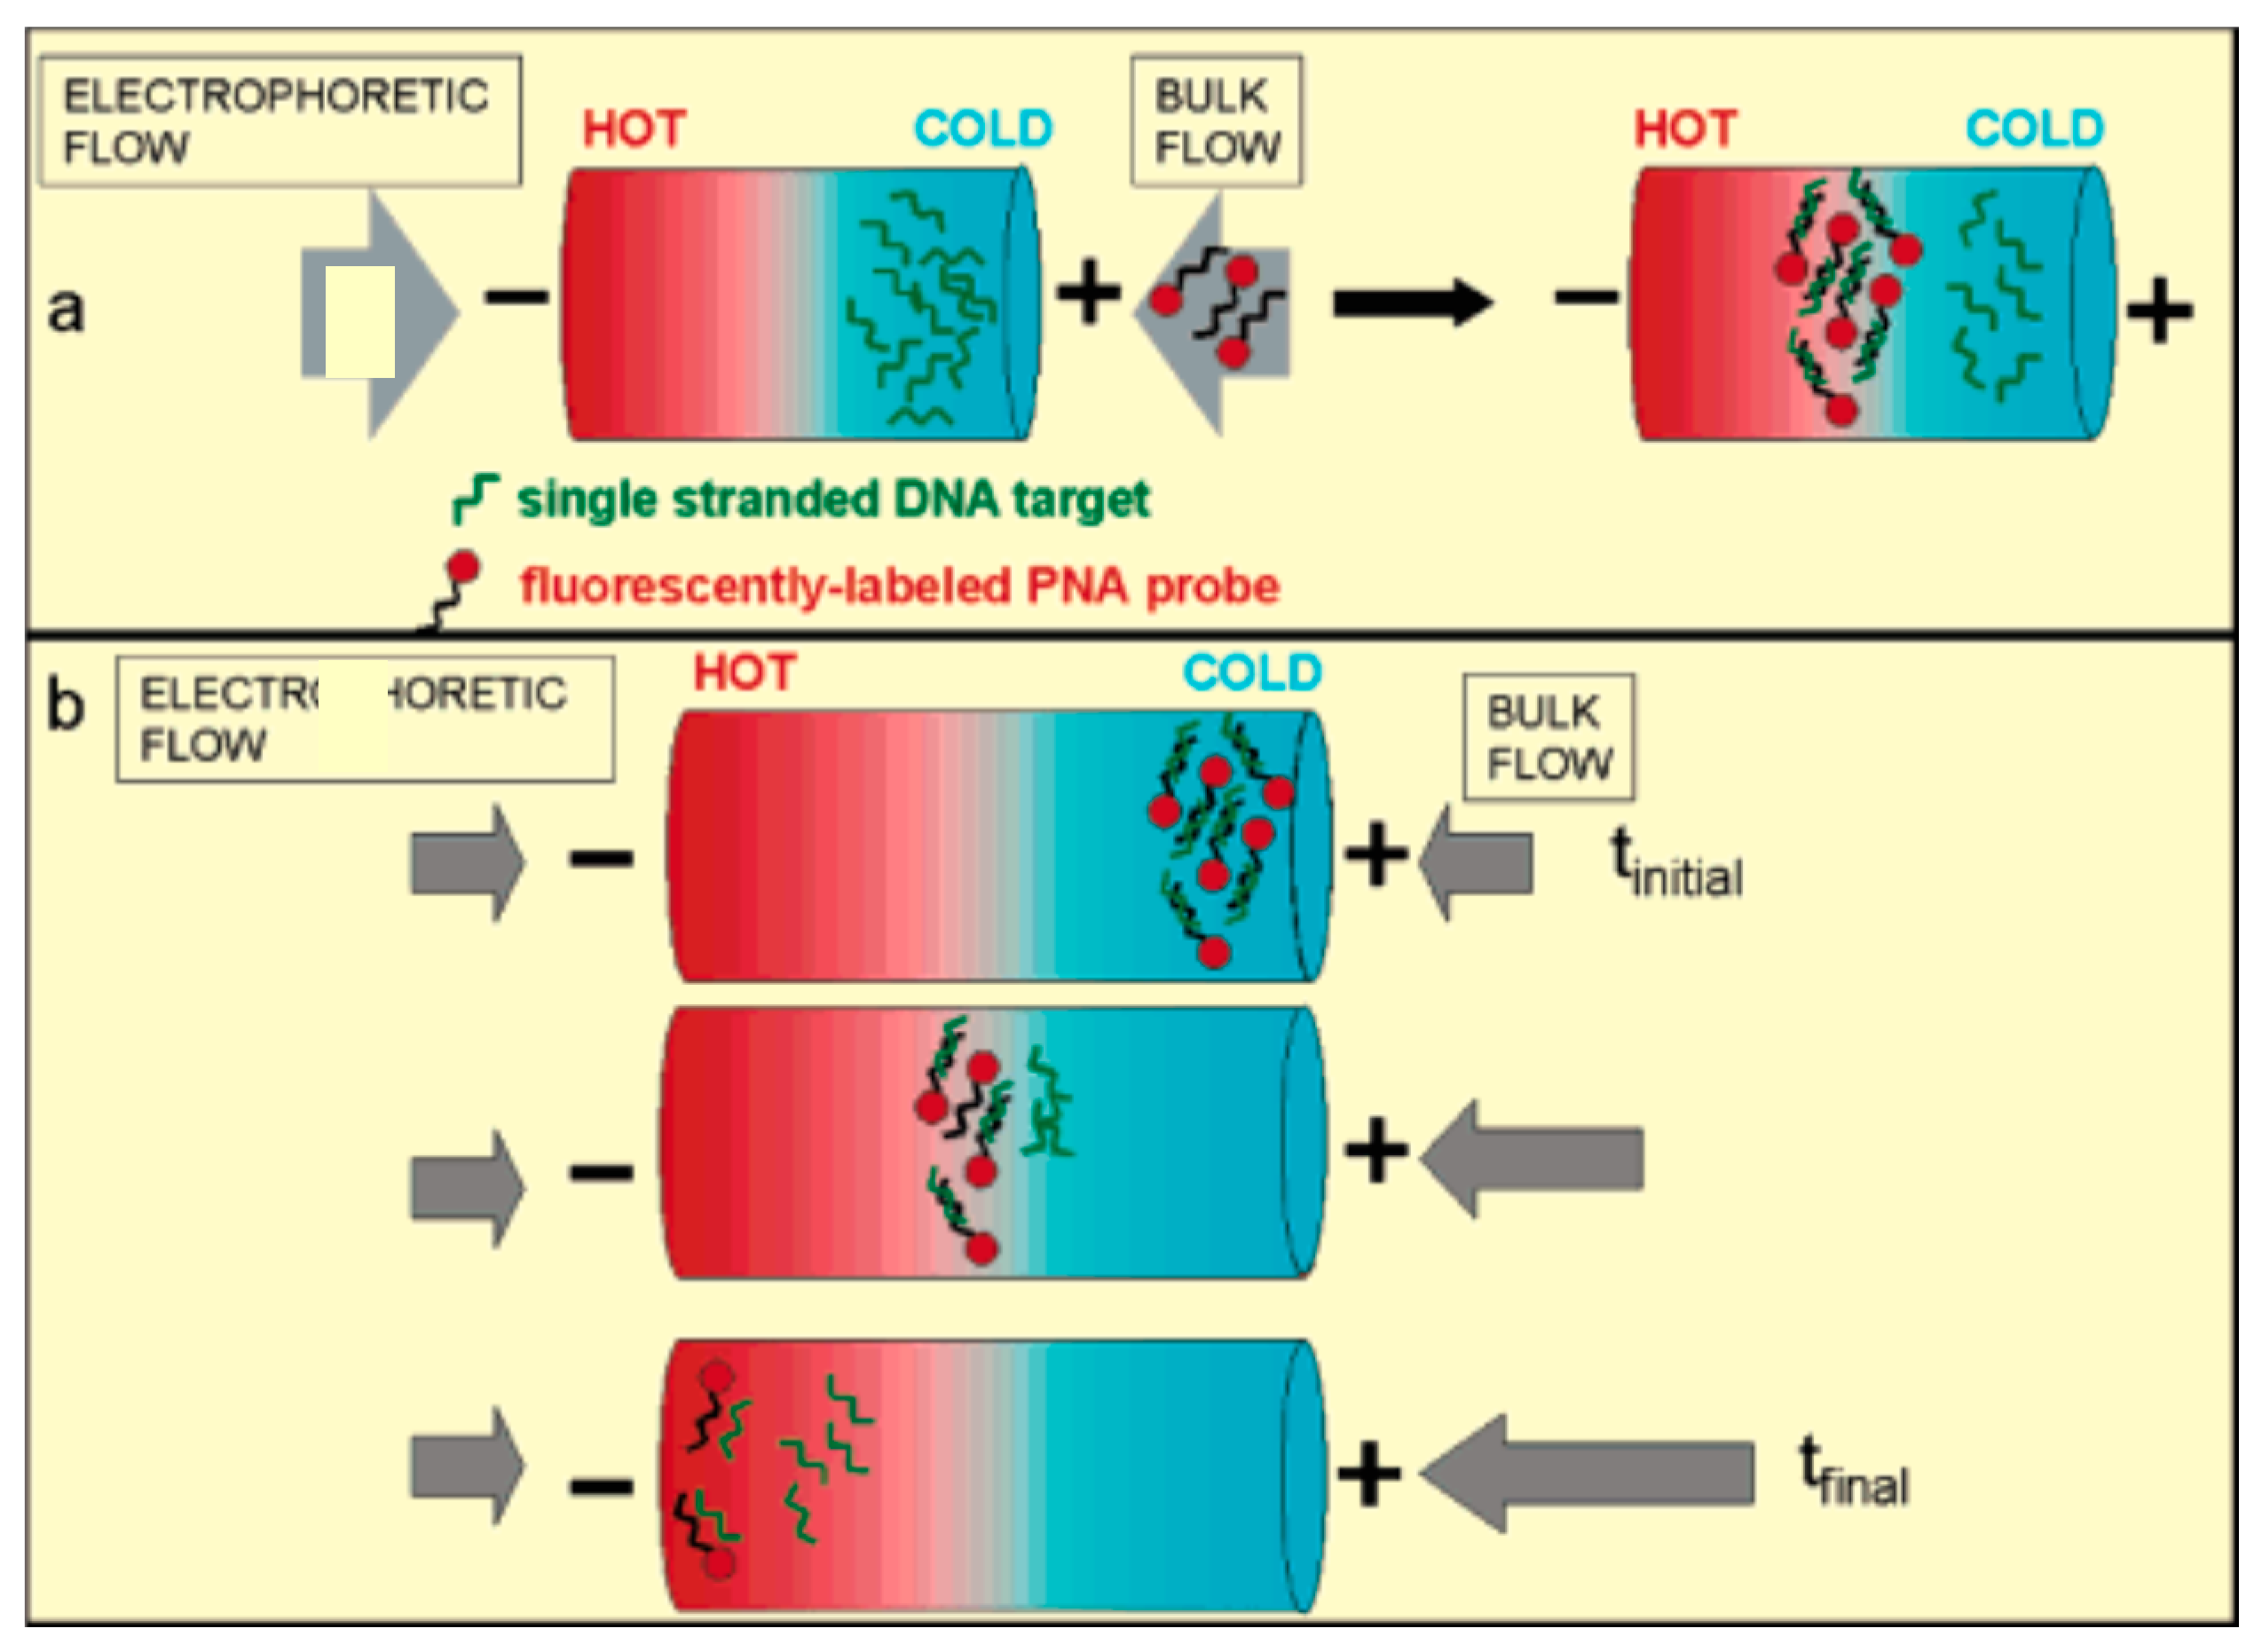
3.3. Temperature Gradient Focusing (TGF)
4. Other Microfluidic Concentration Methods
4.1. Electrokinetic Trapping (EKT)
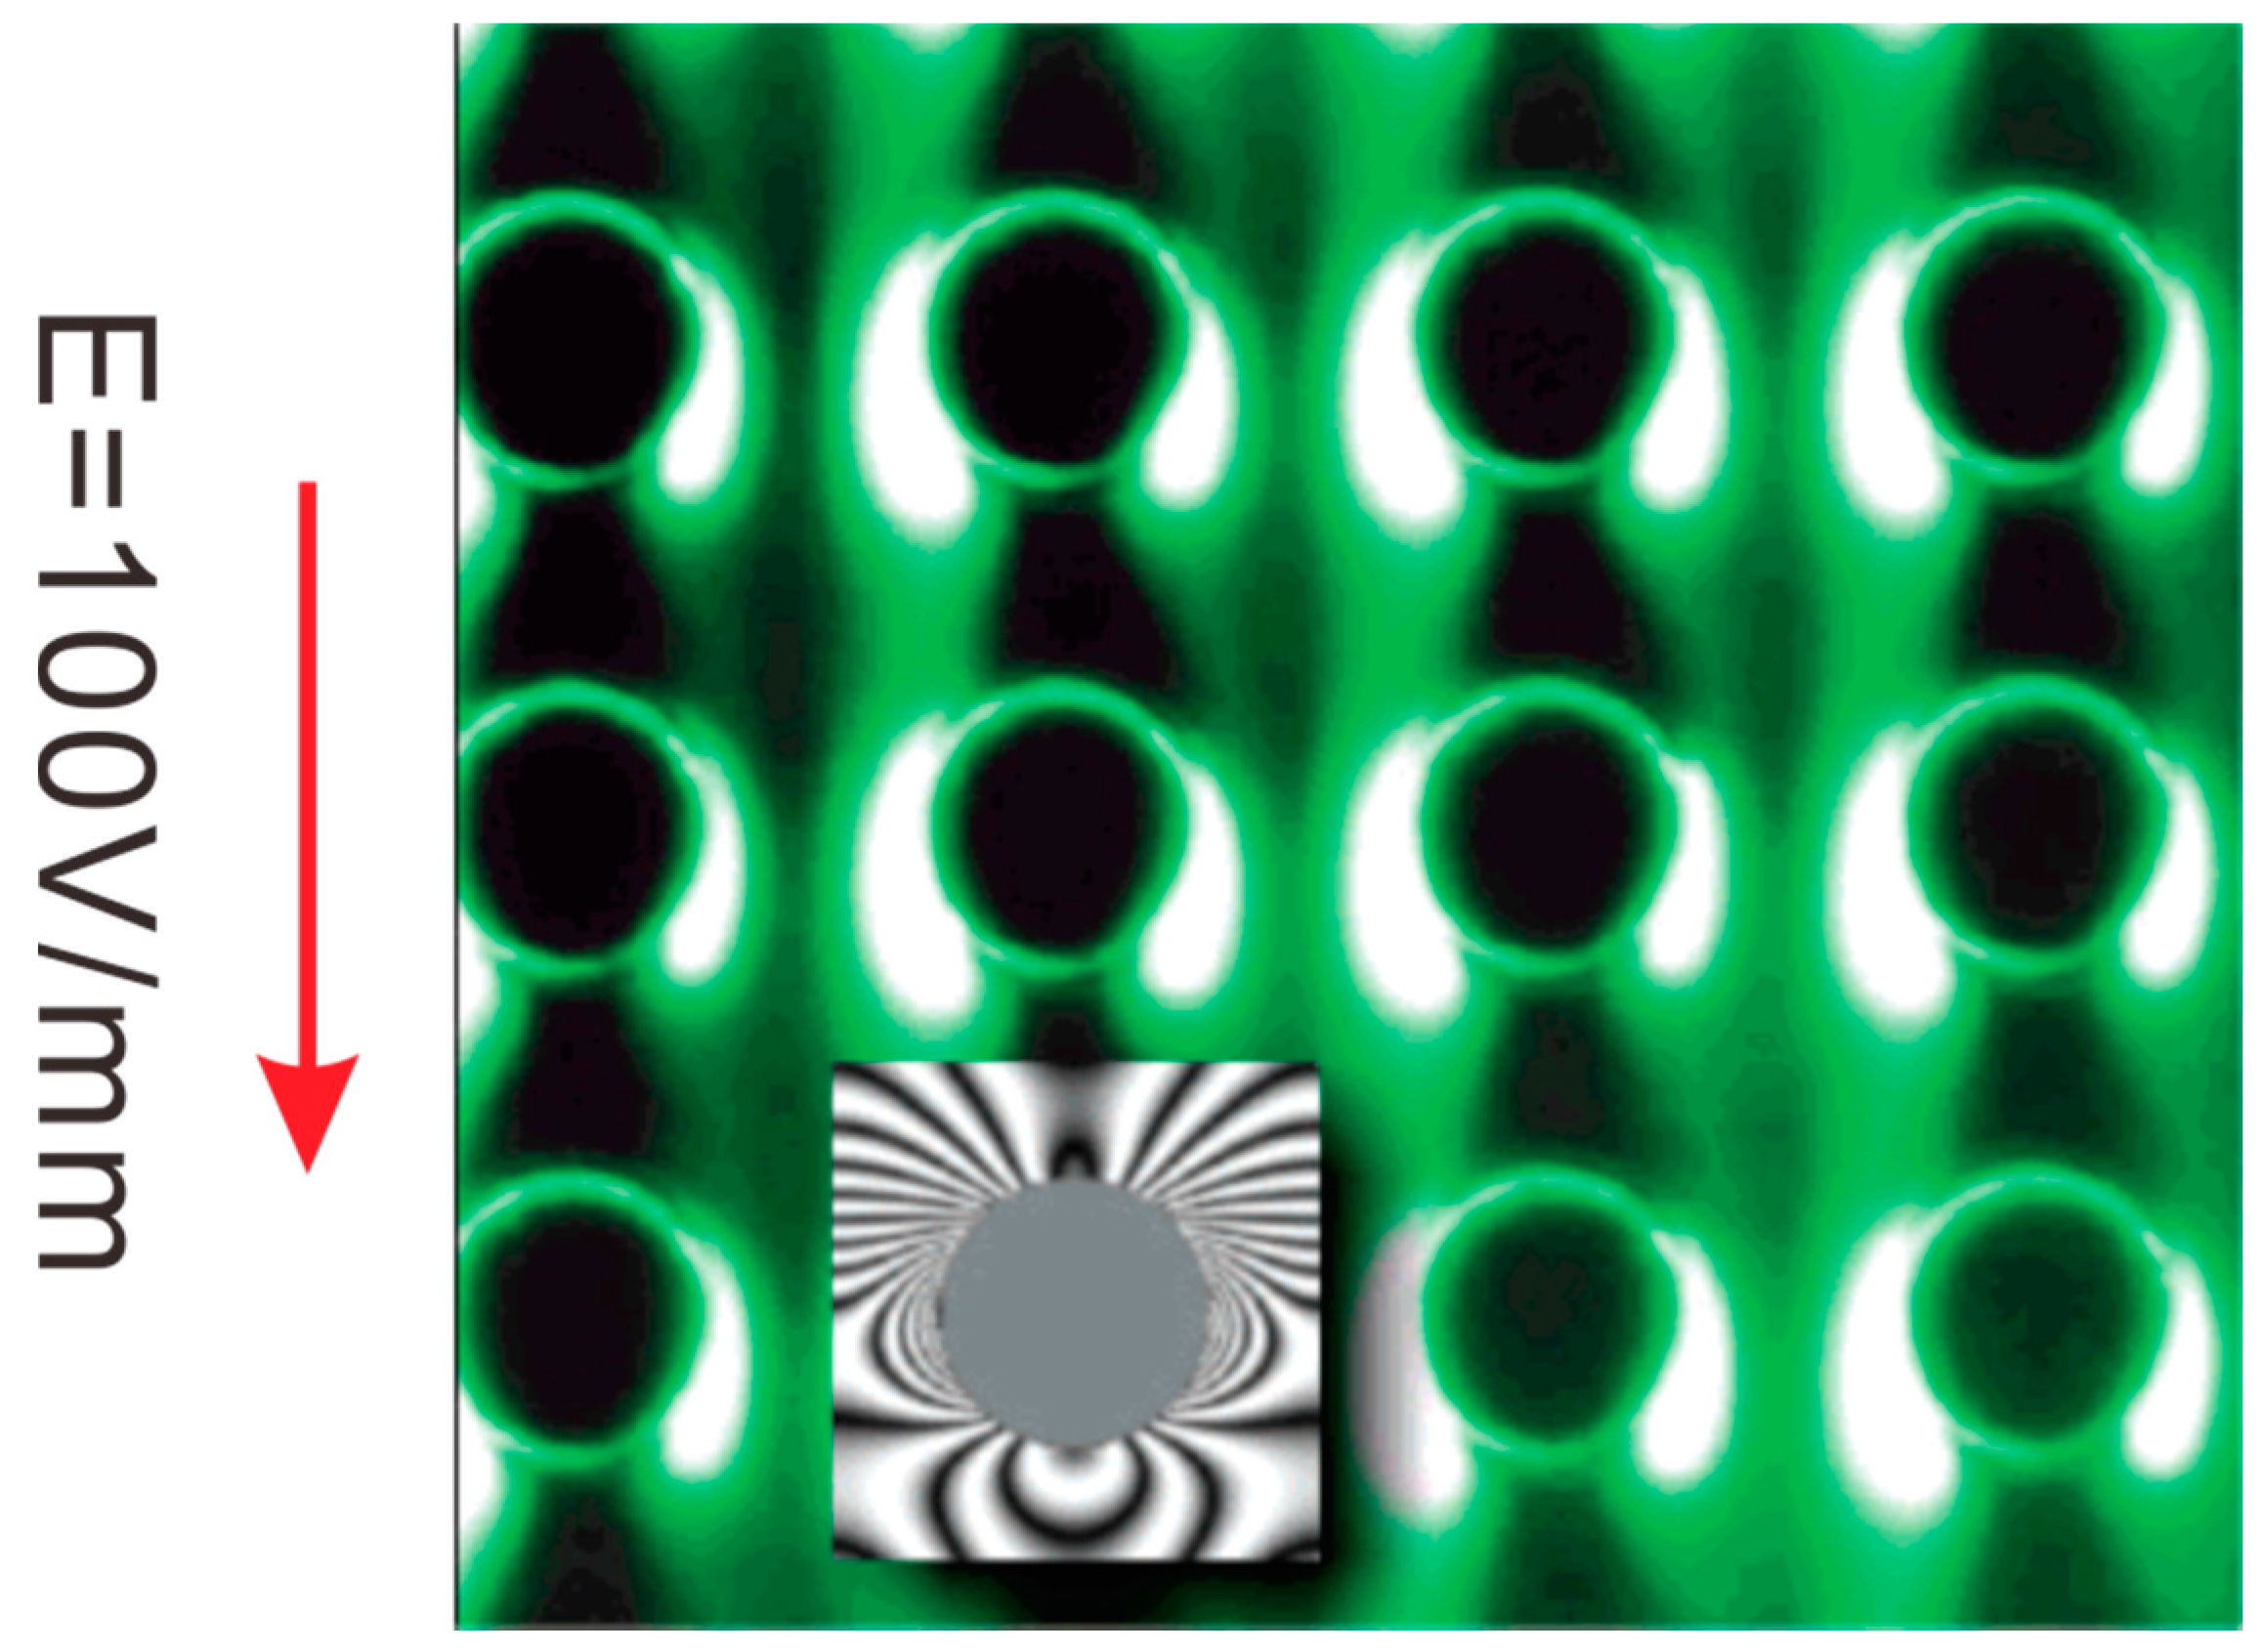
4.2. Dielectrophoretic Trapping (DEPT)
4.3. Immunocapture Based Trapping (ICBT)
4.4. Magnetic Beads Assisted Trapping (MBAT)
4.5. Thermophoretic Trapping (TPT)
4.6. Other Electrokinetic Methods
5. Summary and Conclusions
Acknowledgments
Author Contributions
Conflicts of Interest
References
- Psaltis, D.; Quake, S.R.; Yang, C. Developing optofluidic technology through the fusion of microfluidics and optics. Nature 2006, 442, 381–386. [Google Scholar] [CrossRef] [PubMed]
- Yager, P.; Edwards, T.; Fu, E.; Helton, K.; Nelson, K.; Tam, M.R.; Weigl, B.H. Microfluidic diagnostic technologies for global public health. Nature 2006, 442, 412–418. [Google Scholar] [CrossRef] [PubMed]
- Whitesides, G.M. The origins and the future of microfluidics. Nature 2006, 442, 368–373. [Google Scholar] [CrossRef] [PubMed]
- Dittrich, P.S.; Tachikawa, K.; Manz, A. Micro total analysis systems. Latest advancements and trends. Anal. Chem. 2006, 78, 3887–3908. [Google Scholar] [PubMed]
- Scriba, G.K.E. Pharmaceutical and biomedical applications of chiral capillary electrophoresis and capillary electrochromatography: An update. Electrophoresis 2003, 24, 2409–2421. [Google Scholar] [CrossRef] [PubMed]
- Verpoorte, E. Microfluidic chips for clinical and forensic analysis. Electrophoresis 2002, 23, 677–712. [Google Scholar] [CrossRef]
- Crompton, T.R. Preconcentration Techniques for Natural and Treated Waters: High Sensitivity Determination of Organic and Organometallic Compounds, Cations and Anions; Taylor & Francis: Oxon, UK, 2002. [Google Scholar]
- Pérez-Bendito, D.; Rubio, S. Chapter 5: Preconcentration of environmental samples. In Comprehensive Analytical Chemistry: Environmental Analytical Chemistry; Weber, S.G., Ed.; Elsevier: Amsterdam, The Netherlands, 1999; pp. 185–215. [Google Scholar]
- Chirila, E.S.; Draghici, C.; Dobrinas, S. Sampling and sample pretreatment for enviromental analysis. In Chemicals as Intentional and Accidental Global Environmental Threats; Simeonov, L., Chirila, E., Eds.; Springer: Dordrecht, The Netherlands, 2006; pp. 7–28. [Google Scholar]
- Marczenko, Z.; Balcerzak, M. Chapter 1—Separation and preconcentration of elements. In Analytical Spectroscopy Library; Zygmunt, M., Maria, B., Eds.; Elsevier: Amsterdam, The Netherlands, 2000; pp. 5–25. [Google Scholar]
- Giakisikli, G.; Anthemidis, A.N. Magnetic materials as sorbents for metal/metalloid preconcentration and/or separation. A review. Anal. Chim. Acta 2013, 789, 1–16. [Google Scholar] [CrossRef] [PubMed]
- Paulus, A.; Klockow, A. Detection of carbohydrates in capillary electrophoresis. J. Chromatogr. 1996, 720, 353–376. [Google Scholar] [CrossRef]
- Breadmore, M.C.; Haddad, P.R. Approaches to enhancing the sensitivity of capillary electrophoresis methods for the determination of inorganic and small organic anions. Electrophoresis 2001, 22, 2464–2489. [Google Scholar] [CrossRef]
- Malá, Z.; Křivánková, L.; Gebauer, P.; Boček, P. Contemporary sample stacking in CE: A sophisticated tool based on simple principles. Electrophoresis 2007, 28, 243–253. [Google Scholar] [CrossRef] [PubMed]
- Quirino, J.P.; Terabe, S. Exceeding 5000-fold concentration of dilute analytes in micellar electrokinetic chromatography. Science 1998, 282, 465–468. [Google Scholar] [CrossRef] [PubMed]
- Quirino, J.P.; Terabe, S. Sweeping of analyte zones in electrokinetic chromatography. Anal. Chem. 1999, 71, 1638–1644. [Google Scholar] [CrossRef]
- Aranas, A.T.; Guidote, A.M.; Quirino, J.P. Sweeping and new on-line sample preconcentration techniques in capillary electrophoresis. Anal. Bioanal. Chem. 2009, 394, 175–185. [Google Scholar] [CrossRef] [PubMed]
- Quirino, J.P.; Kim, J.-B.; Terabe, S. Sweeping: Concentration mechanism and applications to high-sensitivity analysis in capillary electrophoresis. J. Chromatogr. 2002, 965, 357–373. [Google Scholar] [CrossRef]
- Kitagawa, F.; Otsuka, K. Recent applications of on-line sample preconcentration techniques in capillary electrophoresis. J. Chromatogr. 2014, 1335, 43–60. [Google Scholar] [CrossRef] [PubMed]
- Quirino, J.P.; Terabe, S. Approaching a million-fold sensitivity increase in capillary electrophoresis with direct ultraviolet detection: Cation-selective exhaustive injection and sweeping. Anal. Chem. 2000, 72, 1023–1030. [Google Scholar] [CrossRef] [PubMed]
- Burgi, D.S.; Chien, R.L. Optimization in sample stacking for high-performance capillary electrophoresis. Anal. Chem. 1991, 63, 2042–2047. [Google Scholar] [CrossRef]
- Palmer, J.; Munro, N.J.; Landers, J.P. A universal concept for stacking neutral analytes in micellar capillary electrophoresis. Anal. Chem. 1999, 71, 1679–1687. [Google Scholar] [CrossRef] [PubMed]
- Zhang, C.-X.; Thormann, W. Head-column field-amplified sample stacking in binary system capillary electrophoresis: A robust approach providing over 1000-fold sensitivity enhancement. Anal. Chem. 1996, 68, 2523–2532. [Google Scholar] [CrossRef] [PubMed]
- Jung, B.; Bharadwaj, R.; Santiago, J.G. Thousandfold signal increase using field-amplified sample stacking for on-chip electrophoresis. Electrophoresis 2003, 24, 3476–3483. [Google Scholar] [CrossRef] [PubMed]
- Bharadwaj, R.; Santiago, J.G. Dynamics of field-amplified sample stacking. J. Fluid Mech. 2005, 543, 57–92. [Google Scholar] [CrossRef]
- Sustarich, J.M.; Storey, B.D.; Pennathur, S. Field-amplified sample stacking and focusing in nanofluidic channels. Phys. Fluids 2010, 22, 112003. [Google Scholar] [CrossRef]
- Wei, S.-Y.; Wang, L.-F.; Yang, Y.-H.; Yeh, H.-H.; Chen, Y.-C.; Chen, S.-H. Sample stacking by field-amplified sample injection and sweeping for simultaneous analysis of acidic and basic components in clinic application. Electrophoresis 2012, 33, 1571–1581. [Google Scholar] [CrossRef] [PubMed]
- Dziomba, S.; Kowalski, P.; Bączek, T. Field-amplified sample stacking–sweeping of vitamins B determination in capillary electrophoresis. J. Chromatogr. 2012, 1267, 224–230. [Google Scholar] [CrossRef] [PubMed]
- Gebauer, P.; Boček, P. Recent progress in capillary isotachophoresis. Electrophoresis 2002, 23, 3858–3864. [Google Scholar] [CrossRef] [PubMed]
- Urbánek, M.; Křivánková, L.; Boček, P. Stacking phenomena in electromigration: From basic principles to practical procedures. Electrophoresis 2003, 24, 466–485. [Google Scholar] [CrossRef] [PubMed]
- Ma, B.; Zhou, X.; Wang, G.; Huang, H.; Dai, Z.; Qin, J.; Lin, B. Integrated isotachophoretic preconcentration with zone electrophoresis separation on a quartz microchip for UV detection of flavonoids. Electrophoresis 2006, 27, 4904–4909. [Google Scholar] [CrossRef] [PubMed]
- Jung, B.; Bharadwaj, R.; Santiago, J.G. On-chip millionfold sample stacking using transient isotachophoresis. Anal. Chem. 2006, 78, 2319–2327. [Google Scholar] [CrossRef] [PubMed]
- Jung, B.; Zhu, Y.; Santiago, J.G. Detection of 100 aM fluorophores using a high-sensitivity on-chip CE system and transient isotachophoresis. Anal. Chem. 2007, 79, 345–349. [Google Scholar] [CrossRef] [PubMed]
- Khurana, T.K.; Santiago, J.G. Sample zone dynamics in peak mode isotachophoresis. Anal. Chem. 2008, 80, 6300–6307. [Google Scholar] [CrossRef] [PubMed]
- Bottenus, D.; Hossan, M.R.; Ouyang, Y.; Dong, W.-J.; Dutta, P.; Ivory, C.F. Preconcentration and detection of the phosphorylated forms of cardiac troponin I in a cascade microchip by cationic isotachophoresis. Lab Chip 2011, 11, 3793–3801. [Google Scholar] [CrossRef] [PubMed]
- Bottenus, D.; Jubery, T.Z.; Ouyang, Y.; Dong, W.-J.; Dutta, P.; Ivory, C.F. 10000-fold concentration increase of the biomarker cardiac troponin I in a reducing union microfluidic chip using cationic isotachophoresis. Lab Chip 2011, 11, 890–898. [Google Scholar] [CrossRef] [PubMed]
- Bottenus, D.; Jubery, T.Z.; Dutta, P.; Ivory, C.F. 10000-fold concentration increase in proteins in a cascade microchip using anionic ITP by a 3-D numerical simulation with experimental results. Electrophoresis 2011, 32, 550–562. [Google Scholar] [CrossRef] [PubMed]
- Shackman, J.G.; Ross, D. Counter-flow gradient electrofocusing. Electrophoresis 2007, 28, 556–571. [Google Scholar] [CrossRef] [PubMed]
- Righetti, P.G.; Bossi, A. Isoelectric focusing of proteins and peptides in gel slabs and in capillaries1. Anal. Chim. Acta 1998, 372, 1–19. [Google Scholar] [CrossRef]
- Ivory, C.F. Several new electrofocusing techniques. Electrophoresis 2007, 28, 15–25. [Google Scholar] [CrossRef]
- Shimura, K. Recent advances in capillary isoelectric focusing: 1997–2001. Electrophoresis 2002, 23, 3847–3857. [Google Scholar] [CrossRef] [PubMed]
- Kilár, F. Recent applications of capillary isoelectric focusing. Electrophoresis 2003, 24, 3908–3916. [Google Scholar] [CrossRef] [PubMed]
- Shim, J.; Dutta, P.; Ivory, C.F. Effects of ampholyte concentration on protein behavior in on-chip isoelectric focusing. Electrophoresis 2008, 29, 1026–1035. [Google Scholar] [CrossRef]
- Montgomery, R.; Jia, X.; Tolley, L. Dynamic isoelectric focusing for proteomics. Anal. Chem. 2006, 78, 6511–6518. [Google Scholar] [CrossRef] [PubMed]
- Mosher, R.A.; Thormann, W. High-resolution computer simulation of the dynamics of isoelectric focusing: In quest of more realistic input parameters for carrier ampholytes. Electrophoresis 2008, 29, 1036–1047. [Google Scholar] [CrossRef] [PubMed]
- Yang, K.S.; Clementz, P.; Park, T.J.; Lee, S.J.; Park, J.P.; Kim, D.H.; Lee, S.Y. Free-flow isoelectric focusing microfluidic device with glass coating by sol–gel methods. Curr. Appl. Phys. 2009, 9, e66–e70. [Google Scholar] [CrossRef]
- Kelly, R.T.; Woolley, A.T. Electric field gradient focusing. J. Sep. Sci. 2005, 28, 1985–1993. [Google Scholar] [CrossRef] [PubMed]
- Meighan, M.M.; Staton, S.J.R.; Hayes, M.A. Bioanalytical separations using electric field gradient techniques. Electrophoresis 2009, 30, 852–865. [Google Scholar] [CrossRef] [PubMed]
- Koegler, W.S.; Ivory, C.F. Focusing proteins in an electric field gradient. J. Chromatogr. 1996, 726, 229–236. [Google Scholar] [CrossRef]
- Petsev, D.N.; Lopez, G.P.; Ivory, C.F.; Sibbett, S.S. Microchannel protein separation by electric field gradient focusing. Lab Chip 2005, 5, 587–597. [Google Scholar] [CrossRef] [PubMed]
- Tolley, H.D.; Wang, Q.; LeFebre, D.A.; Lee, M.L. Equilibrium gradient methods with nonlinear field intensity gradient: A theoretical approach. Anal. Chem. 2002, 74, 4456–4463. [Google Scholar] [CrossRef] [PubMed]
- Humble, P.H.; Kelly, R.T.; Woolley, A.T.; Tolley, H.D.; Lee, M.L. Electric field gradient focusing of proteins based on shaped ionically conductive acrylic polymer. Anal. Chem. 2004, 76, 5641–5648. [Google Scholar] [CrossRef] [PubMed]
- Liu, J.; Sun, X.; Farnsworth, P.B.; Lee, M.L. Fabrication of conductive membrane in a polymeric electric field gradient focusing microdevice. Anal. Chem. 2006, 78, 4654–4662. [Google Scholar] [CrossRef] [PubMed]
- Kelly, R.T.; Li, Y.; Woolley, A.T. Phase-changing sacrificial materials for interfacing microfluidics with ion-permeable membranes to create on-chip preconcentrators and electric field gradient focusing microchips. Anal. Chem. 2006, 78, 2565–2570. [Google Scholar] [CrossRef] [PubMed]
- Sun, X.; Li, D.; Woolley, A.T.; Farnsworth, P.B.; Tolley, H.D.; Warnick, K.F.; Lee, M.L. Bilinear electric field gradient focusing. J. Chromatogr. 2009, 1216, 6532–6538. [Google Scholar] [CrossRef] [PubMed]
- Sun, X.; Farnsworth, P.B.; Tolley, H.D.; Warnick, K.F.; Woolley, A.T.; Lee, M.L. Performance optimization in electric field gradient focusing. J. Chromatogr. 2009, 1216, 159–164. [Google Scholar] [CrossRef] [PubMed]
- Ansell, R.J.; Tunon, P.G.; Wang, Y.; Myers, P.; Ivory, C.F.; Keen, J.N.; Findlay, J.B.C. Electrophoretic field gradient focusing with on-column detection by fluorescence quenching. Analyst 2009, 134, 226–229. [Google Scholar] [CrossRef] [PubMed]
- Ross, D.; Locascio, L.E. Microfluidic temperature gradient focusing. Anal. Chem. 2002, 74, 2556–2564. [Google Scholar] [CrossRef] [PubMed]
- Balss, K.M.; Ross, D.; Begley, H.C.; Olsen, K.G.; Tarlov, M.J. DNA hybridization assays using temperature gradient focusing and peptide nucleic acids. J. Am. Chem. Soc. 2004, 126, 13474–13479. [Google Scholar] [CrossRef] [PubMed]
- Balss, K.M.; Vreeland, W.N.; Howell, P.B.; Henry, A.C.; Ross, D. Micellar affinity gradient focusing: A new method for electrokinetic focusing. J. Am. Chem. Soc. 2004, 126, 1936–1937. [Google Scholar] [CrossRef] [PubMed]
- Balss, K.M.; Vreeland, W.N.; Phinney, K.W.; Ross, D. Simultaneous concentration and separation of enantiomers with chiral temperature gradient focusing. Anal. Chem. 2004, 76, 7243–7249. [Google Scholar] [CrossRef] [PubMed]
- Hoebel, S.J.; Balss, K.M.; Jones, B.J.; Malliaris, C.D.; Munson, M.S.; Vreeland, W.N.; Ross, D. Scanning temperature gradient focusing. Anal. Chem. 2006, 78, 7186–7190. [Google Scholar] [CrossRef] [PubMed]
- Munson, M.S.; Danger, G.; Shackman, J.G.; Ross, D. Temperature gradient focusing with field-amplified continuous sample injection for dual-stage analyte enrichment and separation. Anal. Chem. 2007, 79, 6201–6207. [Google Scholar] [CrossRef] [PubMed]
- Munson, M.S.; Meacham, J.M.; Locascio, L.E.; Ross, D. Counterflow rejection of adsorbing proteins for characterization of biomolecular interactions by temperature gradient focusing. Anal. Chem. 2008, 80, 172–178. [Google Scholar] [CrossRef] [PubMed]
- Munson, M.S.; Meacham, J.M.; Ross, D.; Locascio, L.E. Development of aptamer-based affinity assays using temperature gradient focusing: Minimization of the limit of detection. Electrophoresis 2008, 29, 3456–3465. [Google Scholar] [CrossRef] [PubMed]
- Lin, H.; Shackman, J.G.; Ross, D. Finite sample effect in temperature gradient focusing. Lab Chip 2008, 8, 969–978. [Google Scholar] [CrossRef] [PubMed]
- Huber, D.E.; Santiago, J.G. Taylor–Aris dispersion in temperature gradient focusing. Electrophoresis 2007, 28, 2333–2344. [Google Scholar] [CrossRef] [PubMed]
- Huber, D.E.; Santiago, J.G. Ballistic dispersion in temperature gradient focusing. Proc. R. Soc. 2008, 464, 595–612. [Google Scholar] [CrossRef]
- Becker, M.; Mansouri, A.; Beilein, C.; Janasek, D. Temperature gradient focusing in miniaturized free-flow electrophoresis devices. Electrophoresis 2009, 30, 4206–4212. [Google Scholar] [CrossRef] [PubMed]
- Maynes, D.; Webb, B.W. Fully developed electro-osmotic heat transfer in microchannels. Int. J. Heat Mass Transf. 2003, 46, 1359–1369. [Google Scholar] [CrossRef]
- Maynes, D.; Webb, B.W. Fully-developed thermal transport in combined pressure and electro-osmotically driven flow in microchannels. J. Heat Transf. 2003, 125, 889–895. [Google Scholar] [CrossRef]
- Zhao, C.; Yang, C. Joule heating induced heat transfer for electroosmotic flow of power-law fluids in a microcapillary. Int. J. Heat Mass Transf. 2012, 55, 2044–2051. [Google Scholar] [CrossRef]
- Horiuchi, K.; Dutta, P.; Hossain, A. Joule-heating effects in mixed electroosmotic and pressure-driven microflows under constant wall heat flux. J. Eng. Math. 2005, 54, 159–180. [Google Scholar] [CrossRef]
- Horiuchi, K.; Dutta, P. Joule heating effects in electroosmotically driven microchannel flows. Int. J. Heat Mass Transf. 2004, 47, 3085–3095. [Google Scholar] [CrossRef]
- Tang, G.Y.; Yang, C.; Chai, C.J.; Gong, H.Q. Modeling of electroosmotic flow and capillary electrophoresis with the joule heating effect: The Nernst−Planck equation versus the Boltzmann distribution. Langmuir 2003, 19, 10975–10984. [Google Scholar] [CrossRef]
- Tang, G.Y.; Yang, C.; Chai, J.C.; Gong, H.Q. Joule heating effect on electroosmotic flow and mass species transport in a microcapillary. Int. J. Heat Mass Transf. 2004, 47, 215–227. [Google Scholar] [CrossRef]
- Xuan, X.; Sinton, D.; Li, D. Thermal end effects on electroosmotic flow in a capillary. Int. J. Heat Mass Transf. 2004, 47, 3145–3157. [Google Scholar] [CrossRef]
- Kim, S.M.; Sommer, G.J.; Burns, M.A.; Hasselbrink, E.F. Low-power concentration and separation using temperature gradient focusing via Joule heating. Anal. Chem. 2006, 78, 8028–8035. [Google Scholar] [CrossRef] [PubMed]
- Sommer, G.J.; Kim, S.M.; Littrell, R.J.; Hasselbrink, E.F. Theoretical and numerical analysis of temperature gradient focusing via Joule heating. Lab Chip 2007, 7, 898–907. [Google Scholar] [CrossRef] [PubMed]
- Tang, G.; Yang, C. Numerical modeling of Joule heating-induced temperature gradient focusing in microfluidic channels. Electrophoresis 2008, 29, 1006–1012. [Google Scholar] [CrossRef] [PubMed]
- Ge, Z.; Yang, C.; Tang, G. Concentration enhancement of sample solutes in a sudden expansion microchannel with Joule heating. Int. J. Heat Mass Transf. 2010, 53, 2722–2731. [Google Scholar] [CrossRef]
- Ge, Z.; Wang, W.; Yang, C. Towards high concentration enhancement of microfluidic temperature gradient focusing of sample solutes using combined AC and DC field induced Joule heating. Lab Chip 2011, 11, 1396–1402. [Google Scholar] [CrossRef] [PubMed]
- Ge, Z.; Jin, L.; Yang, C. Microfluidic concentration of sample solutes using Joule heating effects under a combined AC and DC electric field. Int. J. Heat Mass Transf. 2015, 85, 158–165. [Google Scholar] [CrossRef]
- Ge, Z.; Wang, W.; Yang, C. Rapid concentration of deoxyribonucleic acid via Joule heating induced temperature gradient focusing in poly-dimethylsiloxane microfluidic channel. Anal. Chim. Acta 2015, 858, 91–97. [Google Scholar] [CrossRef] [PubMed]
- Kim, S.J.; Song, Y.-A.; Han, J. Nanofluidic concentration devices for biomolecules utilizing ion concentration polarization: Theory, fabrication, and applications. Chem. Soc. Rev. 2010, 39, 912–922. [Google Scholar] [CrossRef] [PubMed]
- Schoch, R.B.; Han, J.; Renaud, P. Transport phenomena in nanofluidics. Rev. Mod. Phys. 2008, 80, 839–883. [Google Scholar] [CrossRef]
- Son, S.Y.; Lee, S.; Lee, H.; Kim, S.J. Engineered nanofluidic preconcentration devices by ion concentration polarization. BioChip J. 2016, 10, 251–261. [Google Scholar] [CrossRef]
- Dai, J.; Ito, T.; Sun, L.; Crooks, R.M. Electrokinetic trapping and concentration enrichment of DNA in a microfluidic channel. J. Am. Chem. Soc. 2003, 125, 13026–13027. [Google Scholar] [CrossRef] [PubMed]
- Hahn, T.; O’Sullivan, C.K.; Drese, K.S. Microsystem for field-amplified electrokinetic trapping preconcentration of DNA at poly(ethylene terephthalate) membranes. Anal. Chem. 2009, 81, 2904–2911. [Google Scholar] [CrossRef] [PubMed]
- Wang, Y.-C.; Stevens, A.L.; Han, J. Million-fold preconcentration of proteins and peptides by nanofluidic filter. Anal. Chem. 2005, 77, 4293–4299. [Google Scholar] [CrossRef] [PubMed]
- Wang, Y.-C.; Han, J. Pre-binding dynamic range and sensitivity enhancement for immuno-sensors using nanofluidic preconcentrator. Lab Chip 2008, 8, 392–394. [Google Scholar] [CrossRef] [PubMed]
- Li, M.; Anand, R.K. Recent advancements in ion concentration polarization. Analyst 2016, 141, 3496–3510. [Google Scholar] [CrossRef] [PubMed]
- Ko, S.H.; Song, Y.-A.; Kim, S.J.; Kim, M.; Han, J.; Kang, K.H. Nanofluidic preconcentration device in a straight microchannel using ion concentration polarization. Lab Chip 2012, 12, 4472–4482. [Google Scholar] [CrossRef] [PubMed]
- Liu, V.; Song, Y.-A.; Han, J. Capillary-valve-based fabrication of ion-selective membrane junction for electrokinetic sample preconcentration in PDMS chip. Lab Chip 2010, 10, 1485–1490. [Google Scholar] [CrossRef] [PubMed]
- Lee, J.H.; Song, Y.-A.; Han, J. Multiplexed proteomic sample preconcentration device using surface-patterned ion-selective membrane. Lab Chip 2008, 8, 596–601. [Google Scholar] [CrossRef] [PubMed]
- Kim, S.J.; Han, J. Self-sealed vertical polymeric nanoporous-junctions for high-throughput nanofluidic applications. Anal. Chem. 2008, 80, 3507–3511. [Google Scholar] [CrossRef] [PubMed]
- Choi, J.; Huh, K.; Moon, D.J.; Lee, H.; Son, S.Y.; Kim, K.; Kim, H.C.; Chae, J.-H.; Sung, G.Y.; Kim, H.-Y.; Hong, J.W.; Kim, S.J. Selective preconcentration and online collection of charged molecules using ion concentration polarization. RSC Adv. 2015, 5, 66178–66184. [Google Scholar] [CrossRef]
- Kwak, R.; Kang, J.Y.; Kim, T.S. Spatiotemporally defining biomolecule preconcentration by merging ion concentration polarization. Anal. Chem. 2016, 88, 988–996. [Google Scholar] [CrossRef]
- Phan, D.-T.; Shaegh, S.A.M.; Yang, C.; Nguyen, N.-T. Sample concentration in a microfluidic paper-based analytical device using ion concentration polarization. Sens. Actuators 2016, 222, 735–740. [Google Scholar] [CrossRef]
- Yang, R.-J.; Pu, H.-H.; Wang, H.-L. Ion concentration polarization on paper-based microfluidic devices and its application to preconcentrate dilute sample solutions. Biomicrofluidics 2015, 9, 014122. [Google Scholar] [CrossRef] [PubMed]
- Phan, D.-T.; Yang, C.; Nguyen, N.-T. Fabrication of nanoporous junctions using off-the-shelf Nafion membrane. J. Micromech. Microeng. 2015, 25, 115019. [Google Scholar] [CrossRef]
- Jones, T.B. Electromechanics of Particles; Cambridge University Press: Cambridge, UK, 1995. [Google Scholar]
- Asbury, C.L.; Engh, G.v.d. Trapping of DNA in nonuniform oscillating electric fields. Biophys. J. 1998, 74, 1024–1030. [Google Scholar] [CrossRef]
- Yang, L.; Banada, P.P.; Chatni, M.R.; Seop Lim, K.; Bhunia, A.K.; Ladisch, M.; Bashir, R. A multifunctional micro-fluidic system for dielectrophoretic concentration coupled with immuno-capture of low numbers of Listeria monocytogenes. Lab Chip 2006, 6, 896–905. [Google Scholar] [CrossRef]
- Park, K.; Suk, H.-J.; Akin, D.; Bashir, R. Dielectrophoresis-based cell manipulation using electrodes on a reusable printed circuit board. Lab Chip 2009, 9, 2224–2229. [Google Scholar] [CrossRef] [PubMed]
- Lee, H.-Y.; Voldman, J. Optimizing micromixer design for enhancing dielectrophoretic microconcentrator performance. Anal. Chem. 2007, 79, 1833–1839. [Google Scholar] [CrossRef] [PubMed]
- Gadish, N.; Voldman, J. High-throughput positive-dielectrophoretic bioparticle microconcentrator. Anal. Chem. 2006, 78, 7870–7876. [Google Scholar] [CrossRef] [PubMed]
- Du, J.-R.; Juang, Y.-J.; Wu, J.-T.; Wei, H.-H. Long-range and superfast trapping of DNA molecules in an AC electrokinetic funnel. Biomicrofluidics 2008, 2, 044103. [Google Scholar] [CrossRef] [PubMed]
- Du, J.-R.; Wei, H.-H. Focusing and trapping of DNA molecules by head-on AC electrokinetic streaming through join asymmetric polarization. Biomicrofluidics 2010, 4, 034108. [Google Scholar] [CrossRef] [PubMed]
- Loucaides, N.G.; Ramos, A.; Georghiou, G.E. Initial concentration and fluidic effects on the dielectrophoretic trapping of DNA. Phys. Status Solidi 2010, 7, 2755–2758. [Google Scholar] [CrossRef]
- Loucaides, N.G.; Ramos, A.; Georghiou, G.E. Dielectrophoretic and AC electroosmotic trapping of DNA: Numerical simulation incorporating fluid dynamics and steric particle effects. J. Electrostat. 2011, 69, 111–118. [Google Scholar] [CrossRef]
- Cummings, E.B.; Singh, A.K. Dielectrophoresis in microchips containing arrays of insulating posts: Theoretical and experimental results. Anal. Chem. 2003, 75, 4724–4731. [Google Scholar] [CrossRef] [PubMed]
- Chou, C.-F.; Tegenfeldt, J.O.; Bakajin, O.; Chan, S.S.; Cox, E.C.; Darnton, N.; Duke, T.; Austin, R.H. Electrodeless dielectrophoresis of single- and double-stranded DNA. Biophys. J. 2002, 83, 2170–2179. [Google Scholar] [CrossRef]
- Lapizco-Encinas, B.H.; Simmons, B.A.; Cummings, E.B.; Fintschenko, Y. Dielectrophoretic concentration and separation of live and dead bacteria in an array of insulators. Anal. Chem. 2004, 76, 1571–1579. [Google Scholar] [CrossRef] [PubMed]
- Lapizco-Encinas, B.H.; Simmons, B.A.; Cummings, E.B.; Fintschenko, Y. Insulator-based dielectrophoresis for the selective concentration and separation of live bacteria in water. Electrophoresis 2004, 25, 1695–1704. [Google Scholar] [CrossRef] [PubMed]
- Mela, P.; van den Berg, A.; Fintschenko, Y.; Cummings, E.B.; Simmons, B.A.; Kirby, B.J. The zeta potential of cyclo-olefin polymer microchannels and its effects on insulative (electrodeless) dielectrophoresis particle trapping devices. Electrophoresis 2005, 26, 1792–1799. [Google Scholar] [CrossRef] [PubMed]
- Chen, D.; Du, H.; Tay, C. Rapid Concentration of Nanoparticles with DC dielectrophoresis in focused electric fields. Nanoscale Res. Lett. 2009, 5, 55–60. [Google Scholar] [CrossRef] [PubMed]
- Lewpiriyawong, N.; Yang, C.; Lam, Y.C. Electrokinetically driven concentration of particles and cells by dielectrophoresis with DC-offset AC electric field. Microfluid. Nanofluid. 2012, 12, 723–733. [Google Scholar] [CrossRef]
- Zhao, K.; Peng, R.; Li, D. Separation of nanoparticles by a nano-orifice based DC-dielectrophoresis method in a pressure-driven flow. Nanoscale 2016, 8, 18945–18955. [Google Scholar] [CrossRef] [PubMed]
- Hawkins, B.G.; Kirby, B.J. Electrothermal flow effects in insulating (electrodeless) dielectrophoresis systems. Electrophoresis 2010, 31, 3622–3633. [Google Scholar] [CrossRef] [PubMed]
- Sridharan, S.; Zhu, J.; Hu, G.; Xuan, X. Joule heating effects on electroosmotic flow in insulator-based dielectrophoresis. Electrophoresis 2011, 32, 2274–2281. [Google Scholar] [CrossRef] [PubMed]
- Pratt, E.D. How to Sort Circulating Tumor Cells Part II: Immunocapture. 2012. Available online: https://pratted.wordpress.com/2012/11/13/how-to-sort-circulating-tumor-cells-part-ii-immunocapture/#comments (accessed on 17 January 2017).
- Nagrath, S.; Sequist, L.V.; Maheswaran, S.; Bell, D.W.; Irimia, D.; Ulkus, L.; Smith, M.R.; Kwak, E.L.; Digumarthy, S.; Muzikansky, A.; et al. Isolation of rare circulating tumour cells in cancer patients by microchip technology. Nature 2007, 450, 1235–1239. [Google Scholar] [CrossRef] [PubMed]
- Dharmasiri, U.; Njoroge, S.K.; Witek, M.A.; Adebiyi, M.G.; Kamande, J.W.; Hupert, M.L.; Barany, F.; Soper, S.A. High-Throughput Selection, Enumeration, Electrokinetic manipulation, and molecular profiling of low-abundance circulating tumor cells using a microfluidic system. Anal. Chem. 2011, 83, 2301–2309. [Google Scholar] [CrossRef] [PubMed]
- Gleghorn, J.P.; Pratt, E.D.; Denning, D.; Liu, H.; Bander, N.H.; Tagawa, S.T.; Nanus, D.M.; Giannakakou, P.A.; Kirby, B.J. Capture of circulating tumor cells from whole blood of prostate cancer patients using geometrically enhanced differential immunocapture (GEDI) and a prostate-specific antibody. Lab Chip 2010, 10, 27–29. [Google Scholar] [CrossRef] [PubMed]
- Yang, L.; Lang, J.C.; Balasubramanian, P.; Jatana, K.R.; Schuller, D.; Agrawal, A.; Zborowski, M.; Chalmers, J.J. Optimization of an enrichment process for circulating tumor cells from the blood of head and neck cancer patients through depletion of normal cells. Biotechnol. Bioeng. 2009, 102, 521–534. [Google Scholar] [CrossRef] [PubMed]
- Lara, O.; Tong, X.; Zborowski, M.; Chalmers, J.J. Enrichment of rare cancer cells through depletion of normal cells using density and flow-through, immunomagnetic cell separation. Exp. Hematol. 2004, 32, 891–904. [Google Scholar] [CrossRef] [PubMed]
- Liu, Z.; Fusi, A.; Klopocki, E.; Schmittel, A.; Tinhofer, I.; Nonnenmacher, A.; Keilholz, U. Negative enrichment by immunomagnetic nanobeads for unbiased characterization of circulating tumor cells from peripheral blood of cancer patients. J. Transl. Med. 2011, 9, 70. [Google Scholar] [CrossRef] [PubMed]
- Mok, J.; Mindrinos, M.N.; Davis, R.W.; Javanmard, M. Digital microfluidic assay for protein detection. Proc. Natl. Acad. Sci. USA 2014, 111, 2110–2115. [Google Scholar] [PubMed]
- Wang, S.; Esfahani, M.; Gurkan, U.A.; Inci, F.; Kuritzkes, D.R.; Demirci, U. Efficient on-chip isolation of HIV subtypes. Lab Chip 2012, 12, 1508–1515. [Google Scholar] [CrossRef] [PubMed]
- Thege, F.I.; Lannin, T.B.; Saha, T.N.; Tsai, S.; Kochman, M.L.; Hollingsworth, M.A.; Rhim, A.D.; Kirby, B.J. Microfluidic immunocapture of circulating pancreatic cells using parallel EpCAM and MUC1 capture: Characterization, optimization and downstream analysis. Lab Chip 2014, 14, 1775–1784. [Google Scholar] [CrossRef] [PubMed]
- Hughes, A.D.; King, M.R. Use of naturally occurring halloysite nanotubes for enhanced capture of flowing cells. Langmuir 2010, 26, 12155–12164. [Google Scholar] [CrossRef] [PubMed]
- Wang, S.; Wang, H.; Jiao, J.; Chen, K.-J.; Owens, G.E.; Kamei, K.-I.; Sun, J.; Sherman, D.J.; Behrenbruch, C.P.; Wu, H.; Tseng, H.-R. Three-dimensional nanostructured substrates toward efficient capture of circulating tumor cells. Angew. Chem. Int. Ed. 2009, 48, 8970–8973. [Google Scholar] [CrossRef] [PubMed]
- Wang, L.; Asghar, W.; Demirci, U.; Wan, Y. Nanostructured substrates for isolation of circulating tumor cells. Nano Today 2013, 8, 374–387. [Google Scholar] [CrossRef]
- Stott, S.L.; Hsu, C.-H.; Tsukrov, D.I.; Yu, M.; Miyamoto, D.T.; Waltman, B.A.; Rothenberg, S.M.; Shah, A.M.; Smas, M.E.; Korir, G.K.; et al. Isolation of circulating tumor cells using a microvortex-generating herringbone-chip. Proc. Natl. Acad. Sci. USA 2010, 107, 18392–18397. [Google Scholar] [CrossRef] [PubMed]
- Wang, S.; Liu, K.; Liu, J.; Yu, Z.T.F.; Xu, X.; Zhao, L.; Lee, T.; Lee, E.K.; Reiss, J.; Lee, Y.-K.; et al. Highly Efficient capture of circulating tumor cells by using nanostructured silicon substrates with integrated chaotic micromixers. Angew. Chem. Int. Ed. 2011, 50, 3084–3088. [Google Scholar] [CrossRef] [PubMed]
- Powell, A.A.; Talasaz, A.H.; Zhang, H.; Coram, M.A.; Reddy, A.; Deng, G.; Telli, M.L.; Advani, R.H.; Carlson, R.W.; Mollick, J.A.; et al. Single cell profiling of circulating tumor cells: Transcriptional heterogeneity and diversity from breast cancer cell lines. PLoS ONE 2012, 7, e33788. [Google Scholar] [CrossRef] [PubMed]
- Mohamadi, R.M.; Svobodova, Z.; Bilkova, Z.; Otto, M.; Taverna, M.; Descroix, S.; Viovy, J.-L. An integrated microfluidic chip for immunocapture, preconcentration and separation of β-amyloid peptides. Biomicrofluidics 2015, 9, 054117. [Google Scholar] [CrossRef] [PubMed]
- Hong, C.S.; Muller, L.; Boyiadzis, M.; Whiteside, T.L. Isolation and characterization of CD34+ blast-derived exosomes in acute myeloid leukemia. PLoS ONE 2014, 9, e103310. [Google Scholar] [CrossRef] [PubMed]
- Ozalp, V.C.; Bayramoglu, G.; Kavruk, M.; Keskin, B.B.; Oktem, H.A.; Arica, M.Y. Pathogen detection by core–shell type aptamer-magnetic preconcentration coupled to real-time PCR. Anal. Biochem. 2014, 447, 119–125. [Google Scholar] [CrossRef] [PubMed]
- Chen, H.-X.; Busnel, J.-M.; Gassner, A.-L.; Peltre, G.; Zhang, X.-X.; and Girault, H.H. Capillary electrophoresis immunoassay using magnetic beads. Electrophoresis 2008, 29, 3414–3421. [Google Scholar] [CrossRef] [PubMed]
- Riethdorf, S.; Fritsche, H.; Müller, V.; Rau, T.; Schindlbeck, C.; Rack, B.; Janni, W.; Coith, C.; Beck, K.; Jänicke, F.; et al. Detection of circulating tumor cells in peripheral blood of patients with metastatic breast cancer: a validation study of the cellsearch system. Clin. Cancer Res. 2007, 13, 920–928. [Google Scholar] [CrossRef] [PubMed]
- Cohen, S.J.; Punt, C.J.A.; Iannotti, N.; Saidman, B.H.; Sabbath, K.D.; Gabrail, N.Y.; Picus, J.; Morse, M.; Mitchell, E.; Miller, M.C.; et al. Relationship of circulating tumor cells to tumor response, progression-free survival, and overall survival in patients with metastatic colorectal cancer. J. Clin. Oncol. 2008, 26, 3213–3221. [Google Scholar] [CrossRef] [PubMed]
- de Bono, J.S.; Scher, H.I.; Montgomery, R.B.; Parker, C.; Miller, M.C.; Tissing, H.; Doyle, G.V.; Terstappen, L.W.W.M.; Pienta, K.J.; Raghavan, D. Circulating tumor cells predict survival benefit from treatment in metastatic castration-resistant prostate cancer. Clin. Cancer Res. 2008, 14, 6302–6309. [Google Scholar] [CrossRef] [PubMed]
- Huang, C.; Liu, H.; Bander, N.H.; Kirby, B.J. Enrichment of prostate cancer cells from blood cells with a hybrid dielectrophoresis and immunocapture microfluidic system. Biomed. Microdevices 2013, 15, 941–948. [Google Scholar] [CrossRef] [PubMed]
- Smith, J.P.; Huang, C.; Kirby, B.J. Enhancing sensitivity and specificity in rare cell capture microdevices with dielectrophoresis. Biomicrofluidics 2015, 9, 014116. [Google Scholar] [CrossRef] [PubMed]
- Smith, J.P.; Lannin, T.B.; Syed, Y.A.; Santana, S.M.; Kirby, B.J. Parametric control of collision rates and capture rates in geometrically enhanced differential immunocapture (GEDI) microfluidic devices for rare cell capture. Biomed. Microdevices 2014, 16, 143–151. [Google Scholar] [CrossRef] [PubMed]
- Kirby, B.J.; Jodari, M.; Loftus, M.S.; Gakhar, G.; Pratt, E.D.; Chanel-Vos, C.; Gleghorn, J.P.; Santana, S.M.; He, L.; Smith, J.P.; et al. Functional characterization of circulating tumor cells with a prostate-cancer-specific microfluidic device. PLoS ONE 2012, 7, e35976. [Google Scholar] [CrossRef]
- Santana, S.M.; Liu, H.; Bander, N.H.; Gleghorn, J.P.; Kirby, B.J. Immunocapture of prostate cancer cells by use of anti-PSMA antibodies in microdevices. Biomed. Microdevices 2012, 14, 401–407. [Google Scholar] [CrossRef] [PubMed]
- Galletti, G.; Sung, M.S.; Vahdat, L.T.; Shah, M.A.; Santana, S.M.; Altavilla, G.; Kirby, B.J.; Giannakakou, P. Isolation of breast cancer and gastric cancer circulating tumor cells by use of an anti HER2-based microfluidic device. Lab Chip 2014, 14, 147–156. [Google Scholar] [CrossRef] [PubMed]
- Sarioglu, A.F.; Aceto, N.; Kojic, N.; Donaldson, M.C.; Zeinali, M.; Hamza, B.; Engstrom, A.; Zhu, H.; Sundaresan, T.K.; Miyamoto, D.T.; et al. A microfluidic device for label-free, physical capture of circulating tumor cell clusters. Nat. Methods 2015, 12, 685–691. [Google Scholar] [CrossRef] [PubMed]
- Miltenyi, S.; Müller, W.; Weichel, W.; Radbruch, A. High gradient magnetic cell separation with MACS. Cytometry 1990, 11, 231–238. [Google Scholar] [CrossRef] [PubMed]
- Chen, P.; Huang, Y.-Y.; Hoshino, K.; Zhang, X. Multiscale immunomagnetic enrichment of circulating tumor cells: From tubes to microchips. Lab Chip 2014, 14, 446–458. [Google Scholar] [CrossRef] [PubMed]
- Talasaz, A.H.; Powell, A.A.; Huber, D.E.; Berbee, J.G.; Roh, K.-H.; Yu, W.; Xiao, W.; Davis, M.M.; Pease, R.F.; Mindrinos, M.N.; et al. Isolating highly enriched populations of circulating epithelial cells and other rare cells from blood using a magnetic sweeper device. Proc. Natl. Acad. Sci. USA 2009, 106, 3970–3975. [Google Scholar] [CrossRef] [PubMed]
- Horák, D.; Babič, M.; Macková, H.; Beneš, M.J. Preparation and properties of magnetic nano- and microsized particles for biological and environmental separations. J. Sep. Sci. 2007, 30, 1751–1772. [Google Scholar] [CrossRef] [PubMed]
- Brian, D.P.; Shashi, K.M.; Laura, H.L. Fundamentals and application of magnetic particles in cell isolation and enrichment: A review. Rep. Prog. Phys. 2015, 78, 016601. [Google Scholar]
- Hoshino, K.; Huang, Y.-Y.; Lane, N.; Huebschman, M.; Uhr, J.W.; Frenkel, E.P.; Zhang, X. Microchip-based immunomagnetic detection of circulating tumor cells. Lab Chip 2011, 11, 3449–3457. [Google Scholar] [CrossRef] [PubMed]
- Plouffe, B.D.; Mahalanabis, M.; Lewis, L.H.; Klapperich, C.M.; Murthy, S.K. Clinically relevant microfluidic magnetophoretic isolation of rare-cell populations for diagnostic and therapeutic monitoring applications. Anal. Chem. 2012, 84, 1336–1344. [Google Scholar] [CrossRef] [PubMed]
- Tsai, S.S.H.; Griffiths, I.M.; Stone, H.A. Microfluidic immunomagnetic multi-target sorting—A model for controlling deflection of paramagnetic beads. Lab Chip 2011, 11, 2577–2582. [Google Scholar] [CrossRef] [PubMed]
- Luo, W.-Y.; Tsai, S.-C.; Hsieh, K.; Lee, G.-B. An integrated microfluidic platform for negative selection and enrichment of cancer cells. J. Micromech. Microeng. 2015, 25, 084007. [Google Scholar] [CrossRef]
- Wang, Z.; Wu, W.; Wang, Z.; Tang, Y.; Deng, Y.; Xu, L.; Tian, J.; Shi, Q. Ex vivo expansion of circulating lung tumor cells based on one-step microfluidics-based immunomagnetic isolation. Analyst 2016, 141, 3621–3625. [Google Scholar] [CrossRef] [PubMed]
- Braun, D.; Libchaber, A. Trapping of DNA by thermophoretic depletion and convection. Phys. Rev. Lett. 2002, 89, 188103. [Google Scholar] [CrossRef] [PubMed]
- Duhr, S.; Braun, D. Why molecules move along a temperature gradient. Proc. Natl. Acad. Sci. USA 2006, 103, 19678–19682. [Google Scholar] [CrossRef] [PubMed]
- Mast, C.B.; Braun, D. Thermal trap for DNA replication. Phys. Rev. Lett. 2010, 104, 188102. [Google Scholar] [CrossRef] [PubMed]
- Duhr, S.; Braun, D. Optothermal molecule trapping by opposing fluid flow with thermophoretic drift. Phys. Rev. Lett. 2006, 97, 038103. [Google Scholar] [CrossRef] [PubMed]
- Serey, X.; Mandal, S.; Chen, Y.-F.; Erickson, D. DNA transport and delivery in thermal gradients near optofluidic resonators. Phys. Rev. Lett. 2012, 108, 048102. [Google Scholar] [CrossRef] [PubMed]
- Khandurina, J.; Jacobson, S.C.; Waters, L.C.; Foote, R.S.; Ramsey, J.M. Microfabricated porous membrane structure for sample concentration and electrophoretic analysis. Anal. Chem. 1999, 71, 1815–1819. [Google Scholar] [CrossRef] [PubMed]
- Foote, R.S.; Khandurina, J.; Jacobson, S.C.; Ramsey, J.M. Preconcentration of proteins on microfluidic devices using porous silica membranes. Anal. Chem. 2005, 77, 57–63. [Google Scholar] [CrossRef] [PubMed]
- Kuo, C.-H.; Wang, J.-H.; Lee, G.-B. A microfabricated CE chip for DNA pre-concentration and separation utilizing a normally closed valve. Electrophoresis 2009, 30, 3228–3235. [Google Scholar] [CrossRef] [PubMed]
- Kuo, I.T.; Chiu, T.-C.; Chang, H.-T. On-column concentration and separation of double-stranded DNA by gradient capillary electrophoresis. Electrophoresis 2003, 24, 3339–3347. [Google Scholar] [CrossRef] [PubMed]
- Park, S.-R.; Swerdlow, H. Concentration of DNA in a flowing stream for high-sensitivity capillary electrophoresis. Anal. Chem. 2003, 75, 4467–4474. [Google Scholar] [CrossRef] [PubMed]
- Wanunu, M.; Morrison, W.; Rabin, Y.; Grosberg, A.Y.; Meller, A. Electrostatic focusing of unlabelled DNA into nanoscale pores using a salt gradient. Nat. Nano 2010, 5, 160–165. [Google Scholar] [CrossRef] [PubMed]
- Paik, K.-H.; Liu, Y.; Tabard-Cossa, V.; Waugh, M.J.; Huber, D.E.; Provine, J.; Howe, R.T.; Dutton, R.W.; Davis, R.W. Control of DNA capture by nanofluidic transistors. ACS Nano 2012, 6, 6767–6775. [Google Scholar] [CrossRef] [PubMed]
- Dhopeshwarkar, R.; Hlushkou, D.; Nguyen, M.; Tallarek, U.; Crooks, R.M. Electrokinetics in microfluidic channels containing a floating electrode. J. Am. Chem. Soc. 2008, 130, 10480–10481. [Google Scholar] [CrossRef] [PubMed]
- Hlushkou, D.; Perdue, R.K.; Dhopeshwarkar, R.; Crooks, R.M.; Tallarek, U. Electric field gradient focusing in microchannels with embedded bipolar electrode. Lab Chip 2009, 9, 1903–1913. [Google Scholar] [CrossRef] [PubMed]
- Perdue, R.K.; Laws, D.R.; Hlushkou, D.; Tallarek, U.; Crooks, R.M. Bipolar electrode focusing: the effect of current and electric field on concentration enrichment. Anal. Chem. 2009, 81, 10149–10155. [Google Scholar] [CrossRef] [PubMed]
- Daghighi, Y.; Li, D. Numerical studies of electrokinetic control of DNA concentration in a closed-end microchannel. Electrophoresis 2010, 31, 868–878. [Google Scholar] [CrossRef] [PubMed]


© 2017 by the authors. Licensee MDPI, Basel, Switzerland. This article is an open access article distributed under the terms and conditions of the Creative Commons Attribution (CC BY) license ( http://creativecommons.org/licenses/by/4.0/).
Share and Cite
Zhao, C.; Ge, Z.; Yang, C. Microfluidic Techniques for Analytes Concentration. Micromachines 2017, 8, 28. https://doi.org/10.3390/mi8010028
Zhao C, Ge Z, Yang C. Microfluidic Techniques for Analytes Concentration. Micromachines. 2017; 8(1):28. https://doi.org/10.3390/mi8010028
Chicago/Turabian StyleZhao, Cunlu, Zhengwei Ge, and Chun Yang. 2017. "Microfluidic Techniques for Analytes Concentration" Micromachines 8, no. 1: 28. https://doi.org/10.3390/mi8010028
APA StyleZhao, C., Ge, Z., & Yang, C. (2017). Microfluidic Techniques for Analytes Concentration. Micromachines, 8(1), 28. https://doi.org/10.3390/mi8010028