
A Novel Classification Technique of Arteriovenous Fistula Stenosis Evaluation Using Bilateral PPG Analysis


Abstract
:
1. Introduction
2. Material and Method
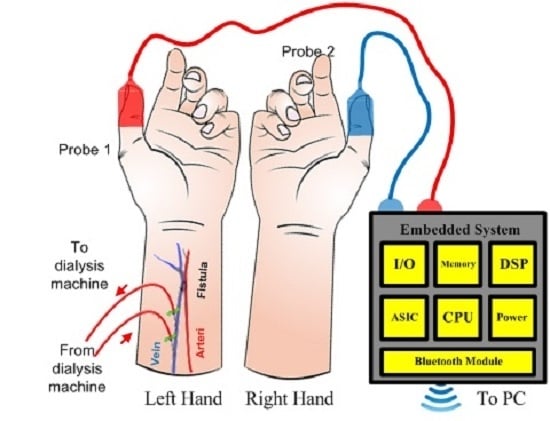
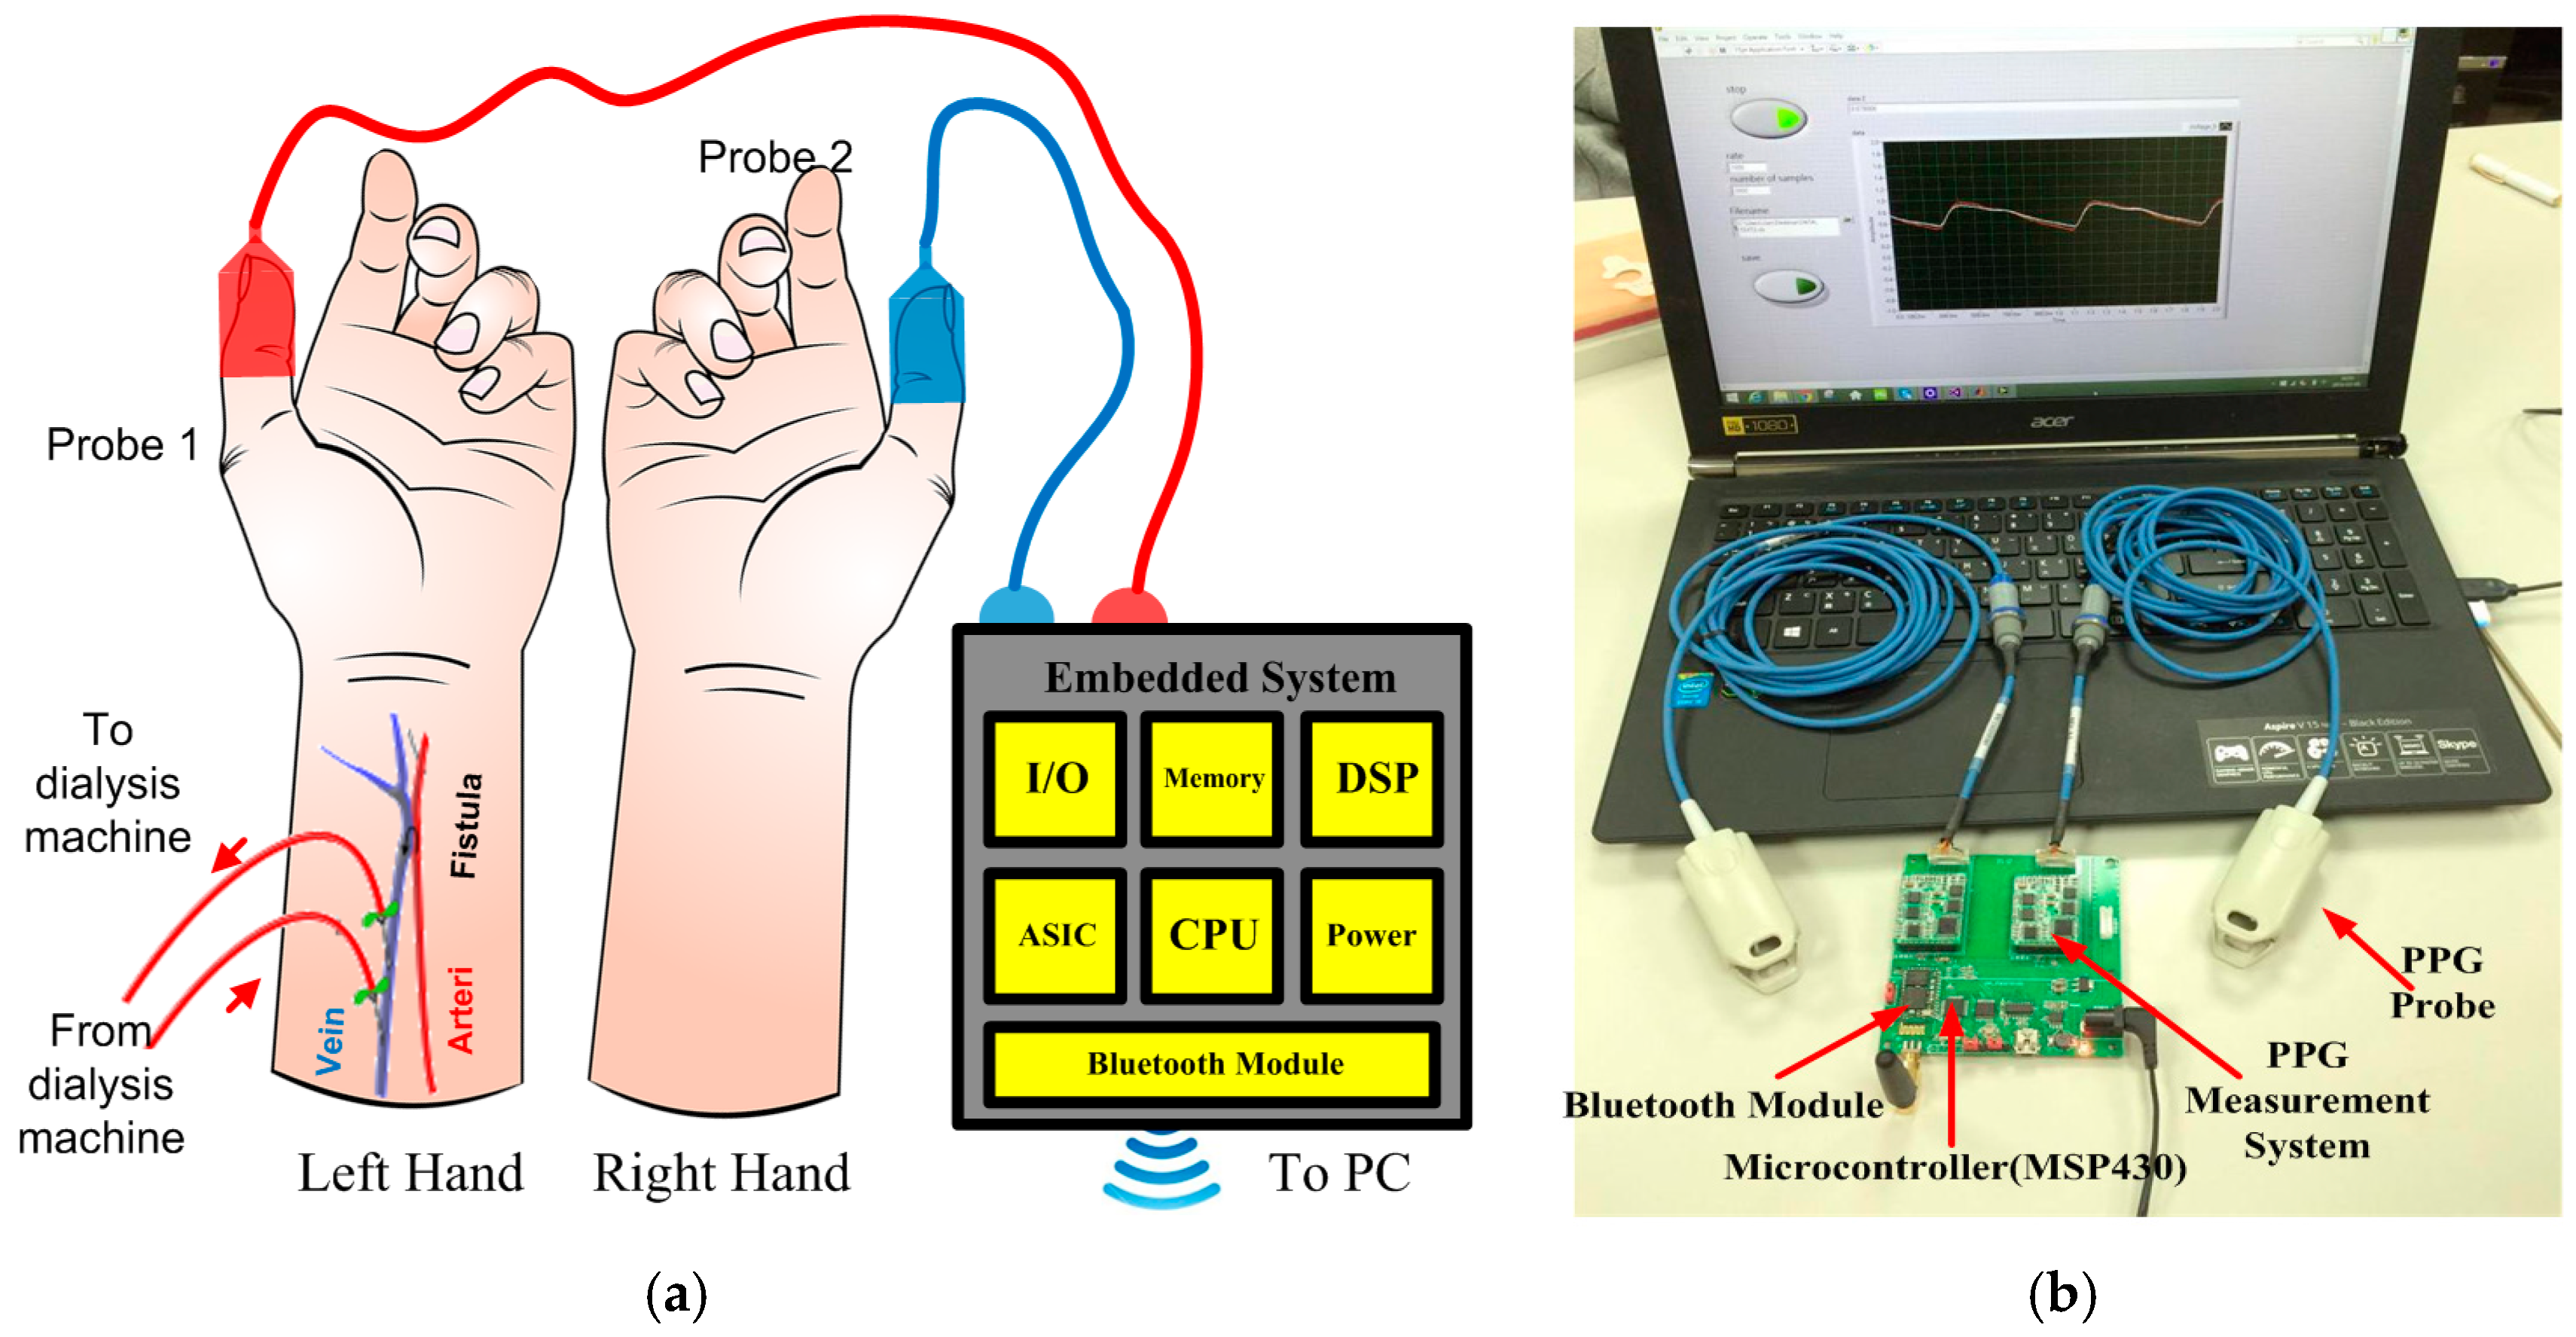
2.1. Material
2.2. Method
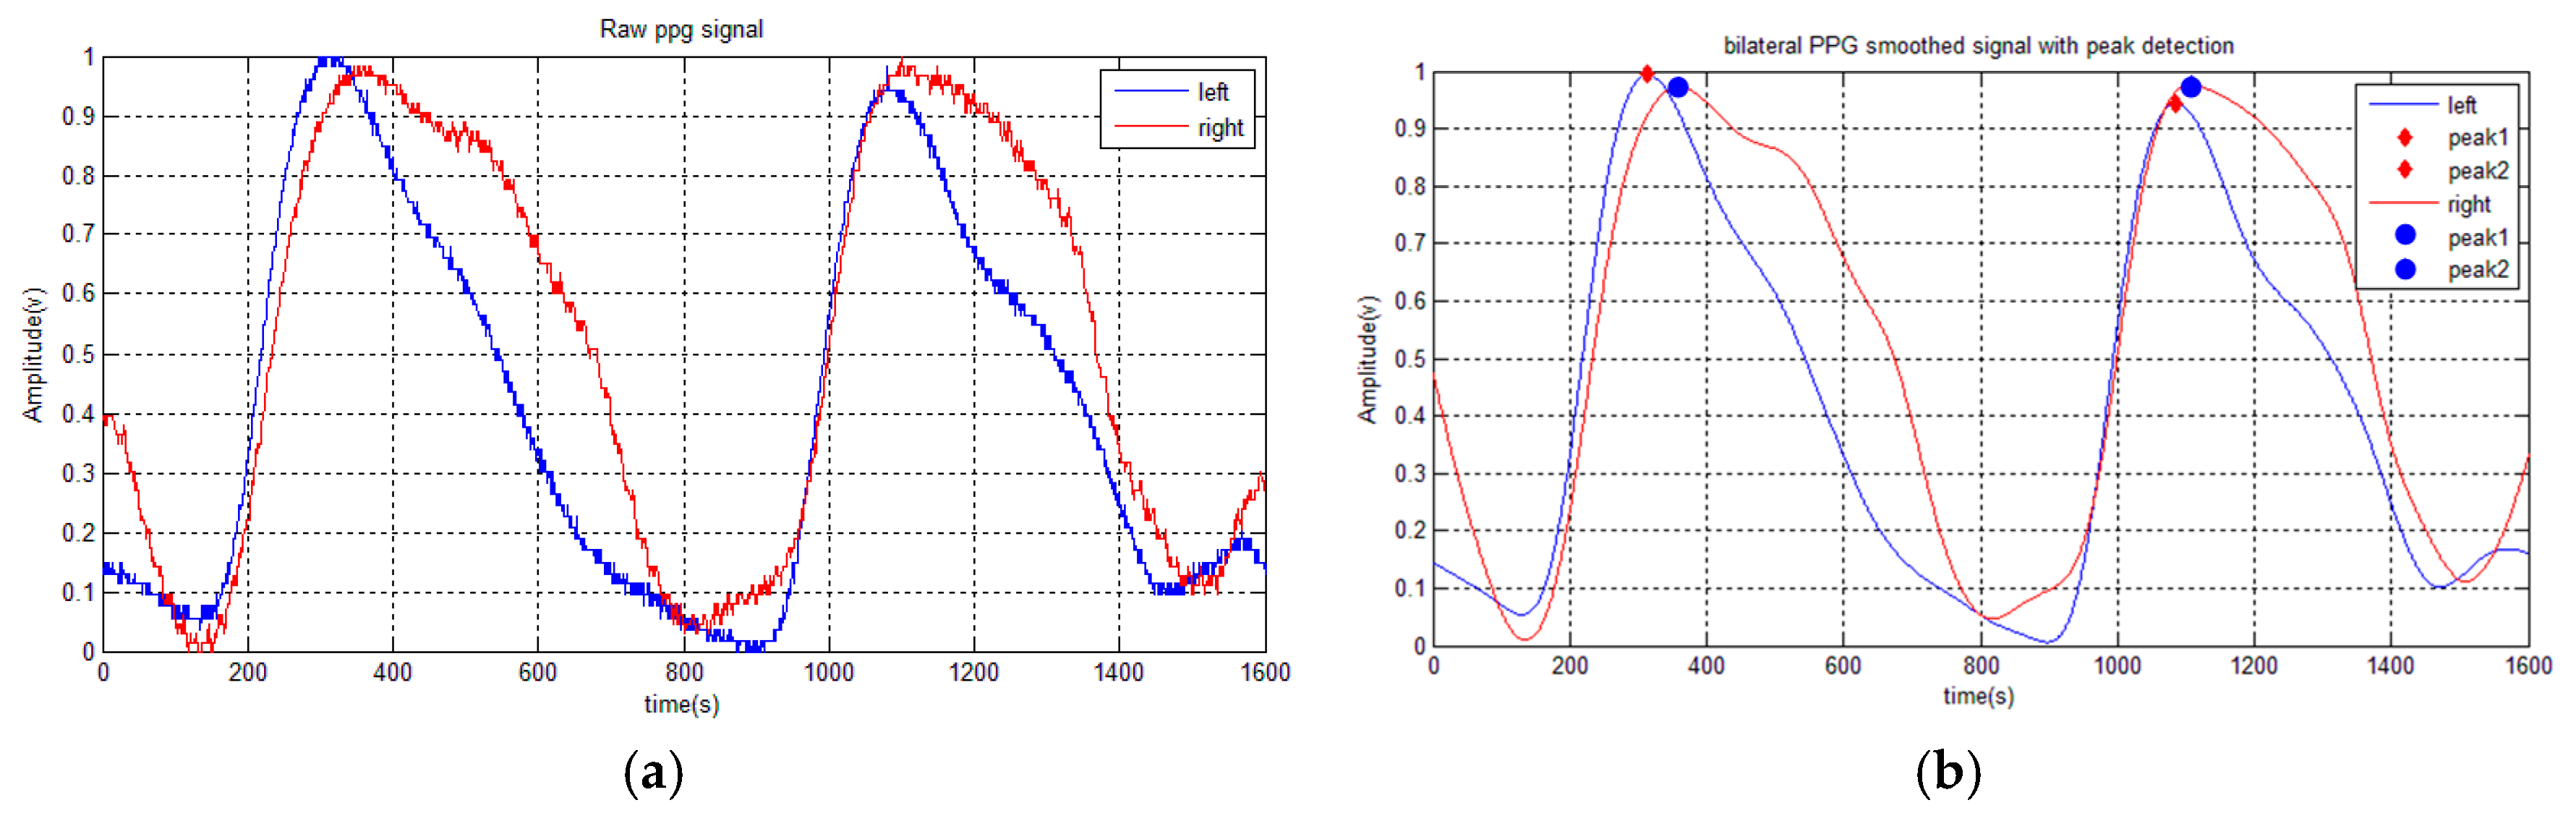
2.2.1. Preprocessing (Step 1–2)
2.2.2. Feature Extraction (Step 3–5)
2.2.3. Classification (Step 6)
- (a)
- Support Vector Machine
- (b)
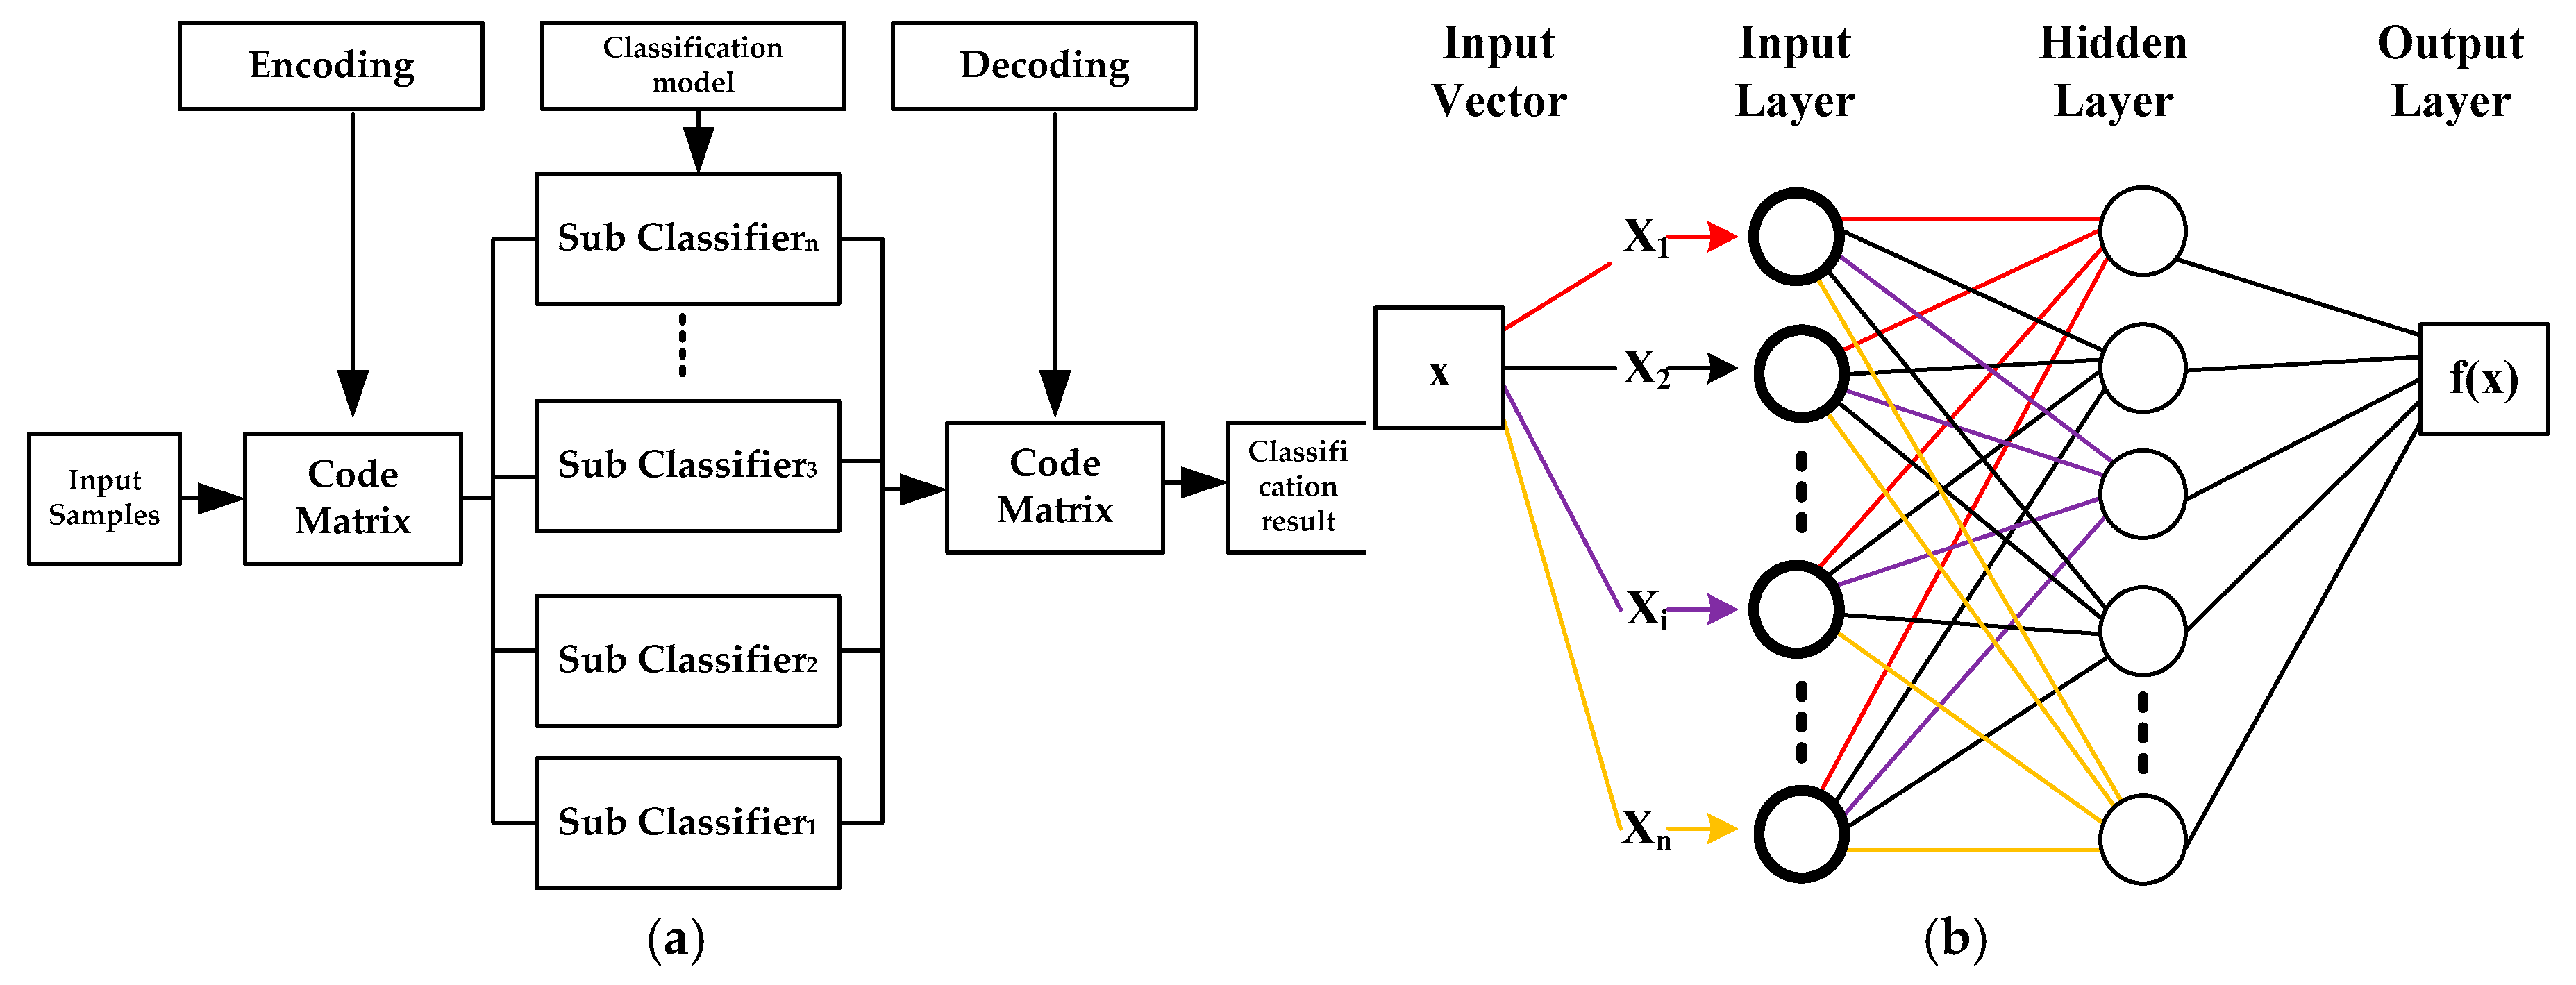
- ESVM-One Versus Rest (OVR)
- (c)
- Artificial Neural Network
3. Results
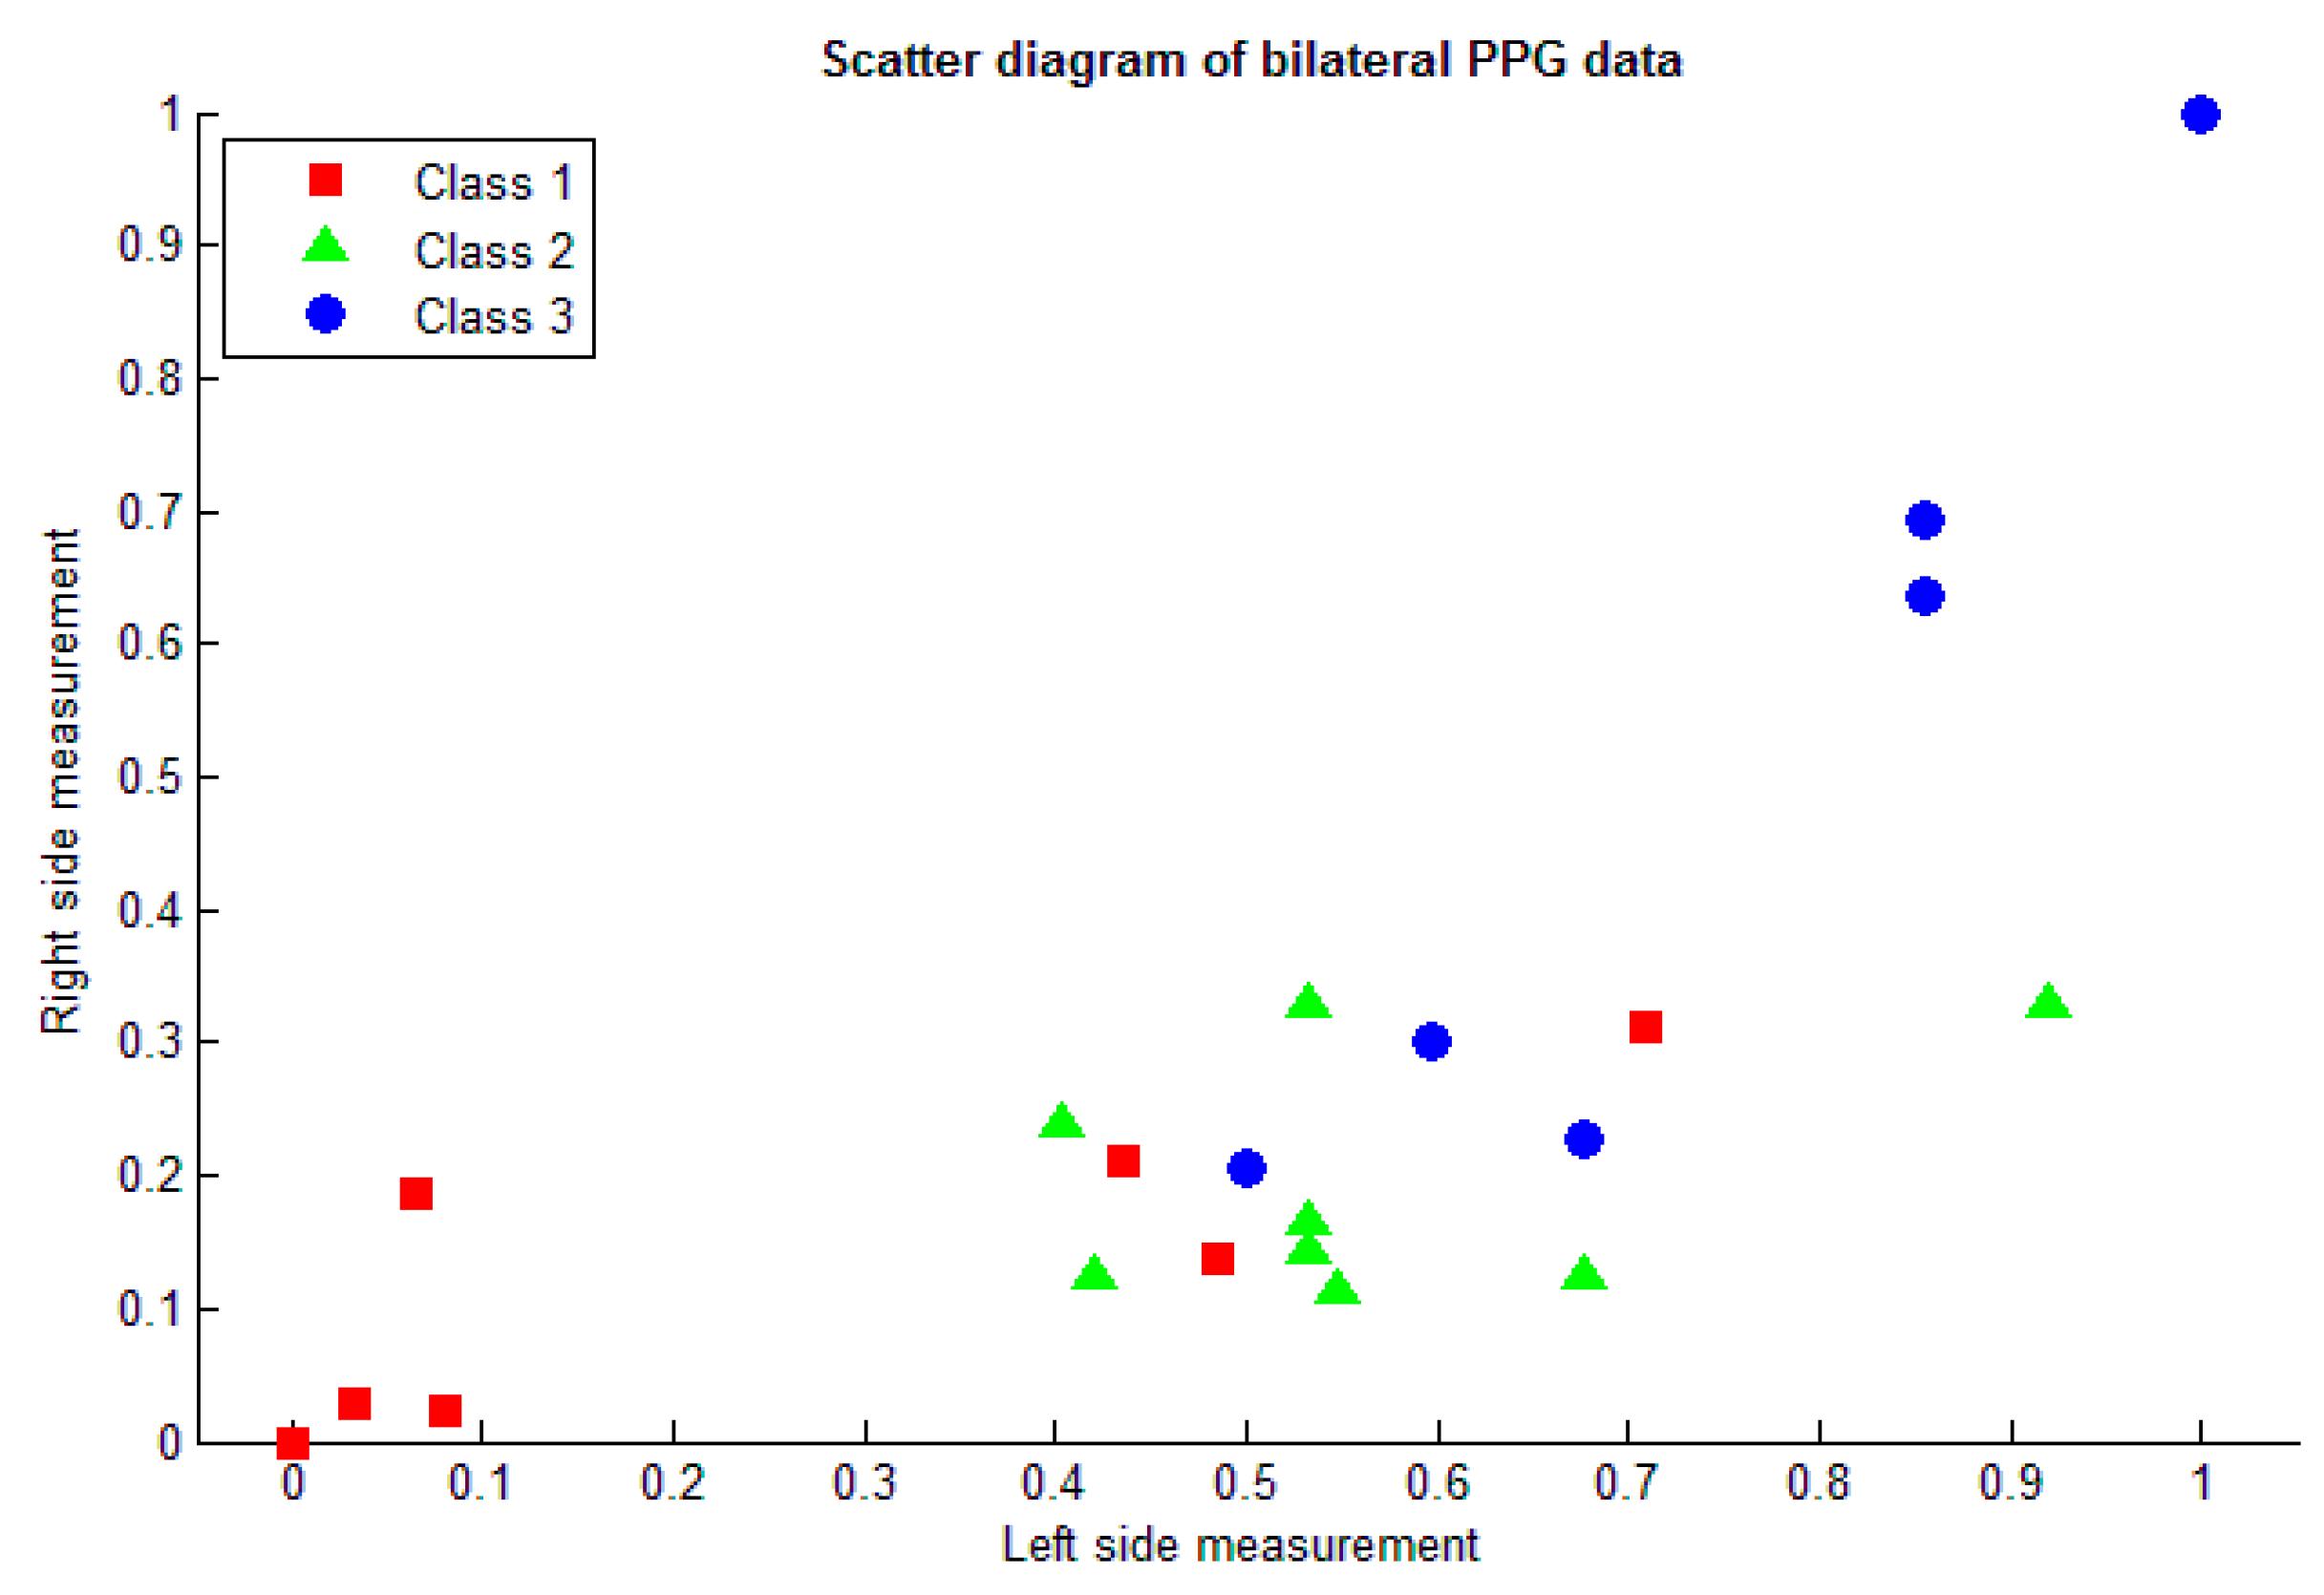
3.1. Feature Extraction
3.2. Classification
4. Discussion
5. Conclusions
Author Contributions
Conflicts of Interest
Abbreviations
| ESRD | End state renal disease |
| HD | Hemodialysis |
| AVF | Arteriovenous fistula |
| PPG | Photoplethysmography |
| ESVM-OVR | Error correcting output coding support vector machine-one versus rest |
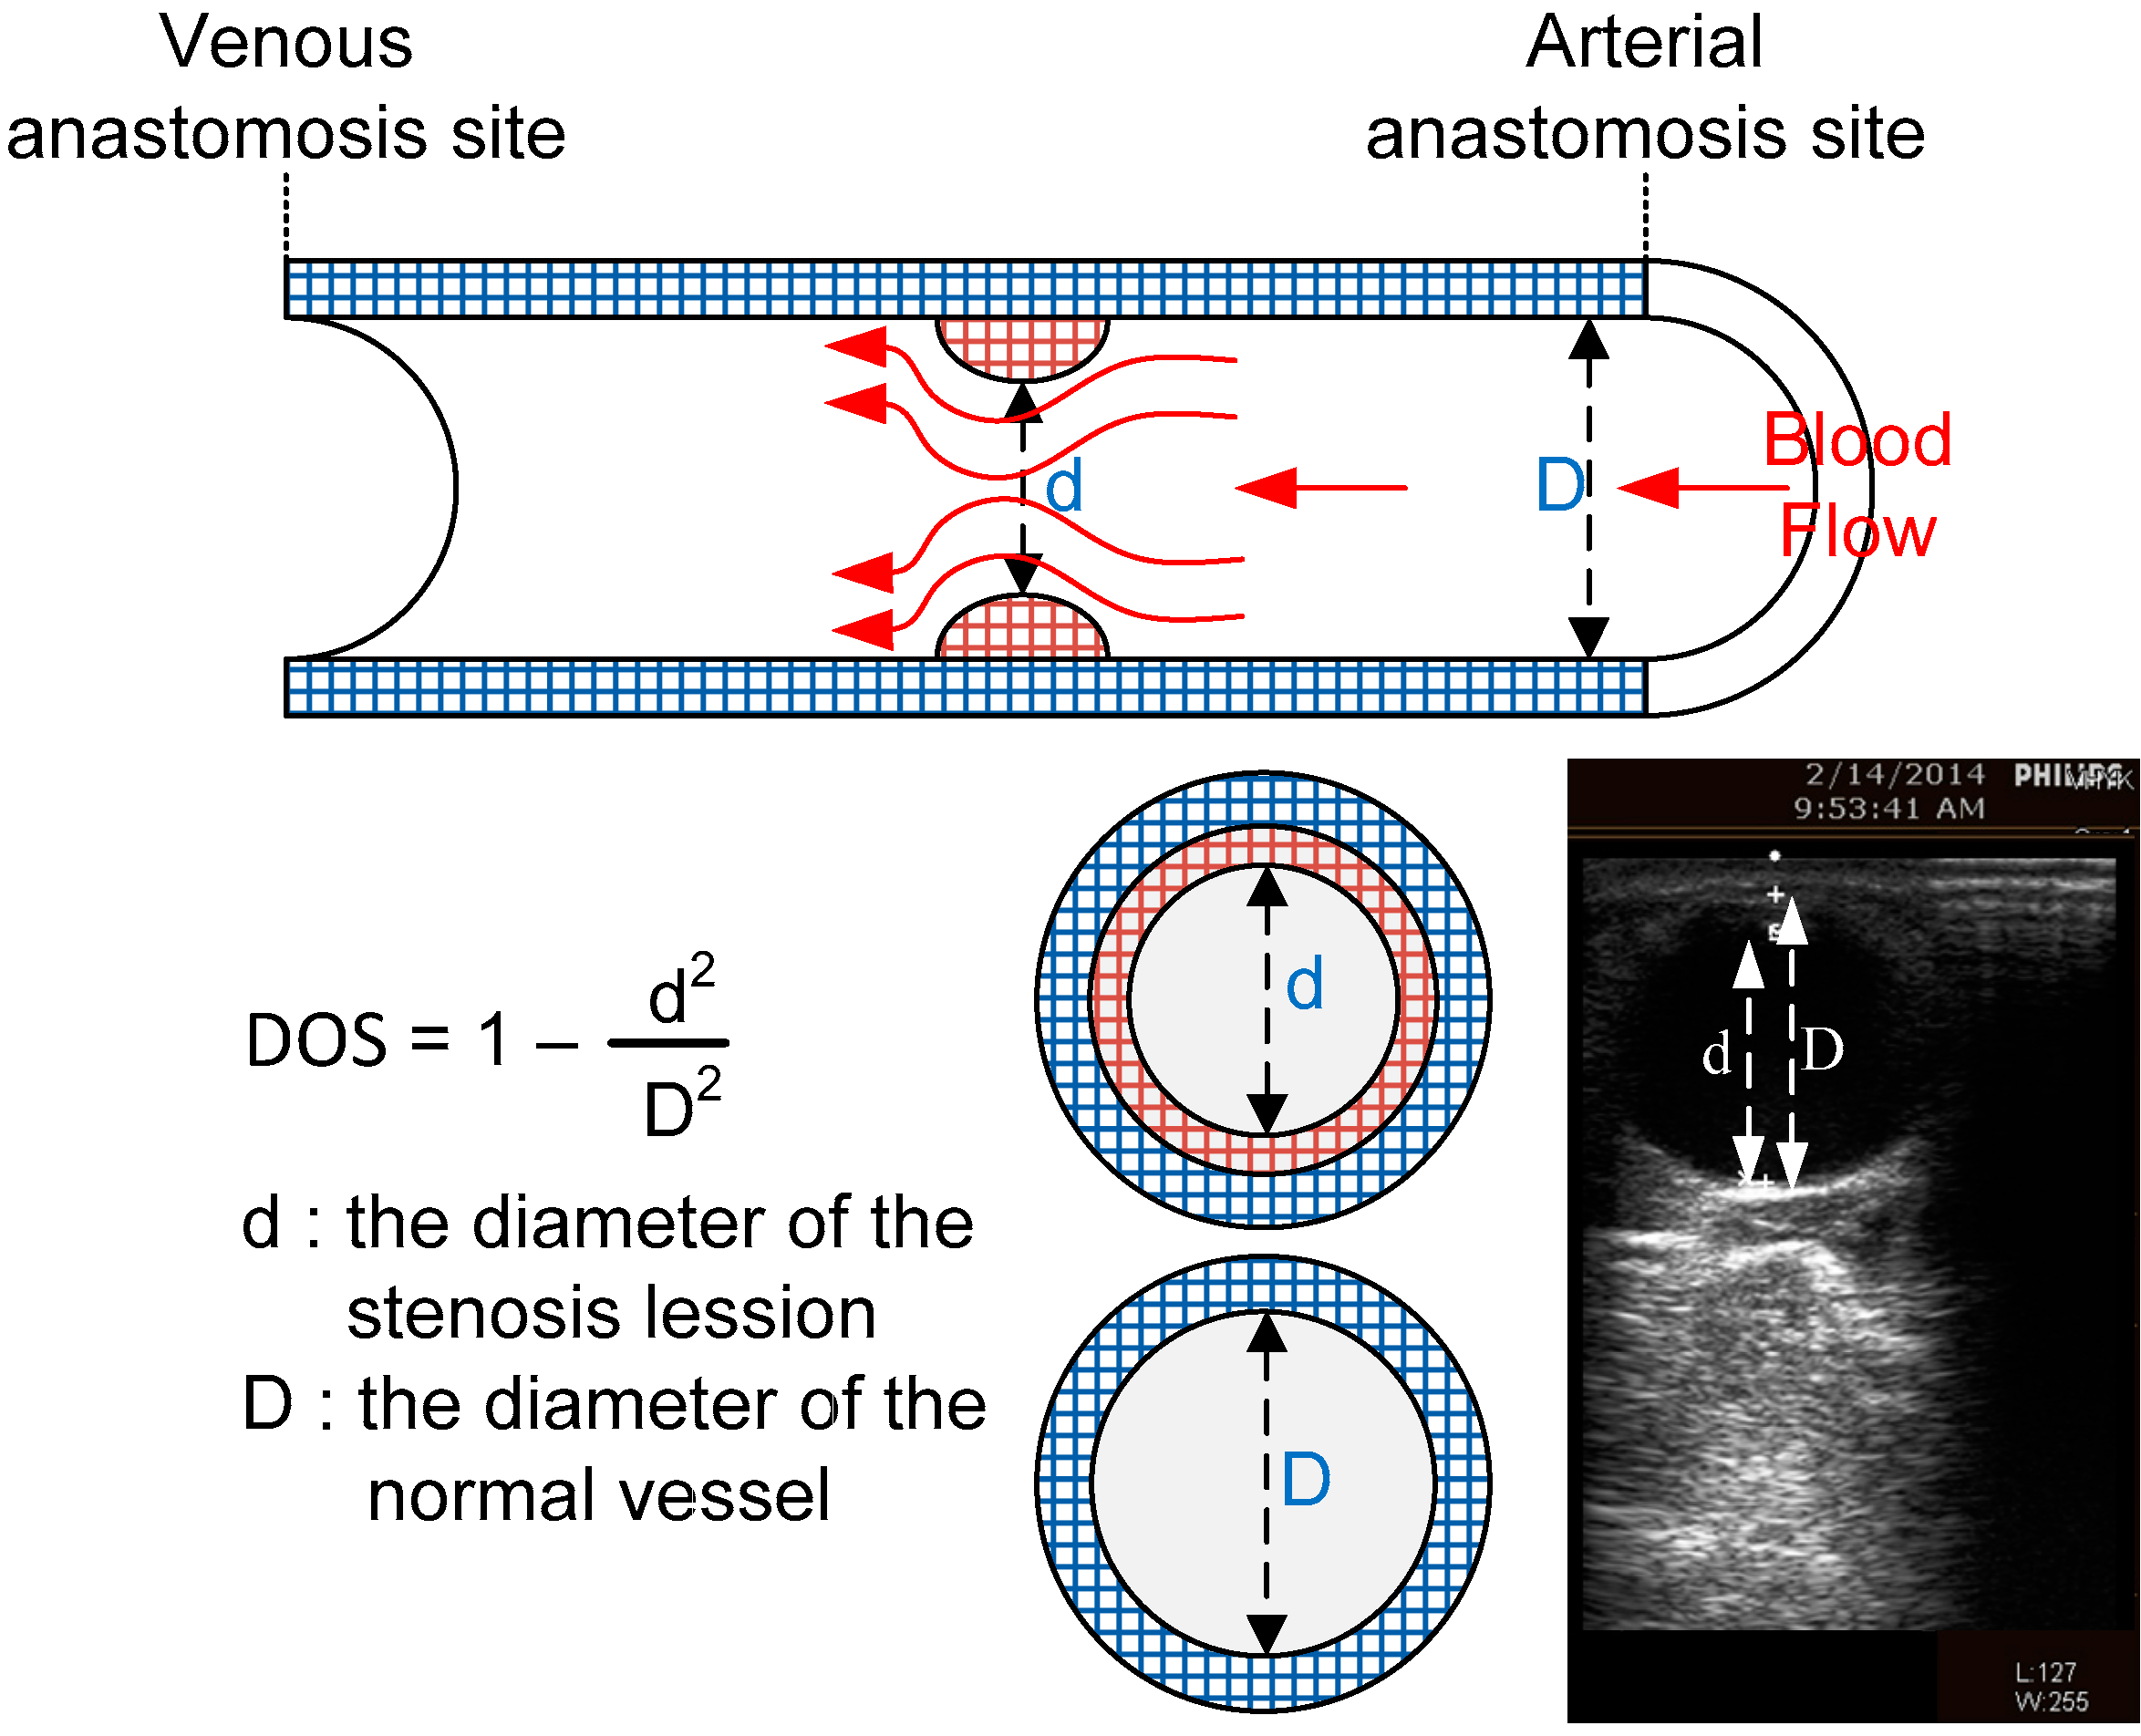
| DOS | Degree of stenosis |
| ANN | Artificial neural network |
| PPV | Positive predictive value |
| PF | Pulse foot |
| IIR | Infinite impulse response |
| LPF | Low pass filter |
| SRM | Structural risk minimization |
| KKT | Karush-Kuhn-Tucker |
| ECOC | Error correcting output coding |
| MLPN | Multi-layer perceptron network |
| VC | Vapnik-Chervonenkis |
References
- National Kidney Foundation. End Stage Renal Disease in the United States. Available online: https://www.kidney.org/news/newsroom/factsheets/End-Stage-Renal-Disease-in-the-US (accessed on 25 March 2016).
- Fila, B.; Ibeas, J.; Tey, R.R.; Lovčić, V.; Zibar, L. Arteriovenous fistula for haemodialysis: The role of surgical experience and vascular access education. Nefrología 2016, 36, 89–94. [Google Scholar] [CrossRef] [PubMed]
- Jin, W.T.; Zhang, G.F.; Liu, H.C.; Zhang, H.; Li, B.; Zhu, X.Q. Non-contrast-enhanced MR angiography for detecting arteriovenous fistula dysfunction in haemodialysis patients. Clin. Radiol. 2015, 70, 852–857. [Google Scholar] [CrossRef] [PubMed]
- Vesquez, P.O.; Marco, M.M.; Mandersson, B. Arteriovenous fistula stenosis detection using wavelets and support vector machines. In Proceedings of the 2009 Annual International Conference of the IEEE Engineering in Medicine, Minneapolis, MN, USA, 3–6 September 2009; pp. 1298–1301.
- National Kidney Foundation. 2006 Updates Clinical Practice Guidelines and Recommendations, Kidney Disease Outcome Quality Initiative (KDOQI). Available online: https://www.kidney.org/sites/default/files/docs/12–50–0210_jag_dcp_guidelines-hd_oct06_sectiona_ofc.pdf (accessed on 25 March 2016).
- Wu, J.X.; Lin, C.H.; Du, Y.C.; Chen, P.J.; Shih, C.C.; Chen, T. Estimation of arteriovenous fistula stenosis by FPGA based Doppler flow imaging system. In Proceedings of the 2015 IEEE International Ultrasonics. Symposium (IUS), Taipei, Taiwan, 21–24 October 2015; pp. 1–4.
- Bash, S.; Villablanca, J.P.; Jahan, R.; Duckwiler, G.; Tillis, M.; Kidwell, C.; Sayre, J. Intracranial vascular stenosis and occlusive disease: Evaluation with CT angiography, MR angiography, and digital subtraction angiography. Am. J. Neuroradiol. 2005, 26, 1012–1021. [Google Scholar] [PubMed]
- Tessitore, N.; Bedogna, V.; Gammaro, L.; Lipari, G.; Poli, A.; Baggio, E.; Maschio, G. Diagnostic accuracy of ultrasound dilution access blood flow measurement in detecting stenosis and predicting thrombosis in native forearm arteriovenous fistulae for hemodialysis. Am. J. Kidney Dis. 2003, 42, 331–341. [Google Scholar] [CrossRef]
- Wang, H.Y.; Wu, C.H.; Chen, C.Y.; Lin, B.S. Novel noninvasive approach for detecting arteriovenous fistula stenosis. IEEE Trans. Biomed. Eng. 2014, 61, 1851–1857. [Google Scholar] [CrossRef] [PubMed]
- Wu, J.X.; Lin, C.H.; Wu, M.J.; Li, C.M.; Lim, B.Y.; Du, Y.C. Bilateral photoplethysmography analysis for arteriovenous fistula dysfunction screening with fractional-order feature and cooperative game-based embedded detector. Healthc. Technol. Lett. 2015, 2, 64–69. [Google Scholar] [CrossRef] [PubMed]
- Chen, W.L.; Kan, C.D.; Lin, C.H.; Chen, T. A rule-based decision-making diagnosis system to evaluate arteriovenous shunt stenosis for hemodialysis treatment of patients using fuzzy petri nets. IEEE J. Biomed. Health Inform. 2014, 18, 703–713. [Google Scholar] [CrossRef] [PubMed]
- Chen, W.L.; Du, Y.C.; Lin, C.H.; Kan, C.D.; Wu, M.J. Adaptive network-based fuzzy inference system for arteriovenous shunt stenosis screening in long-term hemodialysis treatment of patients. In Proceedings of the 2014 International Symposium on Computer, Consumer and Control (IS3C), Taichung, Taiwan, 10–12 June 2014; pp. 832–835.
- Leon, C.; Asif, A. Arteriovenous access and hand pain: The distal hypoperfusion ischemic syndrome. Clin. J. Am. Soc. Nephrol. 2007, 2, 175–183. [Google Scholar] [CrossRef] [PubMed]
- Wu, J.X.; Li, C.M.; Ho, Y.R.; Wu, M.J.; Huang, P.Z. Bilateral photoplethysmography analysis for peripheral arterial stenosis screening with a fractional-order integrator and info-gap decision-making. IEEE Sens. J. 2016, 16, 2691–2700. [Google Scholar] [CrossRef]
- Wu, J.X.; Lin, C.H.; Du, Y.C.; Chen, T. Sprott chaos synchronisation classifier for diabetic foot peripheral vascular occlusive disease estimation. IET Sci. Meas. Technol. 2012, 6, 533–540. [Google Scholar] [CrossRef]
- Allen, J. Photoplethysmography and its application in clinical physiological measurement. Physiol. Meas. 2007, 28, 3. [Google Scholar] [CrossRef] [PubMed]
- Cortes, C.; Vapnik, V. Support-vector networks. Mach. Learn. 1995, 20, 273–297. [Google Scholar]
- Vladimir, V.N.; Vapnik, V. The Nature of Statistical Learning Theory; Springer: Berlin, Germany, 1995. [Google Scholar]
- Cristianini, N.; Shawe-Taylor, J. An Introduction to Support Vector Machines and Other Kernel-Based Learning Methods; Cambridge University Press: Cambridge, UK, 2000. [Google Scholar]
- Dietterich, T.G.; Bakiri, G. Solving multiclass learning problems via error-correcting output codes. J. Artif. Intel. Res. 1995, 2, 263–286. [Google Scholar]
- Übeyli, E.D. Multiclass support vector machines for diagnosis of erythemato-squamous diseases. Expert Syst. Appl. 2008, 35, 1733–1740. [Google Scholar] [CrossRef]


| DOS | Class |
|---|---|
| DOS ≤ 30% | 1 |
| 30% ≤ DOS ≤ 50% | 2 |
| DOS ≥ 50% | 3 |
| Kernel | Kernel Function |
|---|---|
| Quadratic | |
| RBF | |
| Linear |
| Class | ECOC | ||
|---|---|---|---|
| f1 | f2 | f3 | |
| 1 | 1 | 1 | 1 |
| 2 | 0 | 1 | 0 |
| 3 | 0 | 0 | 1 |
| Class | d | D | DOS | Age | Gender | |
|---|---|---|---|---|---|---|
| Male | Female | |||||
| 1 | 1.52 | 1.63 | 0.130415 | 81 | √ | |
| 1.09 | 1.18 | 0.146725 | 78 | √ | ||
| 1.17 | 1.36 | 0.259894 | 87 | √ | ||
| 0.94 | 0.99 | 0.146725 | 86 | √ | ||
| 0.78 | 0.89 | 0.145607 | 65 | √ | ||
| 0.812 | 0.961 | 0.34535 | 81 | √ | ||
| 0.698 | 0.797 | 0.145607 | 54 | √ | ||
| 1.45 | 1.71 | 0.137399 | 81 | √ | ||
| 2 | 0.698 | 0.797 | 0.267894 | 81 | √ | |
| 0.78 | 0.89 | 0.145665 | 54 | √ | ||
| 0.78 | 0.89 | 0.352678 | 67 | √ | ||
| 0.812 | 0.961 | 0.268303 | 87 | √ | ||
| 0.78 | 0.89 | 0.278894 | 84 | √ | ||
| 0.87 | 0.68 | 0.353638 | 83 | √ | ||
| 0.812 | 0.961 | 0.268303 | 86 | √ | ||
| 0.812 | 0.961 | 0.278894 | 84 | √ | ||
| 3 | 0.94 | 0.99 | 0.26383 | 75 | √ | |
| 0.78 | 0.89 | 0.489894 | 86 | √ | ||
| 0.812 | 0.961 | 0.474949 | 85 | √ | ||
| 0.812 | 0.961 | 0.474940 | 89 | √ | ||
| 0.812 | 0.961 | 0.659894 | 83 | √ | ||
| 0.78 | 0.75 | 0.373282 | 83 | √ | ||
| Classifiers | Performance Parameters | |||||
|---|---|---|---|---|---|---|
| Proposed Technique | Kernel Function | Accuracy (%) | Precision (%) | Specificity (%) | Sensitivity (%) | CPU Time (s) |
| Quadratic | 90.9 | 92.59 | 95.23 | 88.89 | 0.22 | |
| Linear | 77.27 | 82.22 | 88.09 | 77.79 | 0.16 | |
| RBF | 72.72 | 85.71 | 85.71 | 70.83 | 0.19 | |
| ANN | 80.00 | 76.67 | 91.84 | 88.89 | 3.00 | |
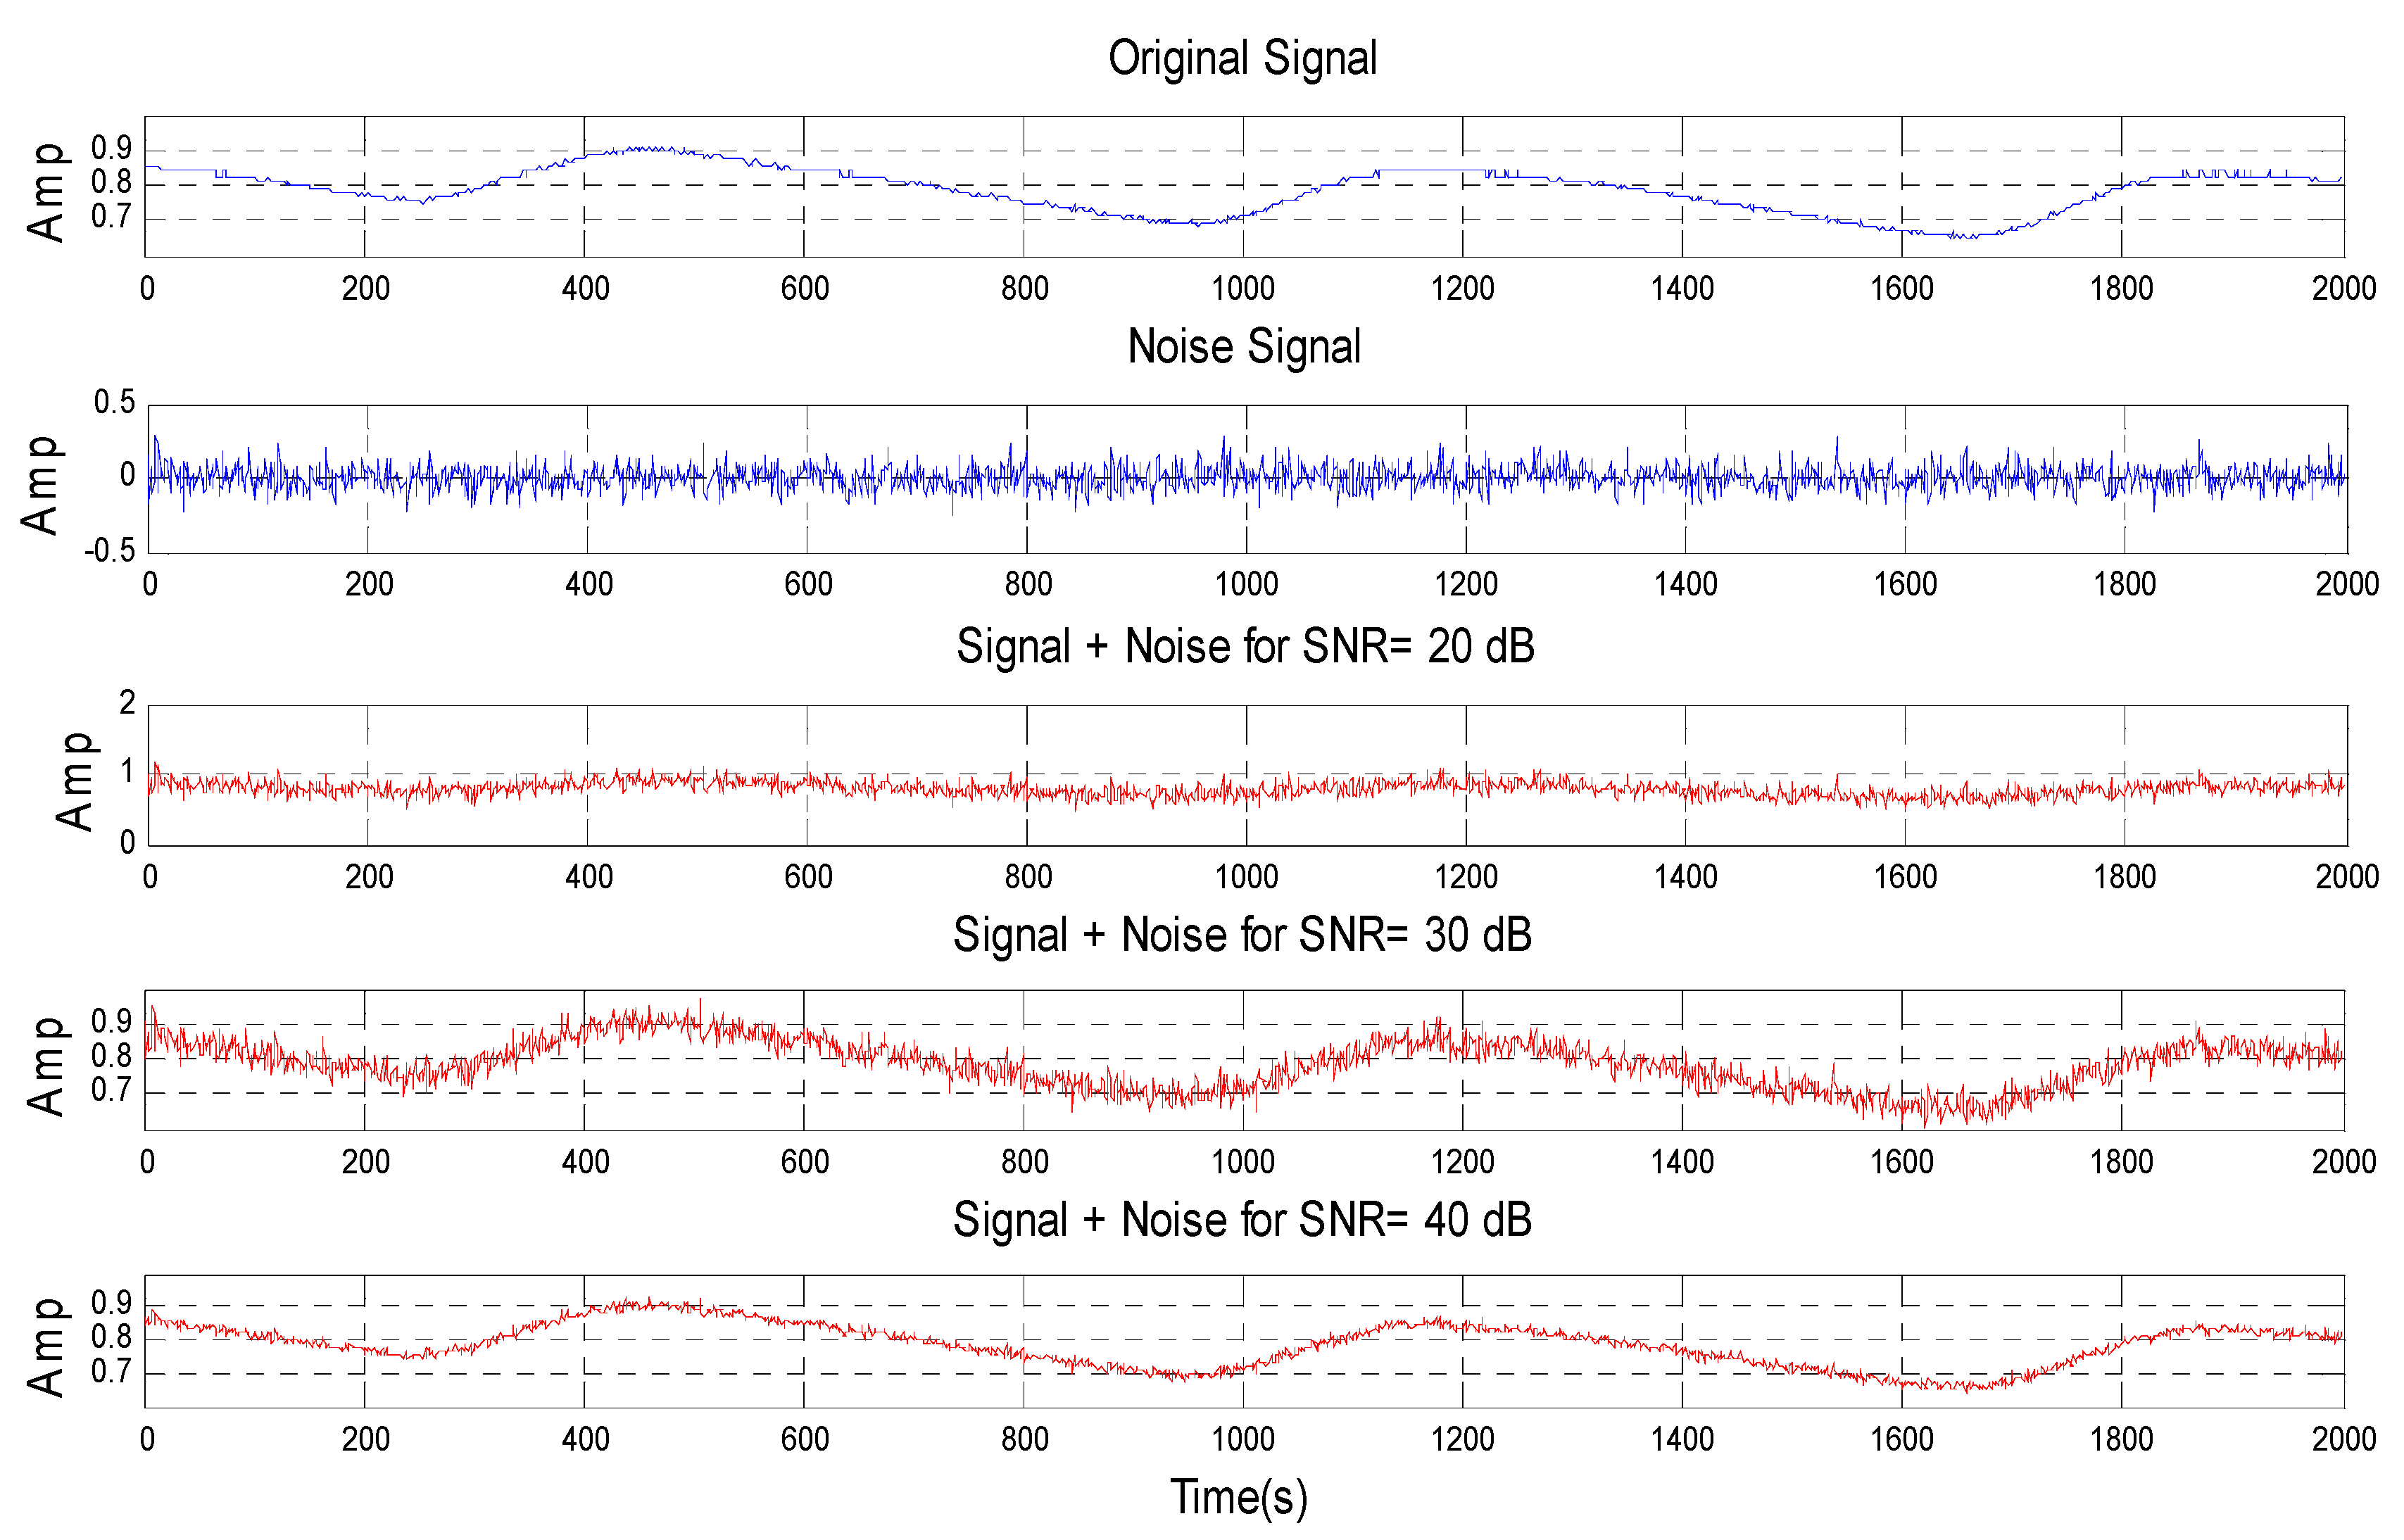
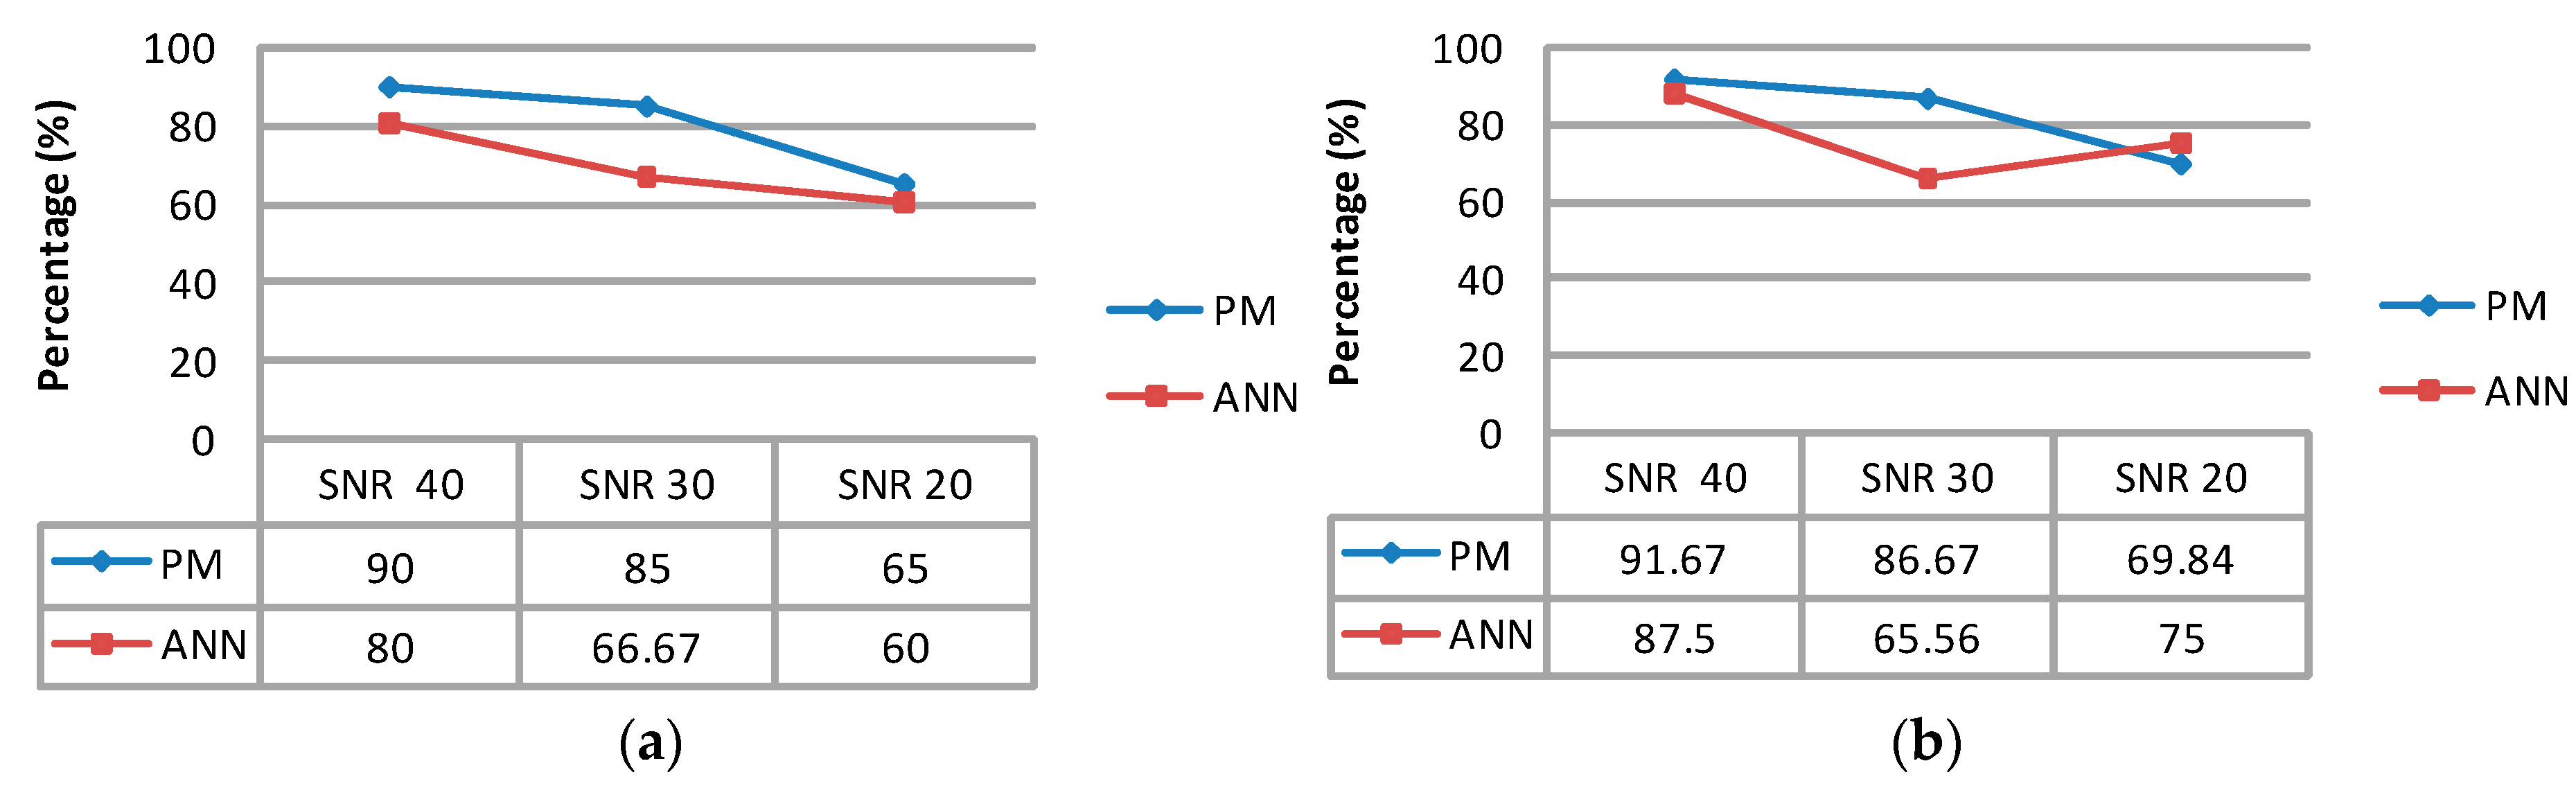
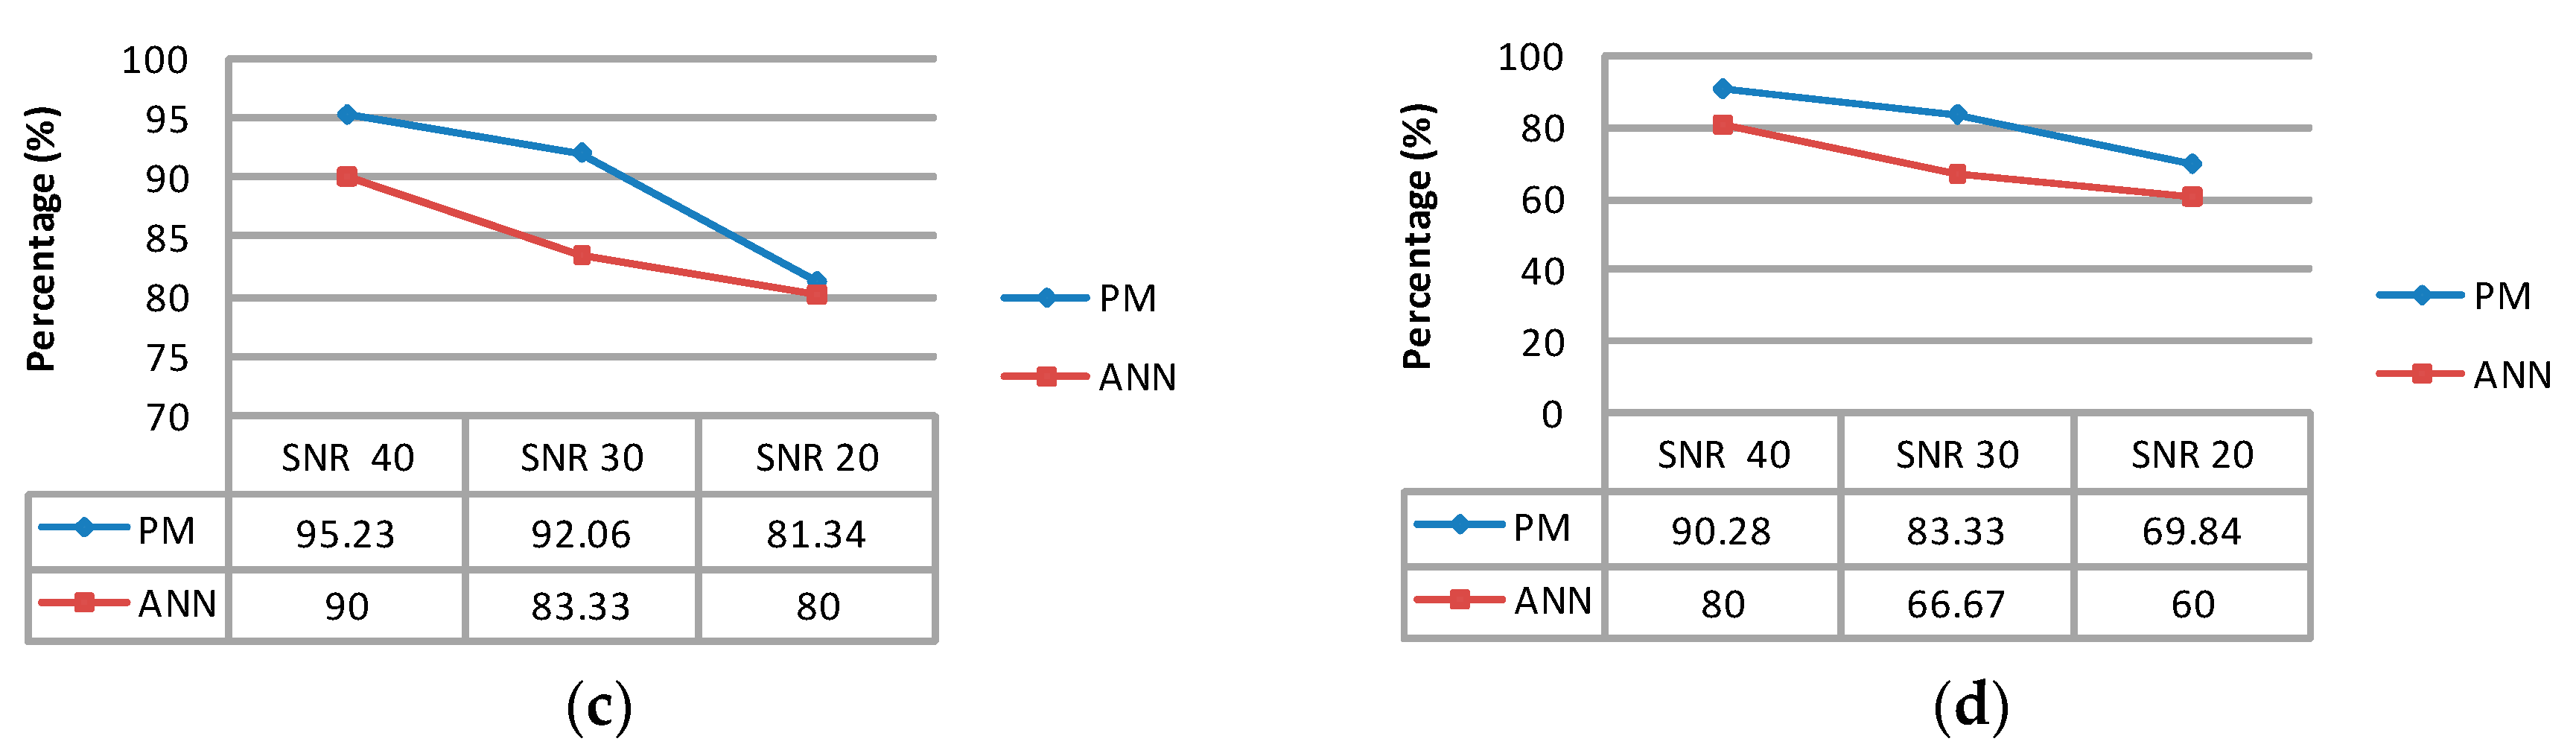
| Added Noise | Accuracy (%) | Precision (%) | Specificity (%) | Sensitivity (%) |
|---|---|---|---|---|
| SNR = 40 | 90.00 | 91.67 | 95.23 | 90.28 |
| SNR = 30 | 85.00 | 86.67 | 92.06 | 83.33 |
| SNR = 20 | 65.00 | 69.84 | 81.34 | 69.84 |
| The Approaches | Du et al. [10] | Wang et al. [9] | Wu et al. [14] | Chen et al. [11] | Proposed Technique |
|---|---|---|---|---|---|
| The Clinical Stenosis Detector | PPG | Stethoscope | Doppler Ultrasound | Stethoscope | PPG |
| Classifier Architecture | Cooperative Game Detector | ANN | I-G Decision Making | ANFIS | ESVM-OVR |
| The Number of Classes | 3 | 2 | 2 | 3 | 3 |
| System Performance Rate–PPV (%) | - | 87.84 | >80 | - | 91.67% |
| CPU Times Rates (seconds) | - | - | - | - | 0.22 |
© 2016 by the authors. Licensee MDPI, Basel, Switzerland. This article is an open access article distributed under the terms and conditions of the Creative Commons Attribution (CC-BY) license ( http://creativecommons.org/licenses/by/4.0/).
Share and Cite
Du, Y.-C.; Stephanus, A. A Novel Classification Technique of Arteriovenous Fistula Stenosis Evaluation Using Bilateral PPG Analysis. Micromachines 2016, 7, 147. https://doi.org/10.3390/mi7090147
Du Y-C, Stephanus A. A Novel Classification Technique of Arteriovenous Fistula Stenosis Evaluation Using Bilateral PPG Analysis. Micromachines. 2016; 7(9):147. https://doi.org/10.3390/mi7090147
Chicago/Turabian StyleDu, Yi-Chun, and Alphin Stephanus. 2016. "A Novel Classification Technique of Arteriovenous Fistula Stenosis Evaluation Using Bilateral PPG Analysis" Micromachines 7, no. 9: 147. https://doi.org/10.3390/mi7090147
APA StyleDu, Y.-C., & Stephanus, A. (2016). A Novel Classification Technique of Arteriovenous Fistula Stenosis Evaluation Using Bilateral PPG Analysis. Micromachines, 7(9), 147. https://doi.org/10.3390/mi7090147