
A Robot-Assisted Cell Manipulation System with an Adaptive Visual Servoing Method


Abstract
:
1. Introduction
2. The Automatic Microinjection System
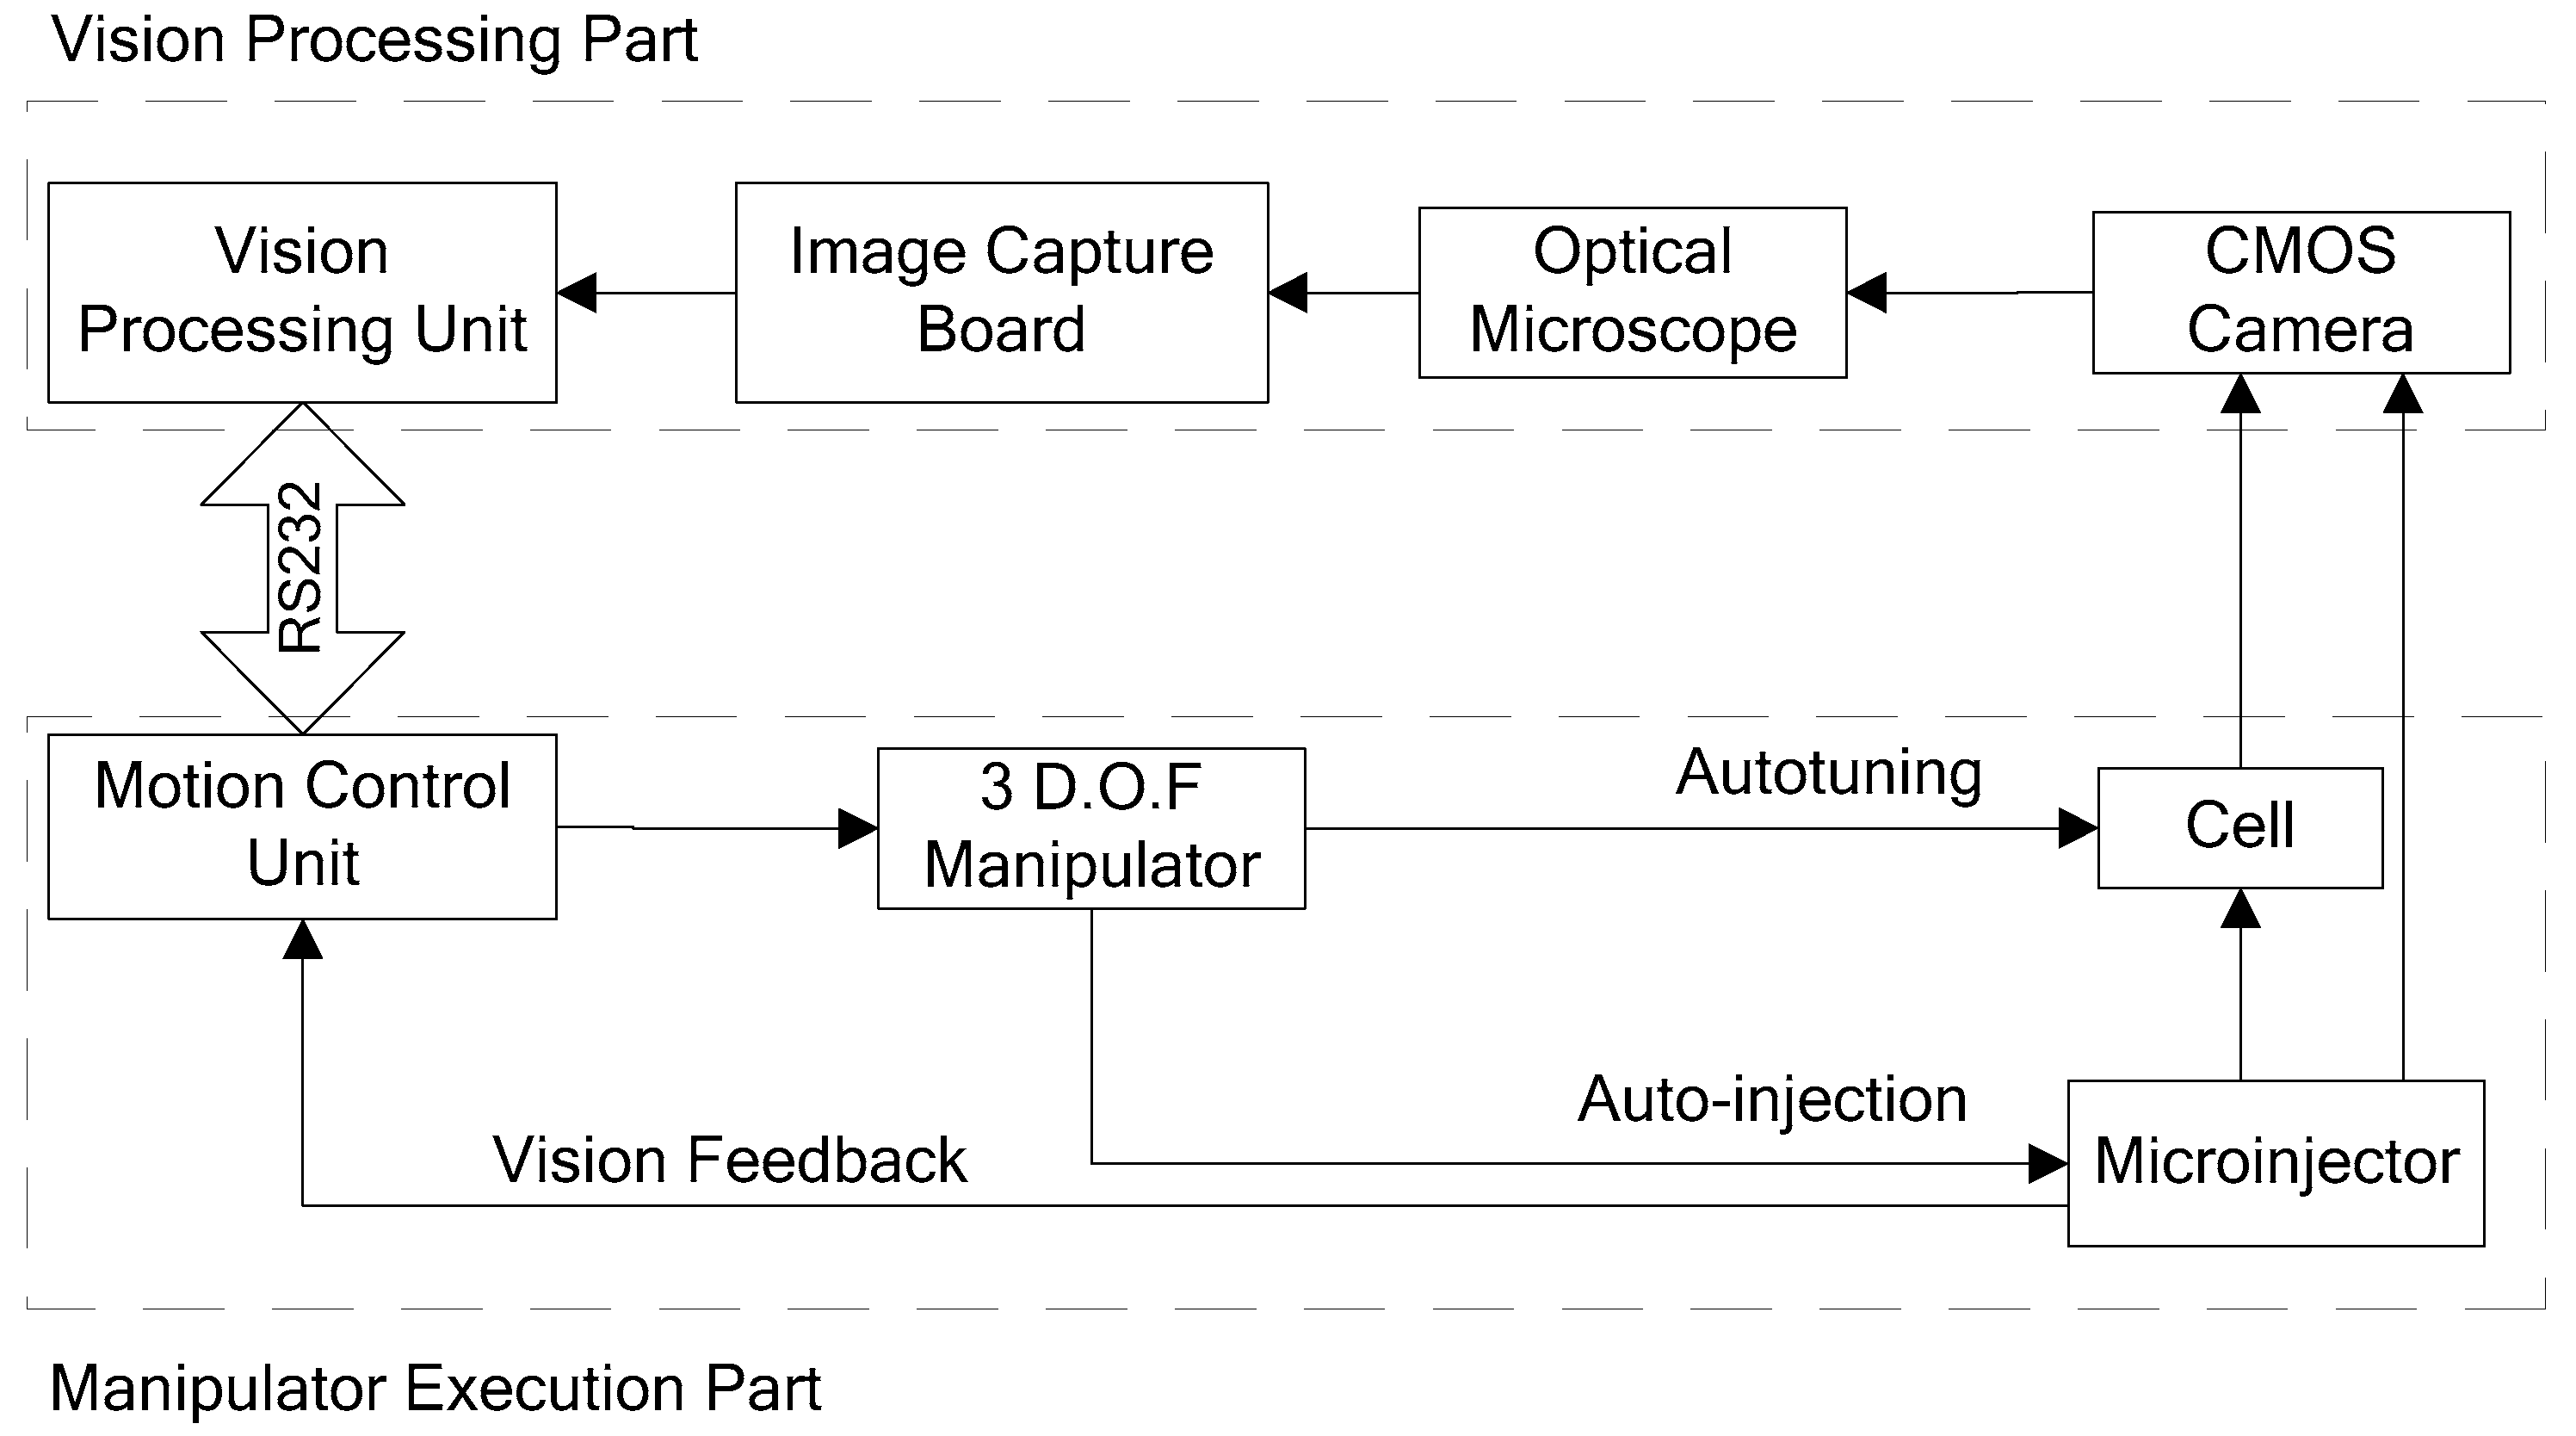
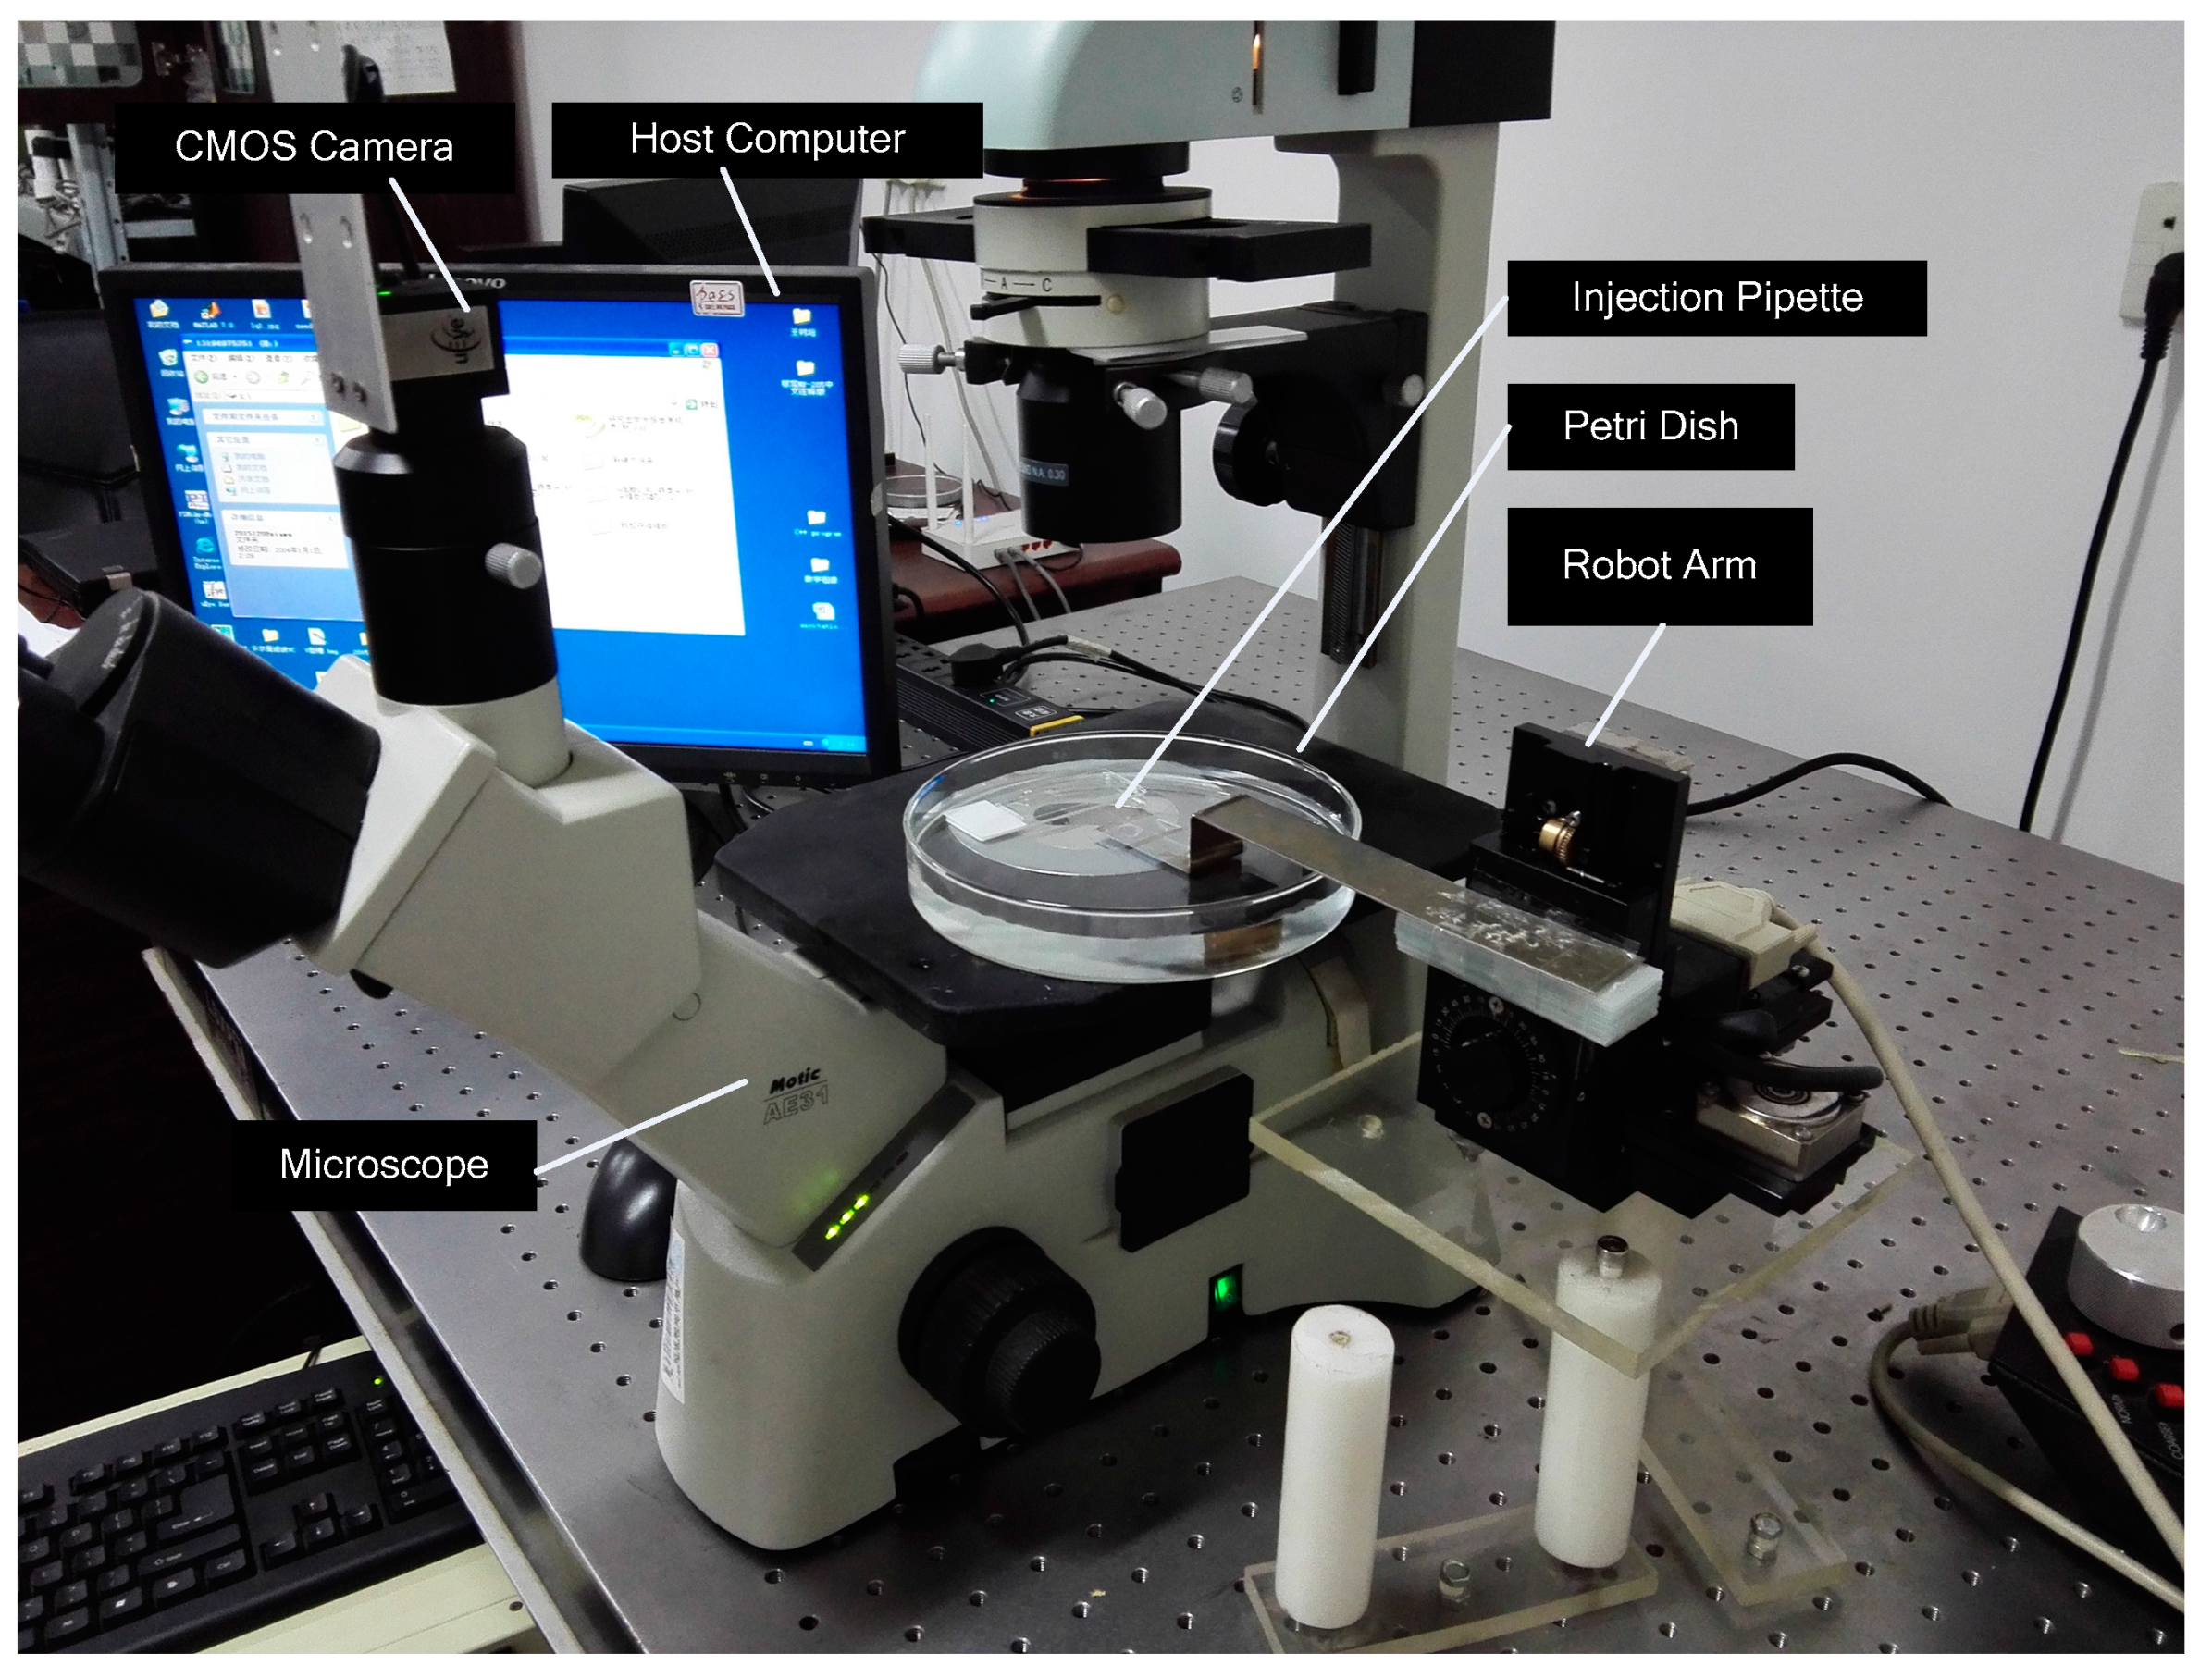
2.1. System Configuration
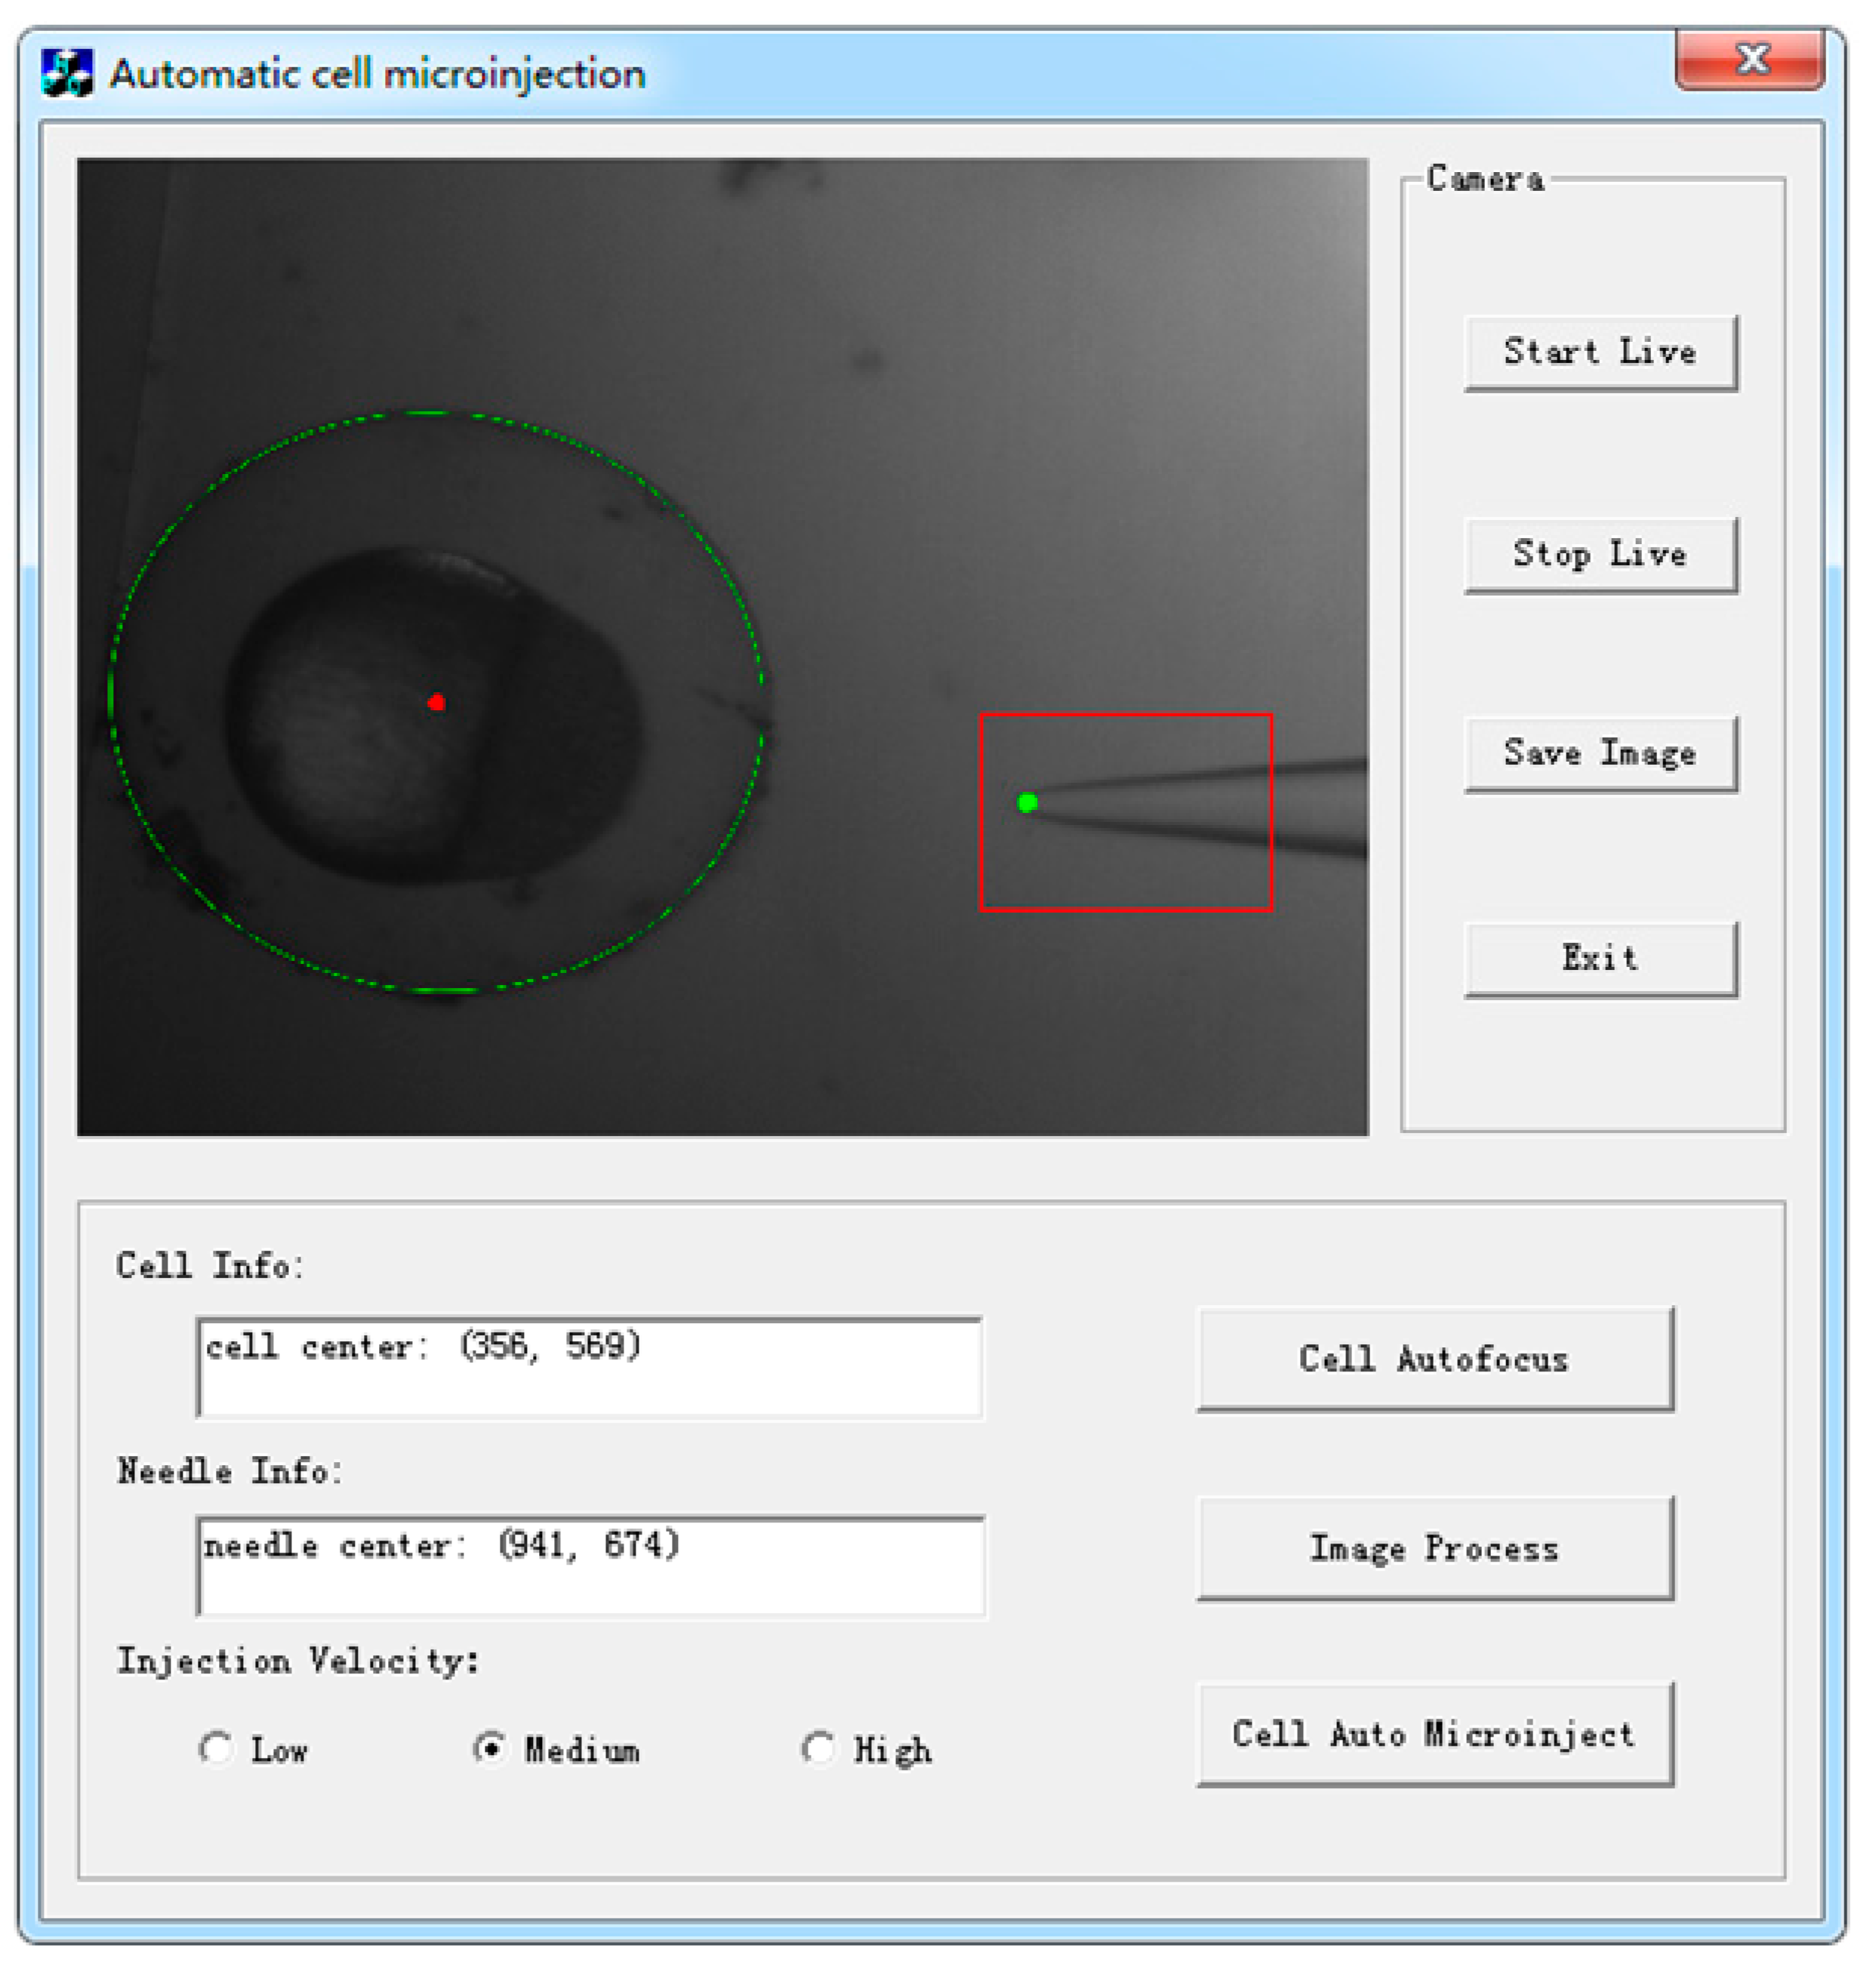
2.2. Integrated Interface Software Platform for Visual Servoing
3. Visual Servoing Algorithm for Automatic Cell Microinjection
3.1. Visual Servoing Algorithm for Automatic Cell Autofocusing
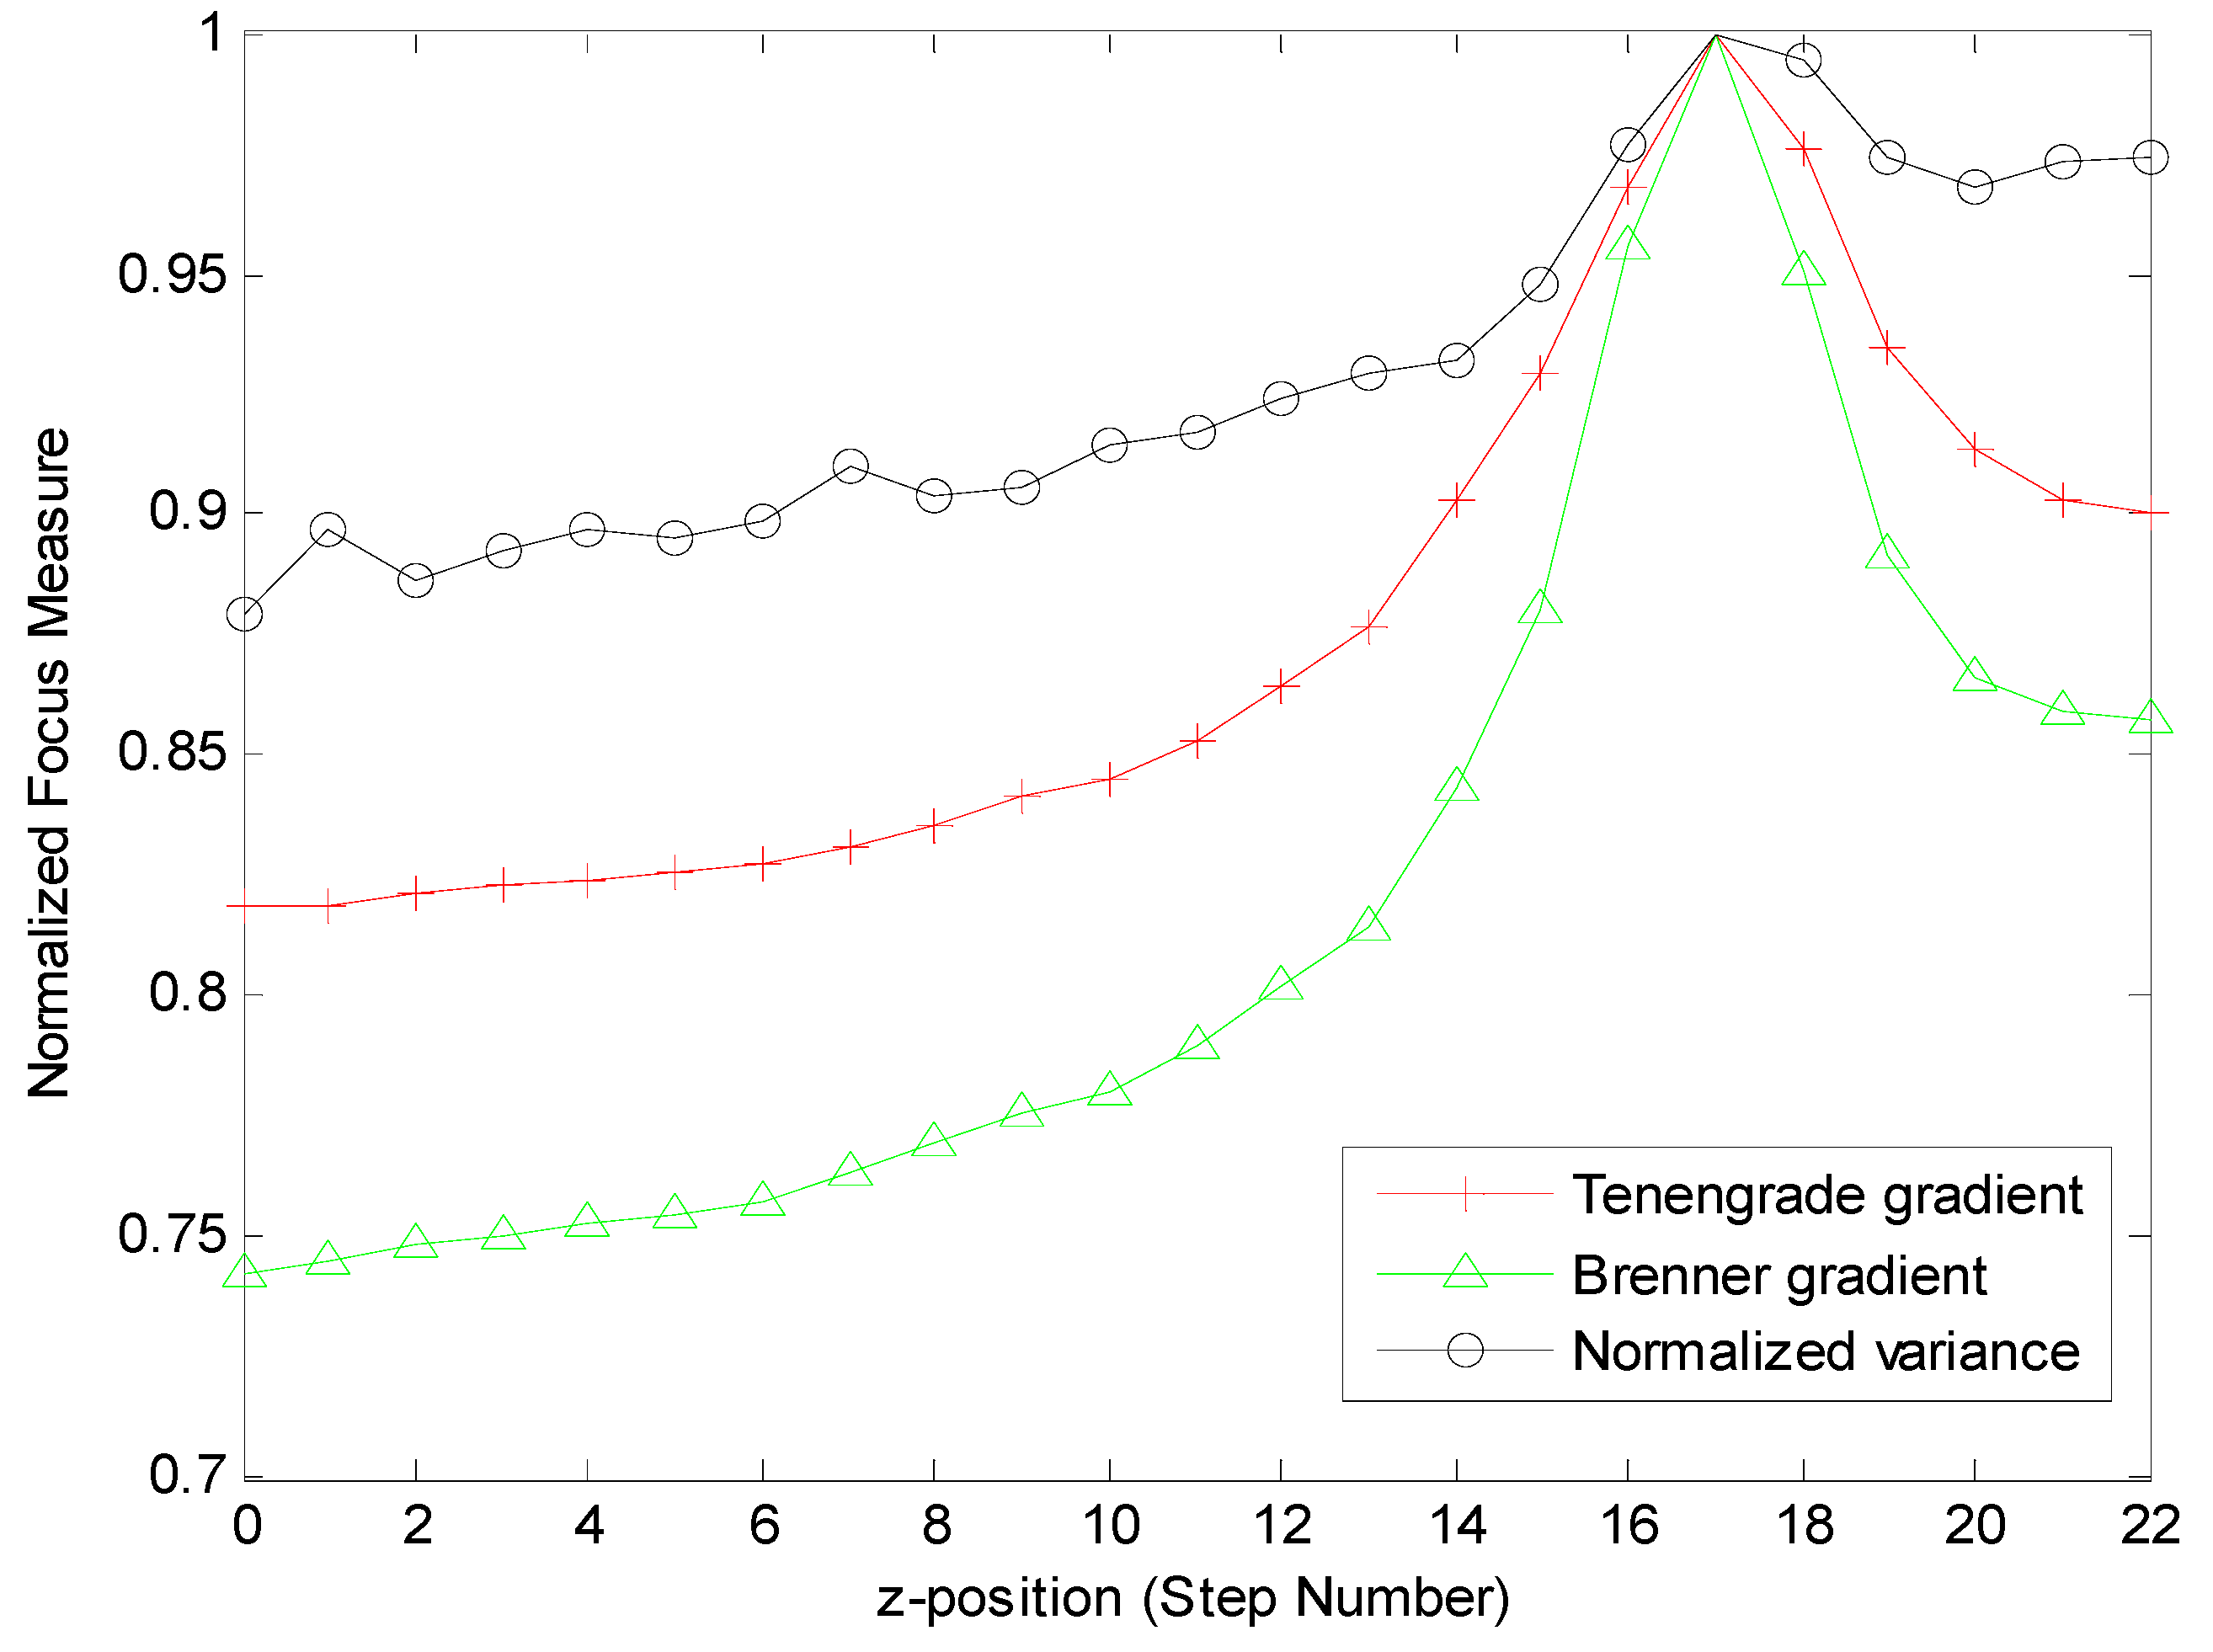
3.1.1. Selection of the Criterion Function
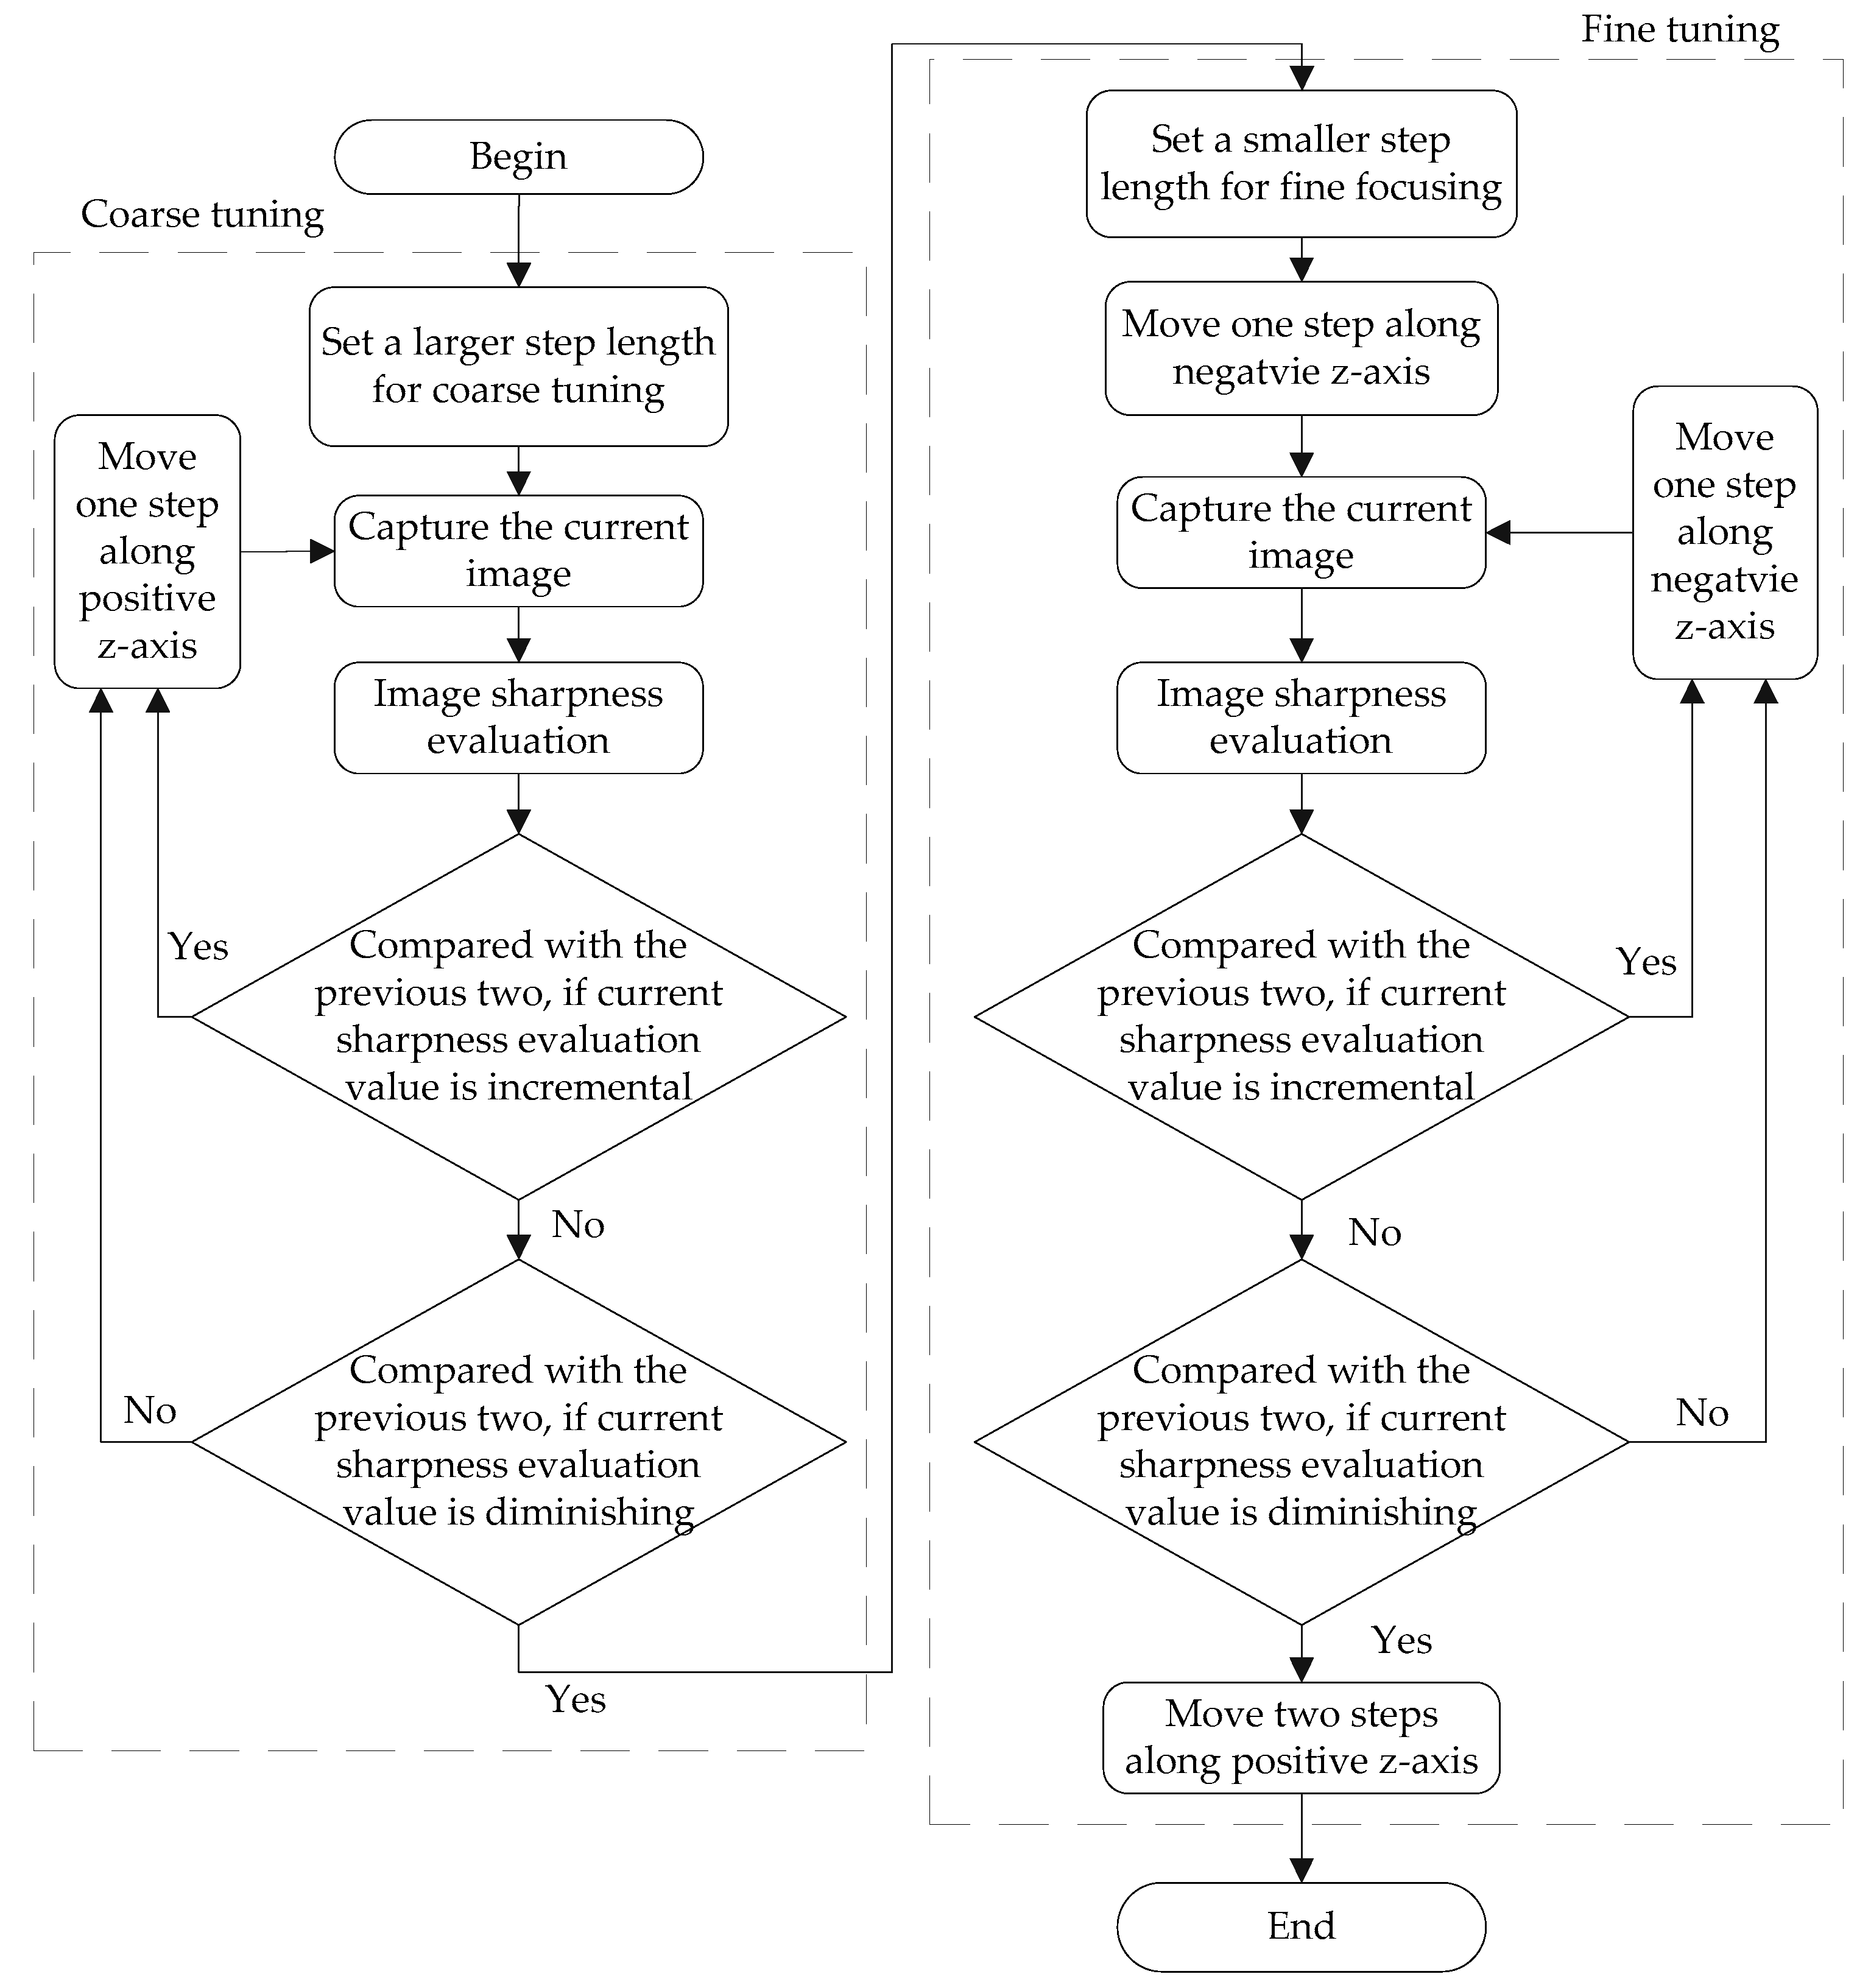
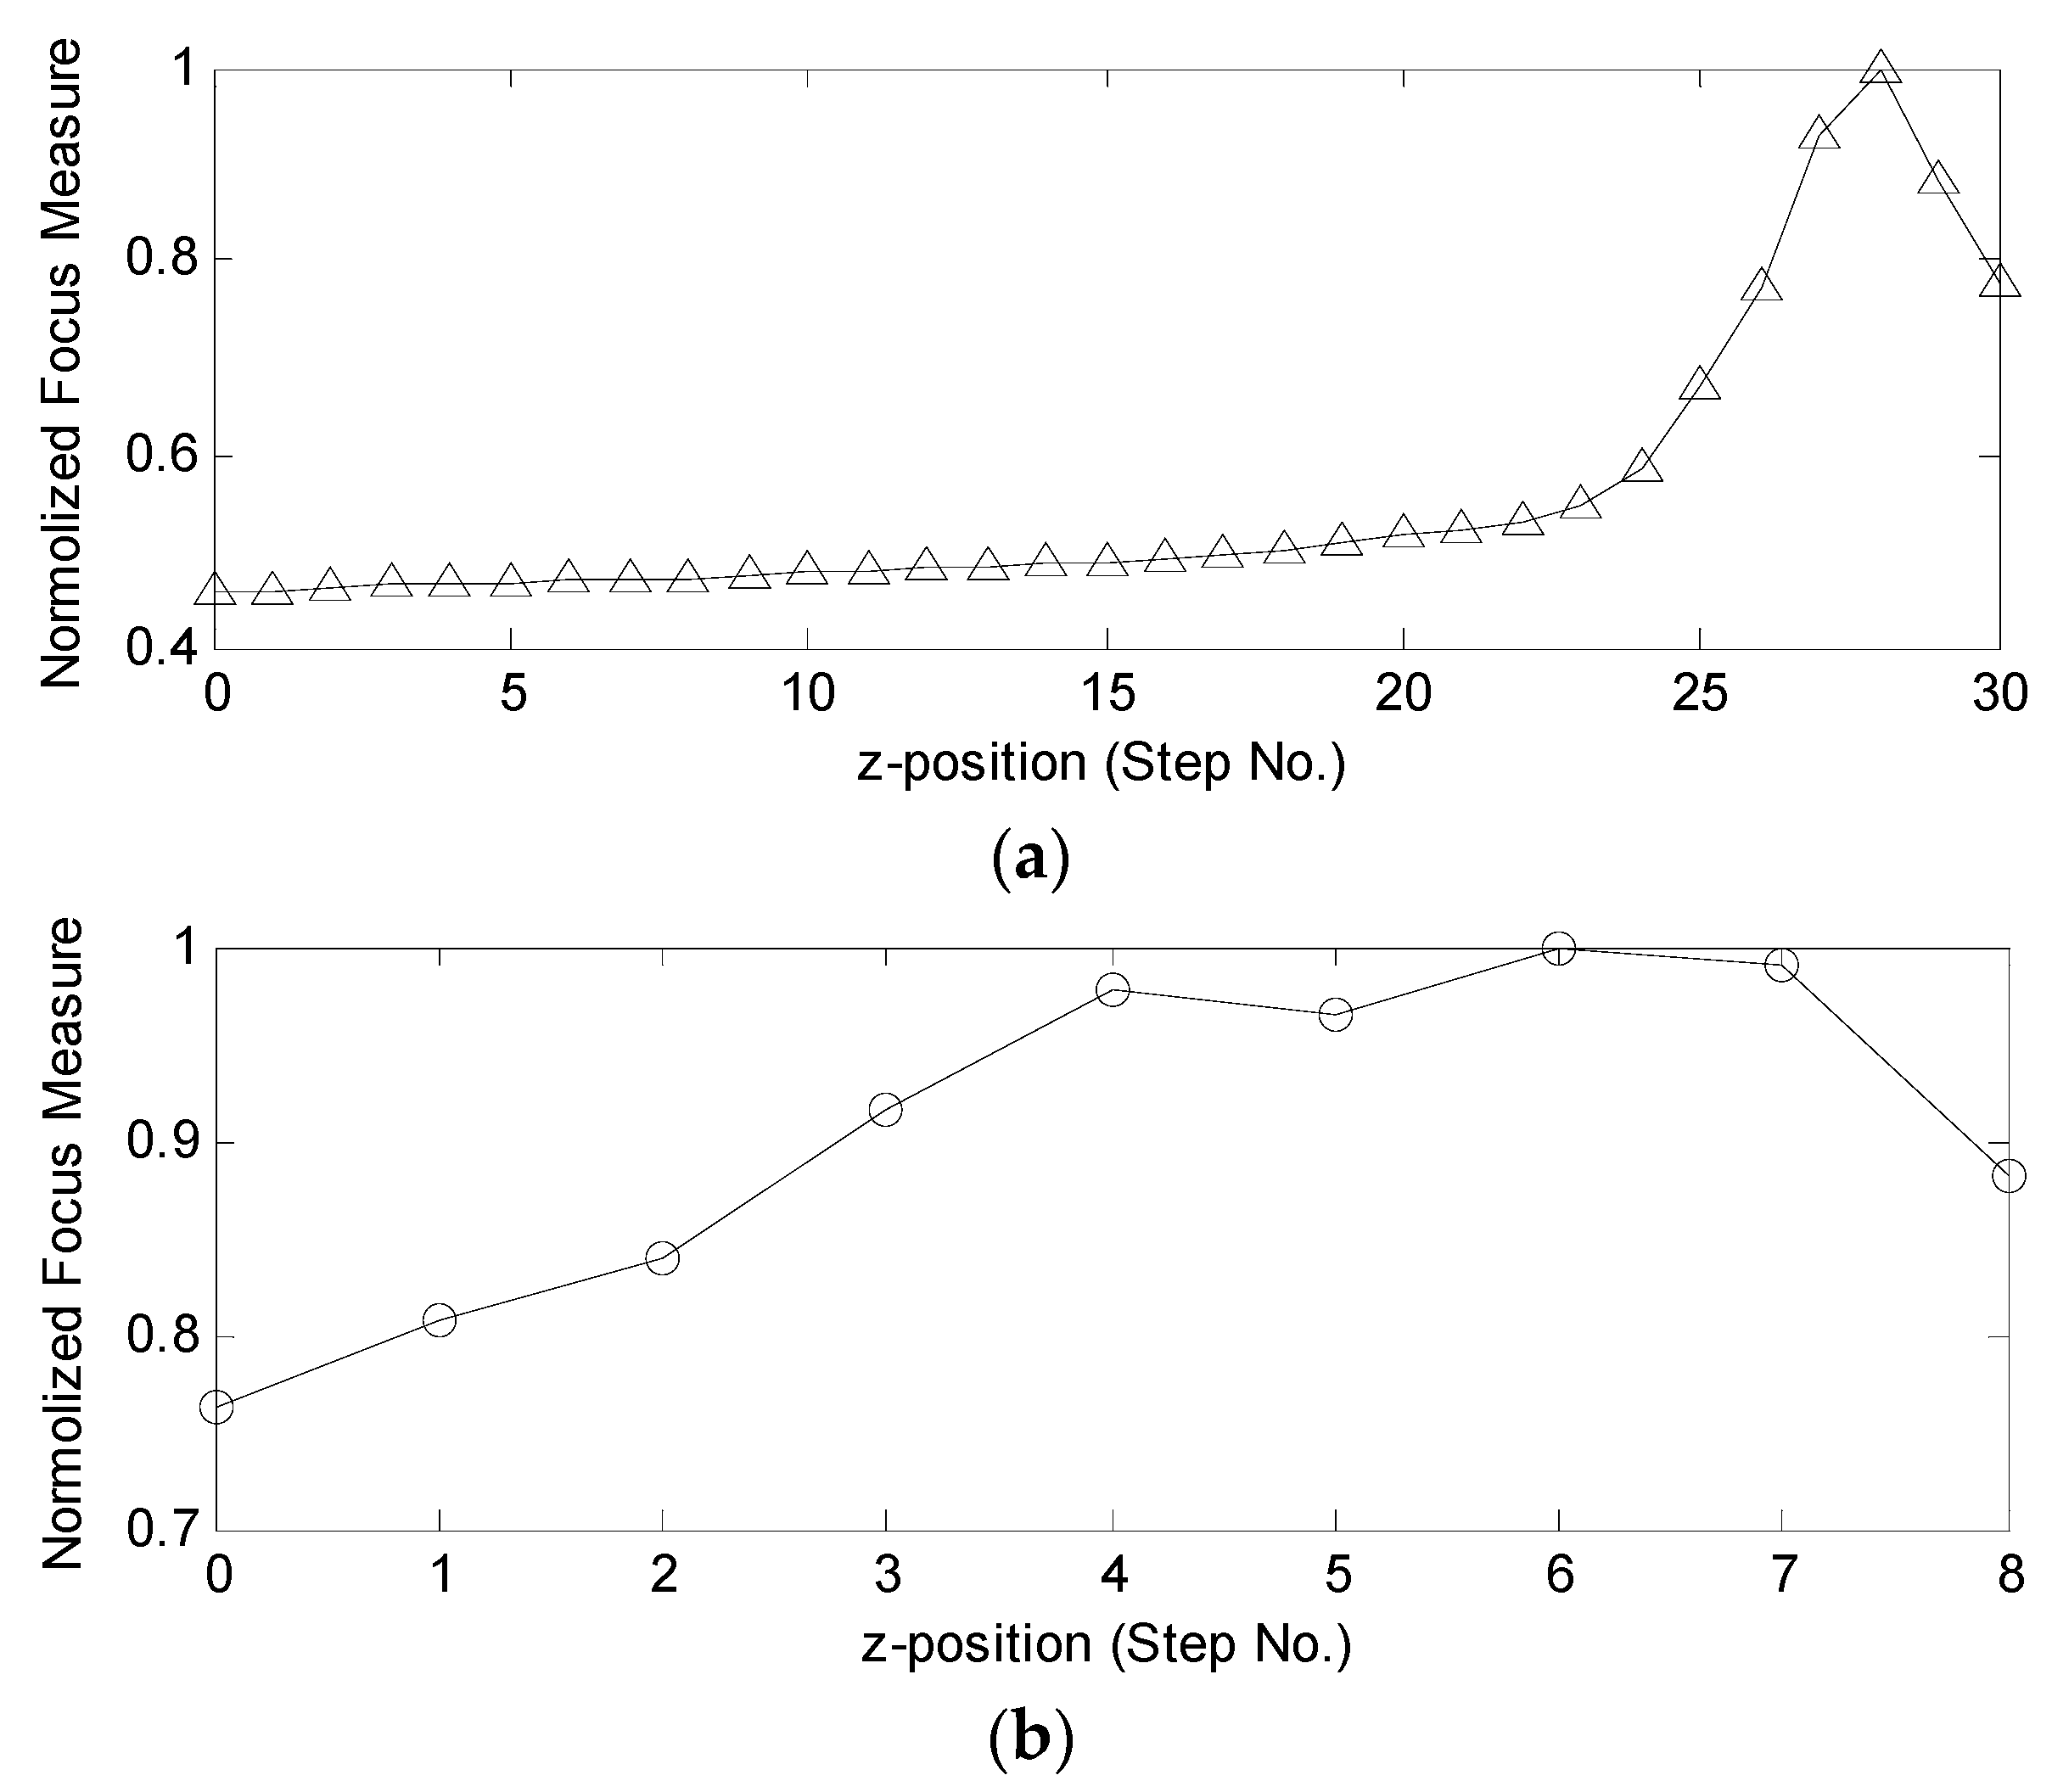
3.1.2. Implementation of the Automatic Focusing Method
3.2. Adaptive Image Processing Algorithm for Automatic Cell and Pipette Detection
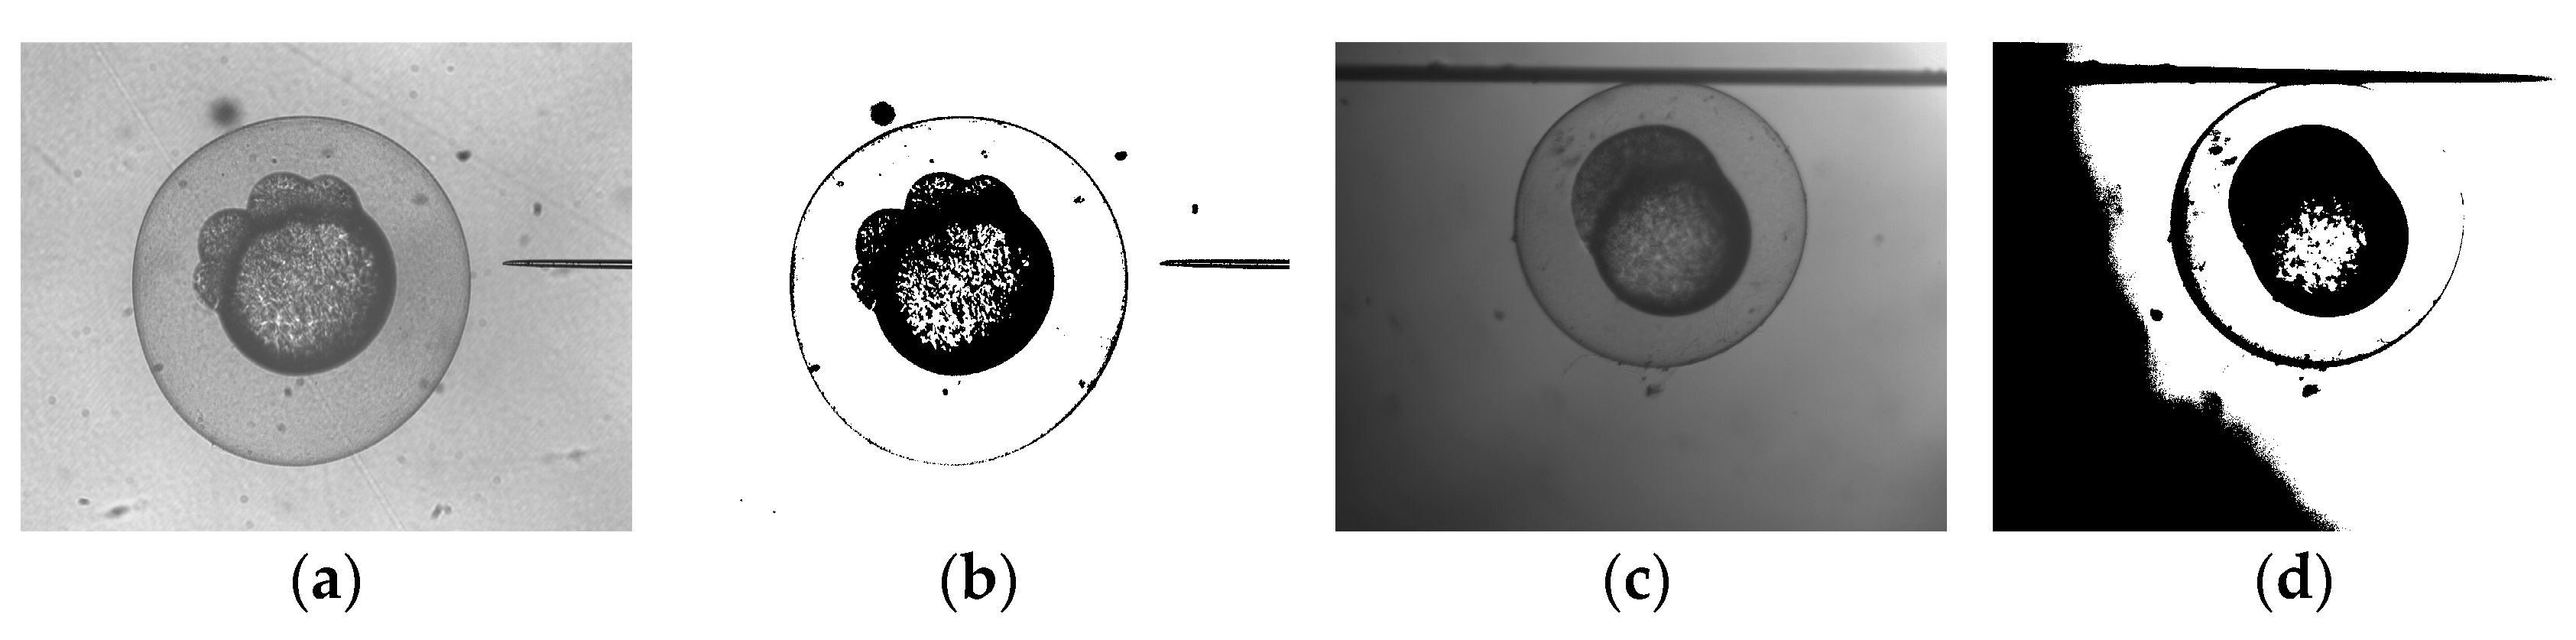
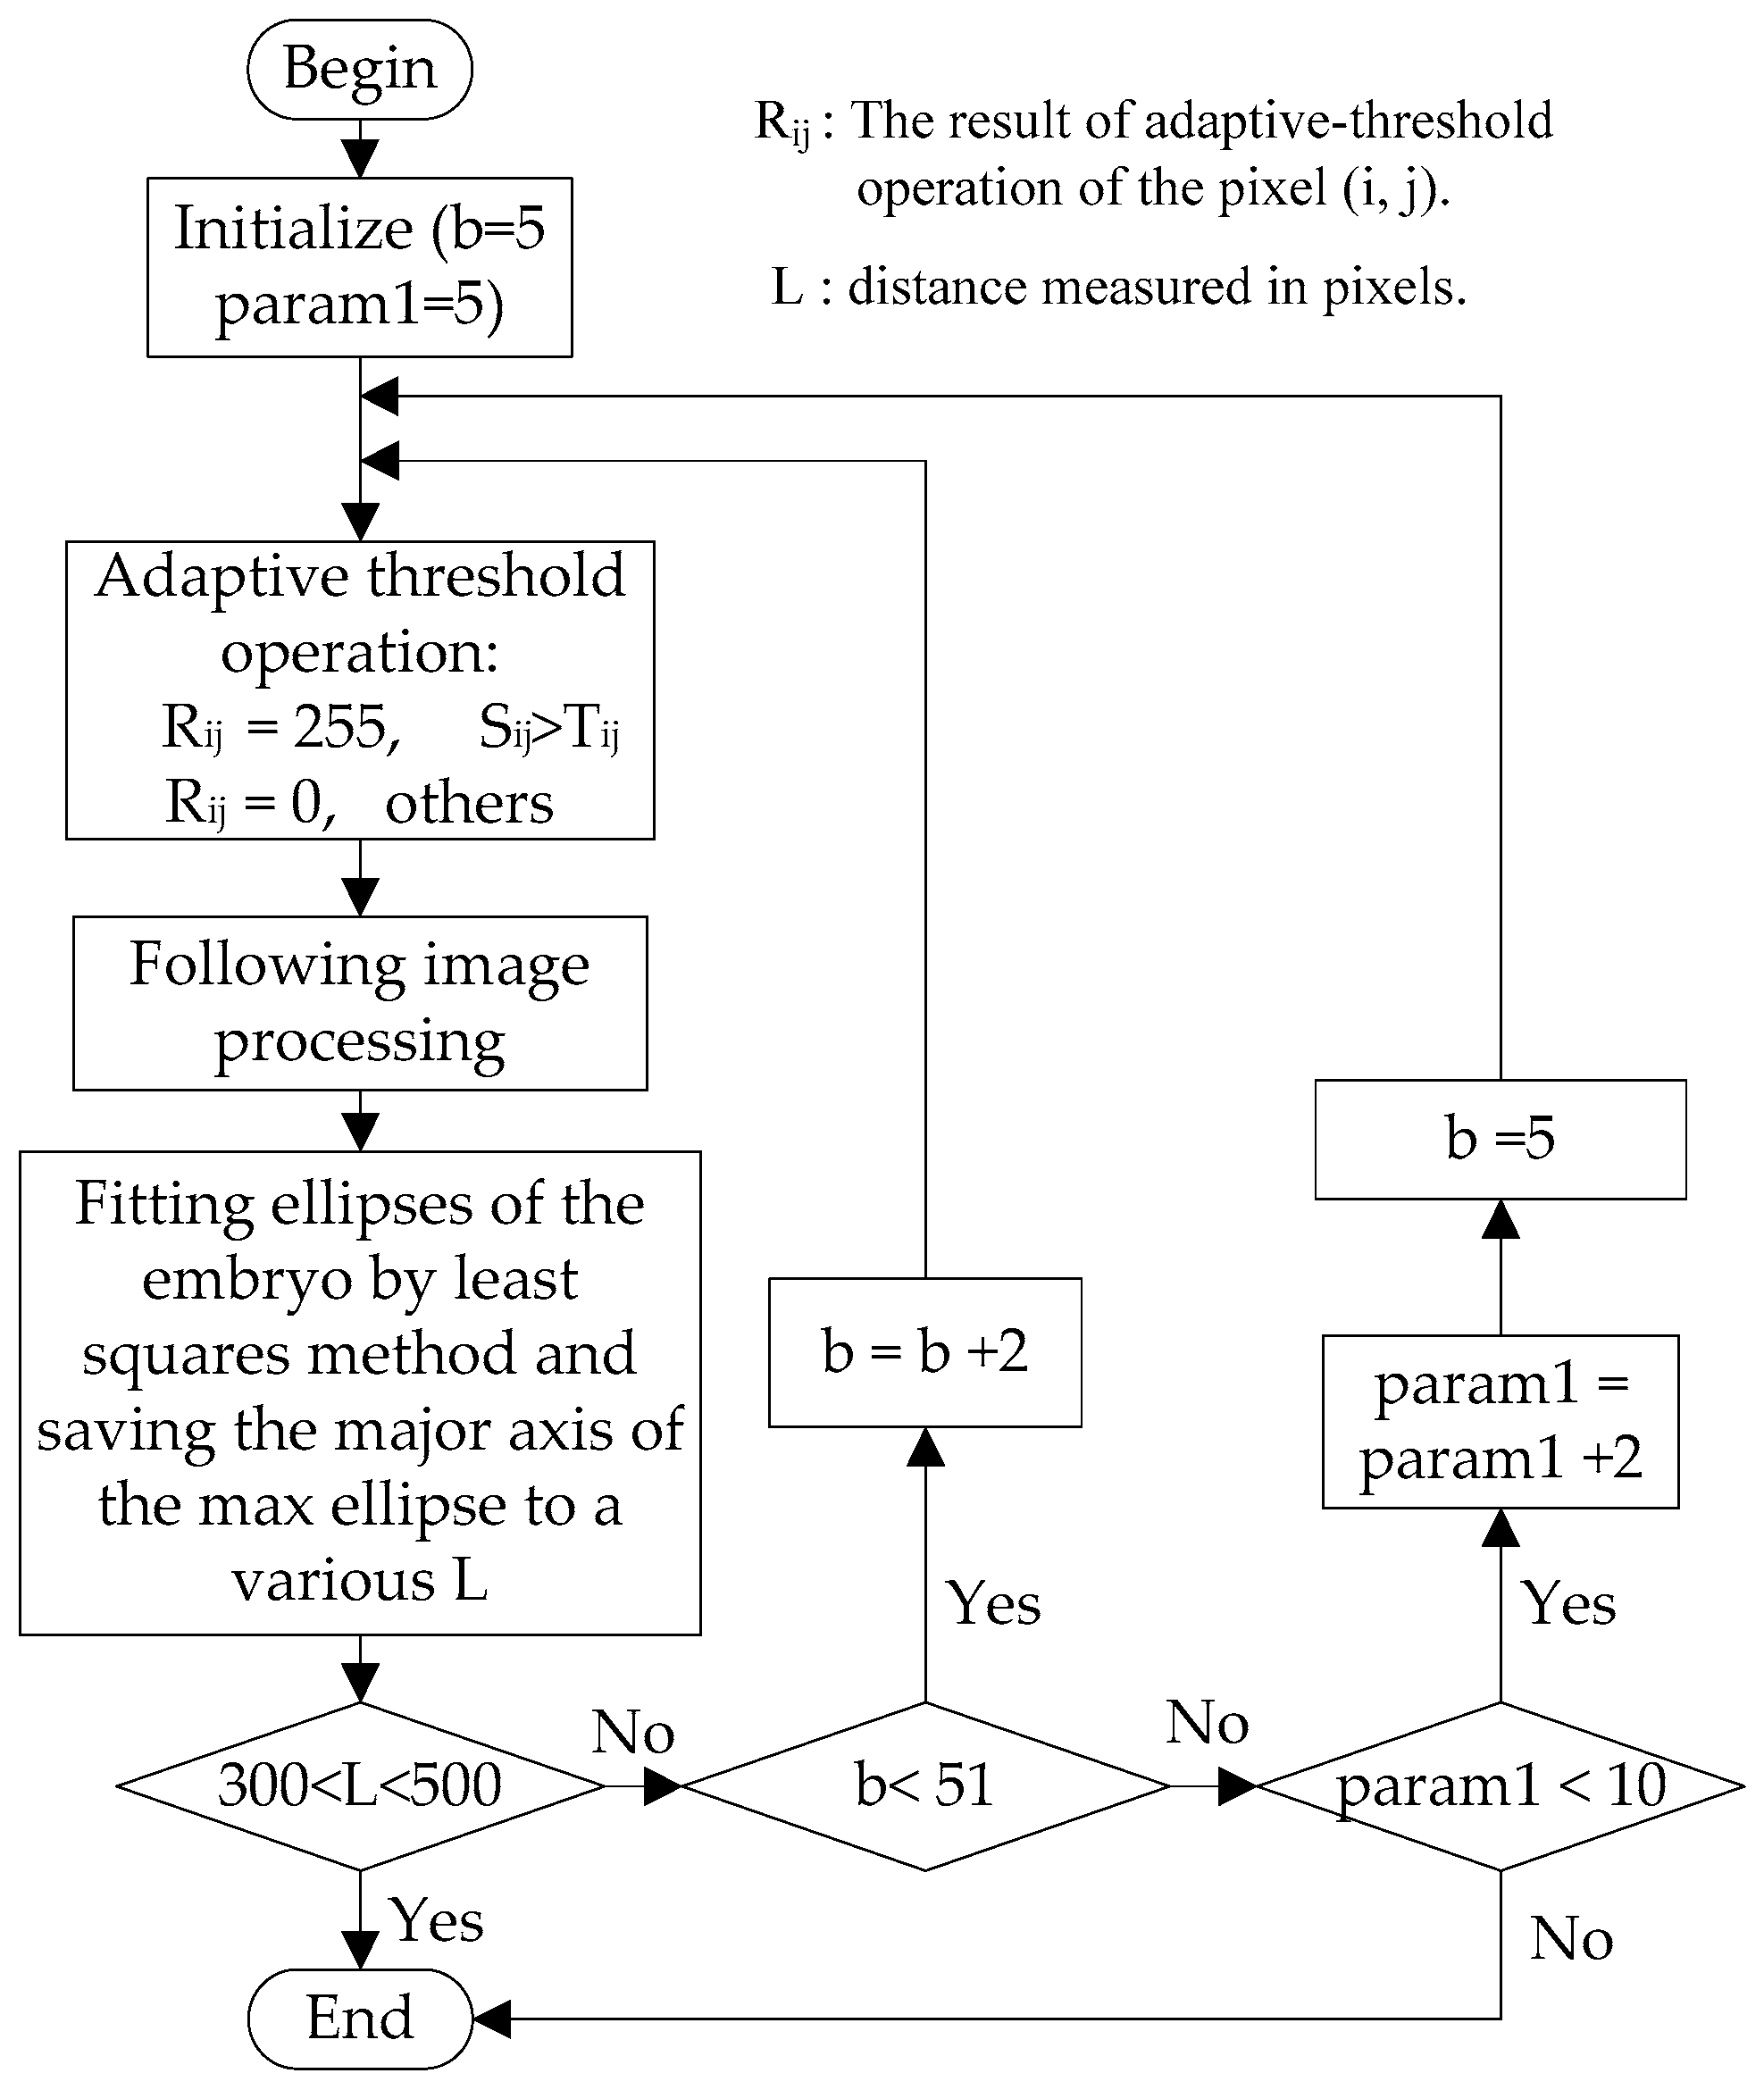
3.2.1. Real Time Adaptive-Threshold Detection for Automatic Cell Detection
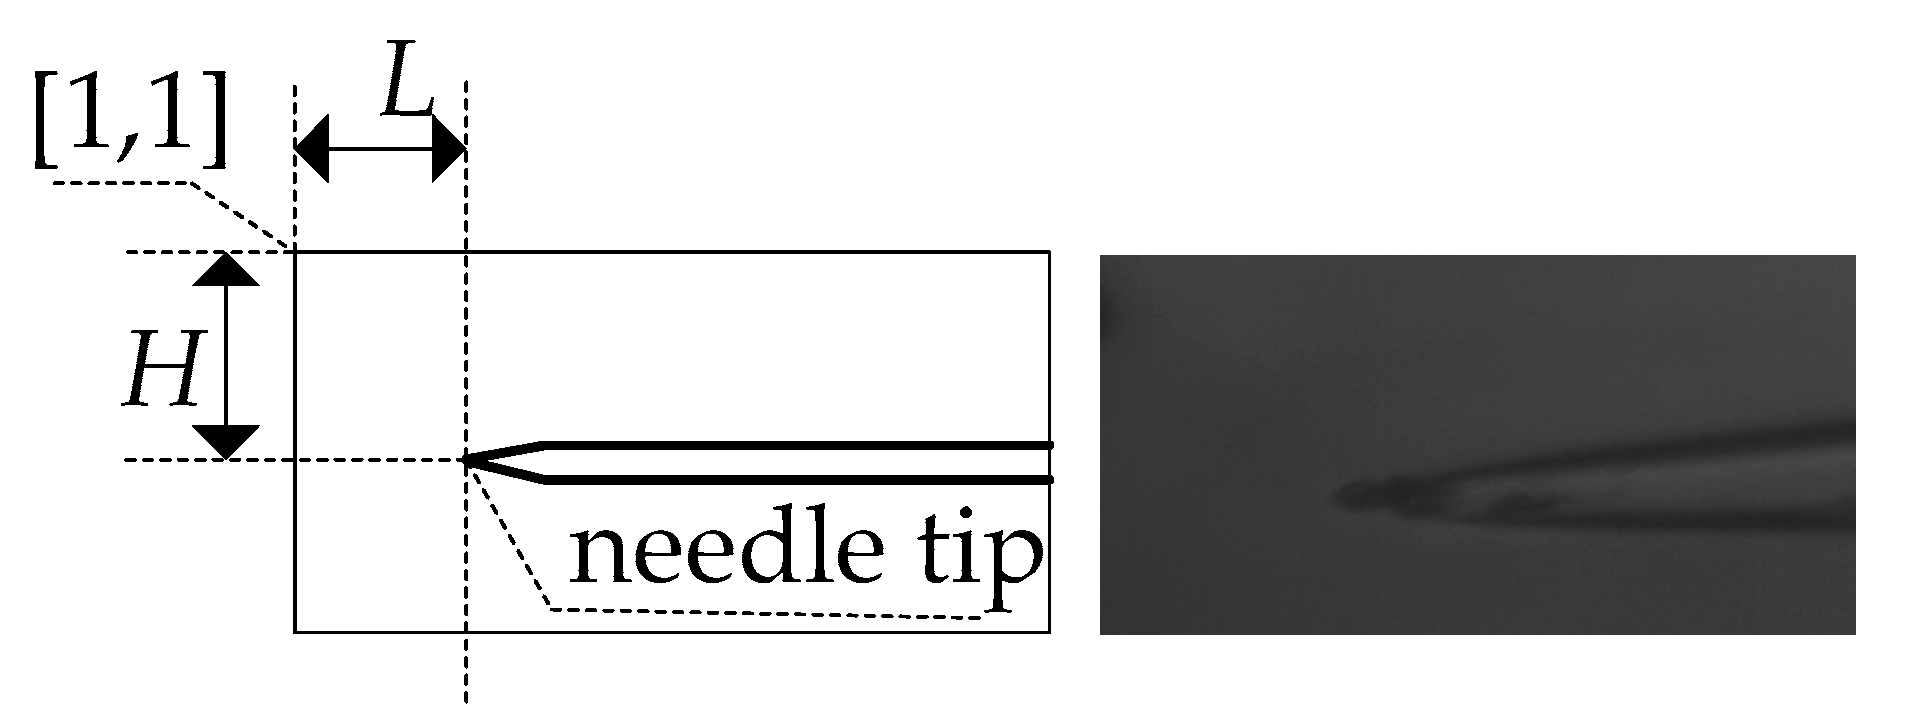
3.2.2. Detection of Injection Pipette Tip
4. Experiments
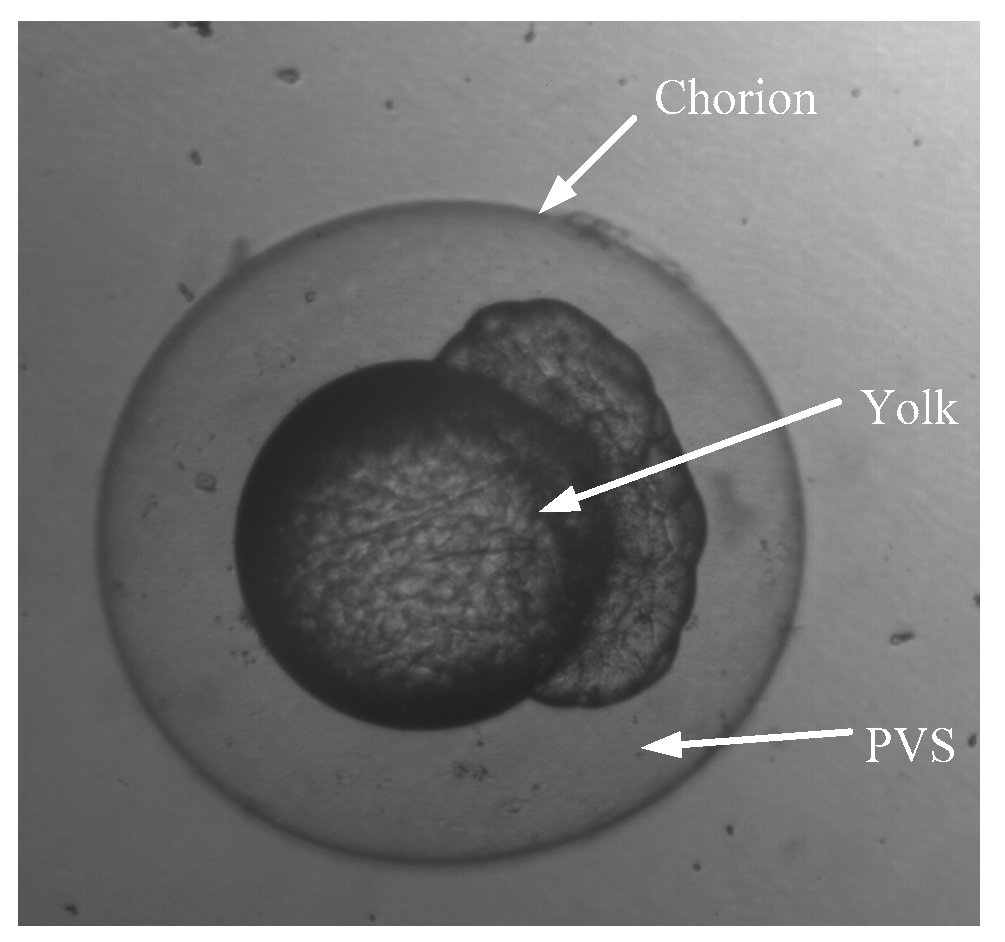
4.1. Materials
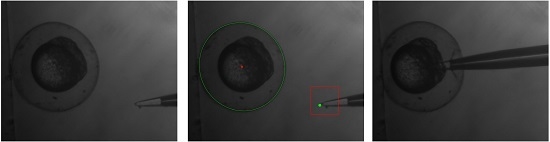
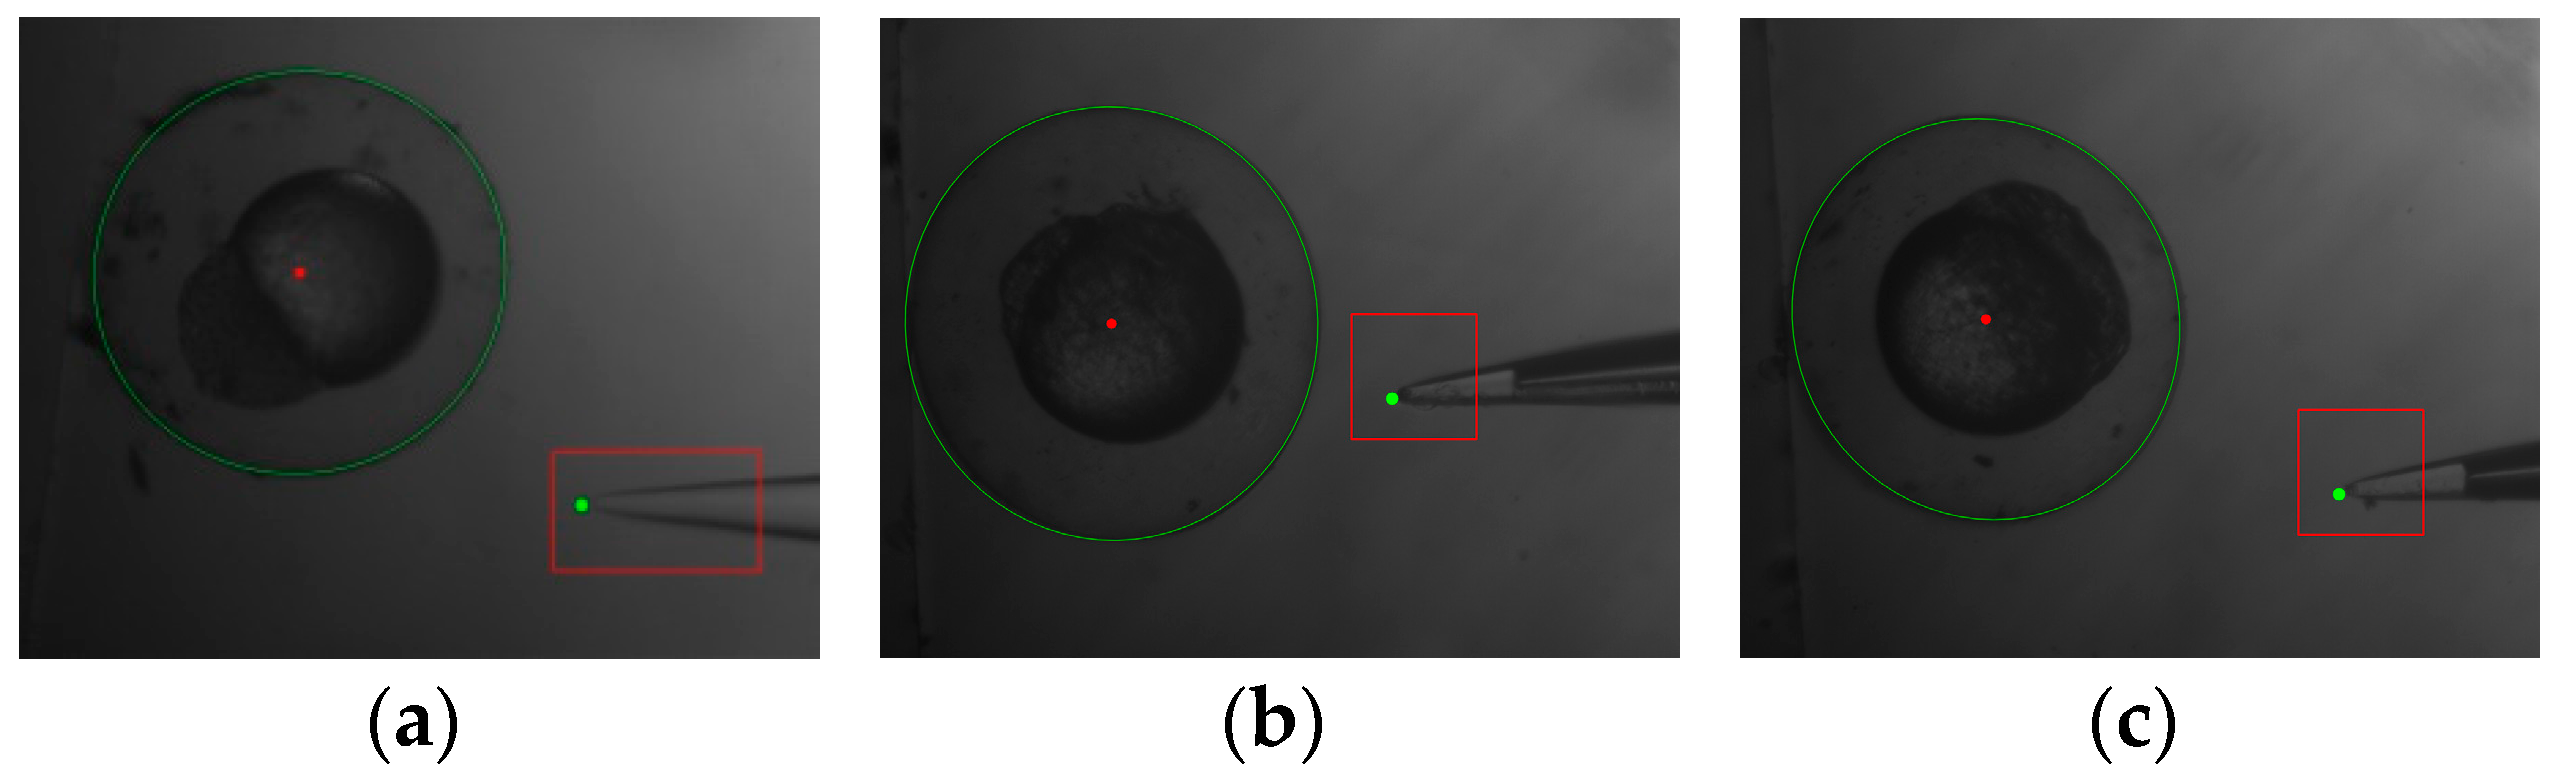
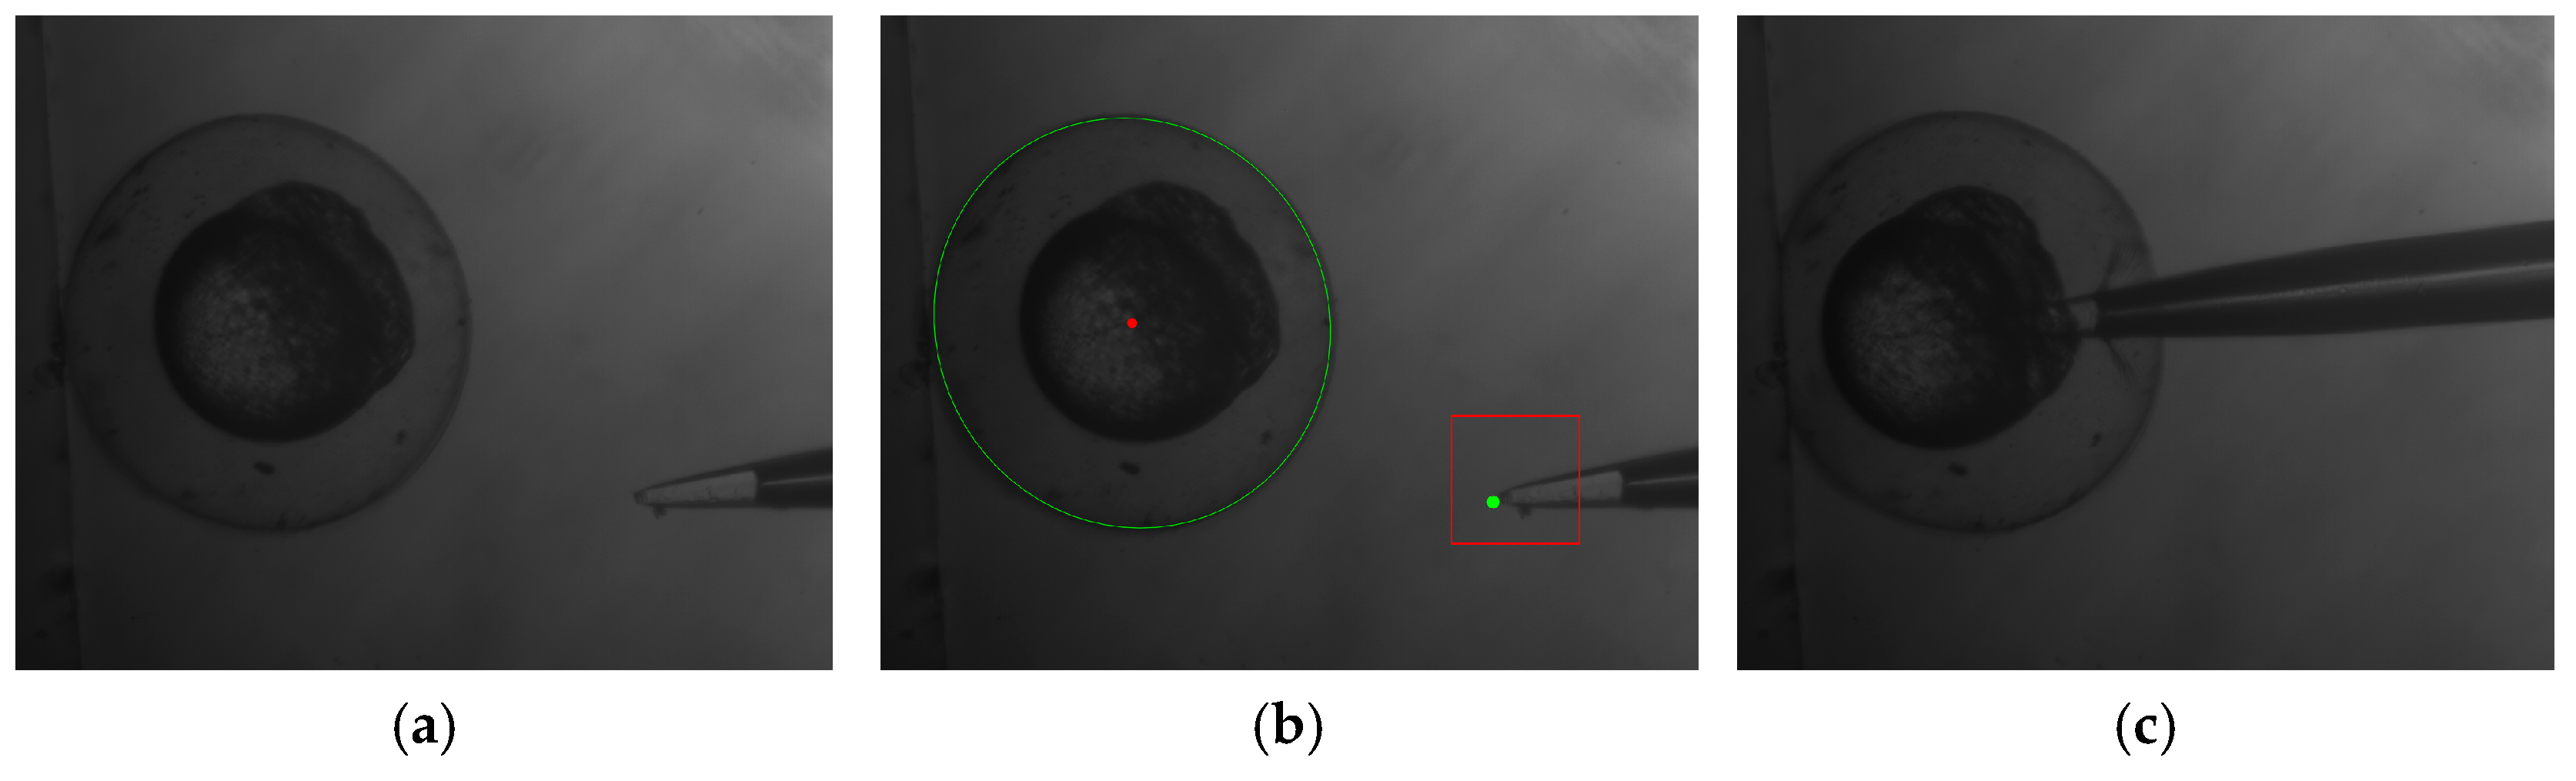
4.2. Experiments
- the petri dish containing the embryos and culture medium was placed under the microscope;
- the embryo was autofocused by using the autofocusing algorithm;
- the injection pipette was moved to the focus plane;
- the adaptive image processing was used to get the location and dimension information of the embryo;
- the template matching algorithm was used to obtain the location of the pipette tip;
- the distance between the center of the cell and pipette tip along the x-axis and y-axis was calculated;
- the injection pipette was automatically moved into center of the embryo;
- the sample was deposited into the yolk section of the embryo;
- the pipette out moved of the embryo.
5. Conclusions
Supplementary Materials
Acknowledgments
Author Contributions
Conflicts of Interest
References
- Zon, L.I.; Peterson, R.T. In vivo drug discovery in the zebrafish. Nat. Rev. Drug Discov. 2005, 4, 35–44. [Google Scholar] [CrossRef] [PubMed]
- Lin, C.Y.; Chiang, C.Y.; Tsai, H.J. Zebrafish and medaka: New model organisms for modern biomedical research. J. Biomed. Sci. 2016, 23, 19. [Google Scholar] [CrossRef] [PubMed]
- Kari, G.; Rodeck, U.; Dicker, A.P. Zebrafish: An emerging model system for human disease and drug discovery. Clin. Pharmacol. Ther. 2007, 82, 70–80. [Google Scholar] [CrossRef] [PubMed]
- Wang, W.H.; Liu, X.Y.; Gelinas, D.; Ciruna, B.; Sun, Y. A fully automated robotic system for microinjection of zebrafish embryos. PLoS ONE 2007, 2, e862. [Google Scholar] [CrossRef] [PubMed]
- Lu, Z.; Chen, P.C.Y.; Nam, J.; Ge, R.W.; Lin, W. A micromanipulation system with dynamic force-feedback for automatic batch microinjection. J. Micromech. Microeng. 2007, 17, 314–321. [Google Scholar] [CrossRef]
- Pillarisetti, A.; Anjum, W.; Desai, J.P.; Friedman, G.; Brooks, A.D. Force feedback interface for cell injection. In Proceedings of the 1st Joint Eurohaptics Conference and Symposium on Haptic Interfaces for Virtual Environment and Teleoperator Systems—World Haptics Conference, WHC 2005, Pisa, Italy, 18–20 March 2005; pp. 391–400.
- Huang, H.B.; Sun, D.; Mills, J.K.; Cheng, S.H. Robotic cell injection system with position and force control: Toward automatic batch biomanipulation. IEEE Trans. Robot. 2009, 25, 727–737. [Google Scholar] [CrossRef]
- Xie, Y.; Sun, D.; Liu, C.; Tse, H.Y.; Cheng, S.H. A force control approach to a robot-assisted cell microinjection system. Int. J. Robot. Res. 2010, 29, 1222–1232. [Google Scholar] [CrossRef]
- Xie, Y.; Sun, D.; Tse, H.Y.G.; Liu, C.; Cheng, S.H. Force sensing and manipulation strategy in robot-assisted microinjection on zebrafish embryos. IEEE/ASME Trans. Mechatron. 2011, 16, 1002–1010. [Google Scholar] [CrossRef]
- Groen, F.C.A.; Young, I.T.; Ligthart, G. A comparison of different focus functions for use in autofocus algorithms. Cytometry 1985, 6, 81–91. [Google Scholar] [CrossRef] [PubMed]
- Sun, Y.; Duthaler, S.; Nelson, B.J. Autofocusing in computer microscopy: Selecting the optimal focus algorithm. Microsc. Res. Tech. 2004, 65, 139–149. [Google Scholar] [CrossRef] [PubMed]
- Liu, X.Y.; Wang, W.H.; Sun, Y. Autofocusing for automated microscopic evaluation of blood smear and pap smear. In Proceedings of the 2006 28th Annual International Conference of the IEEE on Engineering in Medicine and Biology Society, New York, NY, USA, 30 August–3 September 2006; pp. 3010–3013.
- Brenner, J.F.; Dew, B.S.; Horton, J.B.; King, T.; Neurath, P.W.; Selles, W.D. An automated microscope for cytologic research a preliminary evaluation. J. Histochem. Cytochem. 1976, 24, 100–111. [Google Scholar] [CrossRef] [PubMed]
- Krotkov, E. Focusing. Int. J. Comput. Vision 1988, 1, 223–237. [Google Scholar] [CrossRef]
- Al-Amri, S.S.; Kalyankar, N.V.; Khamitkar, S.D. Image segmentation by using threshold techniques. 2010; arXiv:1005.4020. [Google Scholar]
- Doyle, W. Operations useful for similarity-invariant pattern recognition. J. ACM 1962, 9, 259–267. [Google Scholar] [CrossRef]
- Jain, R.; Kasturi, R.; Schunck, B.G. Machine Vision; McGraw-Hill, Inc.: New York, NY, USA, 1995; pp. 219–6131. [Google Scholar]
- Otsu, N. A threshold selection method from gray-level histograms. Automatica 1975, 11, 23–27. [Google Scholar]
- Fitzgibbon, A.; Pilu, M.; Fisher, R.B. Direct least square fitting of ellipses. IEEE Trans. Pattern Anal. Mach. Intell. 1999, 21, 476–480. [Google Scholar] [CrossRef]
- Westerfield, M. A guide for the laboratory use of zebrafish (danio rerio). In The Zebrafish Book, 4th ed.; University of Oregon Press: Eugene, OR, USA, 2000. [Google Scholar]


| Buttons | Functions |
|---|---|
| Start Live | Open the camera, and display live video in the picture box |
| Stop Live | Stop video and display current image in the picture box |
| Save Image | Save an image to the specified location |
| Cell Autofocus | Begin automatic cell autofocusing manipulation |
| Image Process | Begin to search the cell and micropipette by visual processing algorithm and show results in the picture box and corresponding info blocks |
| Cell Auto Microinject | Begin to automatically move the micropipette and conduct microinjection |
| Exit | Save and exit the program |
| Functions | Tenengrade Gradient Function | Brenner Gradient Function | Normalized Variance Function |
|---|---|---|---|
| Computational Times (s) | 1.2794 | 0.69279 | 1.0831 |
| Adaptive Threshold | Cell Detection an Location | Center of Embryo | (b, param1) | Characteristic |
|---|---|---|---|---|
 |  | (445, 589) | (7, 7) | even illumination |
 |  | (583, 538) | (15, 5) | uneven illumination |
 |  | (594, 429) | (13, 5) | uneven illumination, with interference of the image of glass slice |
 |  | (549, 556) | (19, 5) | uneven illumination, with interference of the image of another embryo |
| Embryo No. | Visual Servoed Autofocus: Success | Embryo and Injection Pipette Detect and Locate | Position Information for Robot Arm | ||||
|---|---|---|---|---|---|---|---|
| The Major and Minor Axis of Embryo (pixel) | Visual Processing with Adaptive-Threshold Algorithm | ||||||
| Adaptive-Threshold Parameters (b, param1) | Consumption Time (s) | Target Location of Embryo Center (pixel) | Injection Tip Location (pixel) | Success | |||
| 1 | √ | (712, 626) | (37, 5) | 2.086 | (488, 513) | (969, 247) | √ |
| 2 | √ | (726, 636) | (47, 5) | 2.824 | (326, 442) | (760, 780) | √ |
| 3 | √ | (662, 640) | (37, 5) | 2.064 | (448, 407) | (989, 779) | √ |
| 4 | √ | (648, 604) | (45, 5) | 2.673 | (356, 569) | (917, 677) | √ |
| 5 | √ | (672, 646) | (45, 5) | 2.651 | (407, 590) | (815, 660) | √ |
| 6 | √ | (694, 660) | (25, 5) | 1.149 | (370, 498) | (817, 608) | √ |
| 7 | √ | (678, 632) | (21, 5) | 0.827 | (451, 528) | (884, 483) | √ |
| 8 | √ | (648, 614) | (29, 5) | 1.482 | (393, 481) | (956, 761) | √ |
| 9 | √ | (620, 604) | (29, 5) | 1.450 | (424, 541) | (903, 210) | √ |
| 10 | √ | (662, 624) | (35, 5) | 1.903 | (460, 368) | (1014, 649) | √ |
| 11 | √ | (666, 624) | (47, 5) | 2.827 | (448, 461) | (913, 200) | √ |
| 12 | √ | (652, 616) | (35, 5) | 1.903 | (477, 437) | (893, 280) | √ |
| 13 | √ | (648, 602) | (31, 5) | 1.619 | (391, 459) | (928, 697) | √ |
| 14 | √ | (650, 628) | (23, 5) | 1.032 | (564, 618) | (991, 431) | √ |
© 2016 by the authors. Licensee MDPI, Basel, Switzerland. This article is an open access article distributed under the terms and conditions of the Creative Commons Attribution (CC-BY) license ( http://creativecommons.org/licenses/by/4.0/).
Share and Cite
Xie, Y.; Zeng, F.; Xi, W.; Zhou, Y.; Liu, H.; Chen, M. A Robot-Assisted Cell Manipulation System with an Adaptive Visual Servoing Method. Micromachines 2016, 7, 104. https://doi.org/10.3390/mi7060104
Xie Y, Zeng F, Xi W, Zhou Y, Liu H, Chen M. A Robot-Assisted Cell Manipulation System with an Adaptive Visual Servoing Method. Micromachines. 2016; 7(6):104. https://doi.org/10.3390/mi7060104
Chicago/Turabian StyleXie, Yu, Feng Zeng, Wenming Xi, Yunlei Zhou, Houde Liu, and Mingliang Chen. 2016. "A Robot-Assisted Cell Manipulation System with an Adaptive Visual Servoing Method" Micromachines 7, no. 6: 104. https://doi.org/10.3390/mi7060104
APA StyleXie, Y., Zeng, F., Xi, W., Zhou, Y., Liu, H., & Chen, M. (2016). A Robot-Assisted Cell Manipulation System with an Adaptive Visual Servoing Method. Micromachines, 7(6), 104. https://doi.org/10.3390/mi7060104