Article

Noise Reduction of MEMS Gyroscope Based on Direct Modeling for an Angular Rate Signal

1
Xi'an Research Inst. of Hi-Tech, Hongqing Town, Xi'an 710025, China
2
MOE Key Laboratory of Micro and Nano Systems for Aerospace, Northwestern Polytechnical University, 127 Youyi West Road, Xi'an 710072, China
*
Author to whom correspondence should be addressed.
Micromachines 2015, 6(2), 266-280; https://doi.org/10.3390/mi6020266
Submission received: 24 December 2014 / Revised: 7 February 2015 / Accepted: 10 February 2015 / Published: 16 February 2015
(This article belongs to the Special Issue Next Generation MEMS-Based Navigation—Systems and Applications)

Abstract

:
In this paper, a novel approach for processing the outputs signal of the microelectromechanical systems (MEMS) gyroscopes was presented to reduce the bias drift and noise. The principle for the noise reduction was presented, and an optimal Kalman filter (KF) was designed by a steady-state filter gain obtained from the analysis of KF observability. In particular, the true angular rate signal was directly modeled to obtain an optimal estimate and make a self-compensation for the gyroscope without needing other sensor’s information, whether in static or dynamic condition. A linear fit equation that describes the relationship between the KF bandwidth and modeling parameter of true angular rate was derived from the analysis of KF frequency response. The test results indicated that the MEMS gyroscope having an ARW noise of 4.87°/h0.5 and a bias instability of 44.41°/h were reduced to 0.4°/h0.5 and 4.13°/h by the KF under a given bandwidth (10 Hz), respectively. The 1σ estimated error was reduced from 1.9°/s to 0.14°/s and 1.7°/s to 0.5°/s in the constant rate test and swing rate test, respectively. It also showed that the filtered angular rate signal could well reflect the dynamic characteristic of the input rate signal in dynamic conditions. The presented algorithm is proved to be effective at improving the measurement precision of the MEMS gyroscope.

1. Introduction

The microelectromechanical systems (MEMS) gyroscope featuring low cost, small device size, low power consumption and high reliability lead to increasing applications in various inertial fields [1]. It is hoped to replace the traditional fiber-optics gyroscopes or as complementary sensors in the field of aviation and aerospace where requires compact sensors [2]. However, the performance of MEMS gyroscope quickly degrades over time because of high level of the noise and drift, and to date the lower accuracy is the major shortcoming that limits the application of MEMS gyroscope [3]. It has been demonstrated that the bias drift is a crucial factor that affects the measurement precision of a MEMS gyroscope. Therefore, to estimate and compensate for the bias drift is an important aspect for enhancing the performance of MEMS gyroscope along with improvement of sensors itself [4,5,6,7].
Currently, the methods for estimating and compensating for the stochastic drift and reducing noise of MEMS gyroscope mainly include several approaches such as time series analysis [8], power spectral density, neural network [9,10] and wavelet transformation [11]. These methods are usually based on analysis of a mathematical equation for modeling the gyroscope’s drift and then obtain the model equation of drift characteristics. Consequently, in designing of an integrated system, the model equation can be added into the system model to improve accuracy. The common feature of these methods is that the drift errors are usually modeled and estimated to compensate for the outputs of a MEMS gyroscope [12,13]. However, these methods depend on the modeling of a practical system and information from other sensors, and the accuracy improvement is also limited. Furthermore, the true angular rate signal and bias drift are not well distinguished to model separately in a dynamic condition; thus, for a single gyroscope, it cannot realize the self-compensation for the bias drift in a dynamic condition. In addition, the error models established by the approaches of wavelet transformation and neural network usually have higher order, making them hard to implement using a Kalman filter (KF), because the dimensions of the system coefficient matrix and noise covariance matrix become very large and complicates the KF operation, especially for MEMS gyroscope with a lower accuracy.
In recent years, a novel method was proposed to improve the measurement precision of MEMS gyroscope through fusing the multiple outputs of an MEMS gyroscope array. Numerous studies have been undertaken on the multi-data fusion of gyroscope array [14,15,16]. These researches have already demonstrated that the important core of fusing information of the multiple gyroscopes for remarkably improving accuracy lies in a favorable correlation between the component devices in a gyroscope array. However, currently a MEMS gyroscope array with a particular noise correlation is usually very difficult to intentionally design and realize [15]. In particular, the acquisition of correlation coefficient and analysis the influencing mechanism on the accuracy of the combined rate signal are becoming a crucial factor, which restrict the engineering realization of the multi-signal fusion of the gyroscope array. Presently, the MEMS gyroscope array composed by several separate individual gyroscopes is usually considered to be uncorrelated [15], in this case, the performance improvement is limited but will increase the computational load with increasing of sensor number in the array.
Using an approach of direct modeling for the angular rate signal could reduce the measurement noise and improve the accuracy of the single MEMS gyroscope considerably. In this study, the true angular rate signal together with the bias drift will be directly modeled to design a KF scheme to reduce the noise and drift of the MEMS gyroscope. The greatest advantage of such an approach is that an estimation of the bias drift can be achieved to compensate for the outputs of gyroscope. Furthermore, an optimal estimation of the true angular rate can be directly obtained using a KF technique, which will make a realization of self-compensation for the single MEMS sensor possible without needing other sensor’s information in a dynamic condition. A discrete-time KF will be designed. Lastly, the static and dynamic performances of the presented KF are tested and evaluated.

2. Modeling of Stochastic Error for MEMS Gyroscope

The measurement errors of a MEMS gyroscope usually contain deterministic errors and stochastic errors. In this paper, the errors for MEMS gyroscope only consider the dominant stochastic errors without deterministic errors since those can be compensated by testing procedure. Numerous experiments have demonstrated that the noise of the rate random walk (RRW) and angular random walk (ARW) are considered the most dominant error sources, consequently, here a typical error model is shown to describe the gyroscope [17,18]:
{ y ( t ) = ω ( t ) + b ( t ) + n ( t ) b ˙ ( t ) = w b ( t )
where y(t) is the measured angular rate, ω(t) is the input true angular rate, b(t) is the bias drift driven by noise of RRW wb, and n(t) is the ARW white noise.
The Allan variance method is usually used to identify and quantify the stochastic noise statistics of a MEMS gyroscope [19,20]. The definition of Allan variance for the typical gyroscope model of Equation (1) can be given as [21]:
σ 2 ( τ ) = σ N 2 ( τ ) + σ B 2 ( τ ) + σ K 2 ( τ ) = N 2 τ + ( 0.6643 B ) 2 + K 2 τ 3
where σ(τ) is the root Allan variance, τ is the integration time, N, K and B are the noise coefficients of ARW, RRW and bias instability, respectively. The slope of different noise terms displayed in the double log plot of σ(τ) vs. τ and unit of the noise coefficients is shown in Table 1. In particular, a novel generalized method of wavelet moments was proposed and developed in [19], which could be useful used to estimate the noise coefficients of a MEMS gyroscope in the Equation (2).
Table 1. Noise terms of MEMS gyroscope by Allan variance.
Noise TermsAllan VarianceSlopeCoefficientUnit
ARWN2−1/2N = σ(1)°/h0.5
Bias instability(0.6643B)20B = σ(f0)/0.6643°/h
RRWK2τ/3+1/2K = σ(3)°/h1.5

3. Optimal KF Algorithm for Gyroscope Noise Reduction

3.1. KF State and Measurement Equation

The bias drift and other noises are usually modeled in a filtering system to compensate for the outputs of gyroscope to improve accuracy. In order to achieve a considerable noise reduction, in this study, the true angular rate and bias drift are both modeled to set as the system state vector to design a KF. The important advantage of such approach is that an optimal estimation of the true angular rate can be directly obtained using a KF. Additionally, it could build a feedback correction by using the estimation of bias drift to compensate for the outputs of gyroscope, hence improving the KF performance. Here, the true angular rate signal is described by a process of random walk driven by a zero-mean white noise nω [16]:
ω ˙ = n ω
Using a KF technique, setting the bias drift b and true angular rate ω as the estimated quantity, and then the KF state vector can be defined as X(t) = [ω, b]T; thus, the KF state and measurement equation can be expressed as:
{ X ˙ ( t ) = F X ( t ) + w ( t ) Z ( t ) = H X ( t ) + v ( t )
where Z(t) is the KF measurement information, Z(t) = y(t) is the outputs of gyroscope. The zero-mean white noise vectors w(t) = [nω,wb]T and v(t) = n(t) with E[w(t)wT(t + τ)] = Qδ(τ) and E[v(t)vT(t + τ)] = Rδ(τ), representing system process noise and measurement noise. The KF coefficient matrix F = 02×2. The measurement matrix H, covariance matrices Q and R can be written as:
H = [ 1 1 ] T ,   Q = [ q ω 0 0 q b ] ,   R = q n
where qb is the variance of RRW noise, qn is the variance of ARW noise, and qω is the variance of white noise nω. The values of parameter qω should be determined by the bandwidth requirement of the input signal in a dynamic condition. From the state and measurement Equation (4), the continuous-time KF for the true angular rate and bias drift estimate can be given as:
X ^ ˙ ( t ) = K ( t ) [ Z ( t ) H X ^ ( t ) ]
K ( t ) = P ( t ) H T R 1
P ˙ ( t ) = Q P ( t ) H T R 1 H P ( t )
where X ^ ˙ ( t ) is the estimation of the KF state vector, P(t) is the estimated covariance, and K(t) is the filter gain. It indicates that the state vector X(t) can be obtained by the K(t); thus, there is a need to solve the differential Equation (8). In particular, as for a KF filtering system with constant coefficients, the implementation of KF can be simplified if the filter has a steady-state gain. Therefore, the properties of the K(t) and P(t) will be analyzed in the next section.

3.2. Analysis of KF Observability

In this section, the observability of matrices F and H will be analyzed. From the definition of matrices F and H, the rank of system observability matrix for the KF state-space model of Equation (4) is equal to one, thus the KF system is not completely observable. Here, a basic discrete iterative KF method in the following is used to off-line analyze the property and characteristic of estimated covariance P(t) and filter gain K(t) [22].
P k / k 1 = F k , k 1 P k 1 F k , k 1 T + Q k 1
K k = P k / k 1 H k T ( H k P k / k 1 H k T + R ) k 1
P k = ( I K k H k ) P k / k 1 ( I K k H k ) T + K k R k K k T
The noises of ARW and RRW for the gyroscope are assumed to be 0.1667°/h0.5 and 1200°/h1.5, and the value of qω is set as 1000(°/h)2, where the filtering period is set as 0.005 s. By using Equations (9)–(11), the plot of changing trend for P(t) and K(t) are shown in Figure 1.
Figure 1. Plot of changing trend of the estimated covariance P(t) and filter gain K(t). (a) Kalman filter (KF) covariance P(t). (b) KF gain K(t).
Micromachines 06 00266 g001
Figure 1 indicates that the estimated covariance P(t) will be increased with increasing iteration times, and the component values of the matrix P(t) are diverged without steady-state values. However, fortunately the component values of the filter gain K(t) approaches a steady-state value. In particular, multiple analyses have demonstrated that different KF parameters will not affect the convergent property of the filter gain, but only change the steady-state value and convergence time. In this paper, an off-line approach will be used to get the steady-state filter gain; thus, the state vector X(t) can be estimated and obtained by using of a steady-state filter gain based on the Equation (6).

3.3. Discrete-Time KF for True Rate Signal Estimate

Using a steady-state gain Ks to construct a KF will simplify the implementation of system. Here, we will establish a discrete-time equation for true angular rate estimate through solving the continuous-time Equation (6). The reason is that the inherent stable property of KF can be revealed and explained. In particular, the KF bandwidth can be easily analyzed through the KF frequency response, providing a basis for determining the qω in a dynamic condition.
It is assumed that the steady-state filter gain Ks obtained by the off-line approach of Equations (9)–(11) is defined as K s = [ k 1 , k 2 ] T , the extract vector for the true angular rate and bias drift are defined as e1 = [1, 0] and e2 = [0, 1], respectively. Using of filter gain Ks, the estimation of true angular rate can be obtained by a continuous-time KF:
X ^ ˙ ( t ) = [ k 1 k 1 k 2 k 2 ] X ^ ( t ) + [ k 1 k 2 ] Z ( t )
Discretizing the Equation (12), and defining matrix m = [ k 1 k 1 k 2 k 2 ] , then we have:
X ^ k + 1 = e m T X ^ k + 0 T e m t d t [ k 1 k 2 ] Z k + 1
Using an eigenvalue decomposition of matrix m = S Λ S 1 , where S is a full matrix whose columns are the corresponding eigenvectors, and Λ is a diagonal matrix of eigenvalues. With the definition of matrix m, the two eigenvalues of m can be deduced as λ1 = (k1 + k2) and λ2 = 0, then we get:
0 T e m t d t = 0 T e S Λ S 1 t d t = S [ λ 1 1 ( e λ 1 T 1 ) 0 0 T ] S 1
Using of Equations (13) and (14), the discrete-time KF can be obtained as:
X ^ k + 1 = S [ e λ 1 T 0 0 1 ] S 1 X ^ k + S [ λ 1 1 ( e λ 1 T 1 ) 0 0 T ] S 1 [ k 1 k 2 ] Z k + 1
where T is the sampling period. Thus, the optimal estimation of the state vector can be obtained by Equation (15).
As for the mathematical model of KF above, the procedure for the practical filter implementation can be summarized in the following.
  • Step 1: Form the covariance matrices Q and R by the ARW and RRW noise variance and variance qω;
  • Step 2: Analyze the steady-state filtering gain Ks off-line by using of Equations (9)–(11), K s = [ k 1 , k 2 ] T ;
  • Step 3: Perform the eigenvalue decomposition of matrix m, m = S Λ S 1 ;
  • Step 4: Extract the eigenvectors matrix S and eigenvalues λ1 and λ2;
  • Step 5: Calculate the matrices A and B,
    A = S [ e λ 1 T 0 0 1 ] S 1 ,   B = S [ λ 1 1 ( e λ 1 T 1 ) 0 0 T ] S 1
  • Step 6: Perform the discrete-time KF equation,
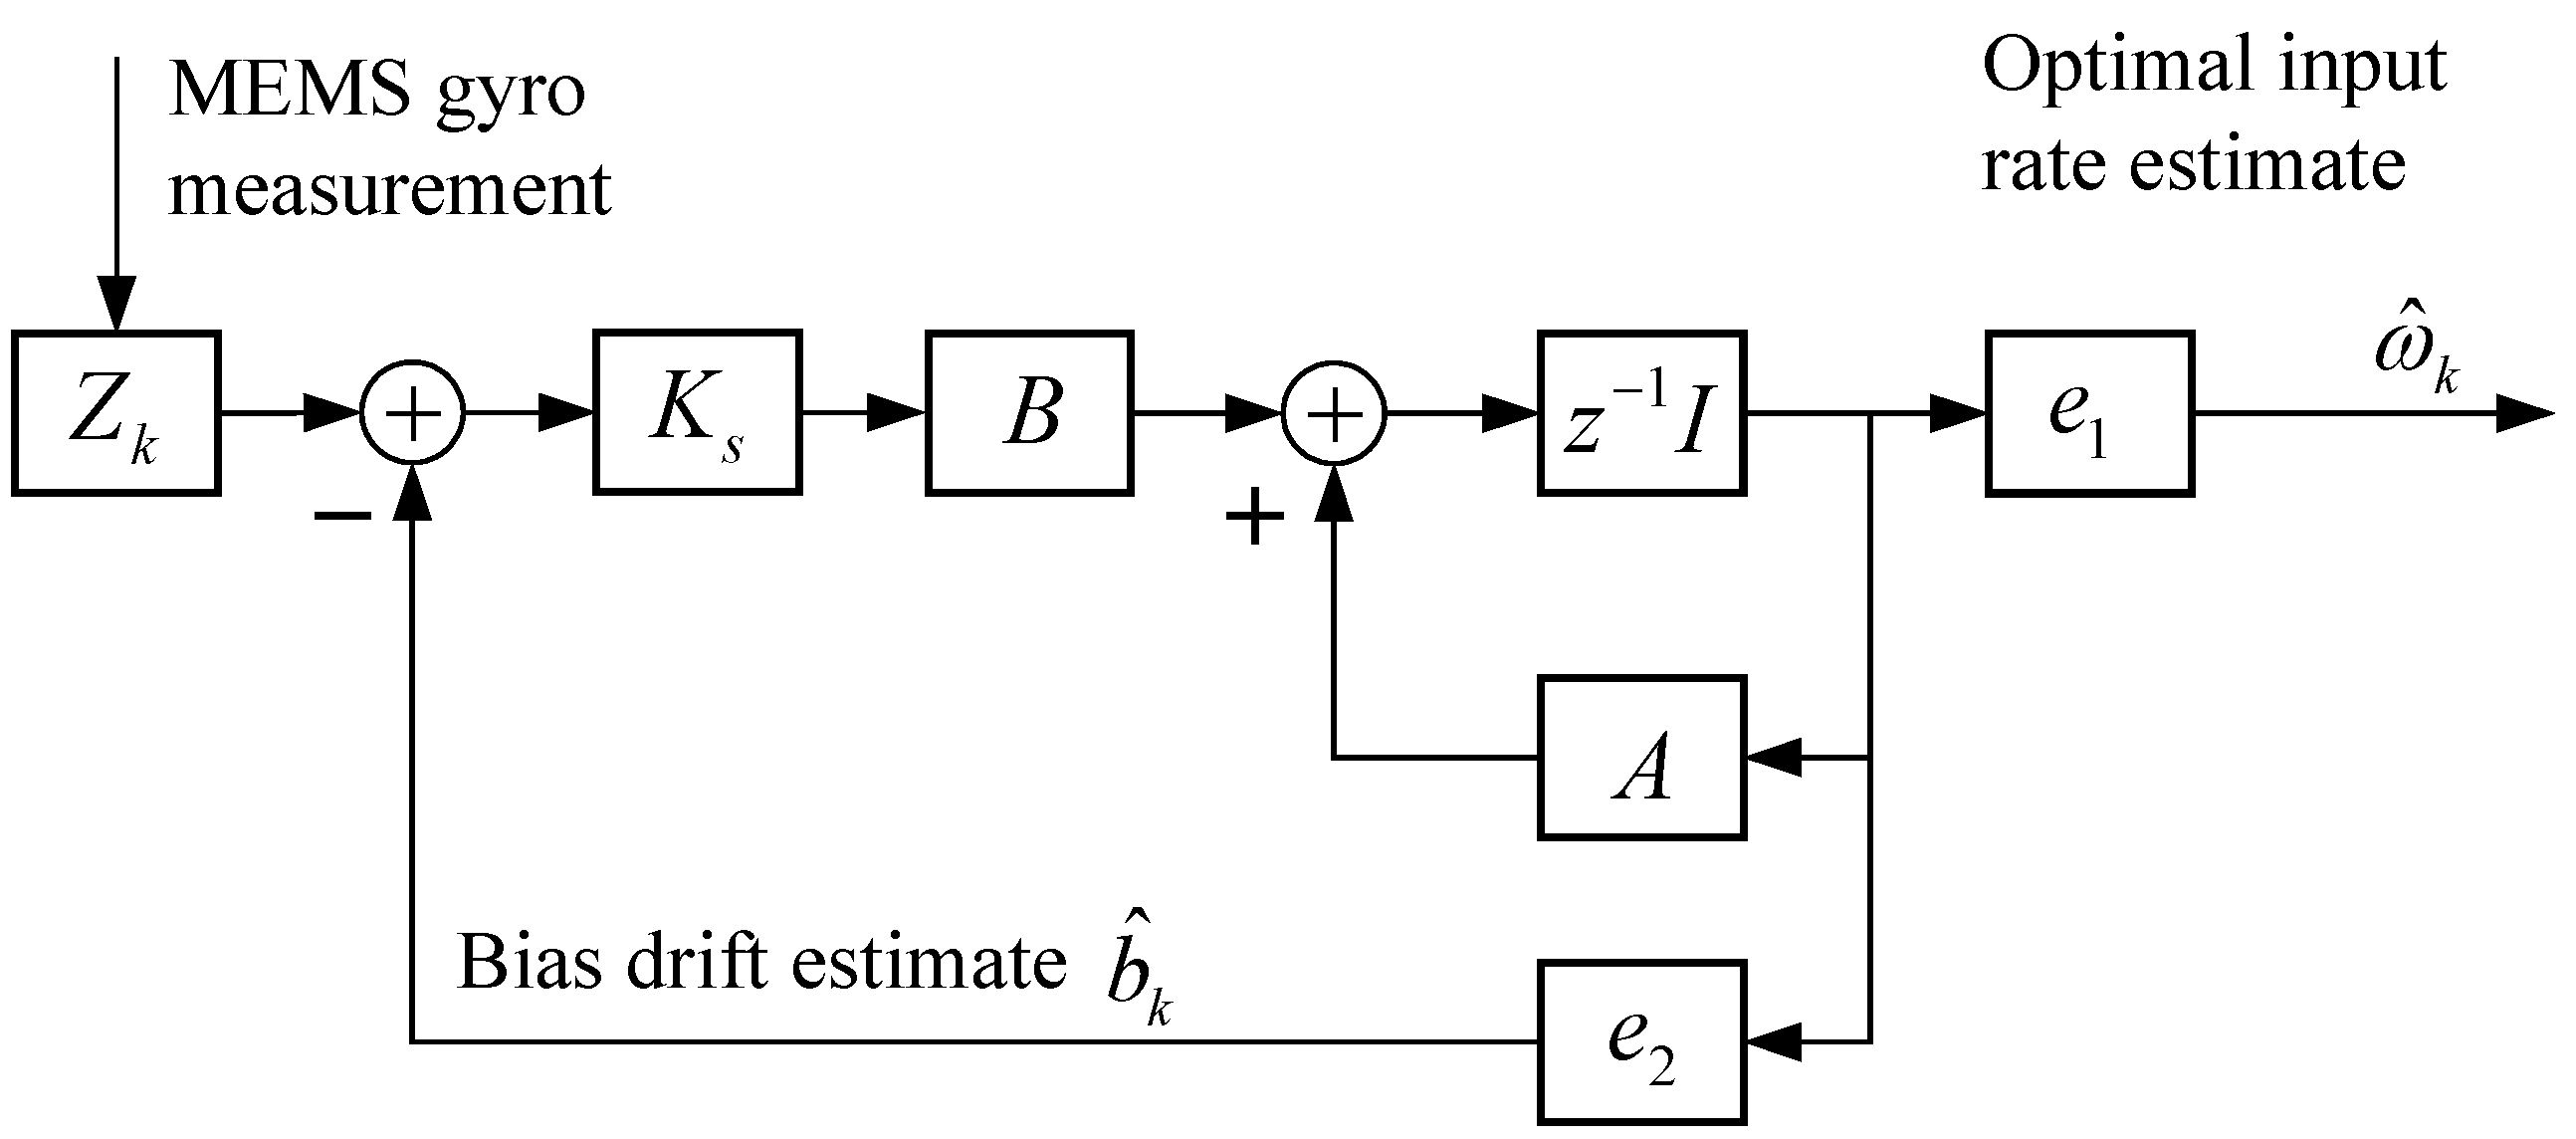
    { X ^ k + 1 = A X ^ k + B K s Z k + 1 ω ^ k + 1 = e 1 X ^ k + 1 b ^ k + 1 = e 2 X ^ k + 1
Thus the optimal estimates of the true angular rate and bias drift can be obtained by Equation (17). The discrete-time KF is implemented as shown in Figure 2.
Figure 2. Angular rate signal implement and estimate using a discrete KF.
Micromachines 06 00266 g002

3.4. Analysis of KF Bandwidth

In the presented KF model, the true angular rate is directly modeled as a random walk process; thus, the KF bandwidth is heavily related to the parameter qω even though it can also be affected by other parameters such as noise statistics of the gyroscope. Consequently, selecting a suitable value of qω is prerequisite for implementation of a KF.
Here, we analyze the KF bandwidth from the frequency response of KF and choose a value of qω in the implementation of KF. A linear fit Equation (18) is obtained to describe the relationship between the −3 dB bandwidth of KF and parameter q ω based on the multiple analyses of KF frequency response with choosing different values of q ω (see in Figure 3). Thus, a suitable value of parameter qω for the KF implementation can be easily determined by the Equation (18):
B W = 0.0004177 * q ω + 0.03213
Figure 3. Linear fit results of the KF −3 dB bandwidth with q ω .
Micromachines 06 00266 g003

4. Experiment and Discussion

In the experiments, a low-performance and low-cost MEMS gyroscope ADXRS300 [23] is taken to implement experiments. As for the practical implementation of filter, the C language is employed to design and compile the KF algorithm. From the discrete-time KF of Equation (17), it shows that the estimated rate signal can be obtained once the matrices A and B are determined. In this work, the components values of the matrices A and B are calculated off-line in advance, and then these matrices are written into the signal processing program. The hardware system is designed by the digital signal processing (DSP) technique. Therefore, the gyroscope’s outputs signal can be collected by the DSP unit for real-time processing by the filtering program which solidified in the DSP processor, and then providing an optimal estimation of input rate signal having a higher accuracy.
For the static drift test, the gyroscope noise density, ARW, and bias instability corresponding to the original signal of the outputs of gyroscope and filtered signal were tested and compared. The dynamic tests were carried out to evaluate the ability of KF for reducing measurement noise and reproducing the dynamic characteristic of the input rate signal. The standard deviation (1σ) of the estimated errors is used to evaluate the accuracy of the rate signal in dynamic condition such as constant rate and swing rate tests. The mathematical definition of the 1σ error is defined as:
σ = 1 n 1 i = 1 n ( σ ^ i ω i , t r u e ) 2
where σ ^ i is the estimate of the true angular rate associated with the ith time, and ω i , t r u e is the true angular rate associated with the ith time, and n is the length number of samples.

4.1. Static Drift Test Result

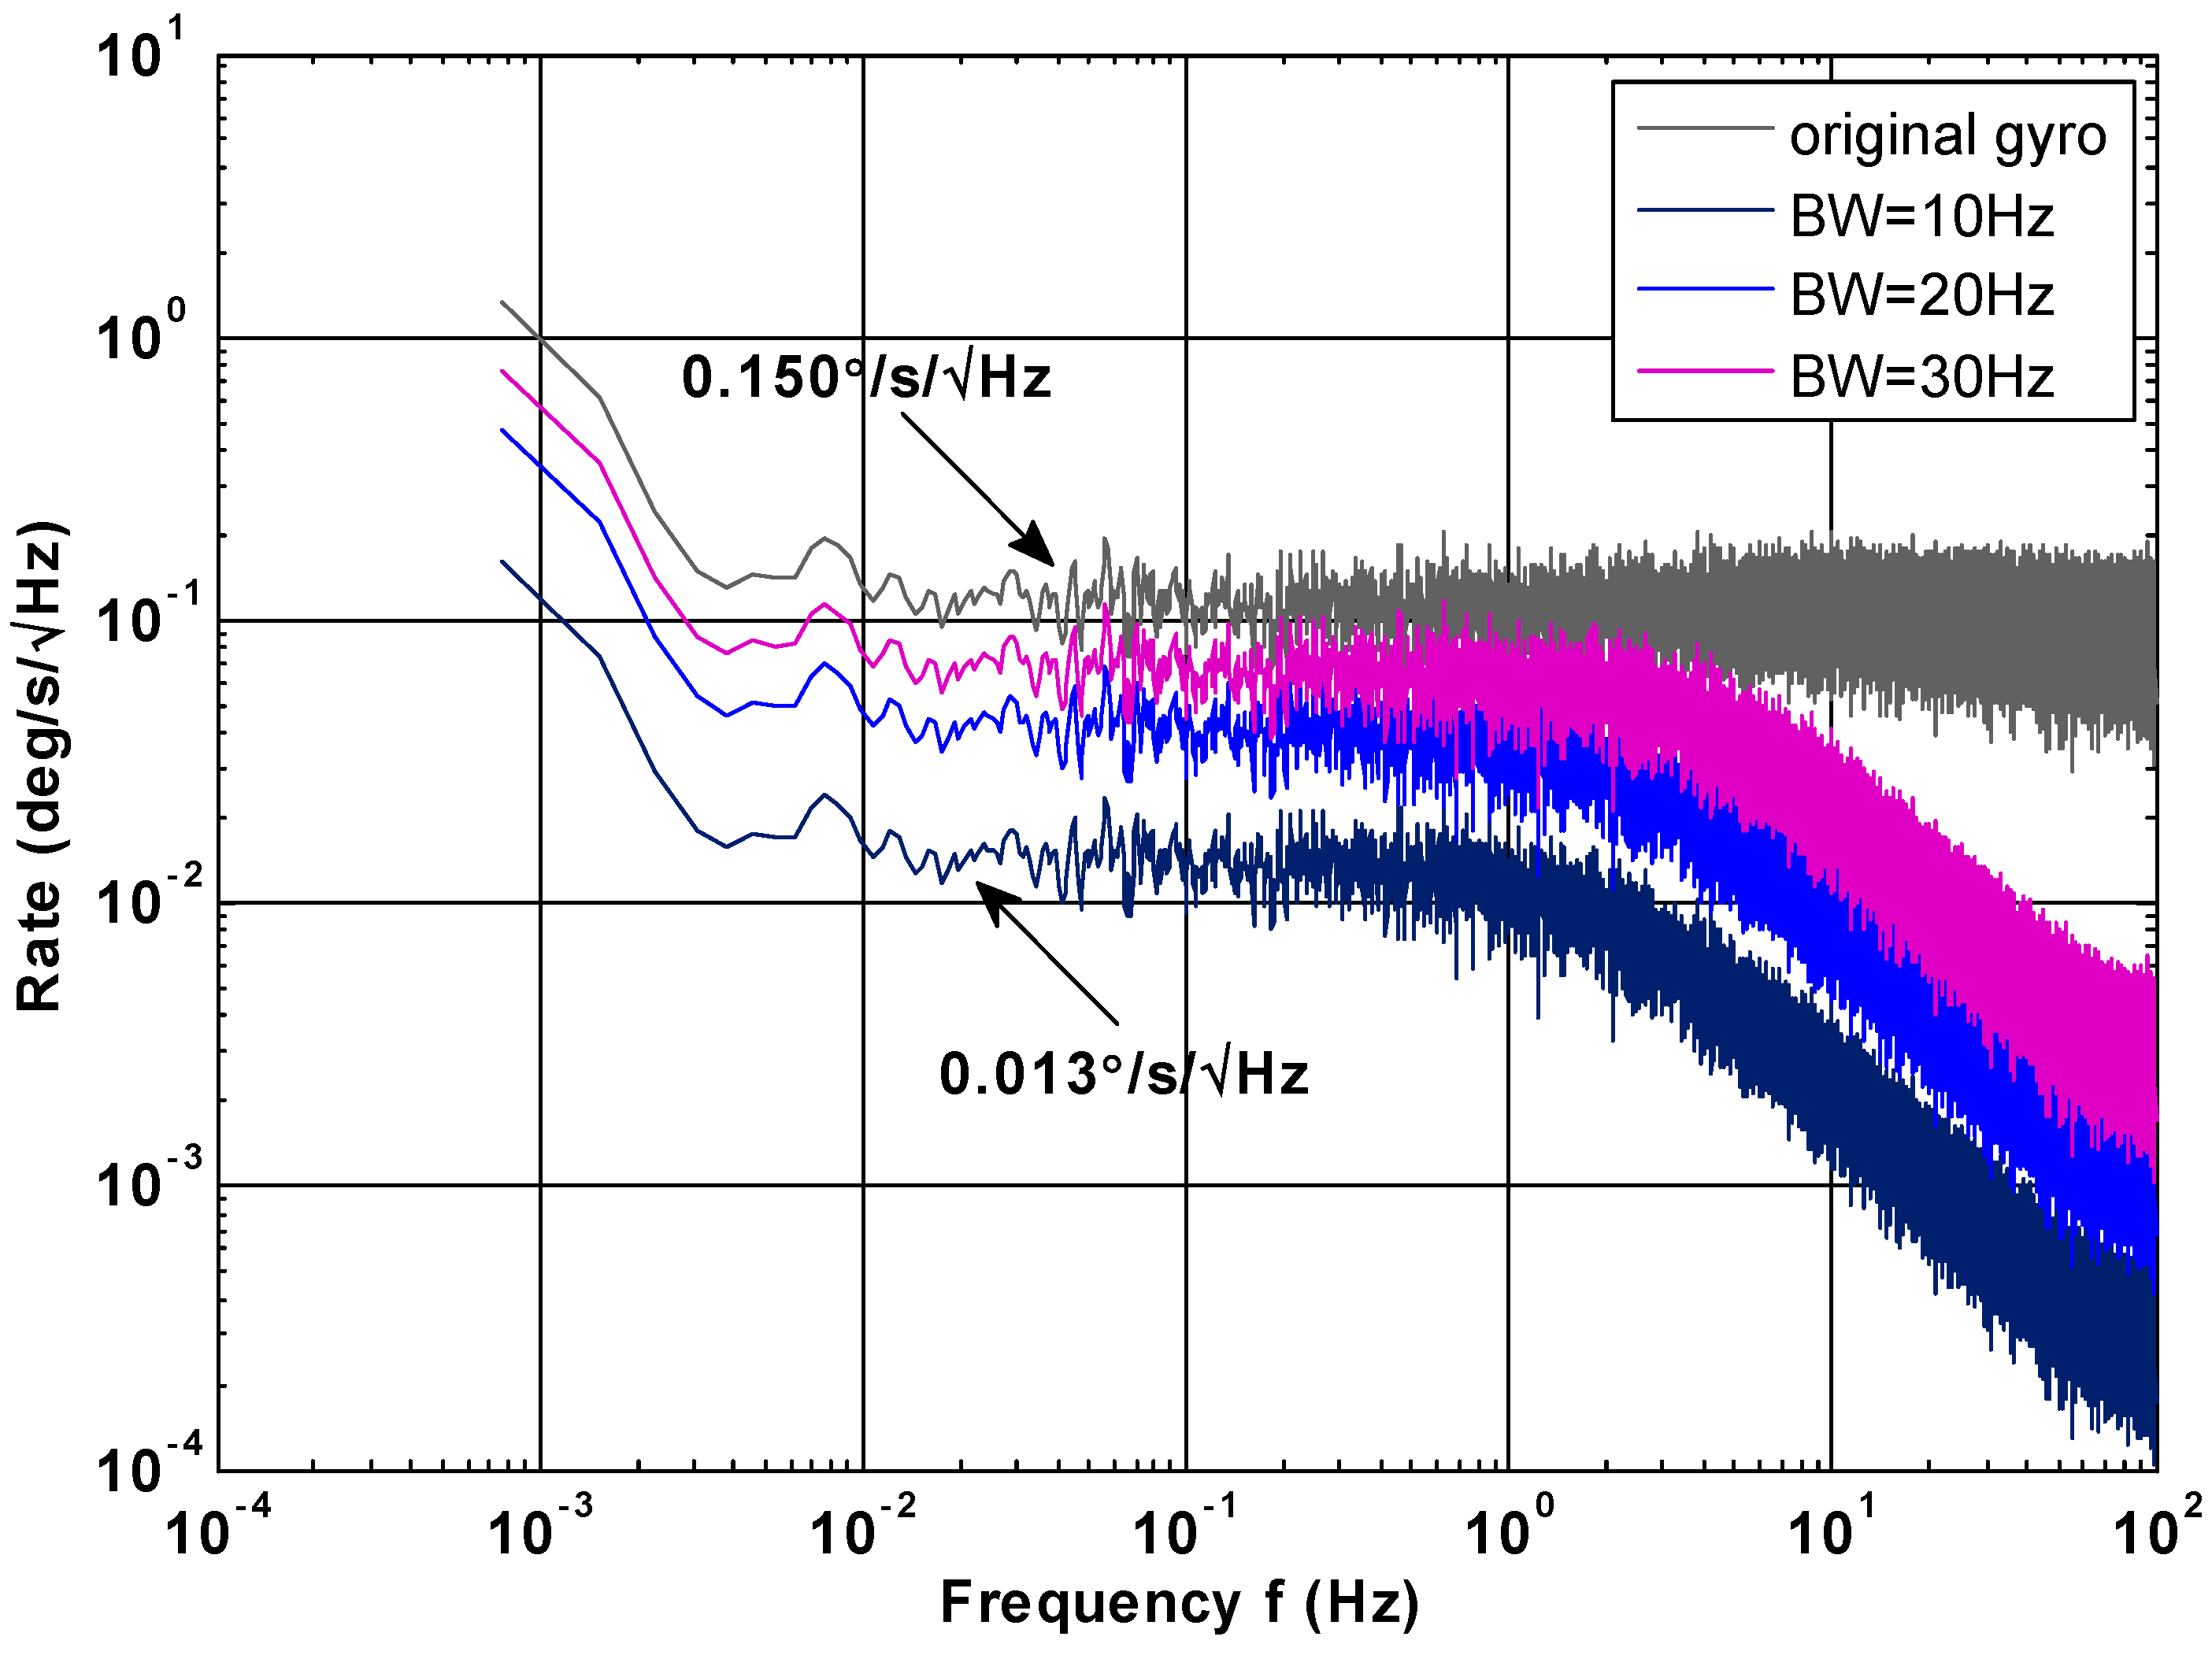
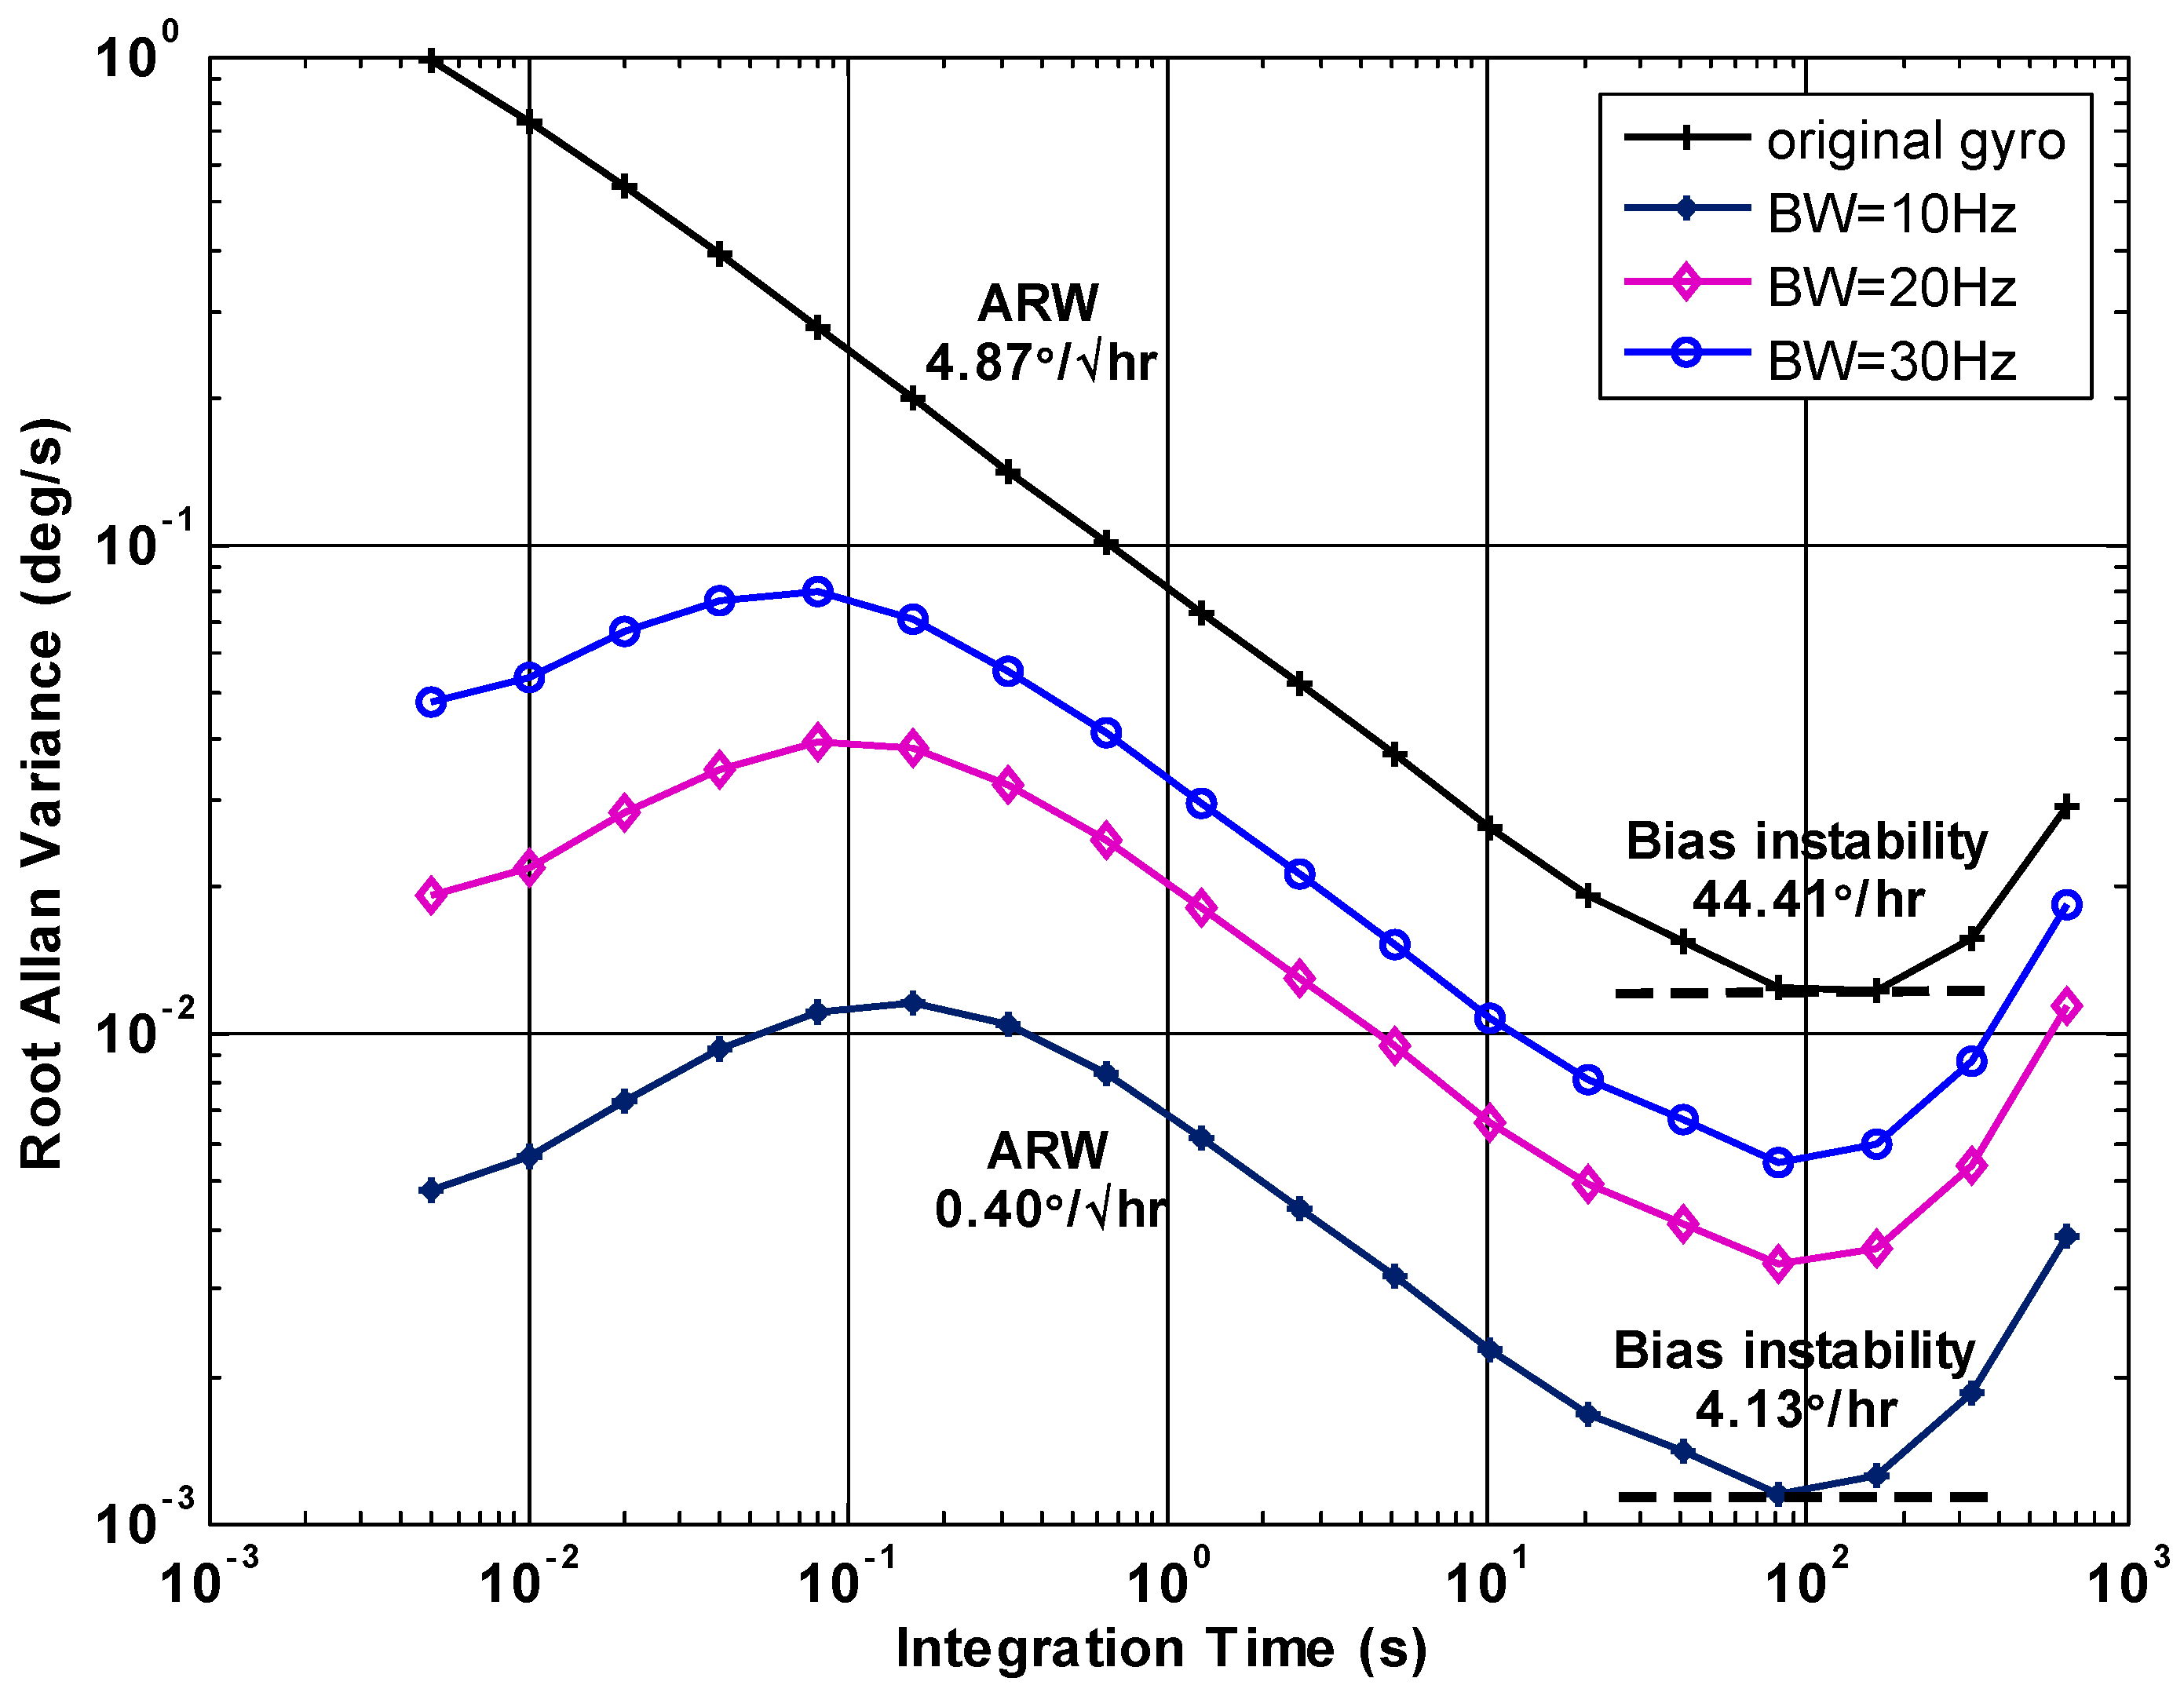
The fast Fourier transform (FFT) analysis was used to evaluate the noise density of the gyroscope signal. The ARW and bias instability were evaluated by the Allan variance technique. The performance of presented KF was tested under different KF bandwidths, where the bandwidths are set as 10, 20 and 30 Hz by using of Equation (18) to choose the values of parameter qω to implement KF. The comparison of noise density and root Allan variance are shown in Figure 4 and Figure 5. The results are demonstrated in Table 2.
Figure 4 shows a noise density of about 0.15°/s·Hz−0.5 for the original rate signal and 0.013°/s·Hz−0.5 for the filtered rate signal with bandwidth of 10 Hz, resulting in a reduction factor of about 11. From Table 2, it can be found that the values of the noise density will decrease with a decrease in bandwidth, i.e., the noise density is about 0.061°/s·Hz−0.5 for the 30 Hz bandwidth, which is higher than that of 10 Hz.
From the root Allan variance plot (Figure 5), this indicates that the noises of ARW and bias instability are considerably reduced by the presented KF. It also shows that the plot of root Allan variance will be close to the horizontal X-axis with decrease of KF bandwidth, which suggests a lower noise characteristic. From Table 2, it can be found that the bias instability was reduced from 44.41°/h to 4.13°/h with bandwidth of 10 Hz, while the ARW was also reduced from 4.87°/h0.5 to 0.40°/h0.5, making a noise reduction factor of about 12 and 10 for the ARW and bias drift, respectively.
Table 2. Static test results of gyroscope noise by presented KF.
TermsNoise (°/s/Hz0.5)ARW (°/h0.5)Bias drift (°/h)
Original gyro0.1504.866844.4129
BW = 10 Hz0.0130.40064.1344
BW = 20 Hz0.0401.203712.1383
BW = 30 Hz0.0611.887919.7388
Figure 4. FFT of the gyroscope rate signal under different KF bandwidths.
Micromachines 06 00266 g004
Figure 5. Allan variance compared result of gyroscope under different KF bandwidths.
Micromachines 06 00266 g005
On the other hand, the auto-correlation functions of the filtered rate signal under different KF bandwidths and original rate signal were calculated and analyzed, which can be found in Figure 6. From Figure 6, it can be seen that there exists auto-correlation in the filtered rate signal, but the autocorrelation does not appear in the original rate signal. In particular, the auto-correlation will increase with decreasing KF bandwidth. The reason can be explained by the discrete-time KF of Equation (17). The reason lies in that the KF will mainly depend on the estimated value of X ^ k rather than measurement information Z k + 1 because of decreasing KF bandwidth.
Figure 6. Auto-correlation functions of the filtered rate signal and original rate signal under different KF bandwidths. (a) Filtered rate signal. (b) Original rate signal.
Micromachines 06 00266 g006
From the above results, it can be seen that the performance of KF and measurement precision of estimated rate signal are seriously related to the KF bandwidth, namely, it is directly related to the values of parameter qω. Therefore, in a practical application we should trade off bandwidth for accuracy, and then using Equation (18) to select a suitable value of qω to set KF bandwidth in a dynamic condition.

4.2. Constant Rate Test Result

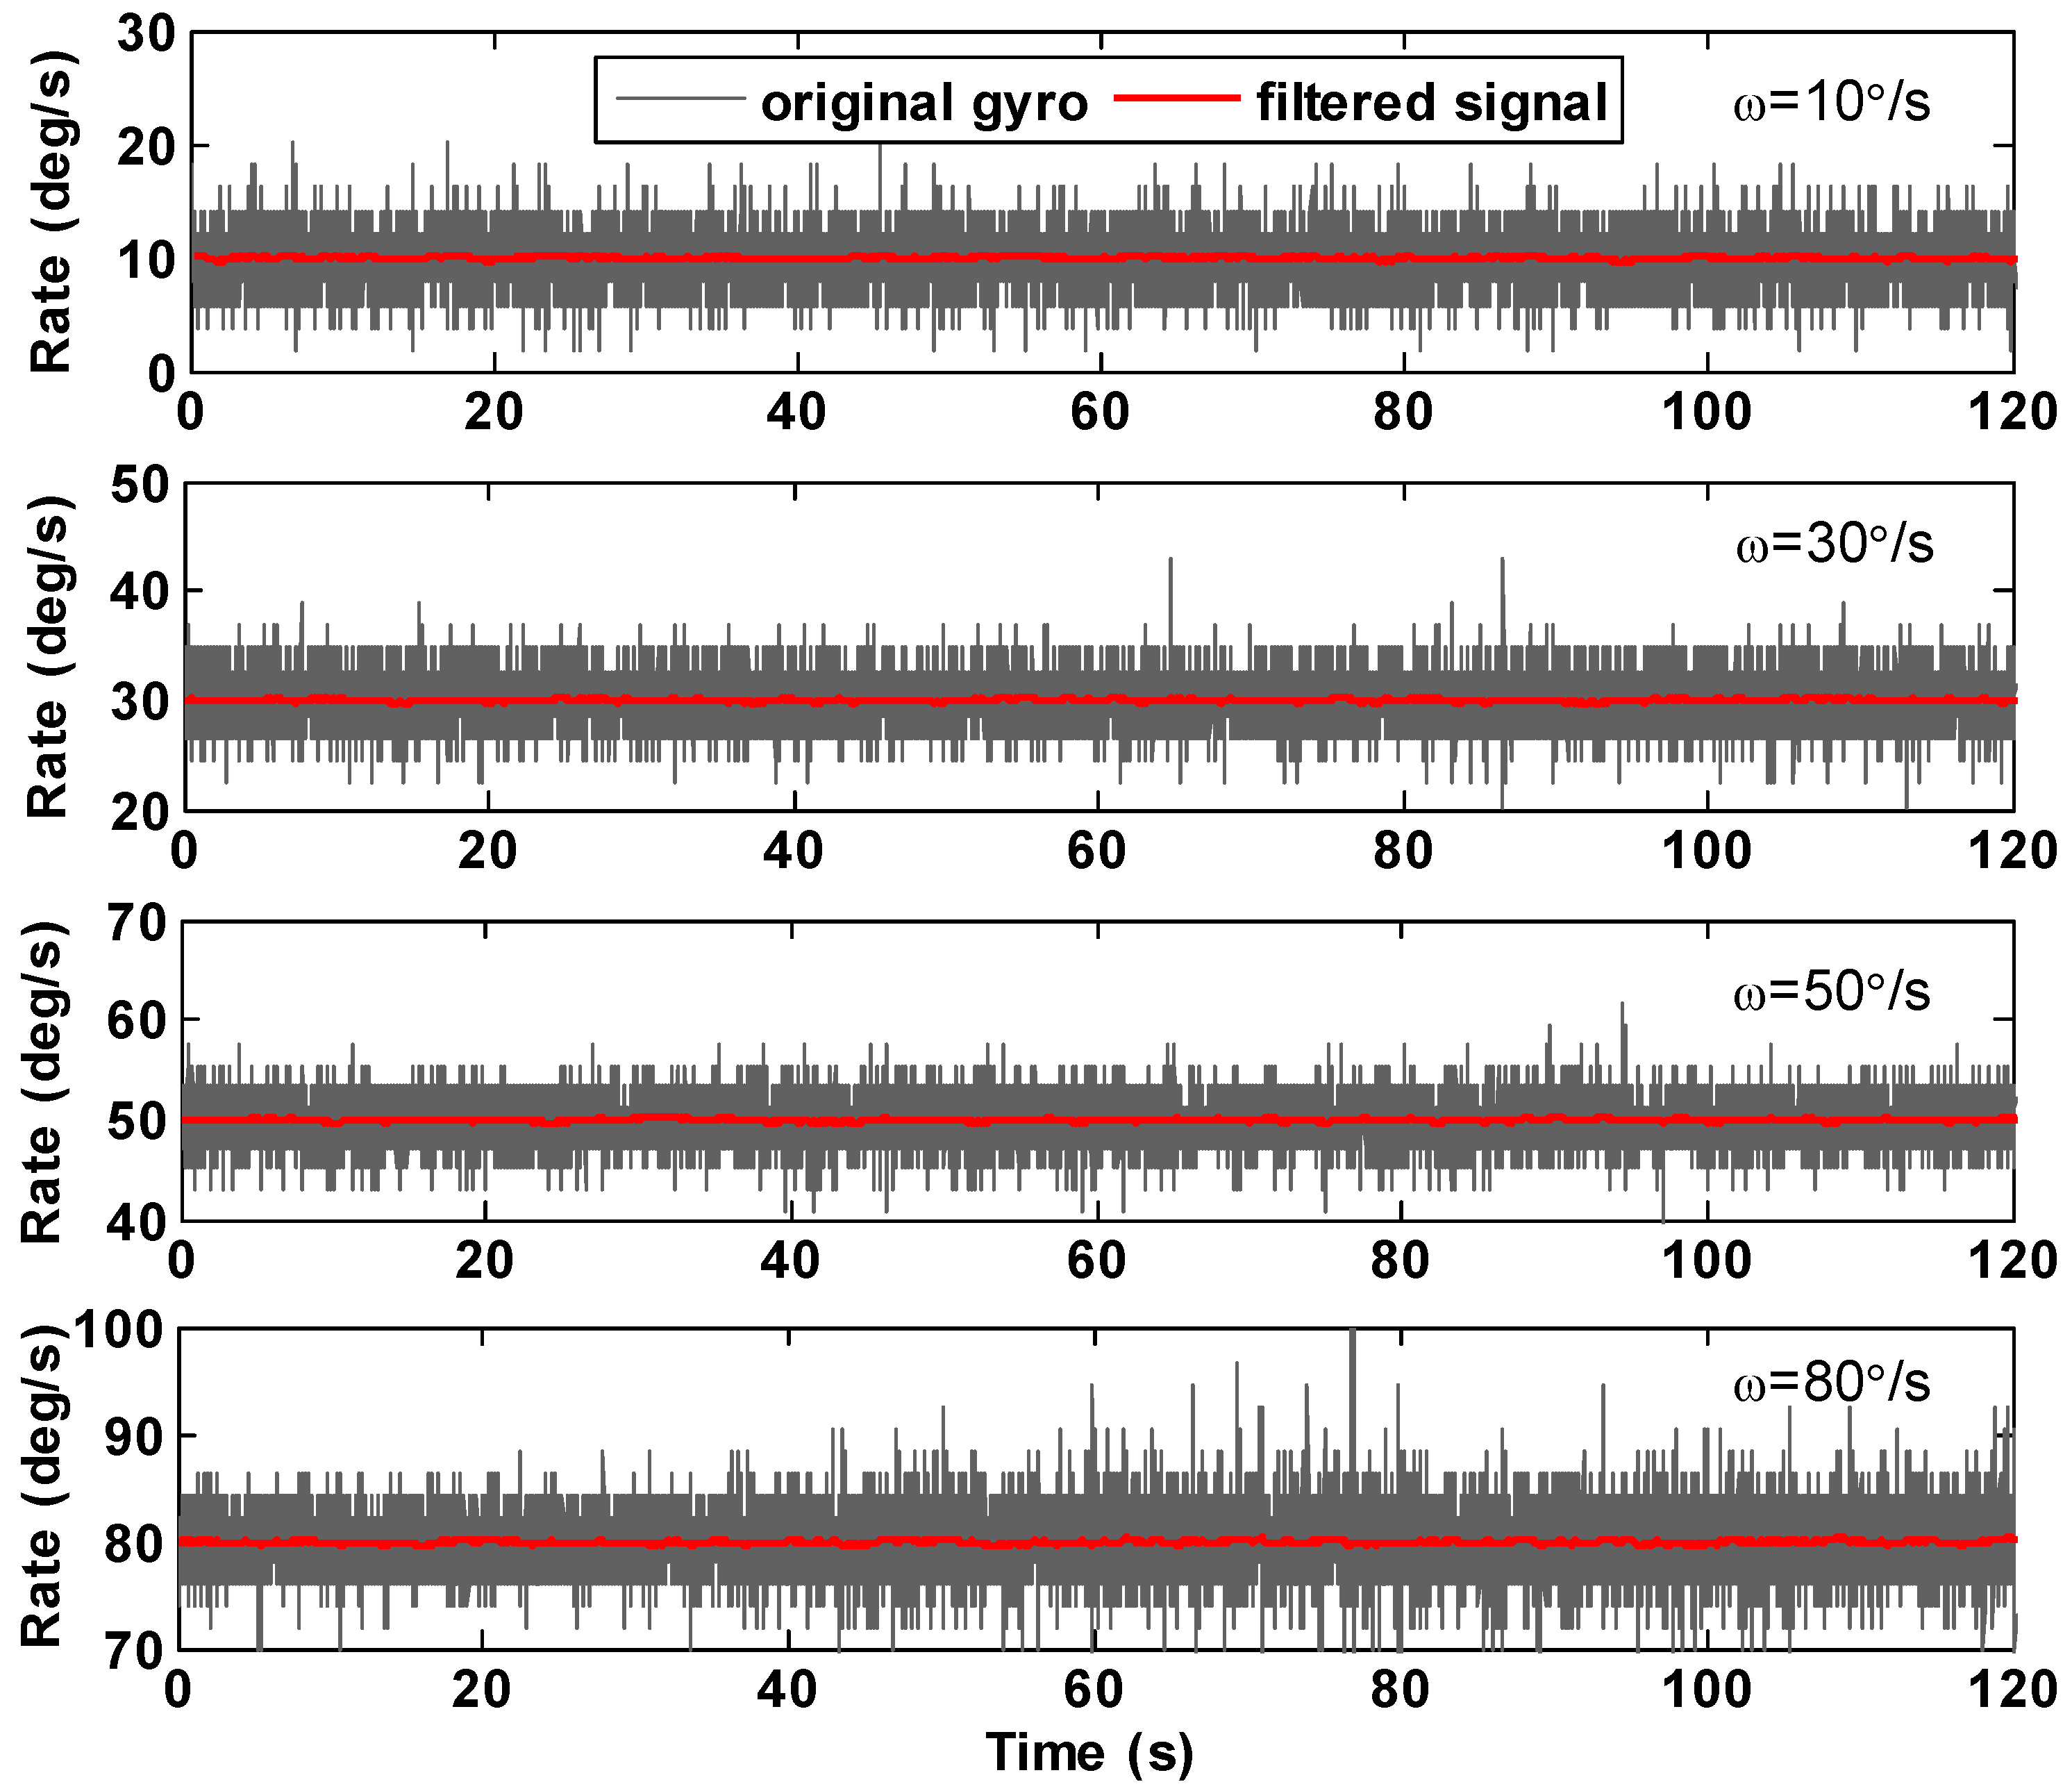
Four different constant input rates of ω = 10, 30, 50, and 80°/s were given to test the presented KF algorithm on a turntable. The comparison of gyroscope original rate signal and filtered rate signal is shown in Figure 7. The results are illustrated in Table 3, here the bandwidth of KF is set as 10 Hz.
Figure 7 indicates that the noise is remarkably reduced by the presented KF. The reason is that the dynamic characteristics of input rate signals are very small due to the constant rate testing, which well fit the KF mathematical model. As a result, the estimated rate signals with a higher accuracy can be obtained after KF filtering. From Table 3, it indicates that the 1σ error is reduced by a factor of about 18 compared to the original rate signal, which demonstrate a considerable noise reduction for the gyroscope.
Figure 7. Test results of KF with different constant input rates.
Micromachines 06 00266 g007
Table 3. Test results of constant input rate before and after KF filtering.
Rate (°/s)Mean of Estimated Error (°/s)STD of Estimated Error (°/s)
Original GyroAfter FilteringOriginal GyroAfter Filtering
100.0413−0.04211.93780.1120
300.0197−0.02092.01950.1075
500.0582−0.06071.97510.1069
800.0776−0.08122.61890.1407

4.3. Swing Rate Test Result

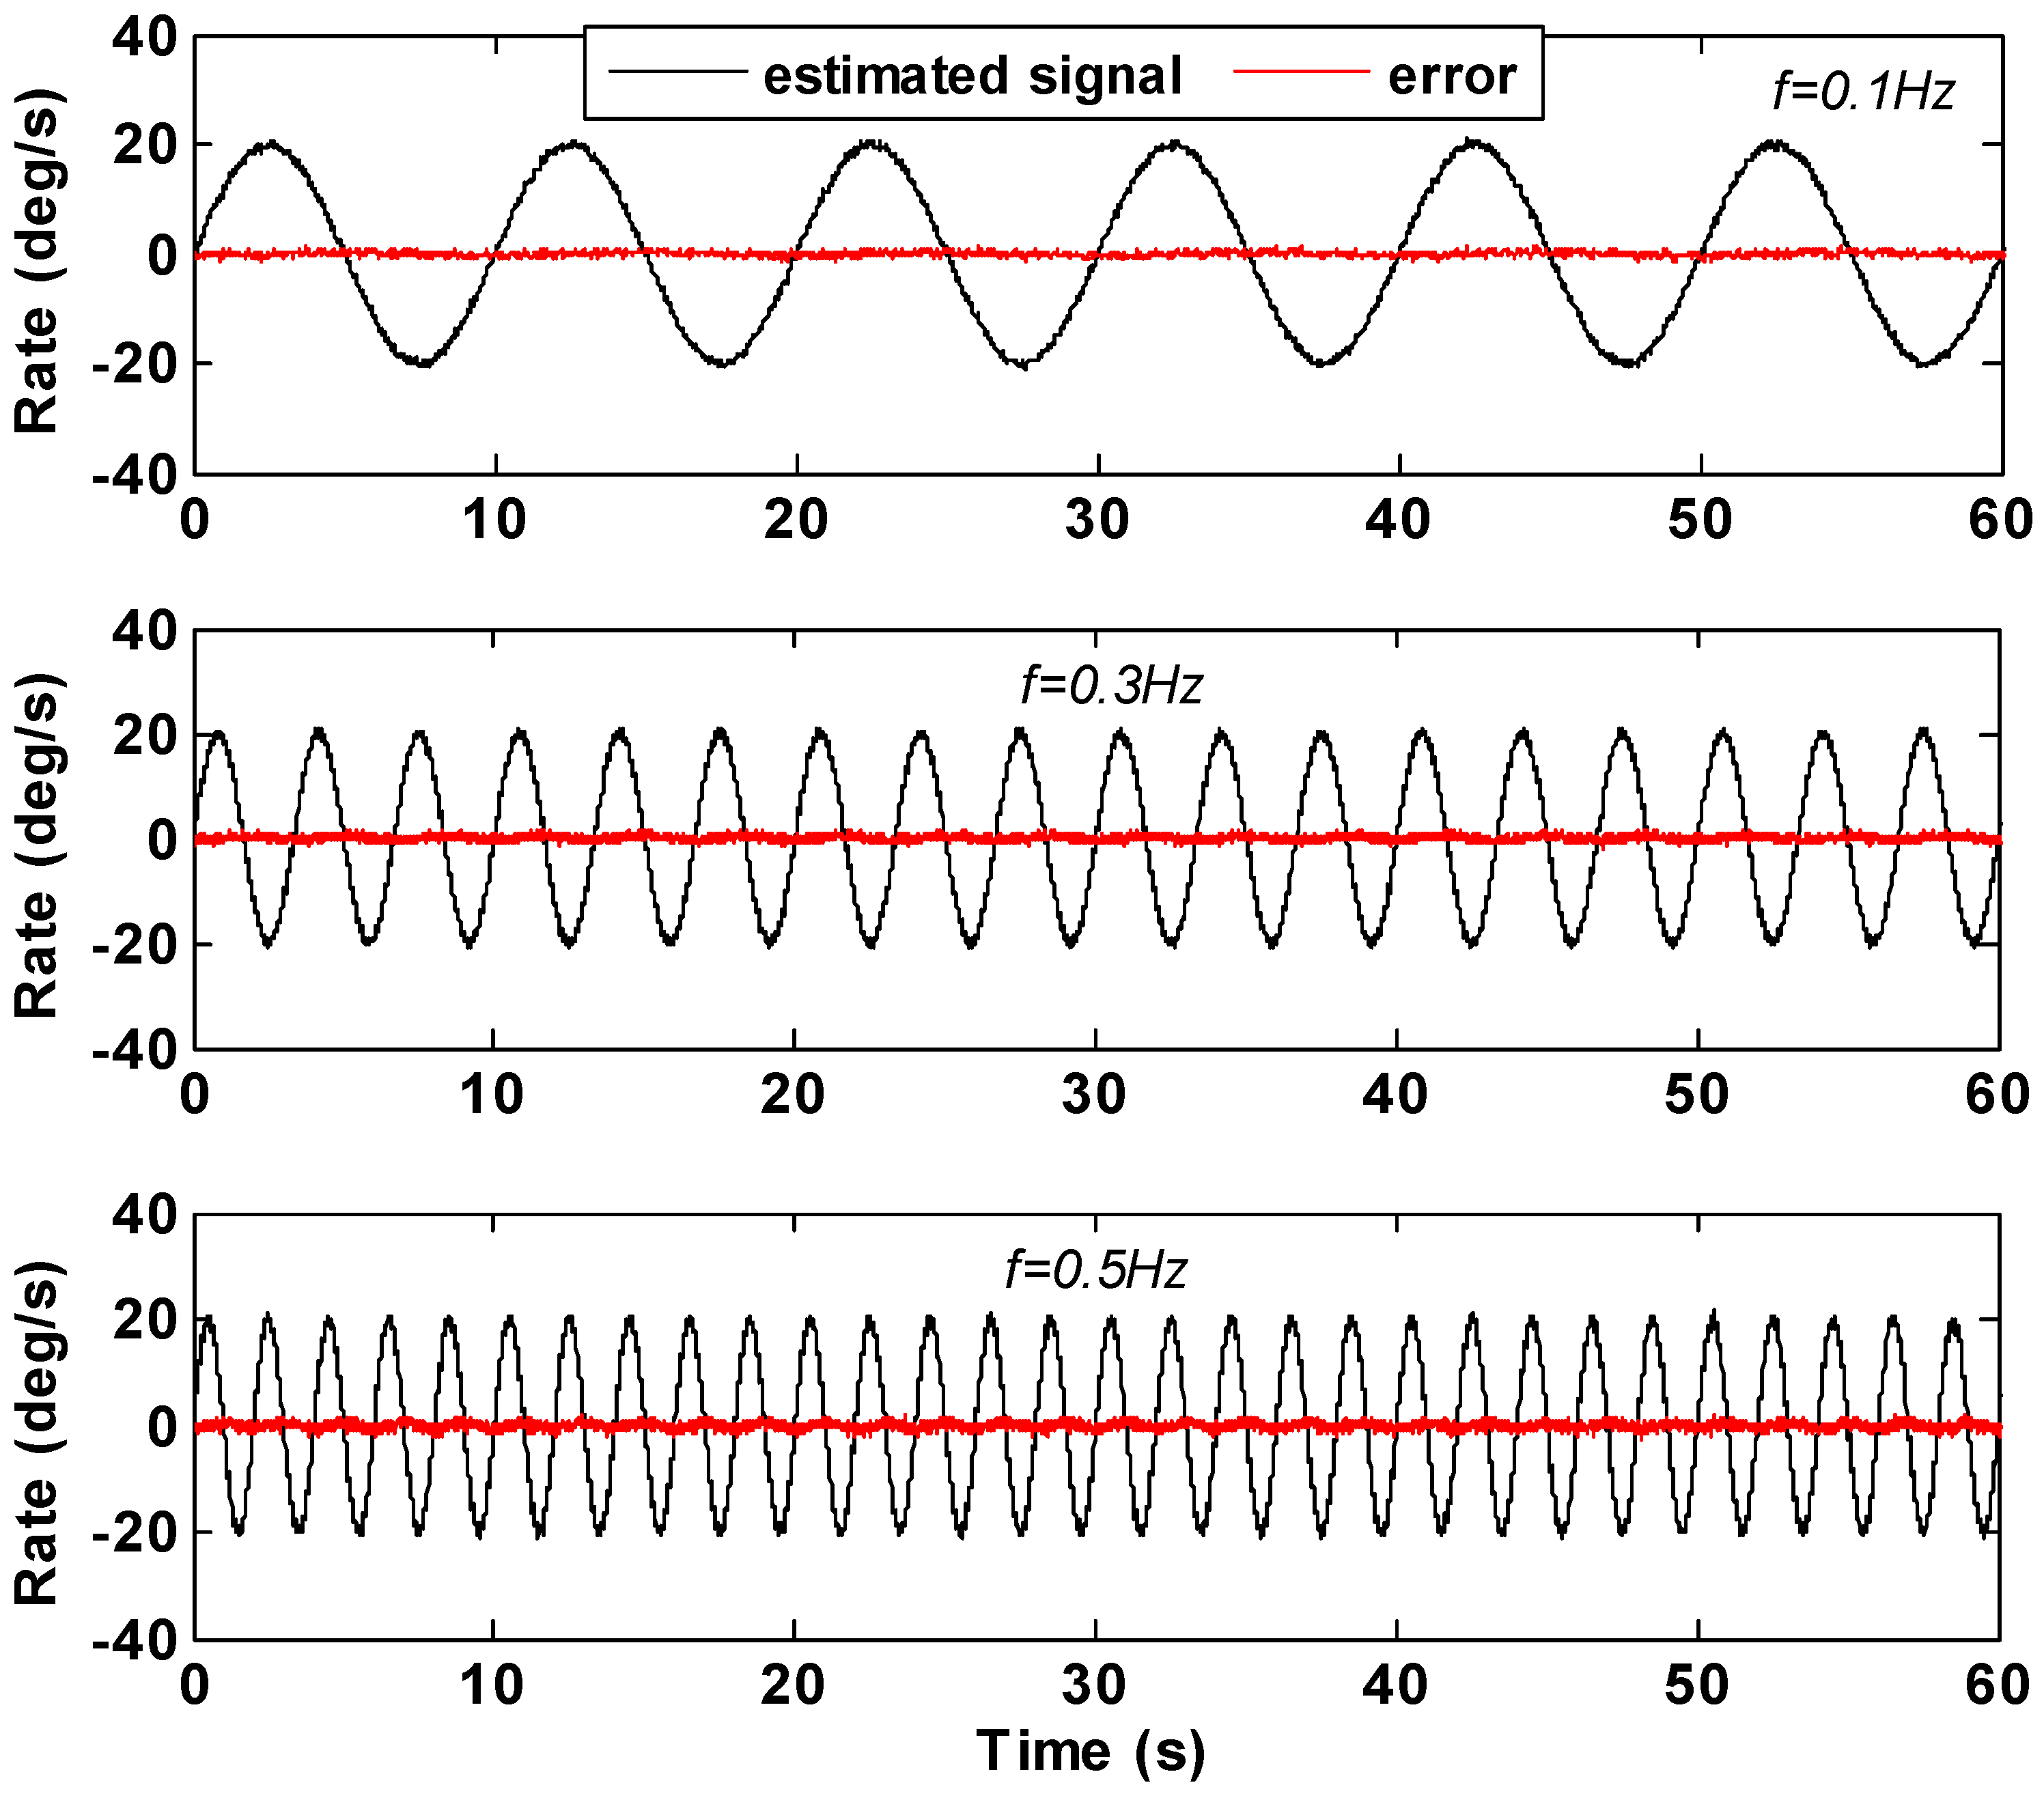
The input rate signal was set as ω = 20 × sin(2πft + φ0)°/s with three different frequencies f = 0.1, 0.3 and 0.5 Hz, and initial phase φ0 = 0. The estimated rate signal and errors by KF filtering are shown in Figure 8. The detailed results are illustrated in Table 4, where the KF bandwidth was set as about 20 Hz.
Figure 8 shows that the gyroscope rate signal after KF filtering could accurately reflect the dynamic characteristic of the input signal. Furthermore, the results in Table 4 show that the amplitude of estimated rate signal nearly reaches to about 20.1°/s of being in accordance with the experimental settings without larger attenuation. Here the terminology “attenuation” means that the amplitude of the filtered rate signal obtained by the KF is smaller than that of the original input rate signal in the dynamic test. From Table 4, it can be seen that the 1σ errors are obviously reduced compared to the gyroscope original rate signal. Additionally, it indicates an increase of 1σ estimated errors with increasing frequencies f, i.e., the 1σ error reduction factor with respect to frequency of 0.1 Hz is about 4.3, whereas the corresponding factor for the frequency of 0.5 Hz is about 2.5, which is lower than that of the 0.1 Hz. This is because the dynamic characteristics of input rate signals increase with increasing frequency f, resulting in a larger model error for KF.
Figure 8. Swing rate test results of KF for frequency f = 0.1, 0.3 and 0.5 Hz.
Micromachines 06 00266 g008
Table 4. Swing test results of gyroscope before and after KF filtering.
Frequency f (Hz)Amplitude (°/s)STD Error (°/s)
Original GyroAfter FilteringOriginal GyroAfter Filtering
0.122.448120.09731.67490.3836
0.322.676020.19261.62420.5510
0.523.110420.78061.72340.6866

5. Conclusions

In this paper, a KF approach was presented to process the outputs of MEMS gyroscope to reduce noise and bias drift. The important and greatest feature is the direct modeling for true angular rate to obtain an optimal estimate, realizing a self-compensation for the single MEMS gyroscope without needing an integrated system and other sensor’s information. The steady-state filter gain resulted in a simplification of KF implementation. The experiments displayed an Allan variance of ARW and bias instability were reduced from 4.87°/h0.5 to 0.4°/h0.5 and 44.41°/h to 4.13°/h by the KF, respectively. The dynamic test results demonstrated that KF can effectively reduce the measurement noise and accurately reflect the dynamic characteristic of the input signal.
In addition, results indicated that the performance of KF in the swing test is lower than that of KF in static and constant rate tests. The reason lies in the modeling of KF and true angular rate: when the dynamic characteristic of input signal is constant or with a small variation, a filtered rate signal with a higher accuracy could be achieved by KF. Otherwise, the true rate signal should be modeled with a larger value of qω to ensure the dynamic characteristic of the input rate signal without attenuation after KF filtering.
From the results of static drift test, we know that the filtered rate signal having an auto-correlation. It needs to be pointed out that this auto-correlation would lead to some difficulties for establishing accurate an error model of the filtered rate signal to design and implement a navigation filter. Therefore, in future work, the approach for modeling error of the filtered rate signal will be investigated deeply.

Acknowledgments

The authors gratefully acknowledge the Chinese University Science Foundation’s financial support (Contract No. 2014QNJJ024). Finally, the authors wish to thank referees for their valuable comments that improved this paper.

Author Contributions

Liang Xue made substantial contributions to conception and design of the signal processing algorithm in this study. Chengyu Jiang performed the experiments. Lixin Wang analyzed the experimental data. Liang Xue together with the Jieyu Liu and Weizheng Yuan wrote the paper.

Conflicts of Interest

The authors declare no conflict of interest.

References

  1. Acar, C.; Shkel, A.M. Nonresonant micromachined gyroscopes with structural mode-decoupling. IEEE Sens. J. 2003, 3, 497–506. [Google Scholar] [CrossRef]
  2. Al-Majed, M.I.; Alsuwaidan, B.N. A new testing platform for attitude determination and control subsystems: Design and applications. In Proceedings of the IEEE/ASME International Conference on Advanced Intelligent Mechatronics, Singapore, 14–17 July 2009; pp. 1318–1323.
  3. Liu, K.; Zhang, W.P.; Chen, W.Y.; Li, K.; Dai, F.Y.; Cui, F.; Wu, X.S.; Ma, G.Y.; Xiao, Q.J. The development of micro-gyroscope technology. J. Micromech. Microeng. 2009, 19, 157–185. [Google Scholar]
  4. Prikhodko, I.P.; Trusov, A.A.; Shkel, A.M. North-finding with 0.004 radian precision using a silicon MEMS quadruple mass gyroscope with Q-factor of 1 million. In Proceedings of the IEEE 25th International Conference on Micro Electro Mechanical Systems, Paris, France, 29 January–2 February 2012; pp. 164–167.
  5. Nitzan, S.; Ahn, C.H.; Su, T.-H.; Li, M.; Ng, E.J.; Wang, S.; Yang, Z.M.; O’Brien, G.; Boser, B.E.; Kenny, T.W.; et al. Epitaxially-encapsulated polysilicon disk resonator gyroscope. In Proceedings of the IEEE 26th International Conference on Micro Electro Mechanical Systems, Taipei, Taiwan, 20–24 January 2013; pp. 625–628.
  6. Sahin, E.; Alper, S.E.; Akin, T. Experimental evaluation of alternative drive-mode control electronics developed for high-performance MEMS gyroscopes. In Proceedings of the 16th International Solid-State Sensors, Actuators and Microsystems Conference, Beijing, China, 5–9 June 2011; pp. 2817–2820.
  7. Ezekwe, C.D.; Boser, B.E. A mode-matching ΔΣ closed-loop vibratory gyroscope readout interface with a 0.004°/s/Hz noise floor over a 50 Hz band. IEEE J. Solid-State Circuits 2008, 43, 3039–3048. [Google Scholar] [CrossRef]
  8. Chen, X.Y. Modeling random gyro drift by time series neural networks and by traditional method. In Proceedings of the IEEE conference on Neural Networks and Signal Processing, Nanjing, China, 14–17 December 2003; pp. 810–813.
  9. Zhang, Y.S.; Wang, Y.Y.; Yang, T.; Yin, R.; Fang, J.C. Dynamic angular velocity modeling and error compensation of one-fiber fiber optic gyroscope (OFFOG) in the whole temperature range. Meas. Sci. Technol. 2012, 23, 1–6. [Google Scholar]
  10. Sharaf, R.; Noureldin, A.; Osman, A.; El-Sheimy, N. Online INS/GPS integration with a radial basis function neural network. IEEE Aerosp. Electron. Syst. Mag. 2004, 20, 8–14. [Google Scholar] [CrossRef]
  11. Mao, B.; Wu, J.W.; Wu, J.T.; Zhou, X.M. MEMS gyro denoising based on second generation wavelet transform. In Proceedings of the First International Conference on Pervasive Computing Signal Processing and Applications (PCSPA), Harbin, China, 17–19 September 2010; pp. 255–258.
  12. Bekkeng, J.K. Calibration of a novel MEMS inertial reference unit. IEEE Trans. Instrum. Meas. 2009, 58, 1967–1974. [Google Scholar] [CrossRef]
  13. Jamshaid, A.; Muhammad, U. A consistent and robust Kalman filter design for in-motion alignment of inertial navigation system. Measurement 2009, 42, 577–582. [Google Scholar] [CrossRef]
  14. Bayard, D.S.; Ploen, S.R. High Accuracy Inertial Sensors from Inexpensive Components. U.S. Patent US20030187623A1, 2 October 2003. [Google Scholar]
  15. Chang, H.L.; Xue, L.; Jiang, C.Y.; Kraft, M.; Yuan, W.Z. Combining numerous uncorrelated MEMS gyroscopes for accuracy improvement based on an optimal Kalman filter. IEEE Trans. Instrum. Meas. 2012, 61, 3084–3093. [Google Scholar] [CrossRef]
  16. Xue, L.; Jiang, C.Y.; Chang, H.L.; Yang, Y.; Qin, W.; Yuan, W.Z. A novel Kalman filter for combining outputs of MEMS gyroscope array. Measurement 2012, 45, 745–754. [Google Scholar] [CrossRef]
  17. Lam, Q.M.; Crassidis, J.L. Precision attitude determination using a multiple model adaptive estimation scheme. In Proceedings of the IEEE Aerospace Conference, Big Sky, MT, USA, 3–10 March 2007; pp. 1–20.
  18. Stearns, H.; Tomizuka, M. Multiple model adaptive estimation of satellite attitude using MEMS gyros. In Proceedings of the American Control Conference, San Francisco, CA, USA, 29 June–1 July 2011; pp. 3490–3495.
  19. Guerrier, S.; Skaloud, J.; Stebler, Y.; Victoria-Feser, M.-P. Wavelet variance based estimation for composite stochastic processes. J. Am. Stat. Assoc. 2013, 108, 1021–1030. [Google Scholar] [CrossRef] [PubMed]
  20. Vaccaro, R.J.; Zaki, A.S. Statistical modeling of rate gyros. IEEE Trans. Instrum. Meas. 2012, 61, 673–684. [Google Scholar] [CrossRef]
  21. El-Sheimy, N.; Hou, H.; Niu, X. Analysis and modeling of inertial sensors using Allan variance. IEEE Trans. Instrum. Meas. 2008, 57, 140–149. [Google Scholar] [CrossRef]
  22. Grewal, M.S.; Andrews, A.P. Kalman Filtering Theory and Practice Using Matlab, 2nd ed.; John Wiley & Sons: New York, NY, USA, 2001; pp. 119–121. [Google Scholar]
  23. Analog Devices, ADXRS300. Available online: http://www.analog.com/static/imported-files/data_sheets/ADXRS300.pdf (accessed on 4 November 2014).