
Automated Antithrombin Activity Detection with Whole Capillary Blood Based on Digital Microfluidic Platform

 ,
,
Abstract
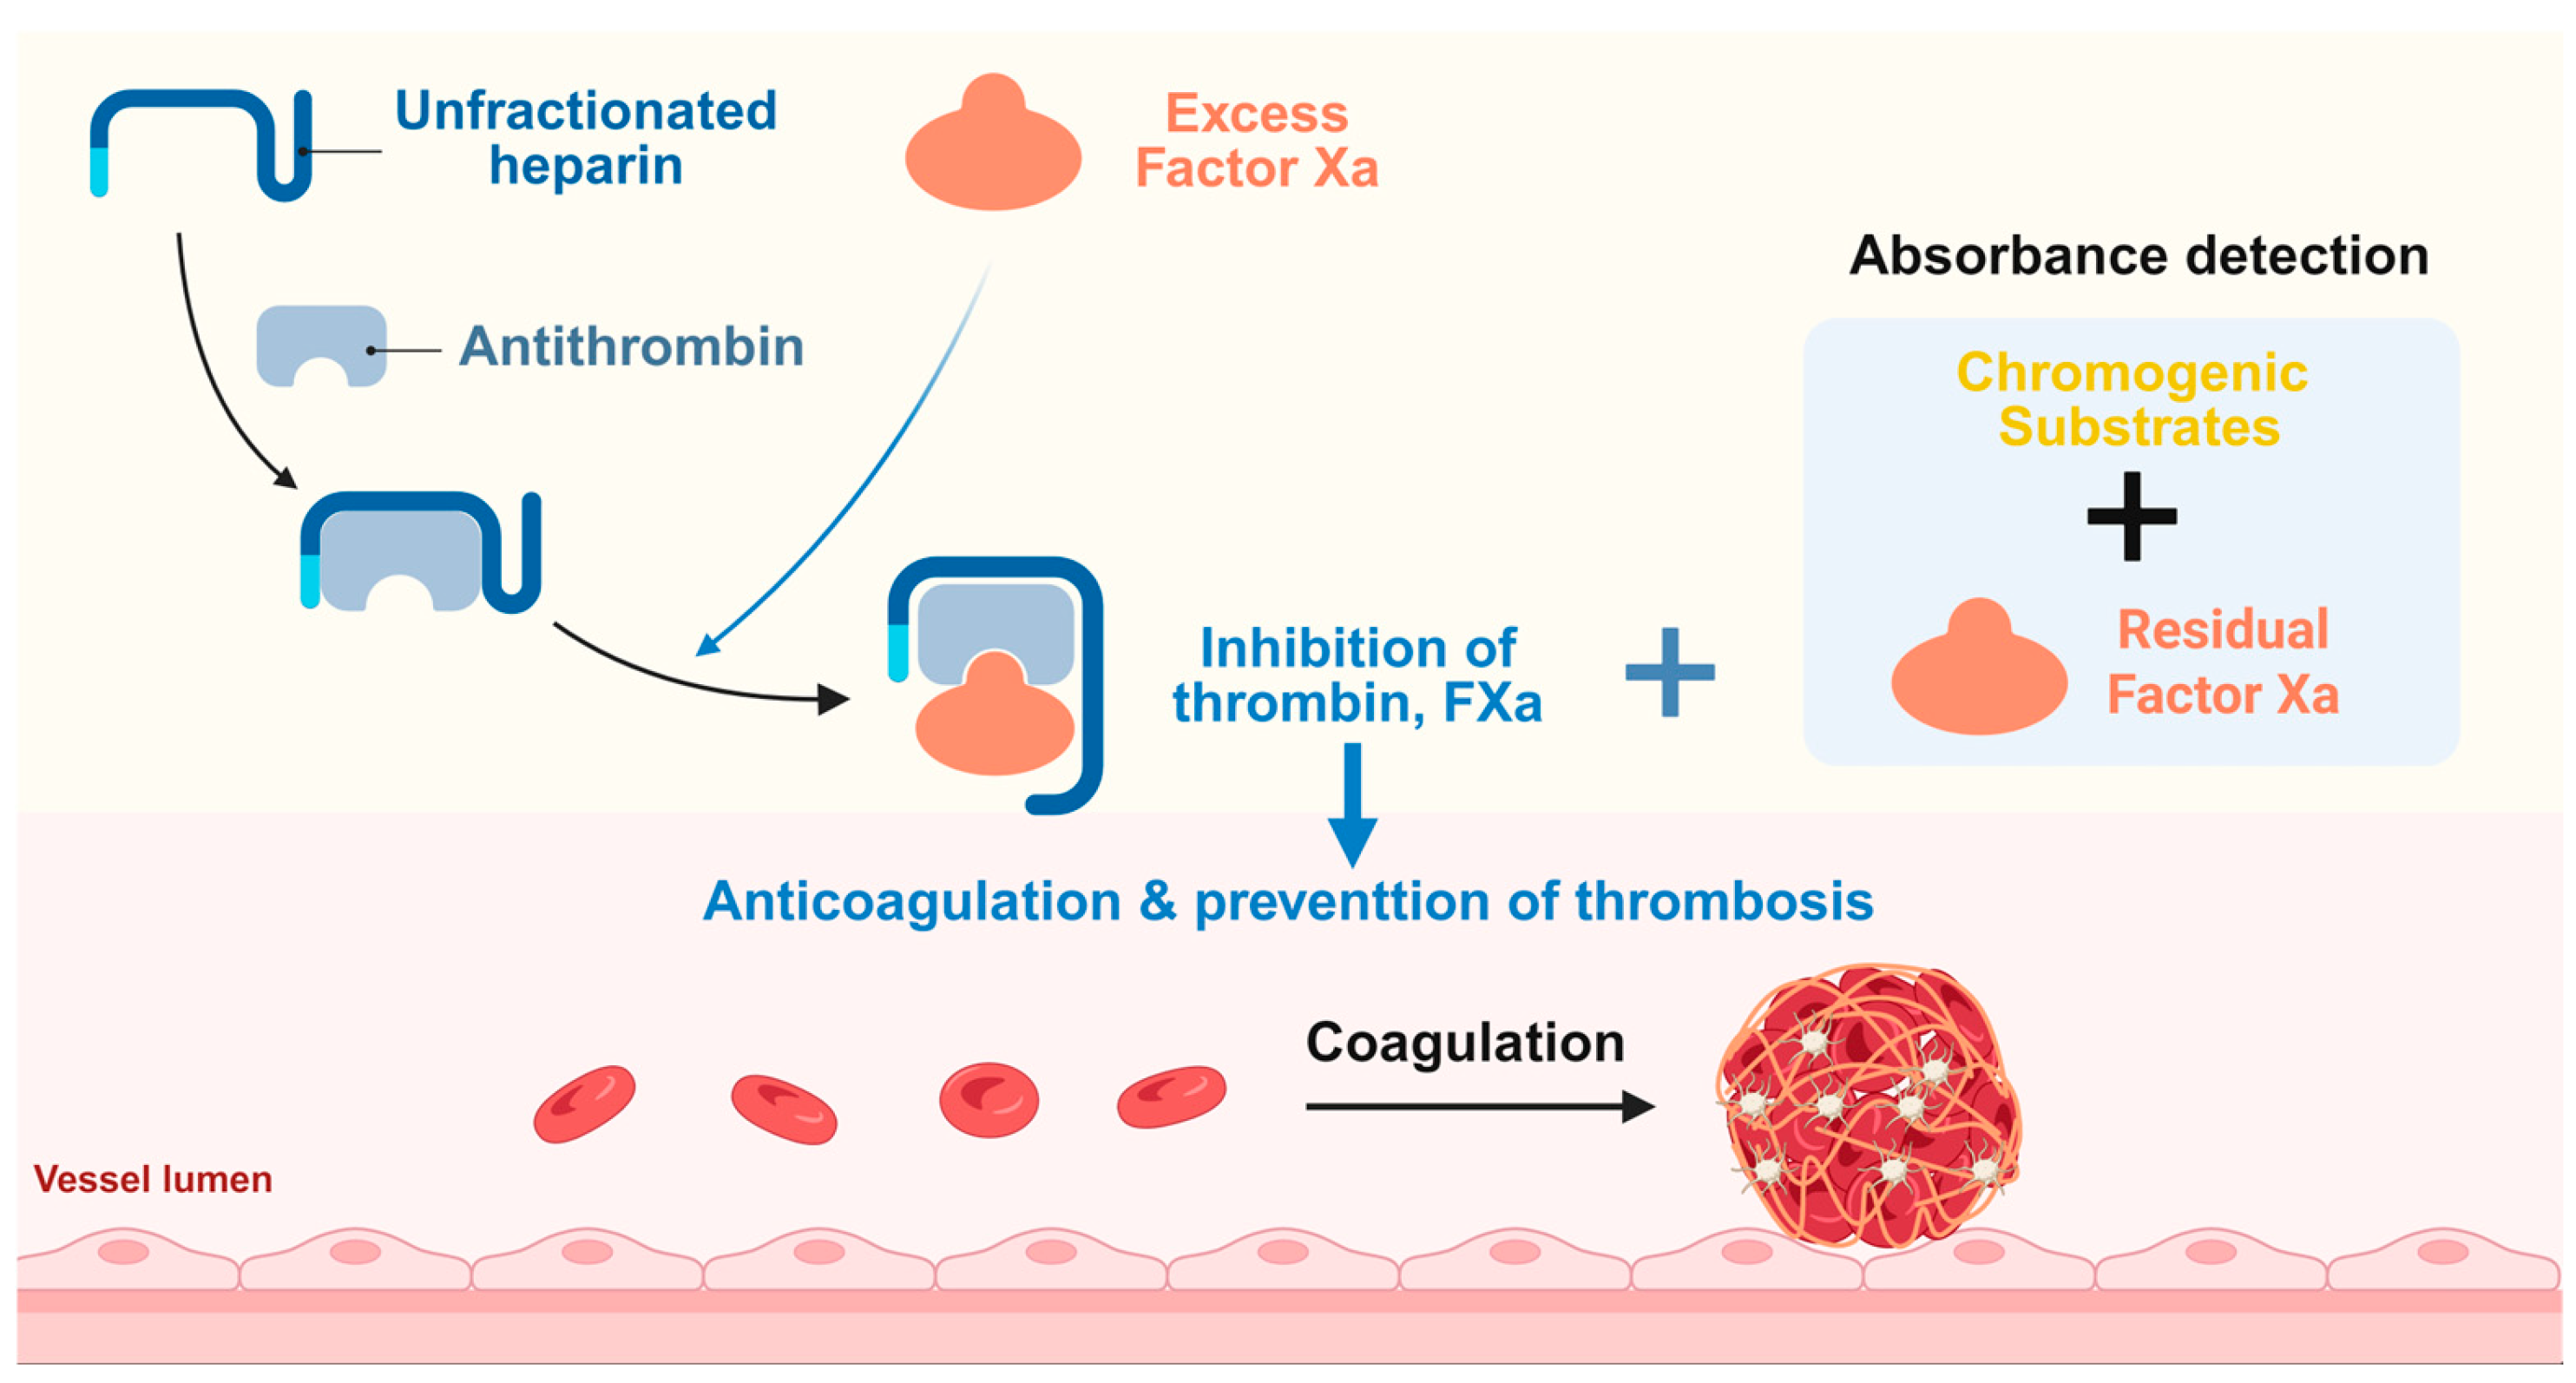
1. Introduction
2. Materials and Methods
2.1. Reagents and Sample Collection
2.2. Fabrication of Microfluidic Chips
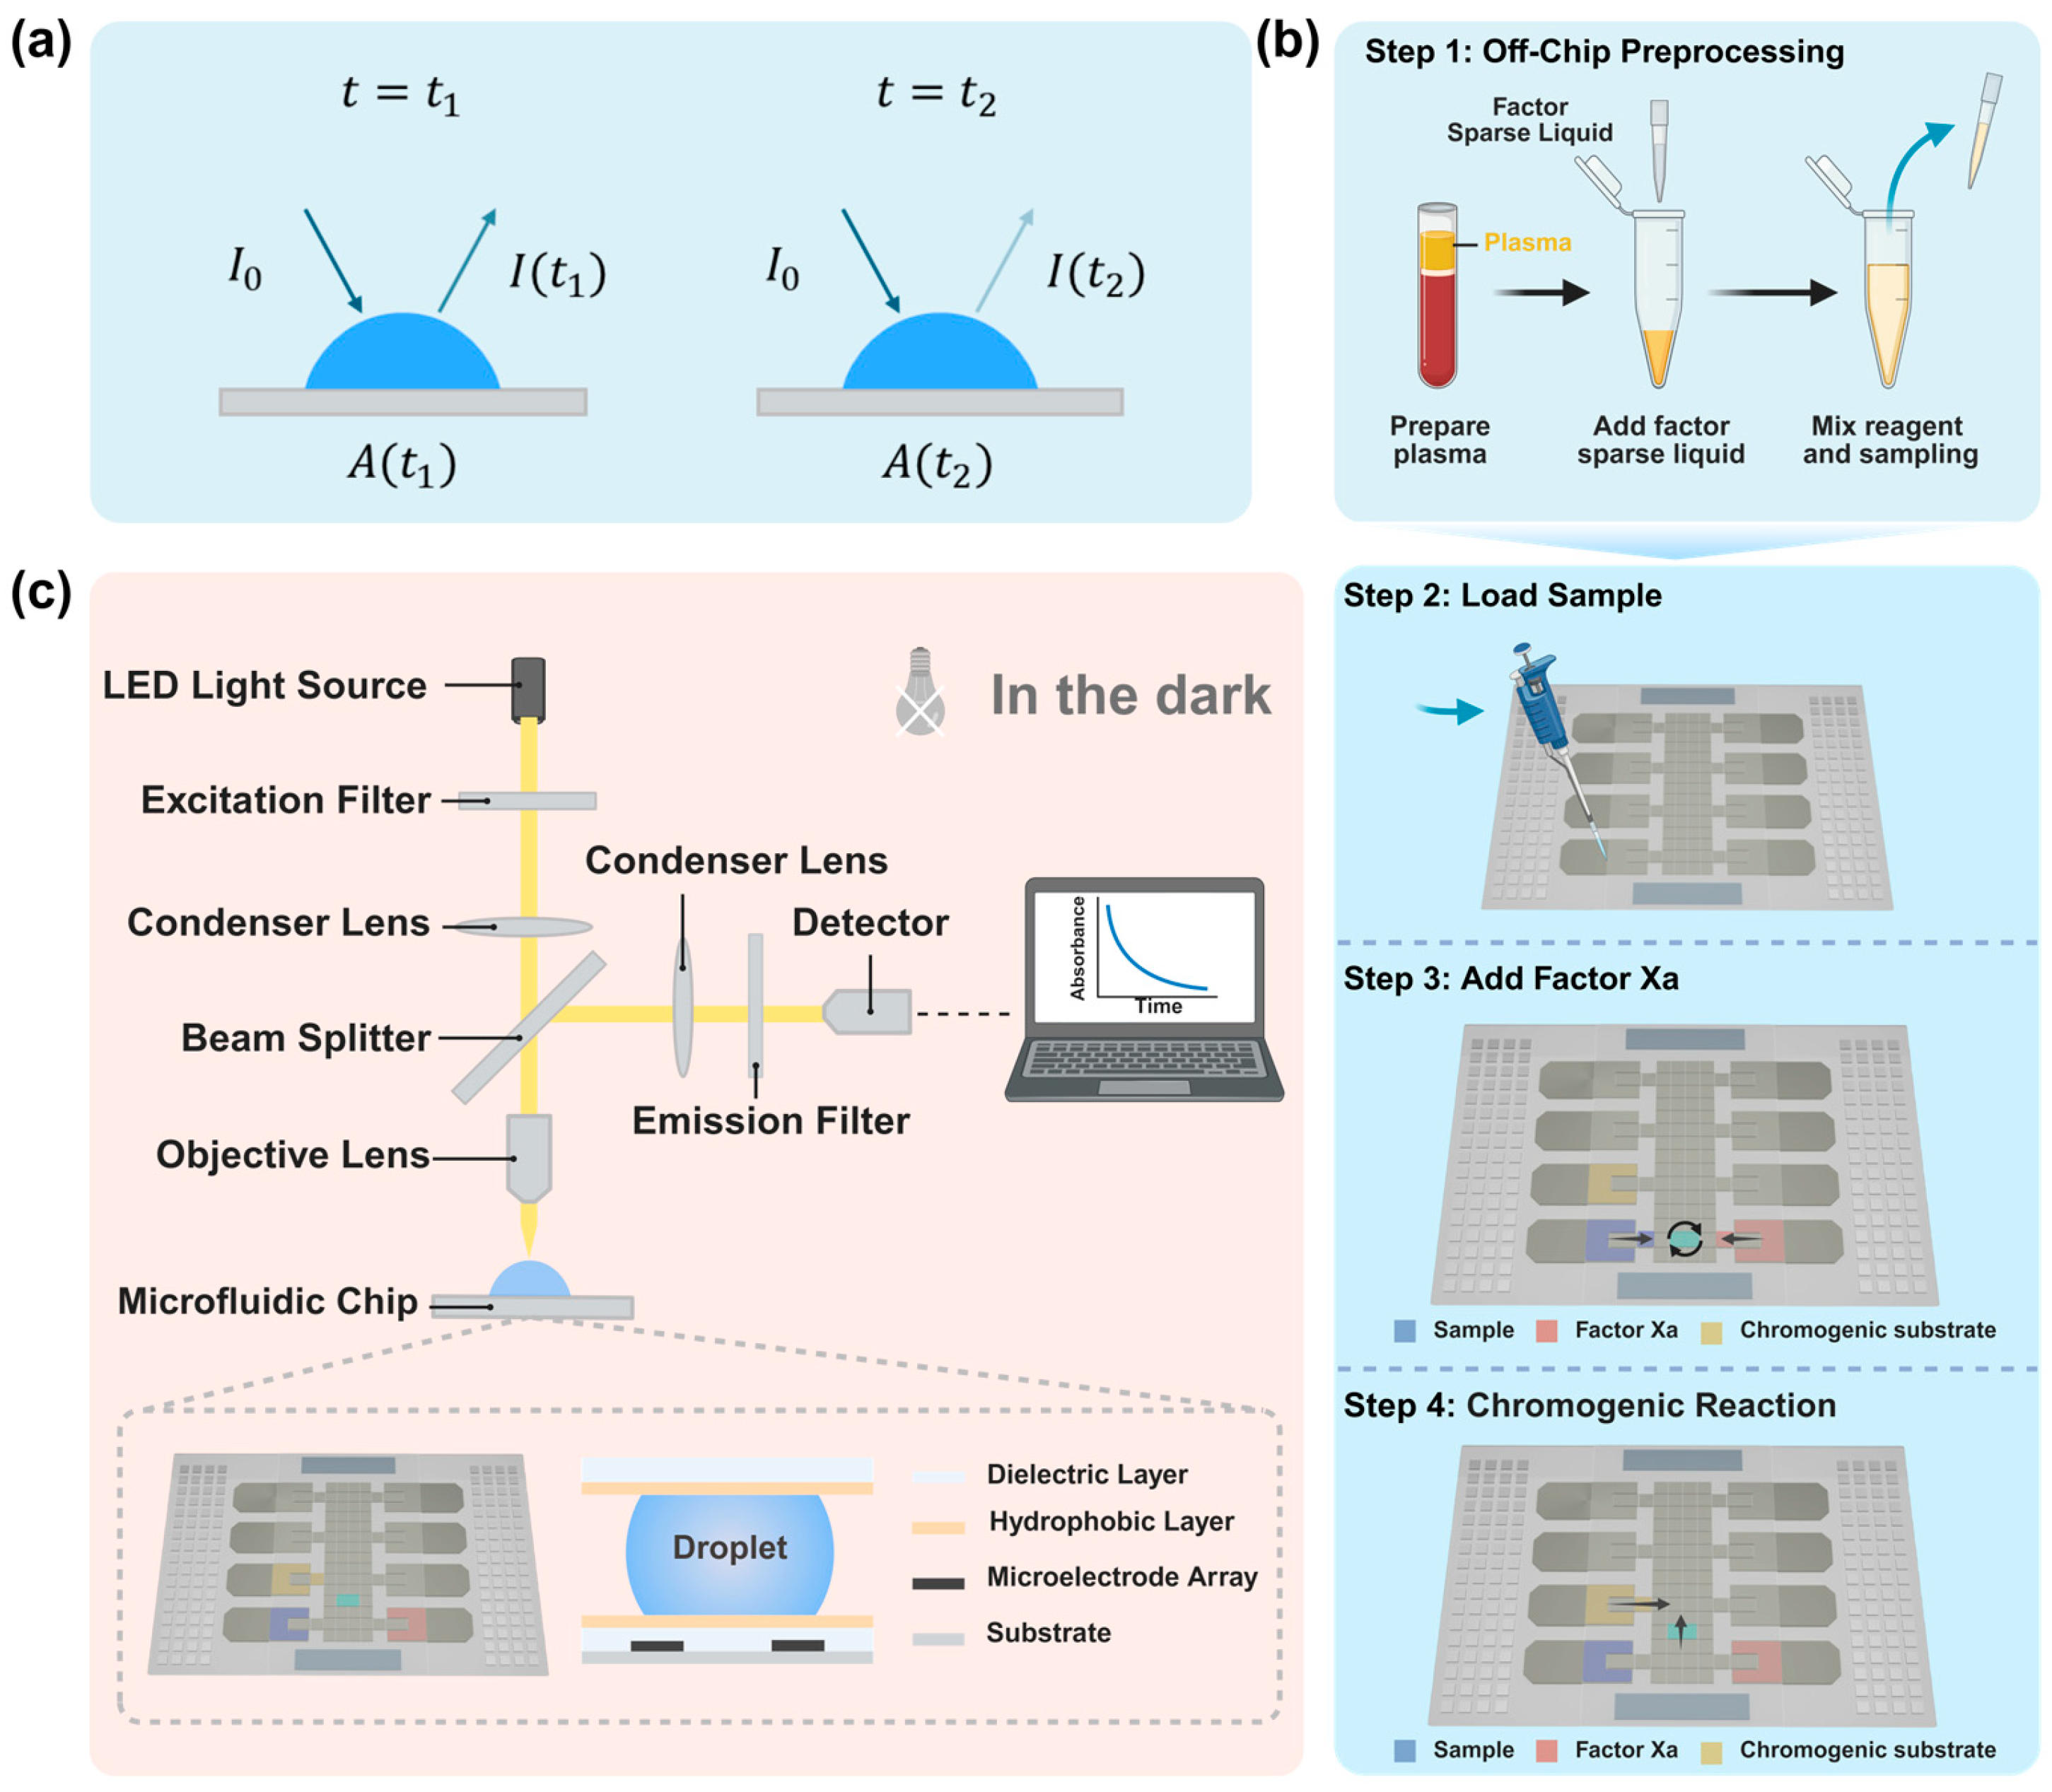
2.3. Optical Absorbance Detection Principle and Procedure
2.4. Optical Detection System
3. Results
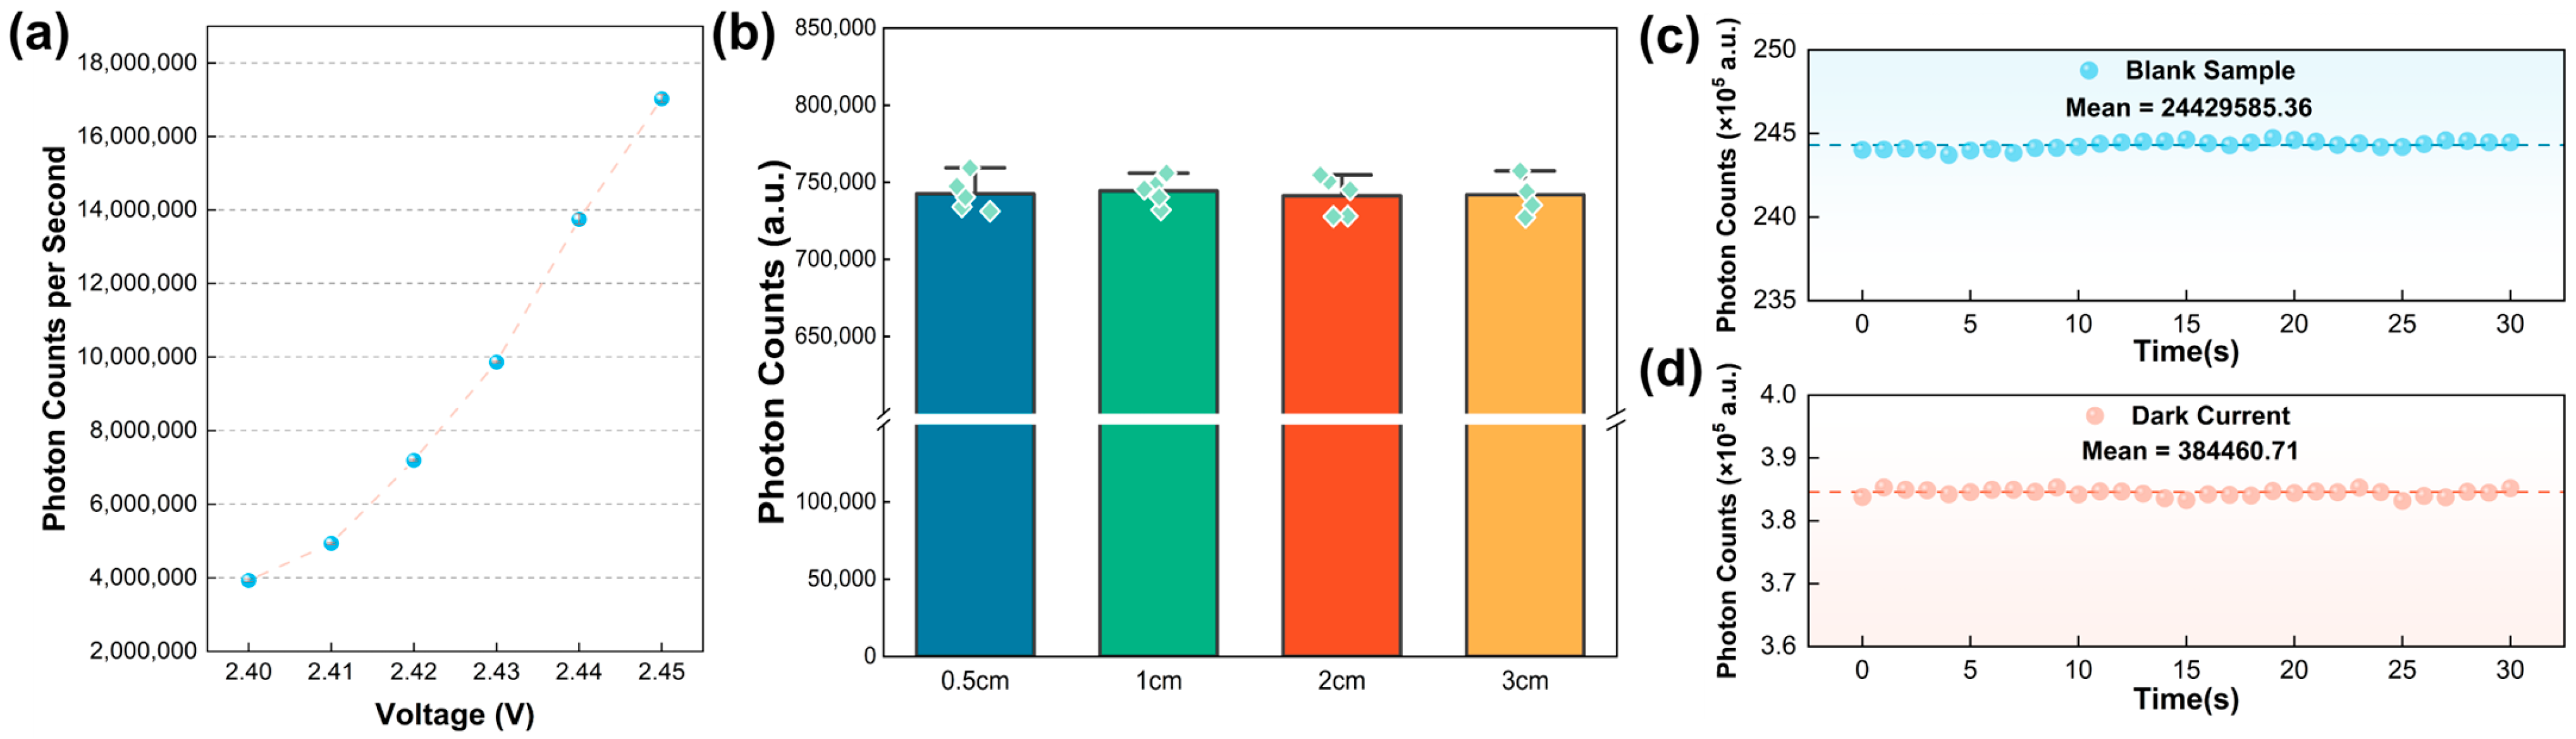
3.1. Optimization of Light Source Voltage and Calibration of Optical Detection Distance
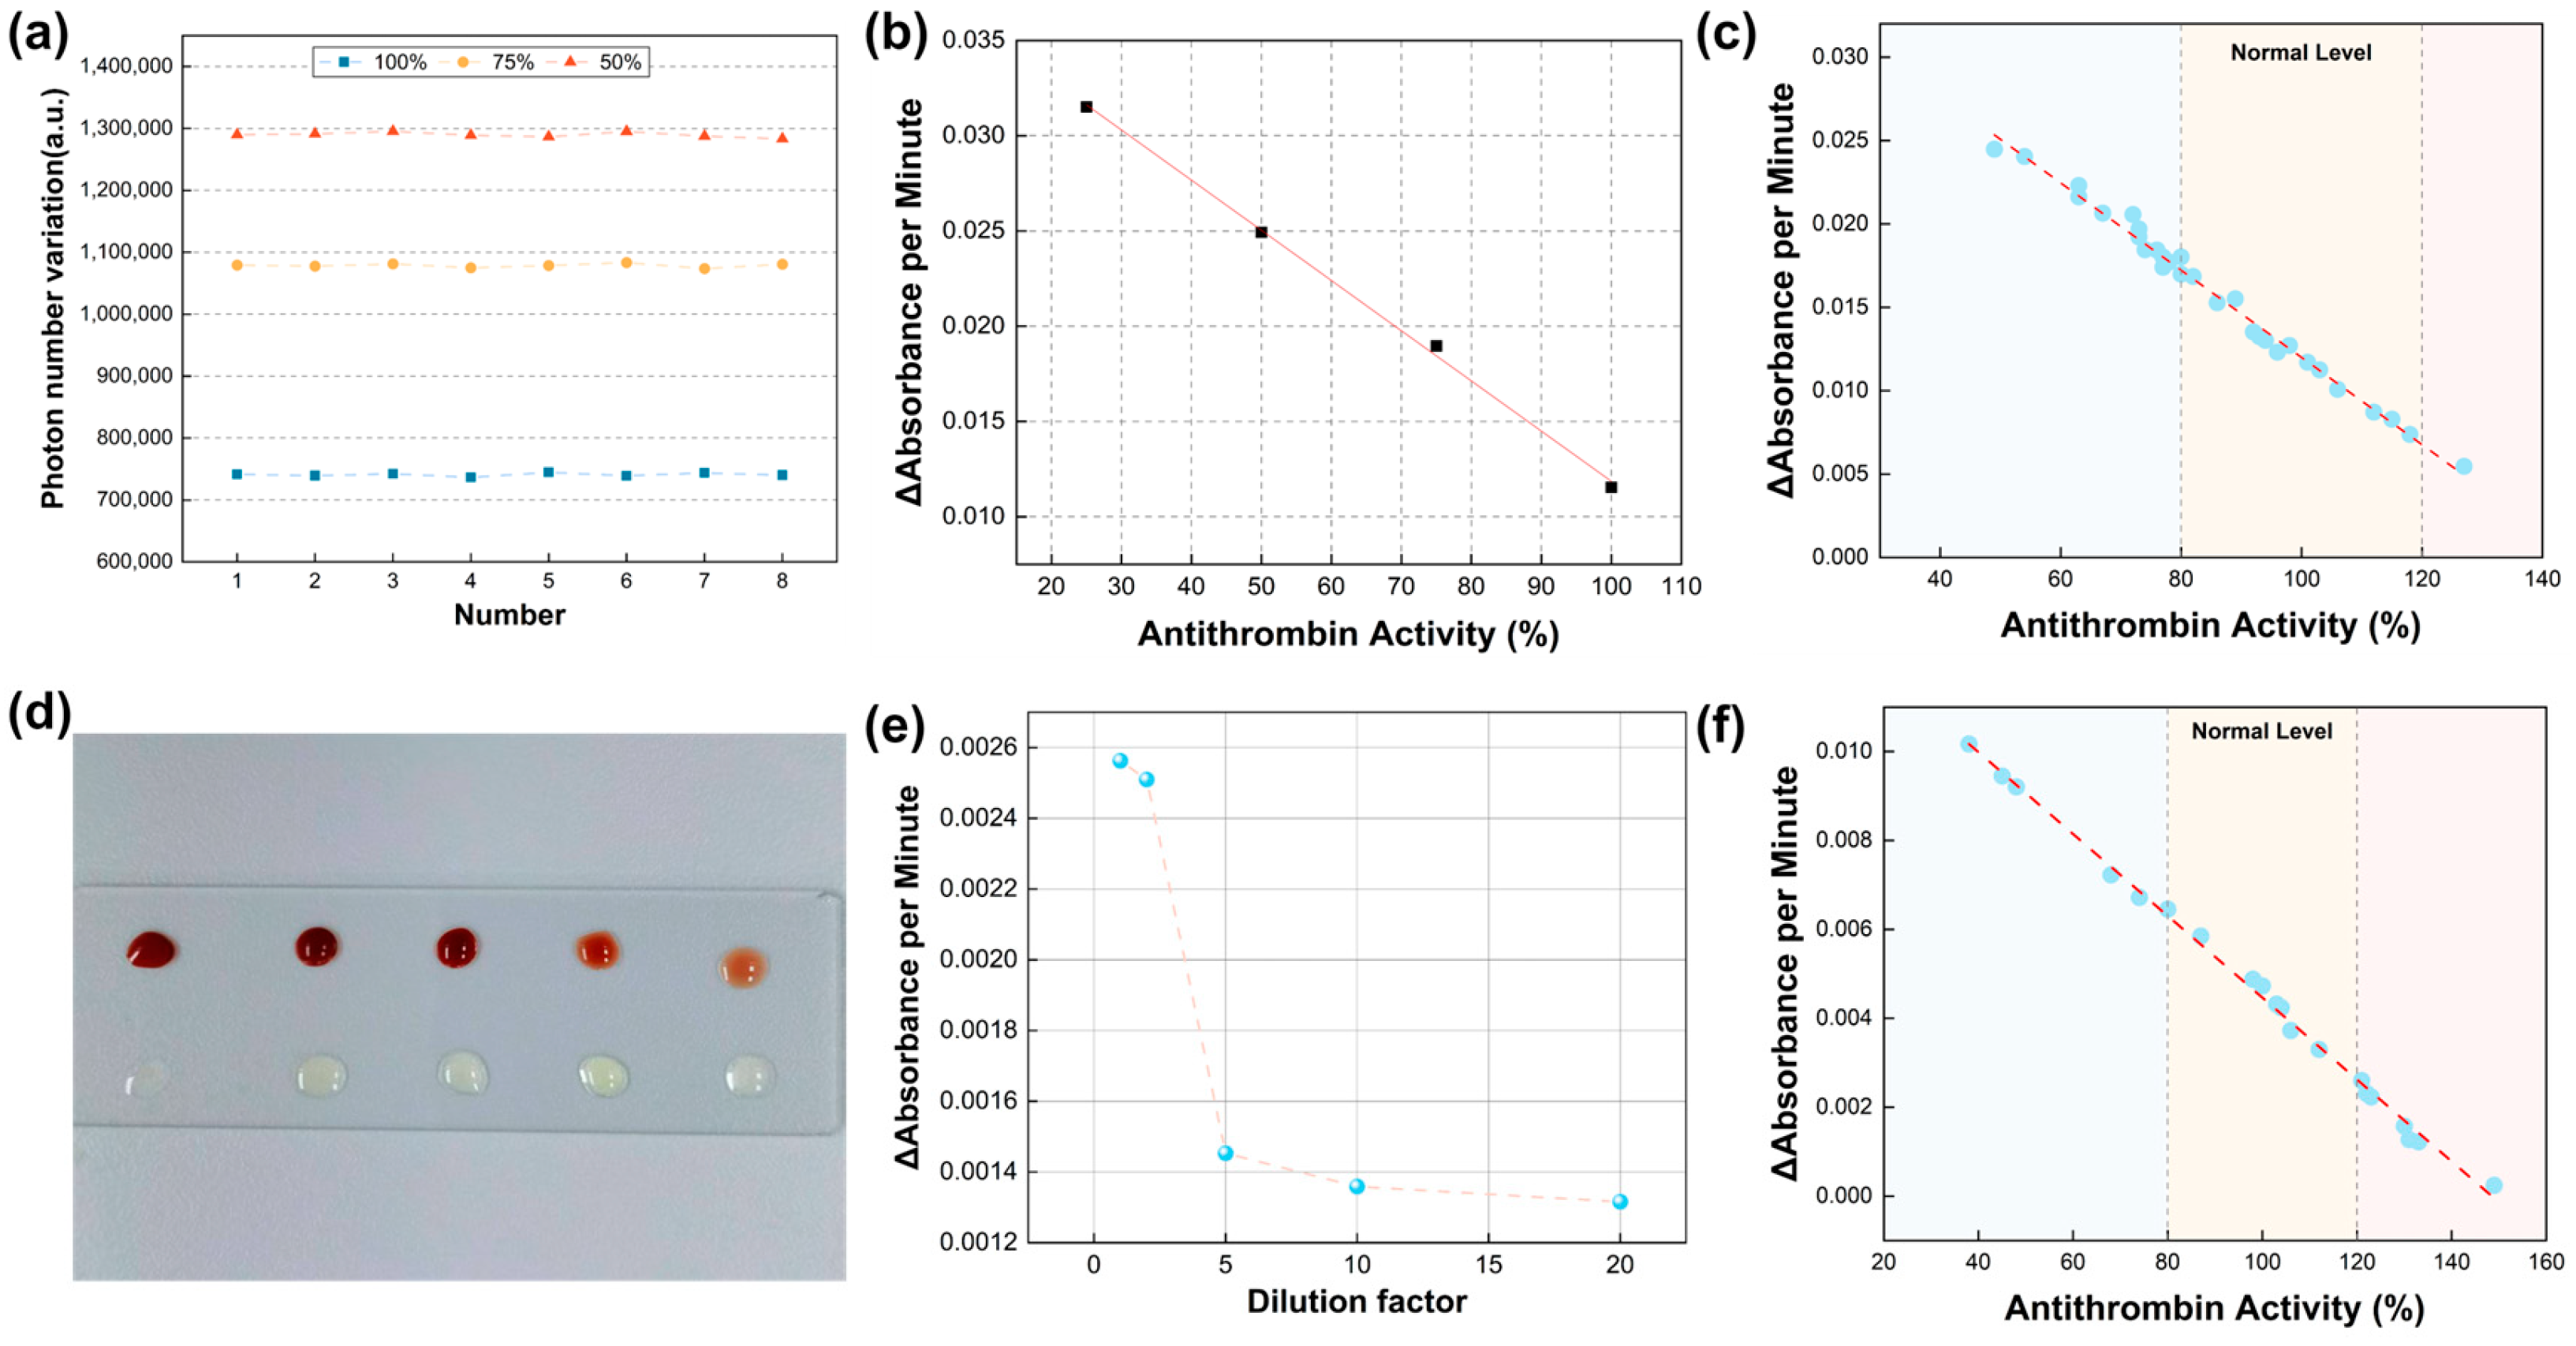
3.2. Verification of Detection Accuracy and Method Feasibility
3.3. Linear Relationships and Clinical Consistency
3.4. Validation of the Capability of Micro-Volume Venous Whole Blood Analysis
3.5. Further Validation of AT Detection in Fingertip Capillary Blood by the Microfluidic System
3.6. Further Validation of AT Detection in Special Specimens by the Microfluidic System
4. Discussion
Supplementary Materials
Author Contributions
Funding
Data Availability Statement
Acknowledgments
Conflicts of Interest
References
- Ehrhardt, J.D., Jr.; Boneva, D.; McKenney, M.; Elkbuli, A. AT deficiency in trauma and surgical critical care. J. Surg. Res. 2020, 256, 536–542. [Google Scholar] [CrossRef] [PubMed]
- Rodgers, G.M.; Mahajerin, A. AT therapy: Current state and future outlook. Clin. Appl. Thromb./Hemost. 2023, 29, 10760296231205279. [Google Scholar] [CrossRef] [PubMed]
- Farrell, D.H.; McConnell, K.M.; Zilberman-Rudenko, J.; Behrens, B.; Mcloud, S.; Cook, M.R.; Martin, D.; Yonge, J.D.; Underwood, S.J.; Lape, D.E.; et al. AT III levels and outcomes among patients with trauma. JAMA Netw. Open 2024, 7, e2427786. [Google Scholar] [CrossRef] [PubMed]
- Vincent, L.E.; Talanker, M.M.; Butler, D.D.; Zhang, X.; Podbielski, J.M.; Wang, Y.-W.W.; Chen-Goodspeed, A.; Gonzalez, S.L.H.; Fox, E.E.; Cotton, B.A.; et al. Association of changes in AT activity over time with responsiveness to enoxaparin prophylaxis and risk of trauma-related venous thromboembolism. JAMA Surg. 2022, 157, 713–721. [Google Scholar] [CrossRef]
- Saboor, M.; Hamali, H.A.; Mobarki, A.A.; Madkhali, A.M.; Dboie, G. Exploring AT: Insights into its physiological features, clinical implications and analytical techniques. Blood Coagul. Fibrinolysis 2024, 35, 43–48. [Google Scholar] [CrossRef]
- Chen, Y.; Phoon, P.H.Y.; Hwang, N.C. Heparin resistance during cardiopulmonary bypass in adult cardiac surgery. J. Cardiothorac. Vasc. Anesth. 2022, 36, 4150–4160. [Google Scholar] [CrossRef]
- Chiasakul, T.; Mullier, F.; Lecompte, T.; Nguyen, P.; Cuker, A. Laboratory monitoring of heparin anticoagulation in hemodialysis: Rationale and strategies. Semin. Nephrol. 2023, 43, 151477. [Google Scholar] [CrossRef]
- Pejková, M.A.; Ivanová, E.; Sadílek, P.; Malý, R.; Thibaud, Z.; Dulíček, P. AT deficiency: Frequency in Patients with Thrombosis and Thrombophilic Families. Acta Medica 2023, 66, 19–23. [Google Scholar] [CrossRef]
- Hart, C.; Rott, H.; Heimerl, S.; Linnemann, B. Management of AT deficiency in pregnancy. Hämostaseologie 2022, 42, 320–329. [Google Scholar] [CrossRef]
- Englisch, C.; Königsbrugge, O.; Moik, F.; Quehenberger, P.; Preusser, M.; Pabinger, I.; Ay, C. AT activity and association with risk of thrombosis and mortality in patients with cancer. Int. J. Mol. Sci. 2022, 23, 15770. [Google Scholar] [CrossRef]
- Wada, T.; Shiraishi, A.; Gando, S.; Kabata, D.; Yamakawa, K.; Fujishima, S.; Saitoh, D.; Kushimoto, S.; Ogura, H.; Abe, T.; et al. Association of AT with development of trauma-induced disseminated intravascular coagulation and outcomes. Front. Immunol. 2022, 13, 1026163. [Google Scholar] [CrossRef] [PubMed]
- Di Giammarco, G.; Marinelli, D. AT III as predictor of liver reserve: A new parameter to improve the results of mechanical circulatory support therapy. J. Thorac. Cardiovasc. Surg. 2017, 153, 1383. [Google Scholar] [CrossRef] [PubMed]
- Saboor, M.; Khan, A.; Hamali, H.; Mobarki, A.; Madkhali, A.; Dobie, G.; Nizamani, G. Correlation of AT Functional Status and Levels with Liver Fibrosis in Patients with Hepatitis C. Clin. Lab. 2022, 68, 374–377. [Google Scholar] [CrossRef]
- Zhou, X.; Chen, X.; Du, H.; Ye, Y.; Miu, Y.; Su, T.; Guo, X.; Wang, S.; Qiu, Y.; Wang, J.; et al. AT III activity is associated with prognosis, infection, and inflammation in patients with hepatitis B virus-related acute-on-chronic liver failure. Eur. J. Gastroenterol. Hepatol. 2023, 35, 914–920. [Google Scholar] [CrossRef] [PubMed]
- Cao, X.; Cao, Z.; Ou, C.; Zhang, L.; Chen, Y.; Li, Y.; Zhu, B.; Shu, H. Combination of serum paraoxonase/arylesterase 1 and AT-III is a promising non-invasion biomarker for discrimination of AFP-negative HCC versus liver cirrhosis patients. Clin. Res. Hepatol. Gastroenterol. 2021, 45, 101583. [Google Scholar] [CrossRef]
- Minami, S.; Nagafuchi, H.; Yamada, K.; Abe, T.; Takeuchi, I. Association Between Thrombin–AT Complex and Acute Kidney Injury After Pediatric Cardiopulmonary Bypass Surgery: A Single-Center Retrospective Observational Study. Clin. Appl. Thromb./Hemost. 2023, 29, 10760296231184465. [Google Scholar] [CrossRef]
- Zhang, G.; Zhang, L.; Si, S.; Jiang, T.; Xia, Y.; Zhu, Y.; Zhang, X.; Yao, C.; Chen, M.; Chen, S. Fibrinogen and AT III are associated with in-hospital mortality among critically ill patients with acute kidney injury. Ren. Fail. 2022, 44, 1948–1957. [Google Scholar] [CrossRef]
- Lu, Z.; Wang, F.; Liang, M. SerpinC1/AT III in kidney-related diseases. Clin. Sci. 2017, 131, 823–831. [Google Scholar] [CrossRef]
- Marlar, R.A. Laboratory evaluation of AT, protein C, and protein S. Semin. Thromb. Hemost. 2023, 49, 641–650. [Google Scholar] [CrossRef]
- Adamson, P.C.; Loeffelholz, M.J.; Klausner, J.D. Point-of-care testing for sexually transmitted infections: A review of recent developments. Arch. Pathol. Lab. Med. 2020, 144, 1344–1351. [Google Scholar] [CrossRef]
- Tsutsui, H.; Lillehoj, P.B. Flexible Analytical Devices for Point-of-Care Testing. SLAS Technol. Transl. Life Sci. Innov. 2020, 25, 6–8. [Google Scholar] [CrossRef] [PubMed]
- Kumar, Y.; Narsaiah, K. Rapid point-of-care testing methods/devices for meat species identification: A review. Compr. Rev. Food Sci. Food Saf. 2021, 20, 900–923. [Google Scholar] [CrossRef] [PubMed]
- Yang, C.; Gan, X.; Zeng, Y.; Xu, Z.; Xu, L.; Hu, C.; Ma, H.; Chai, B.; Hu, S.; Chai, Y. Advanced design and applications of digital microfluidics in biomedical fields: An update of recent progress. Biosens. Bioelectron. 2023, 242, 115723. [Google Scholar] [CrossRef] [PubMed]
- Liu, X.; Ma, D.; Ye, H.; Hou, Y.; Bai, X.; Xing, Y.; Cheng, X.; Lin, B.; Lu, Y. Electrowetting-based digital microfluidics: Toward a full-functional miniaturized platform for biochemical and biological applications. TrAC Trends Anal. Chem. 2023, 166, 117153. [Google Scholar] [CrossRef]
- Dong, W.; Fu, R.; Zhang, N.; Zhao, J.; Ma, Y.; Cui, H.; Zhang, J.; Zhao, Z.; Li, H.; Zhao, Y.; et al. Digital microfluidics with integrated Raman sensor for high-sensitivity in-situ bioanalysis. Biosens. Bioelectron. 2025, 271, 117036. [Google Scholar] [CrossRef]
- Liu, J.; Fu, R.; Zhang, S.; Hou, J.; Ma, H.; Hu, S.; Li, H.; Zhang, Y.; Wang, W.; Qiao, B.; et al. Rapid and multi-target genotyping of Helicobacter pylori with digital microfluidics. Biosens. Bioelectron. 2024, 256, 116282. [Google Scholar] [CrossRef]
- Zhou, J.; Dong, J.; Hou, H.; Huang, L.; Li, J. High-throughput microfluidic systems accelerated by artificial intelligence for biomedical applications. Lab A Chip 2024, 24, 1307–1326. [Google Scholar] [CrossRef]
- Deliorman, M.; Ali, D.S.; Qasaimeh, M.A. Next-generation microfluidics for biomedical research and healthcare applications. Biomed. Eng. Comput. Biol. 2023, 14, 11795972231214387. [Google Scholar] [CrossRef]
- Yu, N.; Wu, J. Rapid and reagentless detection of thrombin in clinic samples via microfluidic aptasensors with multiple target-binding sites. Biosens. Bioelectron. 2019, 146, 111726. [Google Scholar] [CrossRef]
- Li, S.; Zhang, Y.; Liu, J.; Wang, X.; Qian, C.; Wang, J.; Wu, L.; Dai, C.; Yuan, H.; Wan, C.; et al. Fully Integrated and High-Throughput Microfluidic System for Multiplexed Point-Of-Care Testing. Small 2024, 20, 2401848. [Google Scholar] [CrossRef]
- Dong, Z.; Liu, X.; Zhou, S.; Zhu, Y.; Chen, J.; Liu, Y.; Ren, X.; Lu, Y.-Q.; Xiao, R.; Wang, G. Microsphere lens array embedded microfluidic chip for SERS detection with simultaneous enhancement of sensitivity and stability. Biosens. Bioelectron. 2024, 261, 116505. [Google Scholar] [CrossRef] [PubMed]
- Tarim, E.A.; Inevi, M.A.; Ozkan, I.; Kecili, S.; Bilgi, E.; Baslar, M.S.; Ozcivici, E.; Karakus, C.O.; Tekin, H.C. Microfluidic-based technologies for diagnosis, prevention, and treatment of COVID-19: Recent advances and future directions. Biomed. Microdevices 2023, 25, 10. [Google Scholar] [CrossRef] [PubMed]
- Fu, R.; Du, W.; Jin, X.; Wang, R.; Lin, X.; Su, Y.; Yang, H.; Shan, X.; Lv, W.; Zheng, Z.; et al. Microfluidic biosensor for rapid nucleic acid quantitation based on hyperspectral interferometric amplicon-complex analysis. ACS Sens. 2021, 6, 4057–4066. [Google Scholar] [CrossRef]
- Lin, J.; Chen, S.; Zhang, C.; Liao, J.; Chen, Y.; Deng, S.; Mao, Z.; Zhang, T.; Tian, N.; Song, Y.; et al. Recent advances in microfluidic technology of arterial thrombosis investigations. Platelets 2024, 35, 2316743. [Google Scholar] [CrossRef]
- Reyes, D.R.; van Heeren, H.; Guha, S.; Herbertson, L.; Tzannis, A.P.; Ducrée, J.; Bissig, H.; Becker, H. Accelerating innovation and commercialization through standardization of microfluidic-based medical devices. Lab A Chip 2021, 21, 9–21. [Google Scholar] [CrossRef]
- Yang, F.; Fu, R.; Liu, Y.; Dong, W.; Liu, X.; Song, Y.; Li, G.; Zhou, T.; Hu, H.; Li, S.; et al. Automated Electroosmotic Digital Optofluidics for Rapid and Label-Free Protein Detection. Nano Lett. 2025, 25, 5325–5333. [Google Scholar] [CrossRef]
- Zhou, T.; Fu, R.; Hou, J.; Yang, F.; Chai, F.; Mao, Z.; Deng, A.; Li, F.; Guan, Y.; Hu, H.; et al. Self-Interference Digital Optofluidic Genotyping for Integrated and Automated Label-Free Pathogen Detection. ACS Sens. 2024, 9, 6411–6420. [Google Scholar] [CrossRef]
- Mao, Z.; Deng, A.; Jin, X.; Zhou, T.; Zhang, S.; Li, M.; Lv, W.; Huang, L.; Zhong, H.; Wang, S.; et al. Highly Specific and Rapid Multiplex Identification of Candida Species Using Digital Microfluidics Integrated with a Semi-Nested Genoarray. Anal. Chem. 2024, 96, 18797–18805. [Google Scholar] [CrossRef]
- Ministry of Health and Family Planning of the People’s Republic of China. Establishment and Verification of Detection Capability for Clinical Laboratory Methods, WS/T 514-2017; Standards Press of China: Beijing, China, 2017; pp. 8–9. Available online: https://www.nhc.gov.cn/wjw/index.shtml (accessed on 19 May 2025).


| Sample ID | Regular Instrument AT Activity | Microfluidic System AT Activity | Calculated Relative Difference |
|---|---|---|---|
| 1 | 113% | 111.572% | 1.2% |
| 2 | 113% | 113.100% | 0.1% |
| 3 | 112% | 112.227% | 0.2% |
| 4 | 107% | 109.716% | 2.5% |
| 5 | 104% | 101.965% | 1.9% |
| 6 | 100% | 96.834% | 3.2% |
| 7 | 100% | 97.380% | 2.7% |
| 8 | 98% | 95.306% | 2.8% |
| 9 | 94% | 93.996% | 0.0% |
| 10 | 91% | 92.467% | 1.6% |
Disclaimer/Publisher’s Note: The statements, opinions and data contained in all publications are solely those of the individual author(s) and contributor(s) and not of MDPI and/or the editor(s). MDPI and/or the editor(s) disclaim responsibility for any injury to people or property resulting from any ideas, methods, instructions or products referred to in the content. |
© 2025 by the authors. Licensee MDPI, Basel, Switzerland. This article is an open access article distributed under the terms and conditions of the Creative Commons Attribution (CC BY) license (https://creativecommons.org/licenses/by/4.0/).
Share and Cite
Li, D.; Hu, H.; Zhang, H.; Shang, L.; Zhao, T.; Zhao, Q.; Zhang, S.; Ma, F.; Liang, G.; Fu, R.; et al. Automated Antithrombin Activity Detection with Whole Capillary Blood Based on Digital Microfluidic Platform. Micromachines 2025, 16, 785. https://doi.org/10.3390/mi16070785
Li D, Hu H, Zhang H, Shang L, Zhao T, Zhao Q, Zhang S, Ma F, Liang G, Fu R, et al. Automated Antithrombin Activity Detection with Whole Capillary Blood Based on Digital Microfluidic Platform. Micromachines. 2025; 16(7):785. https://doi.org/10.3390/mi16070785
Chicago/Turabian StyleLi, Dongshuo, Hanqi Hu, Hanzhi Zhang, Lei Shang, Tao Zhao, Qingchen Zhao, Shuhao Zhang, Fucun Ma, Guowei Liang, Rongxin Fu, and et al. 2025. "Automated Antithrombin Activity Detection with Whole Capillary Blood Based on Digital Microfluidic Platform" Micromachines 16, no. 7: 785. https://doi.org/10.3390/mi16070785
APA StyleLi, D., Hu, H., Zhang, H., Shang, L., Zhao, T., Zhao, Q., Zhang, S., Ma, F., Liang, G., Fu, R., & Liu, X. (2025). Automated Antithrombin Activity Detection with Whole Capillary Blood Based on Digital Microfluidic Platform. Micromachines, 16(7), 785. https://doi.org/10.3390/mi16070785