Author Contributions
Conceptualization, S.J., S.-h.I. and D.B.; methodology, S.J., K.S., J.L., S.K., T.P. and T.L.; software, S.J.; validation, B.K. and J.K.; formal analysis, S.J., K.S. and T.P.; investigation, J.L., S.K., T.P. and T.L.; writing—original draft preparation, S.J.; writing—review and editing, R.S., S.-h.I., J.-O.P. and D.B.; supervision, B.K., J.K., J.-O.P. and D.B.; funding acquisition, R.S., J.-O.P. and D.B. All authors have read and agreed to the published version of the manuscript.
Figure 1.
Concept of Parametric Rule-based Intelligent System (PRISM) for design and analysis of high-strength separable microneedles. (a) PRISM generates a 3D model of high-strength separable microneedle arrays with respect to input parameters. Then, a high-strength separable microneedle array is fabricated by using micro-3D printing. The inset (top right) describes parameters for a microneedle design. (b) A simplified schematic flowchart of the PRISM workflow. Users input parameters (NBarb, θTip, rNeck, dCavity) and the PRISM platform automatically generates the 3D microneedle model and performs structural analysis based on the 3D model (SAMN, VMN, ANeck, AAvg). These output parameters are related to drug release speed, drug loading capacity, and mechanical strength for penetration and separation. (c) A schematic illustration of the 3D model structure according to the change in each input parameter. (d) A schematic illustration of the application of high-strength separable microneedles. At first, the microneedle array is pressed on the skin using a vertical force Fv (red arrow) to insert the microneedles into the skin phantom. Then, a horizontal force Fh (red arrow) is applied by sliding the sample. This results in the microneedles fracturing at their necks. After separation, the sample is removed, leaving the microneedle tips embedded in the skin phantom.
![Micromachines 16 00726 g001]()
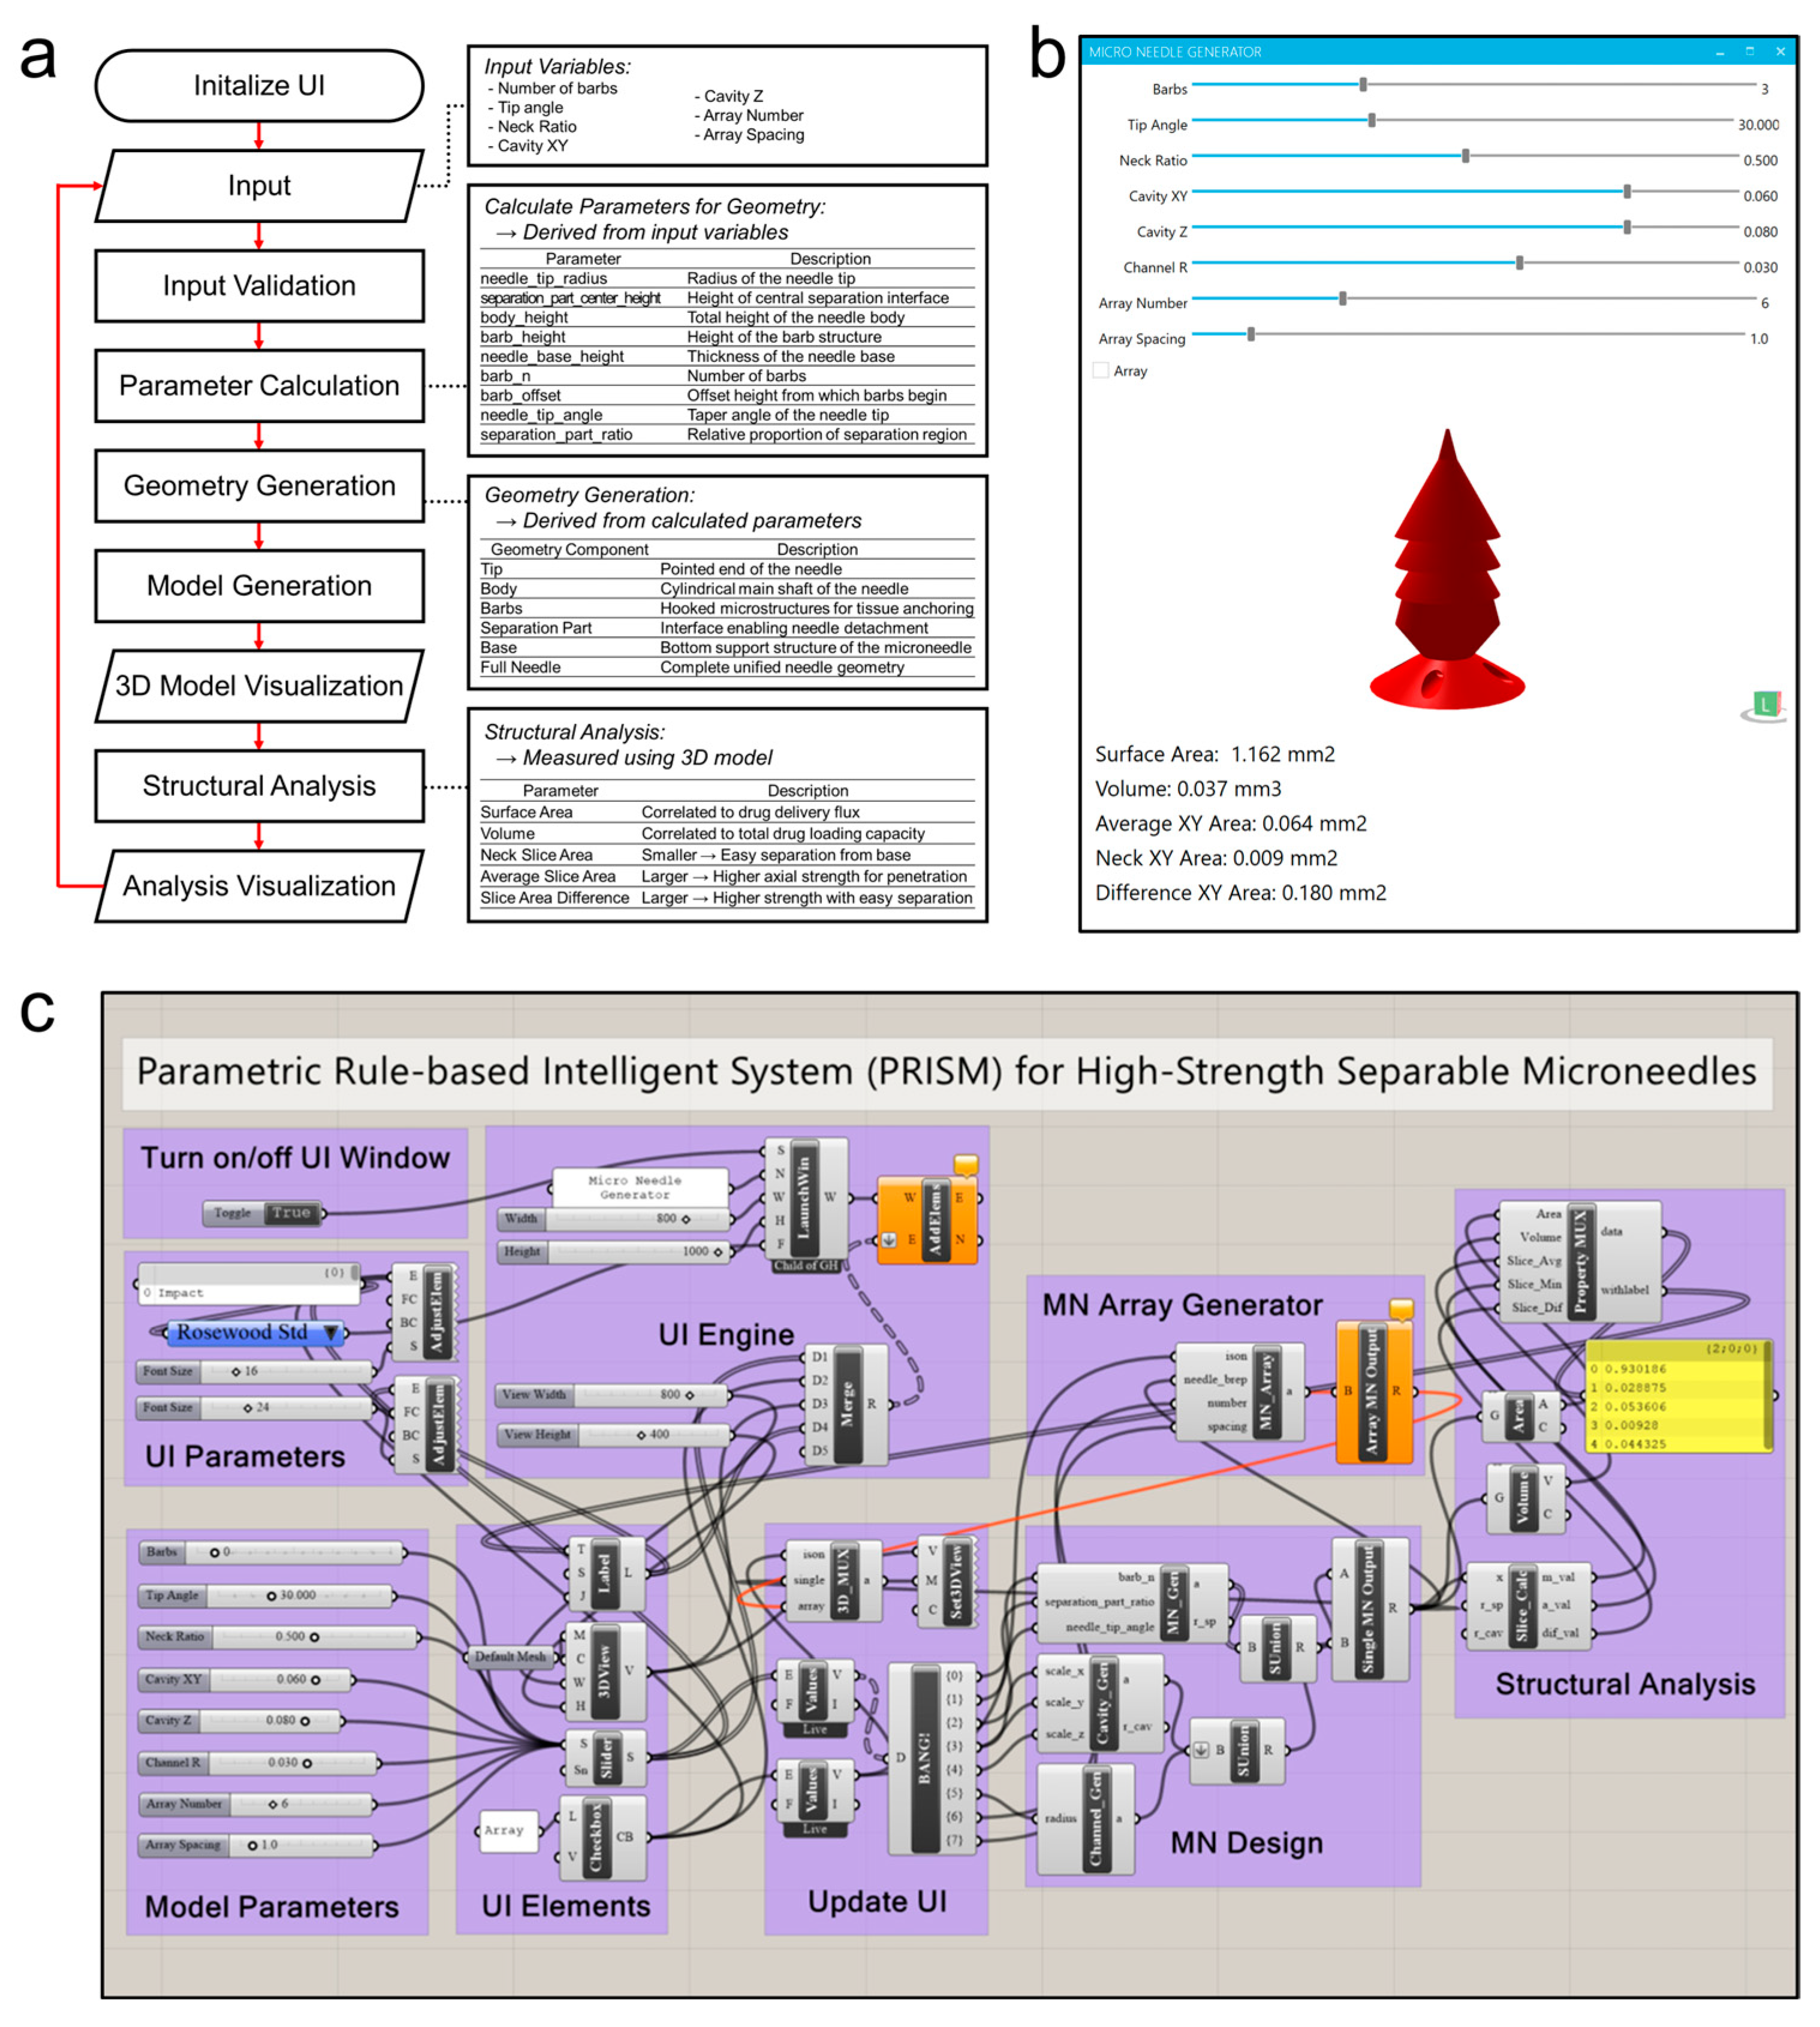
Figure 2.
PRISM software (Rhinoceros 3D version 8 SR20; Washington, Seattle, USA), (Grasshopper version 1.0.0008; Washington, Seattle, USA) workflow and implementation. (a) A flowchart of the PRISM algorithm. After initializing the graphical user interface (GUI), the user inputs the microneedle design parameters. Then, the PRISM algorithm validates inputs, calculates geometric parameters (e.g., actual lengths for tip, barb, or base), and the 3D microneedle model is generated. Then, the structural analysis module calculates output parameters, such as surface area, volume, cross-sectional area at neck, and average cross-sectional area. Finally, the visualization step provides these outputs (3D model and structure analysis parameters) to the user by using GUI. (b) A screenshot of the PRISM software GUI. The interface features input for each microneedle generation parameter, allowing the user to set values of the parameters and receive results in real time. (c) A schematic illustration of the parametric design logic (Grasshopper for Rhinoceros 3D).
![Micromachines 16 00726 g002]()
Figure 3.
The effect of the input parameters on 3D microneedle structure analysis. (a) Schematic illustrations of a 3D microneedle structure depending on the input parameters: number of barbs (NBarb,), tip angle (θTip), and neck ratio (rNeck). These parameters correspond to (b–e). (b) The dependency of the surface area (SA), which is correlated to drug delivery flux, is plotted with respect to the change in each input parameter. (c) The dependency of the volume (Vol), which is correlated to total drug loading capacity, is plotted with respect to the change in each input parameter. (d) The dependency of the average cross-sectional area (S_Avg), in which larger value means higher axial strength for penetration, is plotted with respect to the change in each input parameter. (e) The dependency of the neck cross-sectional area (S_Min), in which larger value means higher strength with easy separation, is plotted with respect to the change in each input parameter.
Figure 4.
The relationship between the input parameters with microneedle penetration and separation performance. (a) Dependencies of the split efficiency, which is defined as S_Avg/S_Min (i.e., average cross-sectional area divided by minimum cross-sectional area at the neck) with respect to the input parameters (BarbNum, Tip Angle, Ratio). This value is high if the microneedle has high strength with high separability. (b) A summary of the design factors, which affect microneedle strength and separation performance. The green bars (BarbNum) indicate that increasing these input parameters increases the penetration with split efficiency, while the red bars (Tip Angle and Ratio) indicate that decreasing these input parameters increases the penetration with split efficiency.
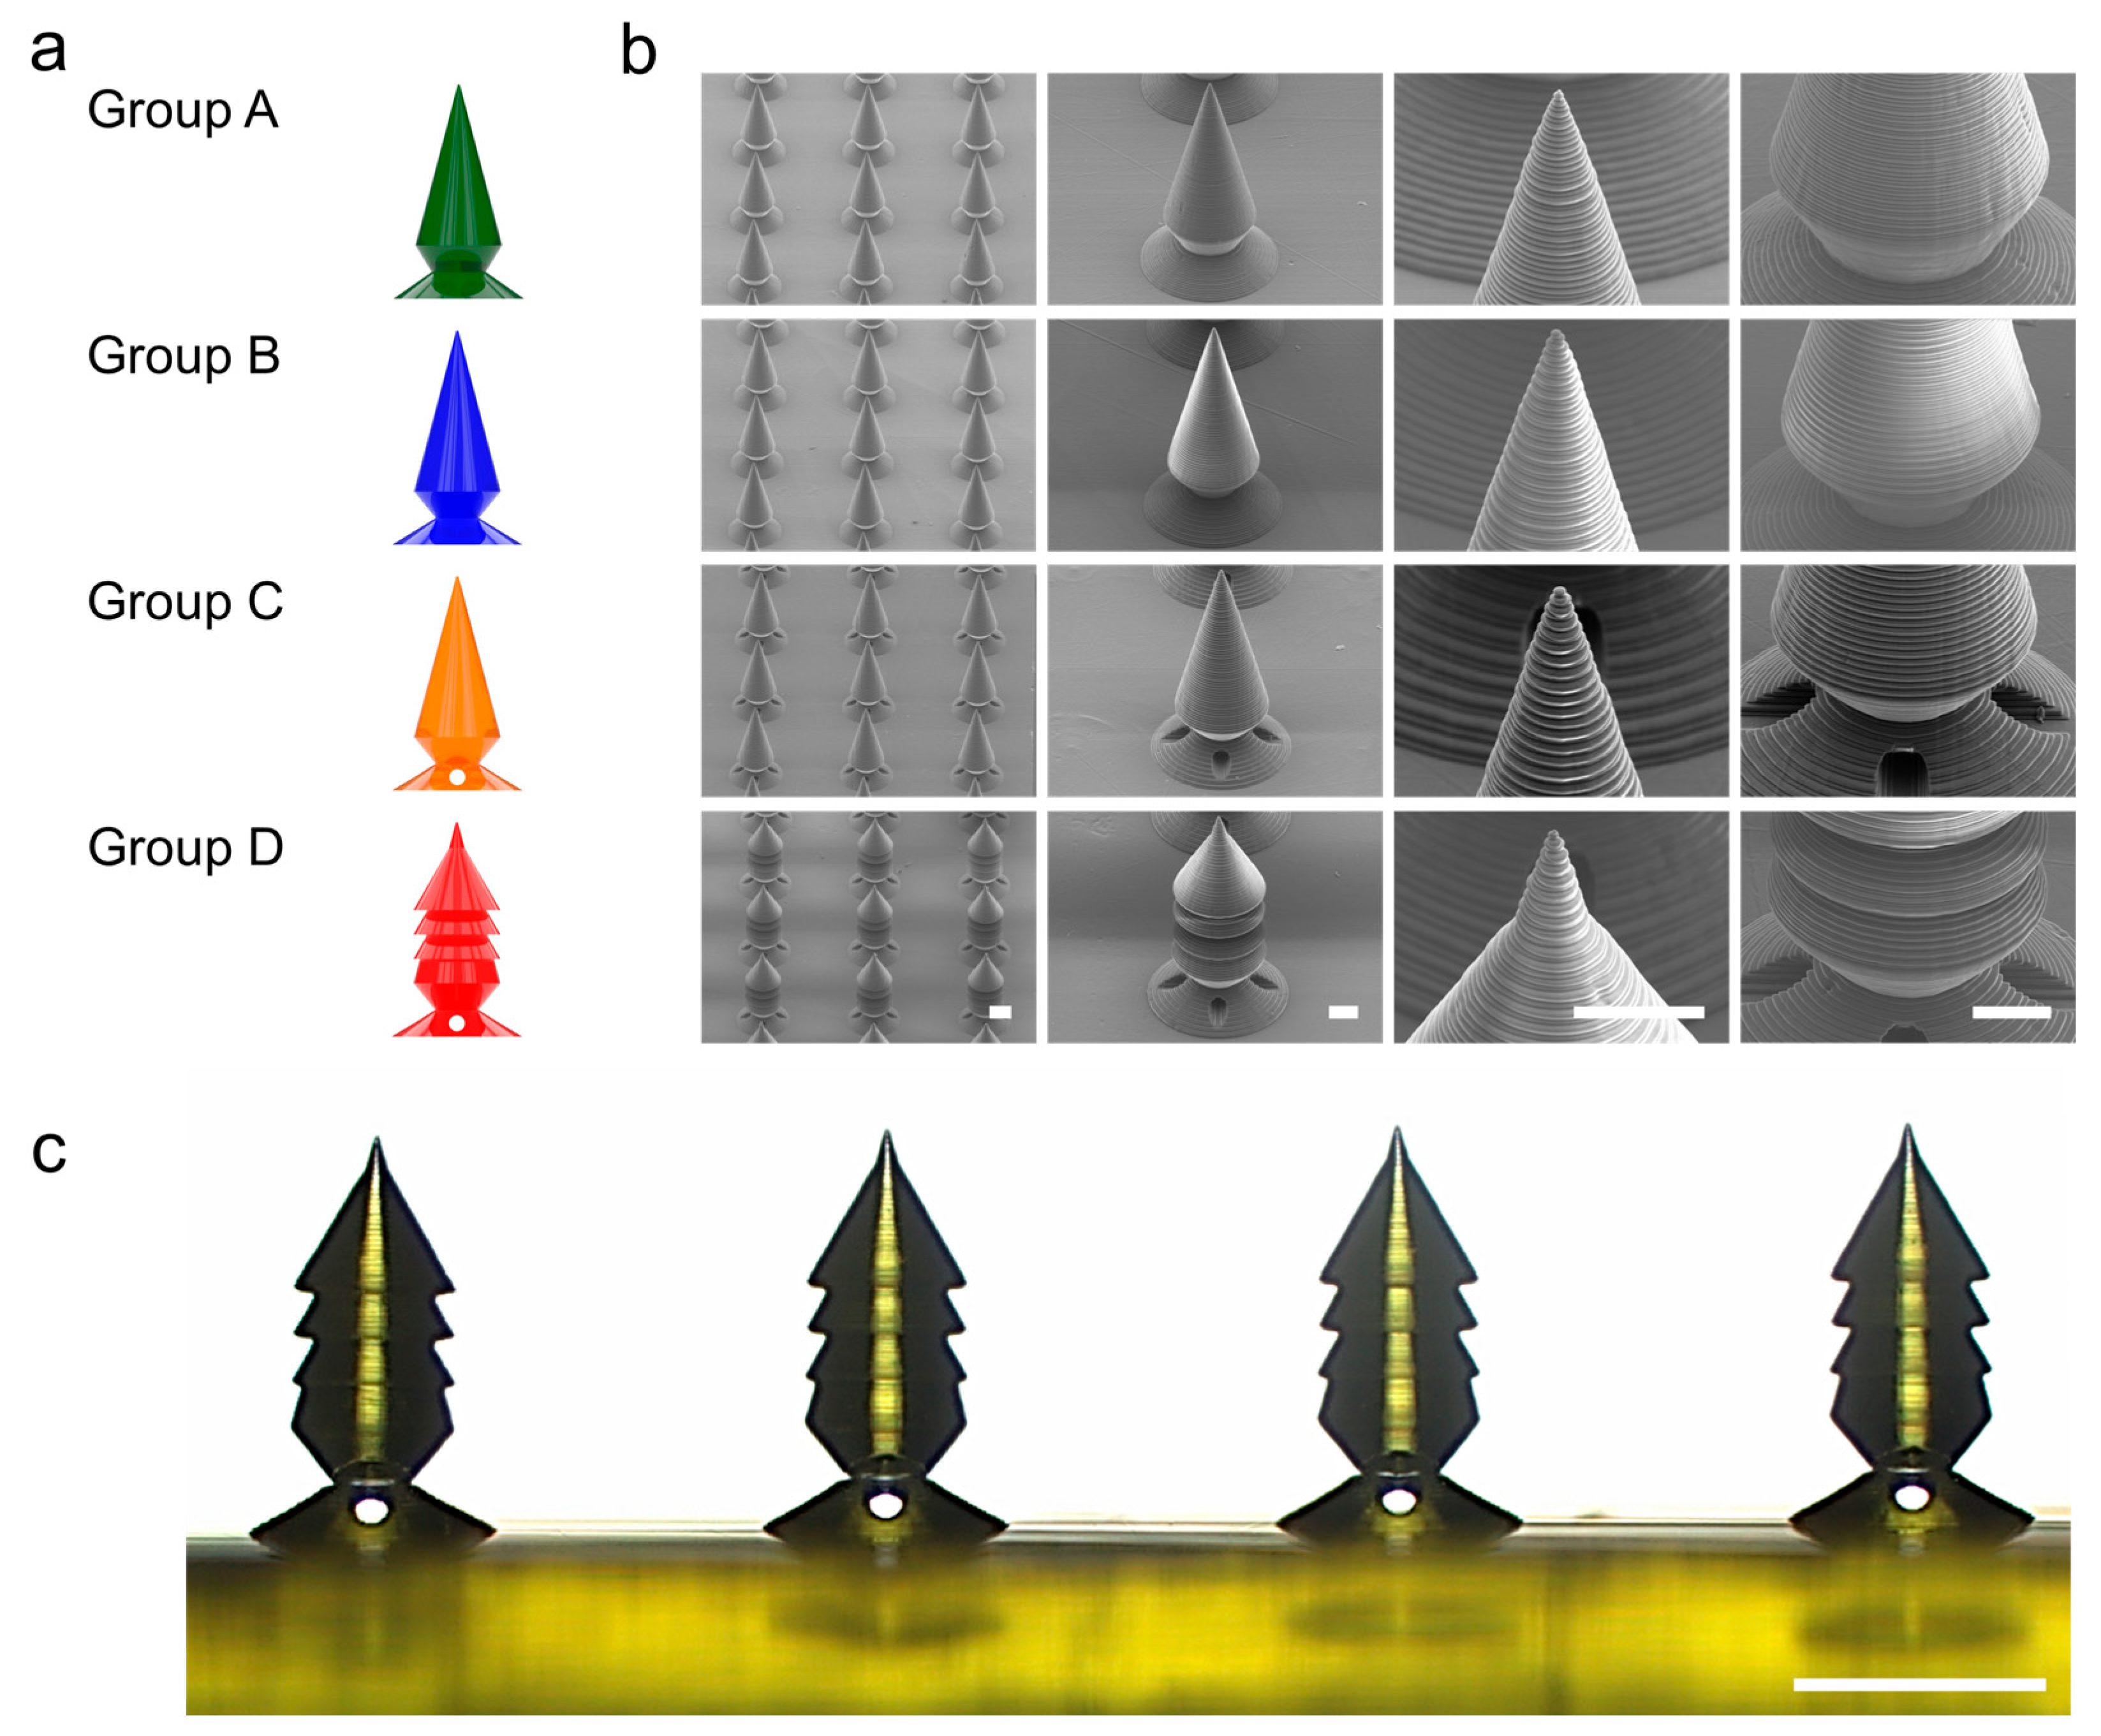
Figure 5.
Microscale 3D printing and structural analysis of the PRISM-generated microneedle samples. (a) A schematic illustration of the four different microneedle groups (A–D), which was generated by PRISM. Group A (green) is a baseline candlelight design with no barbs and a relatively thick neck (NBarb = 0, θTip = 30, rNeck = 62.5, dCavity = 0 (No cavity)). Group B (blue) is also a baseline candlelight design with no barbs with a narrower neck (NBarb = 0, θTip = 30, rNeck = 50, dCavity = 0 (No cavity)). Group C is a separable design with a cavity inside of the candlelight design (NBarb = 0, θTip = 30, rNeck = 50, dCavity = 0.6). Group D (red) is an optimized design with a multi-barb design with a cavity (NBarb = 3, θTip = 30, rNeck = 50, dCavity = 0.6). (b) Scanning electron microscopy (SEM) images of PRISM-generated microneedle arrays with various magnifications (scale bars are 200 µm in the array images and 100 µm in the single-needle close-ups). (c) A side-view optical microscope image of a row of printed microneedles (Group D samples and scale bar is 500 µm).
![Micromachines 16 00726 g005]()
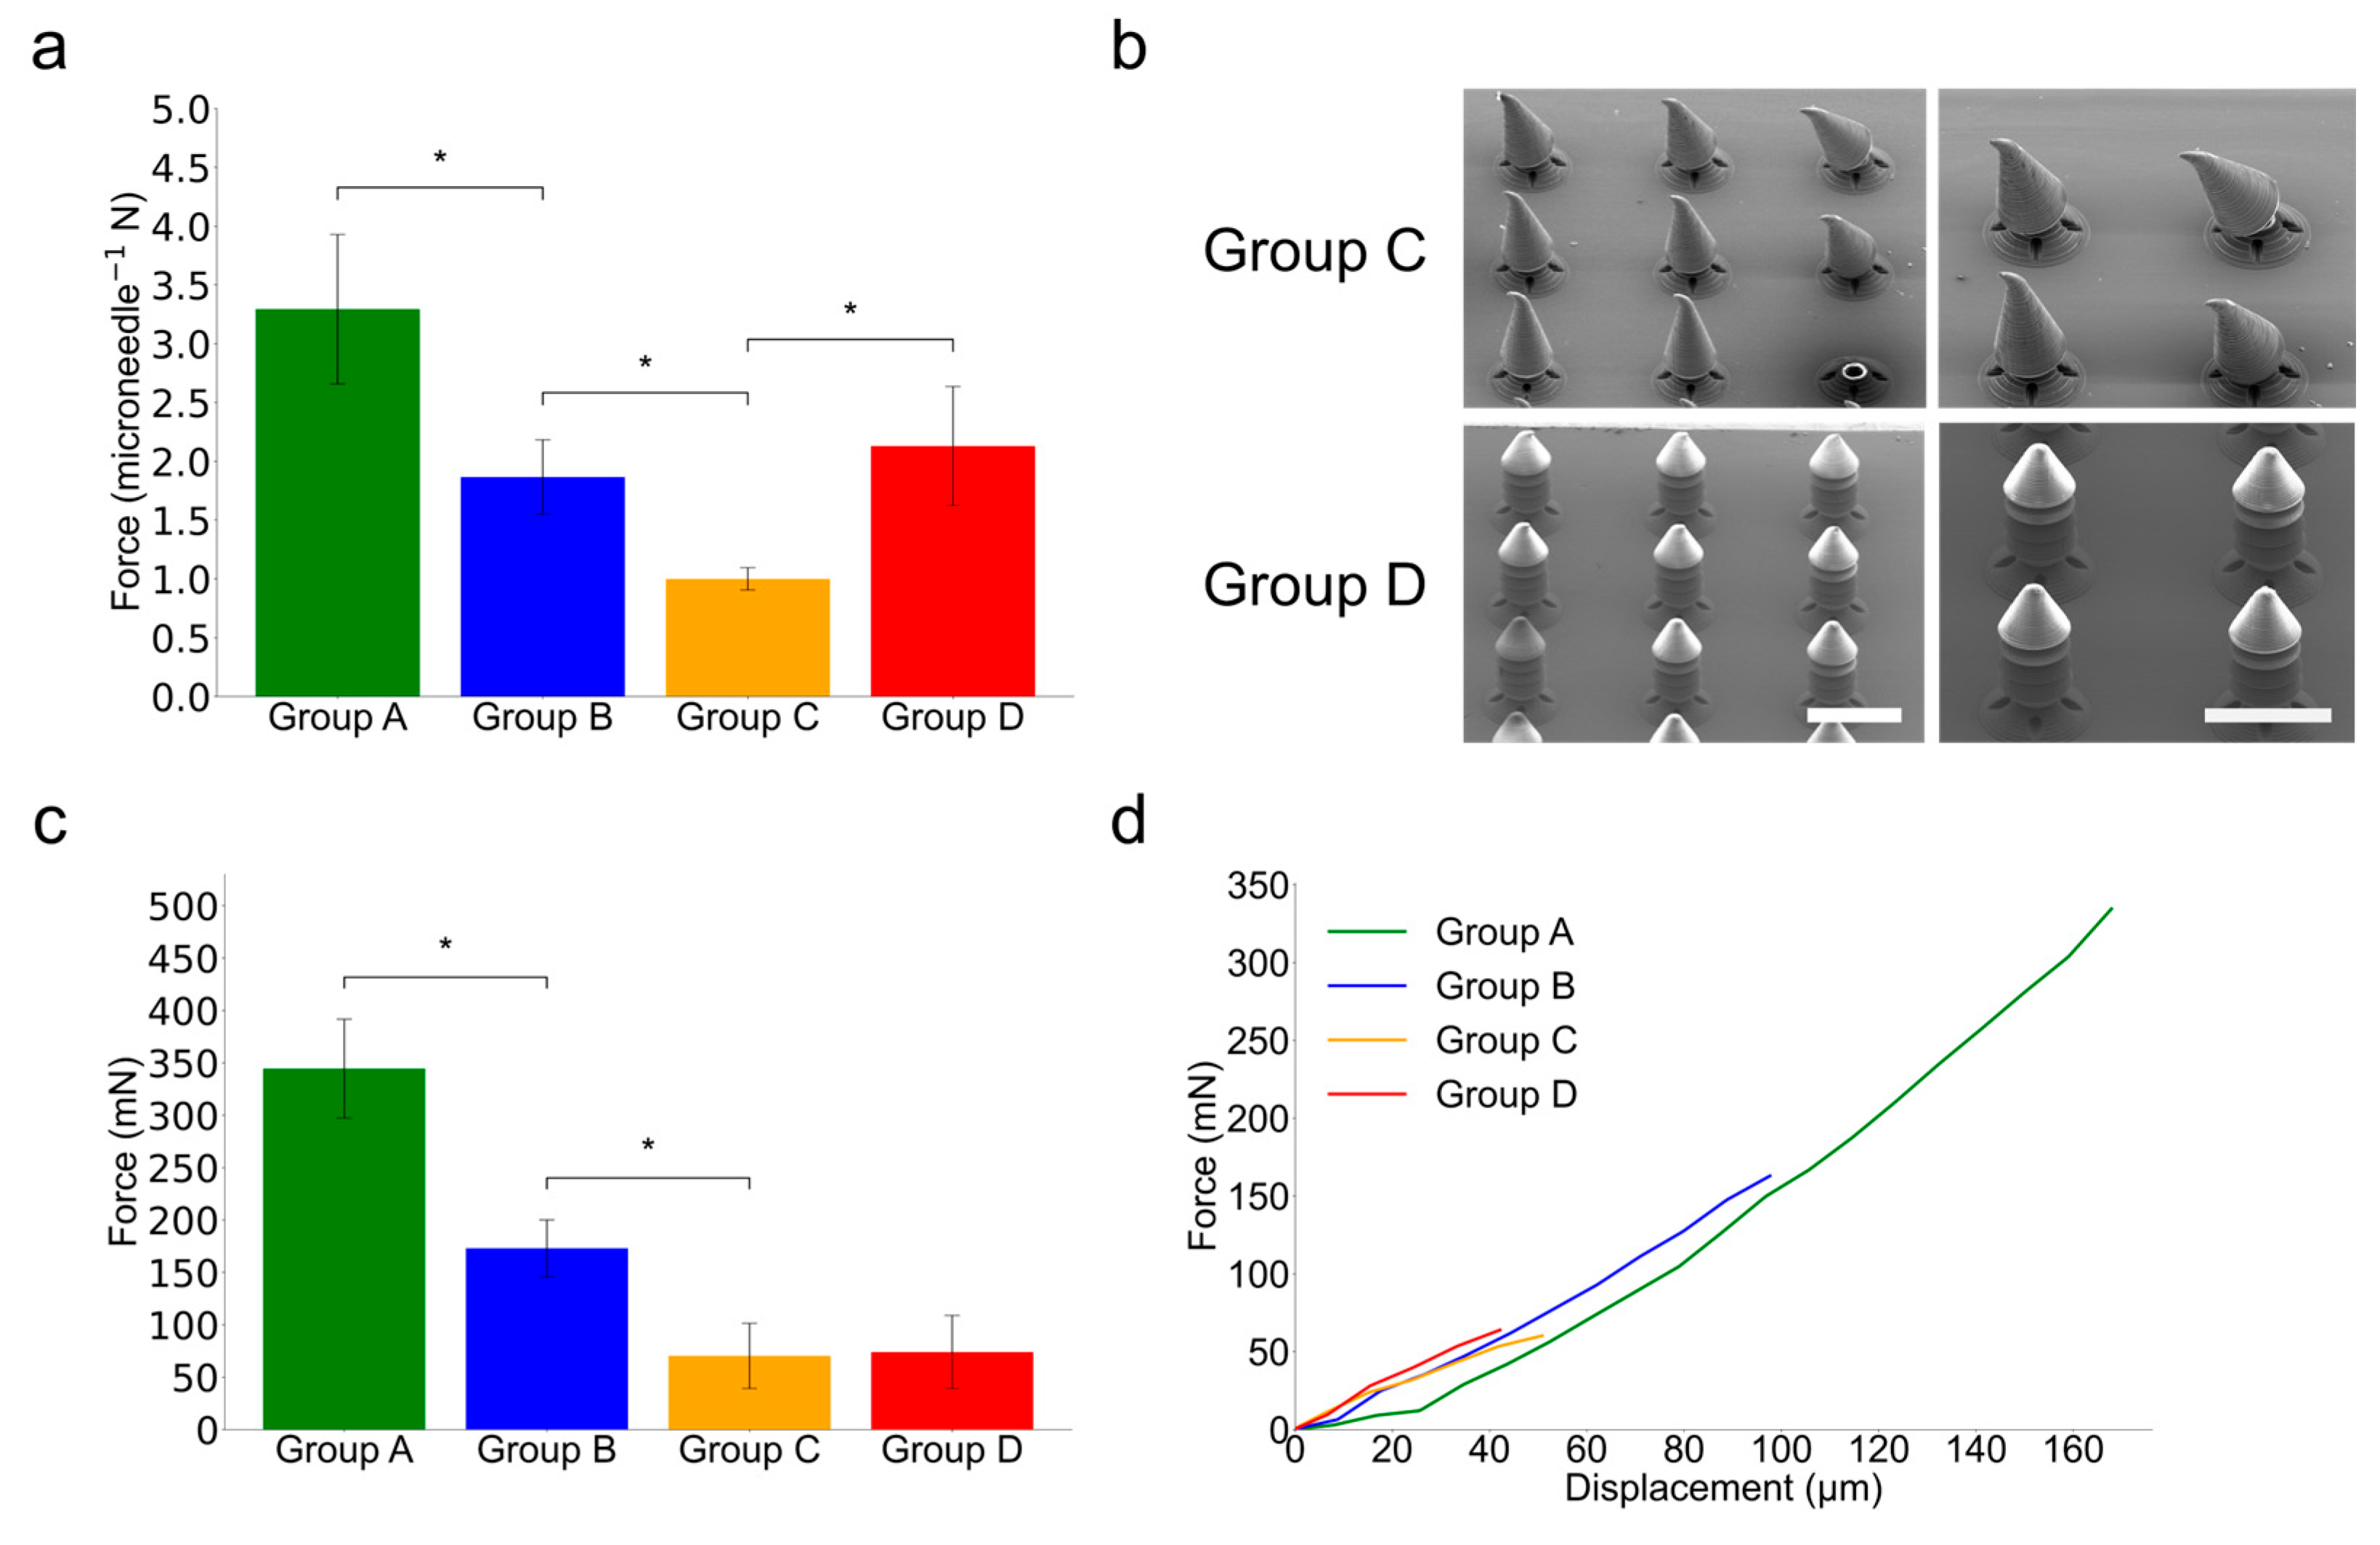
Figure 6.
Mechanical testing of PRISM-generated microneedle samples. (a) A comparison of peak axial compression resistance for each PRISM-generated microneedle sample groups. The error bars denote standard deviation over five different samples (n = 5) and asterisks (*) denote statistically significant differences (p < 0.05). (b) Scanning electron microscopy (SEM) images of Group C and Group D microneedles after axial compression by 0.1 mm (Scale bar is 500 µm). In Group C, after axial compression by 0.1 mm, the tips of the microneedles are bent due to relatively lower axial structural hardness. However, in Group D, the structures of the microneedles are not changed due to the enhanced structural hardness. (c) A comparison of peak shear detachment forces for each PRISM-generated microneedle sample group. The error bars denote standard deviation over five different samples (n = 5) and asterisks (*) denote statistically significant differences (p < 0.05). The samples are pushed down against a hard surface until they fracture. Group D exhibits comparable peak shear detachment force with Group C and this result suggests that Group D exhibits better skin penetration with similar separability. (d) Shear detachment force–displacement curves of each PRISM-generated microneedle sample group.
![Micromachines 16 00726 g006]()
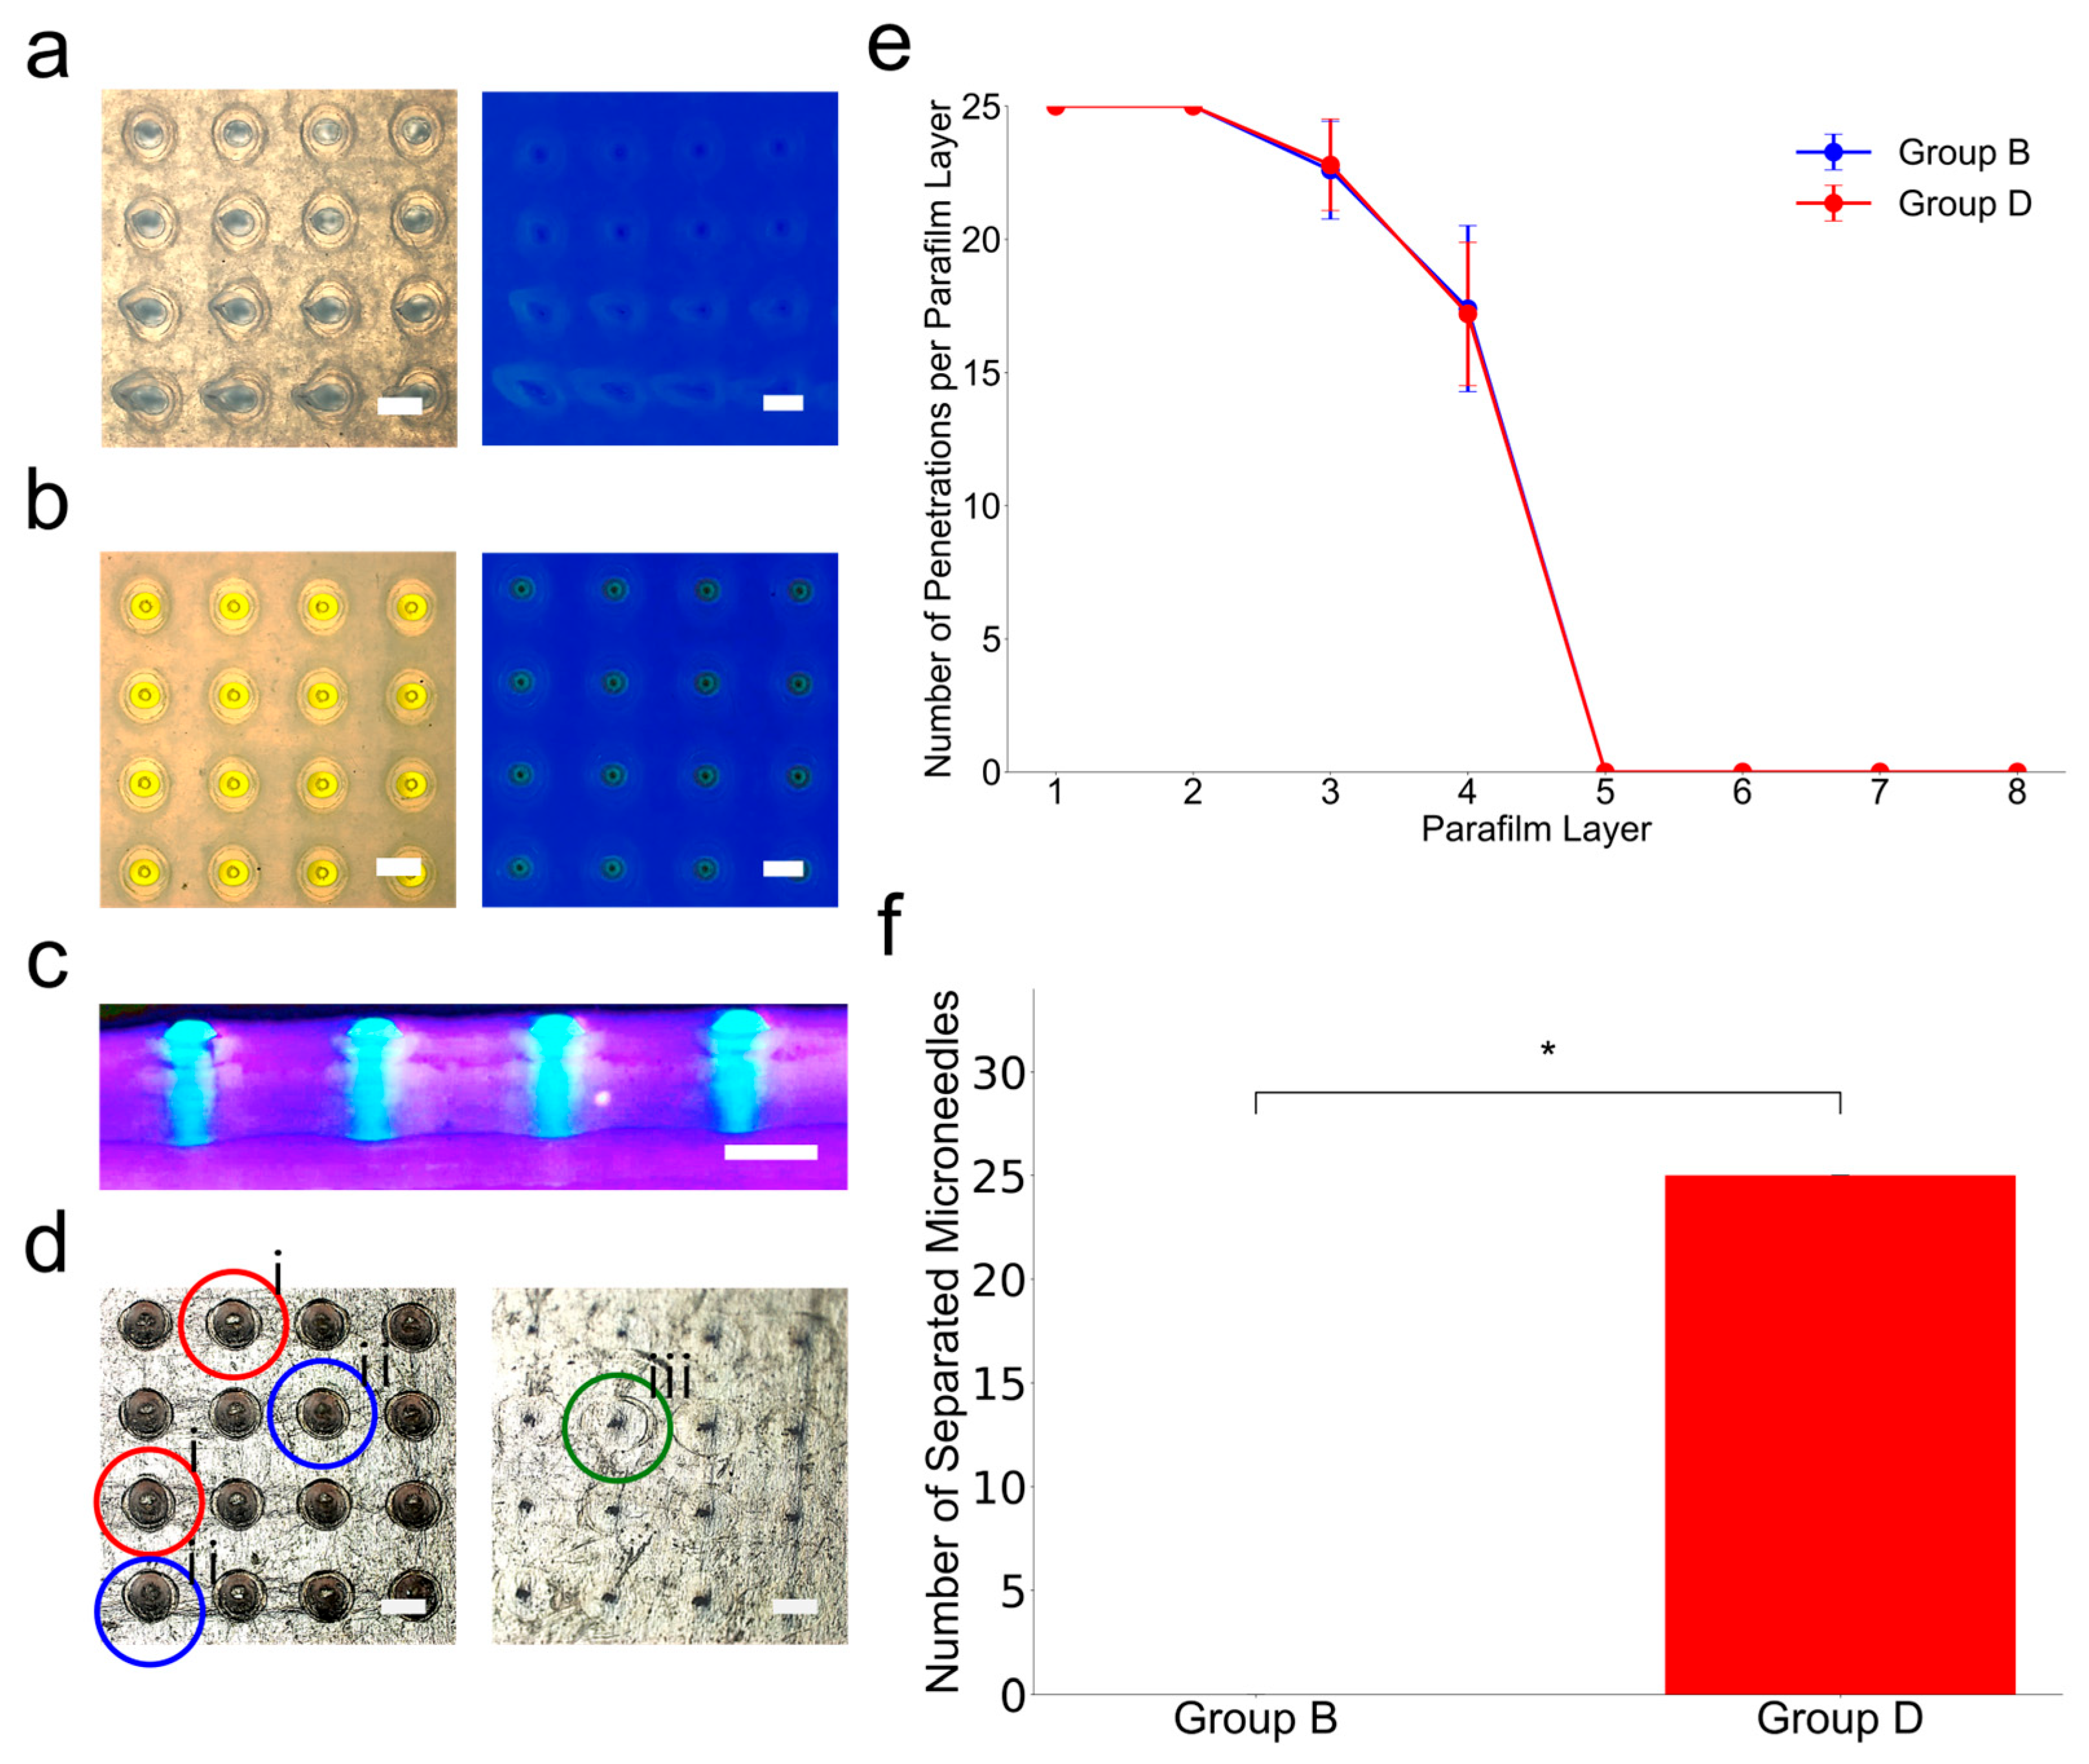
Figure 7.
Microneedle insertion and separation tests using skin-mimicking phantom. (a) Top-down view of a skin phantom after attempting to insert a microneedle (Group B). In this case, holes are created after microneedle insertion; however, the yellow-colored microneedle is not observed because the microneedles are filed to separation. (b) Top-down view of a skin phantom after attempting to insert a microneedle (Group D). In this case, holes and yellow-colored microneedles are observed because the microneedles are separated after applying horizontal force. (c) Side cross-sectional view of the skin-mimicking phantom (under UV light) after insertion of the microneedles (Group D). The tips are clearly visible embedded in the skin-mimicking phantom sample, confirming that they have separated from the sample and remain lodged at the sample (Scale bar is 500 µm). (d) Bright-field microscopy images of Layer 1 and Layer 6 of the eight layers of parafilm microneedles that were pushed through showing holes, tears, and dents. i. indicates hole, ii. indicates rupture, and iii. indicates dent. (e) The number of successful penetrations per parafilm layer for Group B and Group D microneedles (n = 5 per group). (f) The number of separated microneedles retained within the parafilm skin phantom for Group B and Group D (n = 5) and asterisks (*) denote the statistically significant differences (p < 0.05).
![Micromachines 16 00726 g007]()
Table 1.
Parametric configurations for microneedle groups.
Table 1.
Parametric configurations for microneedle groups.
| | Needle_Tip_Angle | Narrowed_Neck_Ratio | Barb_n | Cavity_Scale_x and y | Cavity_Scale_z |
|---|
| Group A | 30° | 62.5% | No barb | No cavity | No cavity |
| Group B | 30° | 50% | No barb | No cavity | No cavity |
| Group C | 30° | 50% | No barb | 60 µm | 80 µm |
| Group D | 30° | 50% | 3 | 60 µm | 80 µm |
Table 2.
Dimensional accuracy of Group D microneedles compared to CAD specifications.
Table 2.
Dimensional accuracy of Group D microneedles compared to CAD specifications.
| Structure | Measured Mean | 99% CI | CAD Value (µm) | Relative Error (%) |
|---|
| Microneedle Height (µm) | 700.07 | 4.54 | 700 | 0.01 |
| Separation Zone Height (µm) | 102.3 | 2.69 | 100 | 2.3 |
| Distance to First Barb (µm) | 325.62 | 2.57 | 325 | 0.19 |
| 1st Barb Diameter (µm) | 314.26 | 10.52 | 328 | 4.19 |
| 2nd Barb Diameter (µm) | 314.03 | 4.68 | 328 | 4.26 |
| 3rd Barb Diameter (µm) | 319.08 | 3.17 | 328 | 2.72 |
| Max Diameter before Neck (µm) | 321.69 | 5.65 | 328 | 1.92 |
| Narrowed Neck Diameter (µm) | 161.65 | 3.26 | 164 | 1.43 |
| Cavity XY Diameter (µm) | 119.68 | 1.35 | 120 | 0.27 |


 ,
, 


