Article

Etched Tungsten Oxide Modified with Au for Quick Xylene Detection

School of Aerospace Science and Technology, Xidian University, Xi’an 710126, China
*
Authors to whom correspondence should be addressed.
Micromachines 2025, 16(6), 646; https://doi.org/10.3390/mi16060646
Submission received: 10 May 2025 / Revised: 26 May 2025 / Accepted: 27 May 2025 / Published: 28 May 2025
(This article belongs to the Special Issue Gas Sensors: From Fundamental Research to Applications, 2nd Edition)

Abstract

:
Due to its widespread distribution in industrial, commercial, and residential settings, xylene detection is crucial. In this study, carbon sphere templates and NaHCO3 etching were used to synergistically prepare WO3 with uniform macropores, which was then decorated with Au elements. The findings demonstrated that the Au-decorated WO3-etched sample (WO3-1%E+Au) had the best sensing performance for 100 ppm xylene (response value: 21.3, optimal operating temperature: 360 °C) and short response/recovery time (1 s/11 s). The etching of NaHCO3 and the synergistic carbon sphere templates were responsible for the sensing performance, as they enhanced the sample surface’s specific surface area and roughness while also supplying additional active sites. Furthermore, the sensor’s sensitivity and selectivity to xylene were enhanced by the coupling effect and dehydrogenation catalysis of the noble metal Au. The results of this work advance our knowledge of gas-sensing mechanisms and offer guidance for the creation of extremely sensitive and selective xylene gas sensors.

1. Introduction

Xylene is a volatile organic compound (VOC) of great concern that is employed in a wide variety of industrial, commercial, and household applications. It is commonly found in paints, solvents, adhesives, and cleaners [1,2,3]. On the other hand, exposure to xylene vapors can have harmful impacts on human health, including respiratory irritation, dizziness, and even chronic issues [4,5]. Furthermore, xylene is regarded as a possible environmental toxin with the potential to contaminate air, soil, and water [6]. Therefore, it is crucial to create an effective and dependable gas sensor for xylene detection and monitoring in order to preserve the environment, public health, and workplace safety [5,6].
Due to their high response values and high carrier mobility for gas detection, n-type metal oxide semiconductors have been used extensively among MOS [7,8,9]. For gas sensors, tungsten oxide (WO3) has shown great promise as an n-type MOS material because of its excellent physical and chemical properties [10,11]. In order to further enhance the performance of gas sensors (e.g., increase the sensitivity, improve the selectivity, and enhance the speed of response and recovery), researchers usually carry out studies in the following aspects, including increasing active surface sites and second element-induced catalysis [12,13].
Etching or surface modification has been thought to be a successful strategy for improving gas sensor performance. By increasing the sensing materials’ surface area, surface pore density, and surface roughness, this technique creates additional active sites for gas molecule interaction [14,15,16,17,18,19]. Radzali utilized photoelectrochemical etching to effectively fabricate porous InAlGaN [20]. Compared to the nonporous InAlGaN, the sensor demonstrated a sensing response to hydrogen that was around 6.9 times higher. The response and recovery times of the sensor were 13.8 s and 88.4 s at room temperature. With the aid of KOH, Qin prepared well-aligned, loosely structured rough silicon nanowire arrays with large surface area using metal-assisted chemical etching [21]. The sensor exhibited a satisfactory response value of 83% to 200 ppm H2. KOH treatment roughened the surface to increase the surface area and improve the gas adsorption capacity.
Through chemical and electronic sensitization, the utilization of noble metals like Au [22], Pd [23], Pt [24], and Ag [25] as second elements added to the sensitizer materials may enhance the sensing performance of target gas [26]. In the meantime, noble metals usually have the selectivity modulate function for target gases [27,28]. Kim reported a study that involved loading several noble metal catalysts onto In2O3 to regulate the selectivity of gas sensors. Ru and Pd catalysts showed excellent selectivity to CH3SH and H2S, while Pt interacted preferentially with CH3COCH3 [27]. Both the catalytic affinity of each noble metal for the target gas and the distinct catalytic effects arising from the metal-sensitizer material interactions are responsible for the variation in sensitivity of these three sensors. Some noble metals can also react selectively with particular gases, and in Barbosa’s study, Pd-SnO2 showed significantly higher response values than Ag-SnO2 and pristine SnO2 for varying concentrations of H2 under the same detection conditions [28]. This is mostly because Pd adsorbs H2 in a particular way, separates it into H atoms, and then combines with the separated H atoms to form PdHx [26].
This study successfully synthesized uniformly macroporous WO3 in a water bath with NaHCO3 as etchant and carbon spheres as support. For a variety of VOCs, the gas detection capabilities of every sensor were examined. The results demonstrated that the WO3-1%E+Au gas sensor exhibits outstanding gas-sensing performance, including high response and short response and recovery time (tres/trec = 1 s/11 s). In addition, a detailed discussion of the improved sensing mechanism via macroporous structure following etching and Au decorating is provided.

2. Materials and Methods

The reagents used in the experiment are of analytical grade and do not require further purification. Glucose (C6H12O6), phosphotungstic acid hydrate (12WO3∙H3PO4∙xH2O), ethanol (C2H6O), Sodium bicarbonate (NaHCO3) and chloroauric acid (HAuCl4H2O) were purchased from Sinopharm Co. Ltd, Beijing, China.

2.1. Materials Synthesis

The preparation of carbon spheres has been reported in our previous work [29]. A total of 6 g of glucose was dissolved in 50 mL of deionized water and transferred into a 50 mL polytetrafluoroethylene-lined container. This was subsequently placed inside a stainless-steel reactor and heated at 180 °C for 12 h. At the end of the reaction, a black sandy product would be obtained. The product was washed alternately with deionized water and ethanol to wash out impurities. The final product was dried at 80 °C overnight for further experiments. The final carbon sphere template was obtained. The SEM image of carbon spheres can be seen in Figure S1. As depicted, the particle size of carbon spheres was mainly concentrated around 500−600 nm.
In general, 0.886 g phosphotungstic acid hydrate and 0.12 g carbon spheres were dissolved in 50 mL deionized water (DI water) and ultrasonicated for 15 min with constant stirring. The reaction was then carried out in a water bath at 80 °C for 4 h. At the end of the reaction, the precursor was washed six times with DI water and dried at 60 °C. Finally, the precursors were calcinated in air at 550 °C for 2 h at a ramp rate of 2 °C/min. The resulting powder sample was labeled as WO3.
The NaHCO3-etched samples were prepared as follows: in the same manner as described above for the WO3 samples, after adding phosphotungstic acid and carbon spheres to 45.5 mL of deionized water, 4.5 mL of NaHCO3 solution (at a concentration of 1 mg/mL) was also added to the above solution. The synthesized sample was labeled as WO3-1%E.
The WO3-1%E+Au sample was prepared in the same way as the WO3-1%E sample, except that 7.6 μL (0.02 g/mL) of chloroauric acid solution (equivalent to 1 mol% of Au) was added to the solution.

2.2. Materials Characterization

The X-ray diffraction (XRD) peaks were measured by a Bruker D8 Advance (Bruker, Bremen, Germany) operated at 40 kV, 300 mA, using Cu Kα radiation with the wavelength of 1.5418 Å and a scan angle of 20–80°. The morphology and phase composition of the samples were observed by field emission scanning electron microscopy (FESEM, FEI, Hillsborough, NC, USA) and transmission electron microscopy (TEM, Titan G260-300, FEI, Hillsborough, NC, USA). X-ray photoelectron spectroscopy (XPS, AXISULTRA Karatos, Kyoto, Japan) was obtained with a monochromatic Al Kα (1486.71 eV) line under a vacuum condition of ~10-8 Torr at 100 W power. The specific surface area of nitrogen adsorption-desorption was recorded on a Quantachrome Autosorb-iQ (Guoyi Quantum Co., Ltd., Heifei, China). The pore size and its distribution were calculated by the Barrett-Joyner-Halenda (BJH) method.

2.3. Gas Sensor Fabrication and Measurement

The prepared sample was thoroughly mixed with DI water and then ultrasonicated to obtain a slurry. The slurry was carefully applied to the surface of the ceramic tubes with a brush, followed by calcination at 350 °C for 2 h with a heating rate of 1 °C/min. After cooling to room temperature, a heating wire was carefully inserted into the ceramic tube. The ceramic tube and the inserted heating wire were fixed on a six-legged base. To stabilize the electrical properties of the prepared sensors, the assembled devices were aged for 5–7 days.
The devices were evaluated in a static system in a 1 L test chamber under controlled conditions of 25 °C and 30 ± 5% relative humidity. The working temperature of the device was adjusted by an internal heating resistance wire. The output resistance of the device was continuously monitored using a digital resistance meter (Fluke 8846A). The resistance of the sensor stabilized in the air environment, at which point the resistance value was marked as Ra. A liquid corresponding to the concentration of the test gas was withdrawn using a micro-syringe [30,31], injected into the 1 L test chamber, and mixed homogeneously with air. The sensor was then placed into the test gas chamber. After the resistance of the sensor in the test chamber stabilized, the resistance value was marked as Rg. Finally, the sensor was placed into a clean air chamber to return the resistance value to its initial state. The response of the gas sensor to the target gas is identified as the ratio (Ra/Rg) between the resistance in air (Ra) and the resistance value in the target gas (Rg). The response time (tres) and recovery time (trec) of the sensor are determined based on the time required for the sensor to reach 90% of the total change in resistance exposed to the target gases and fresh air, respectively [32].

3. Results

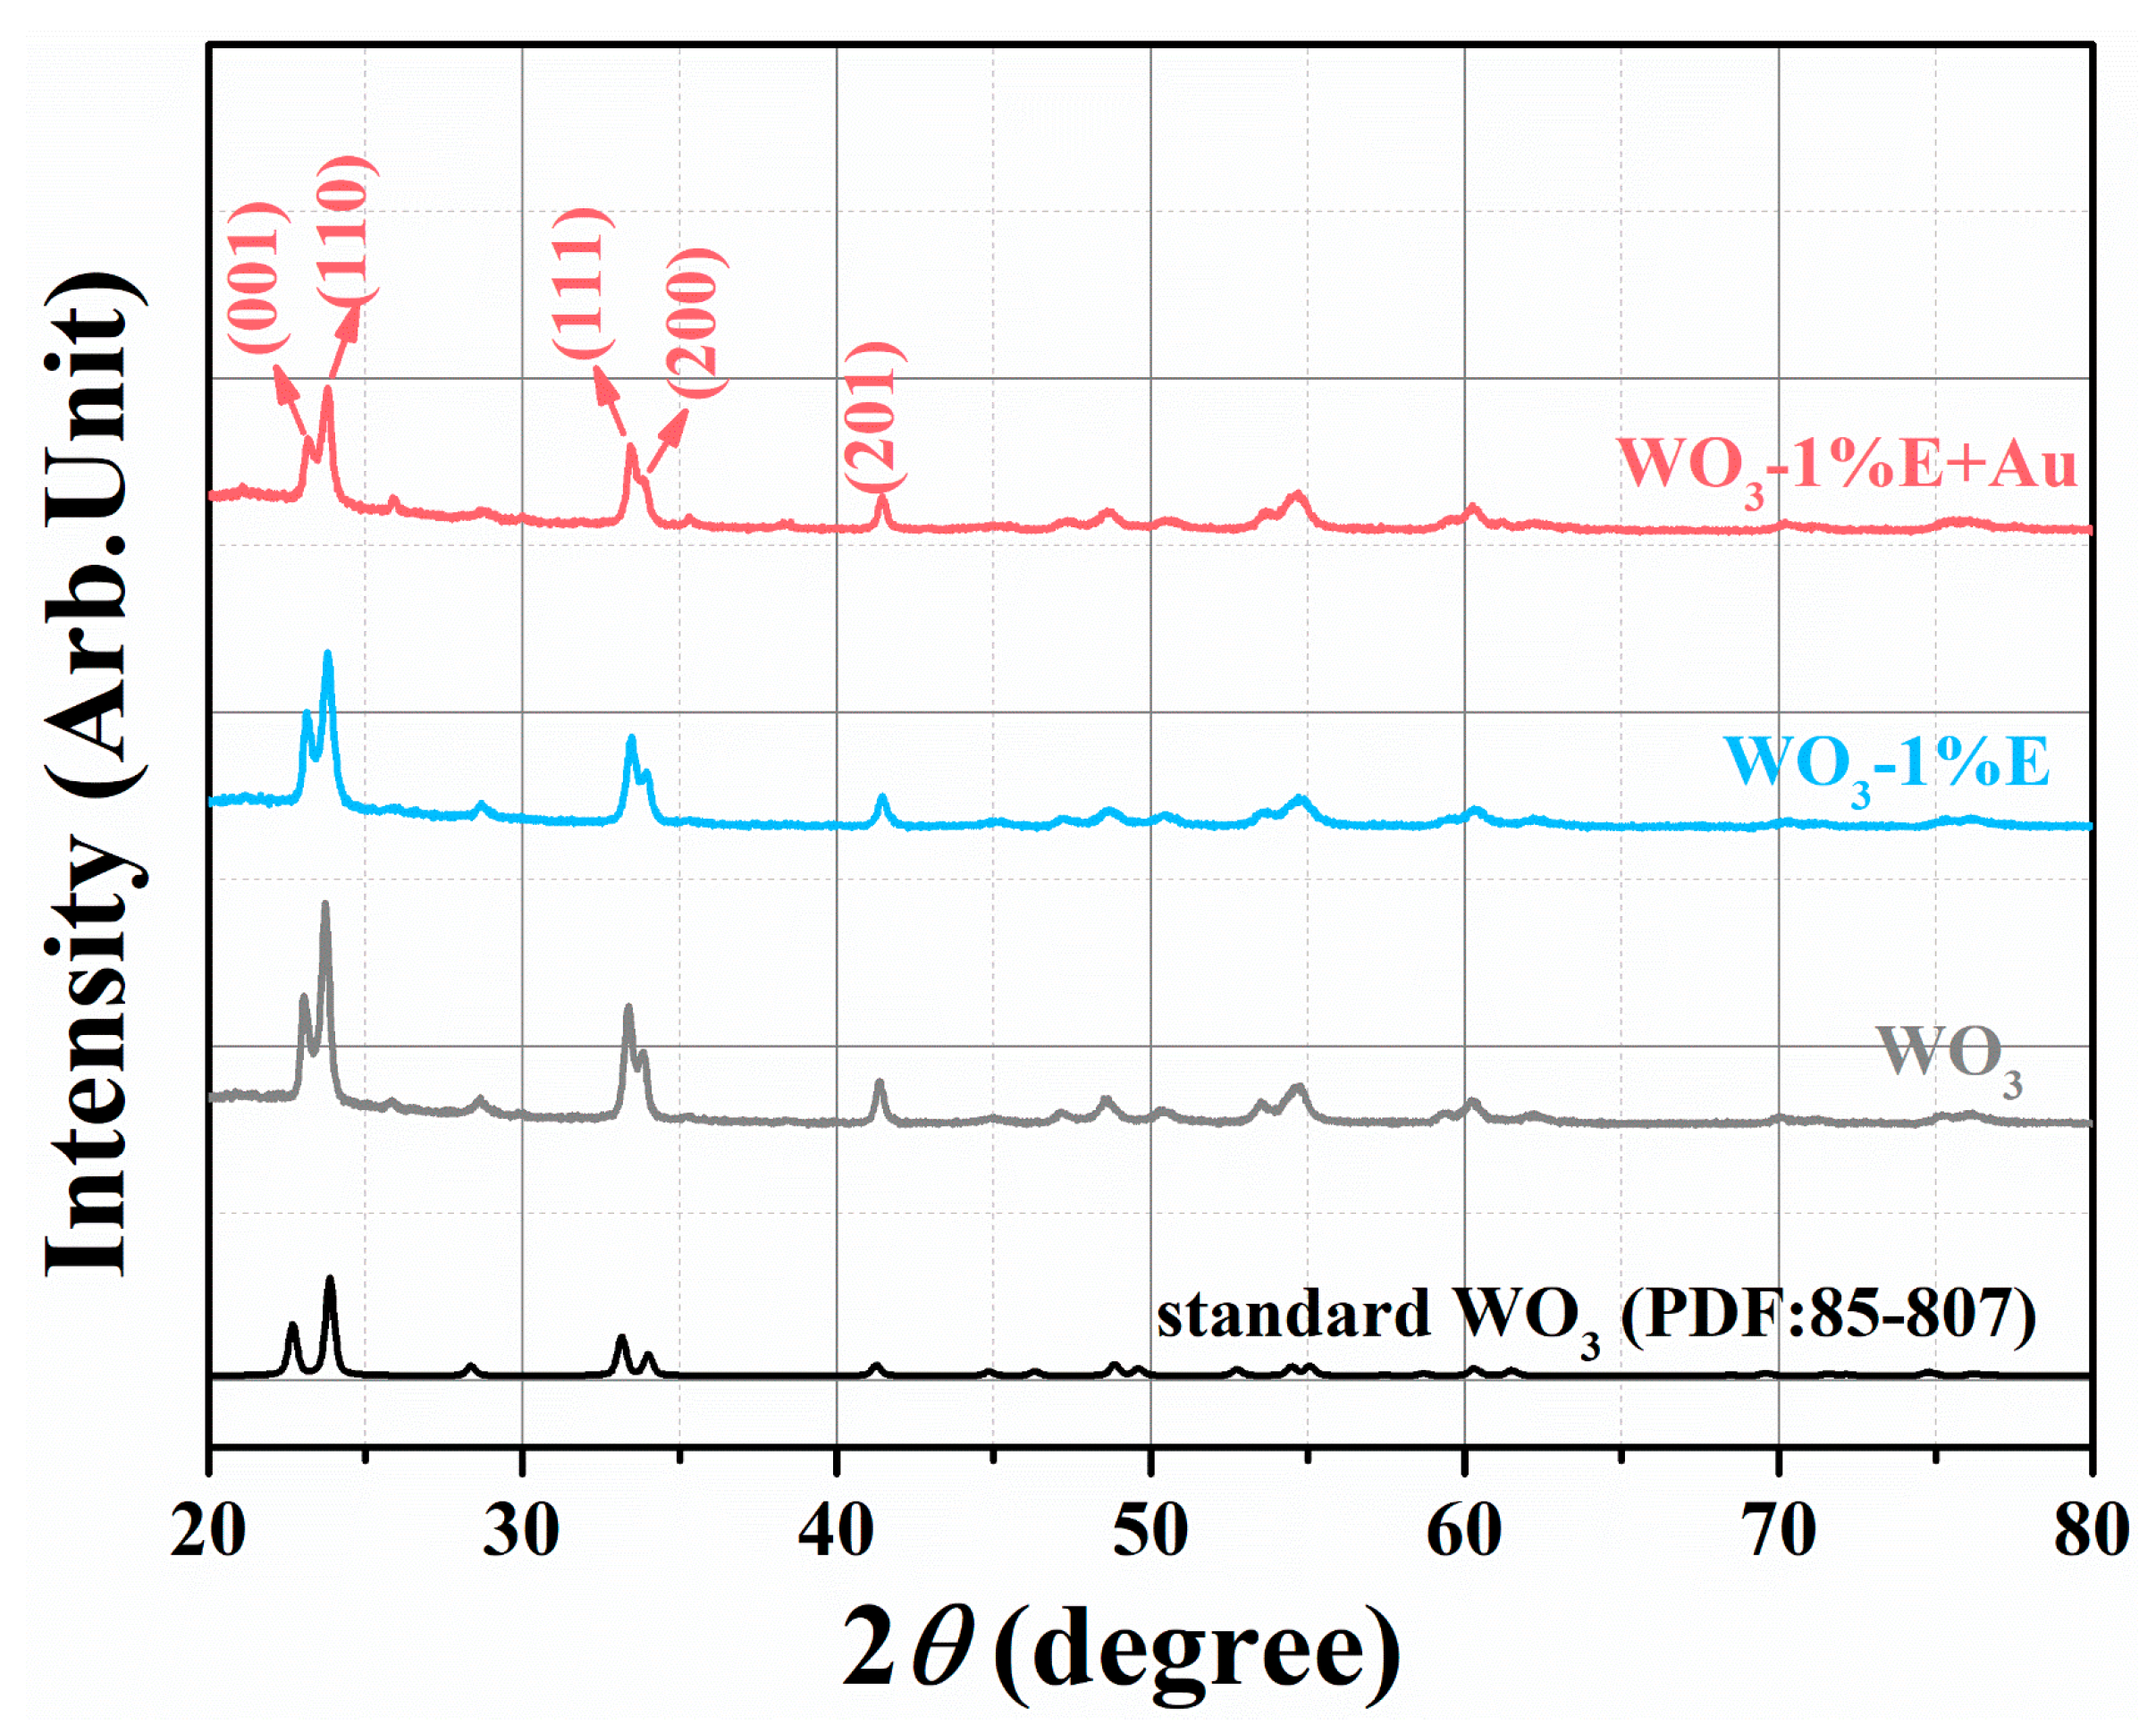
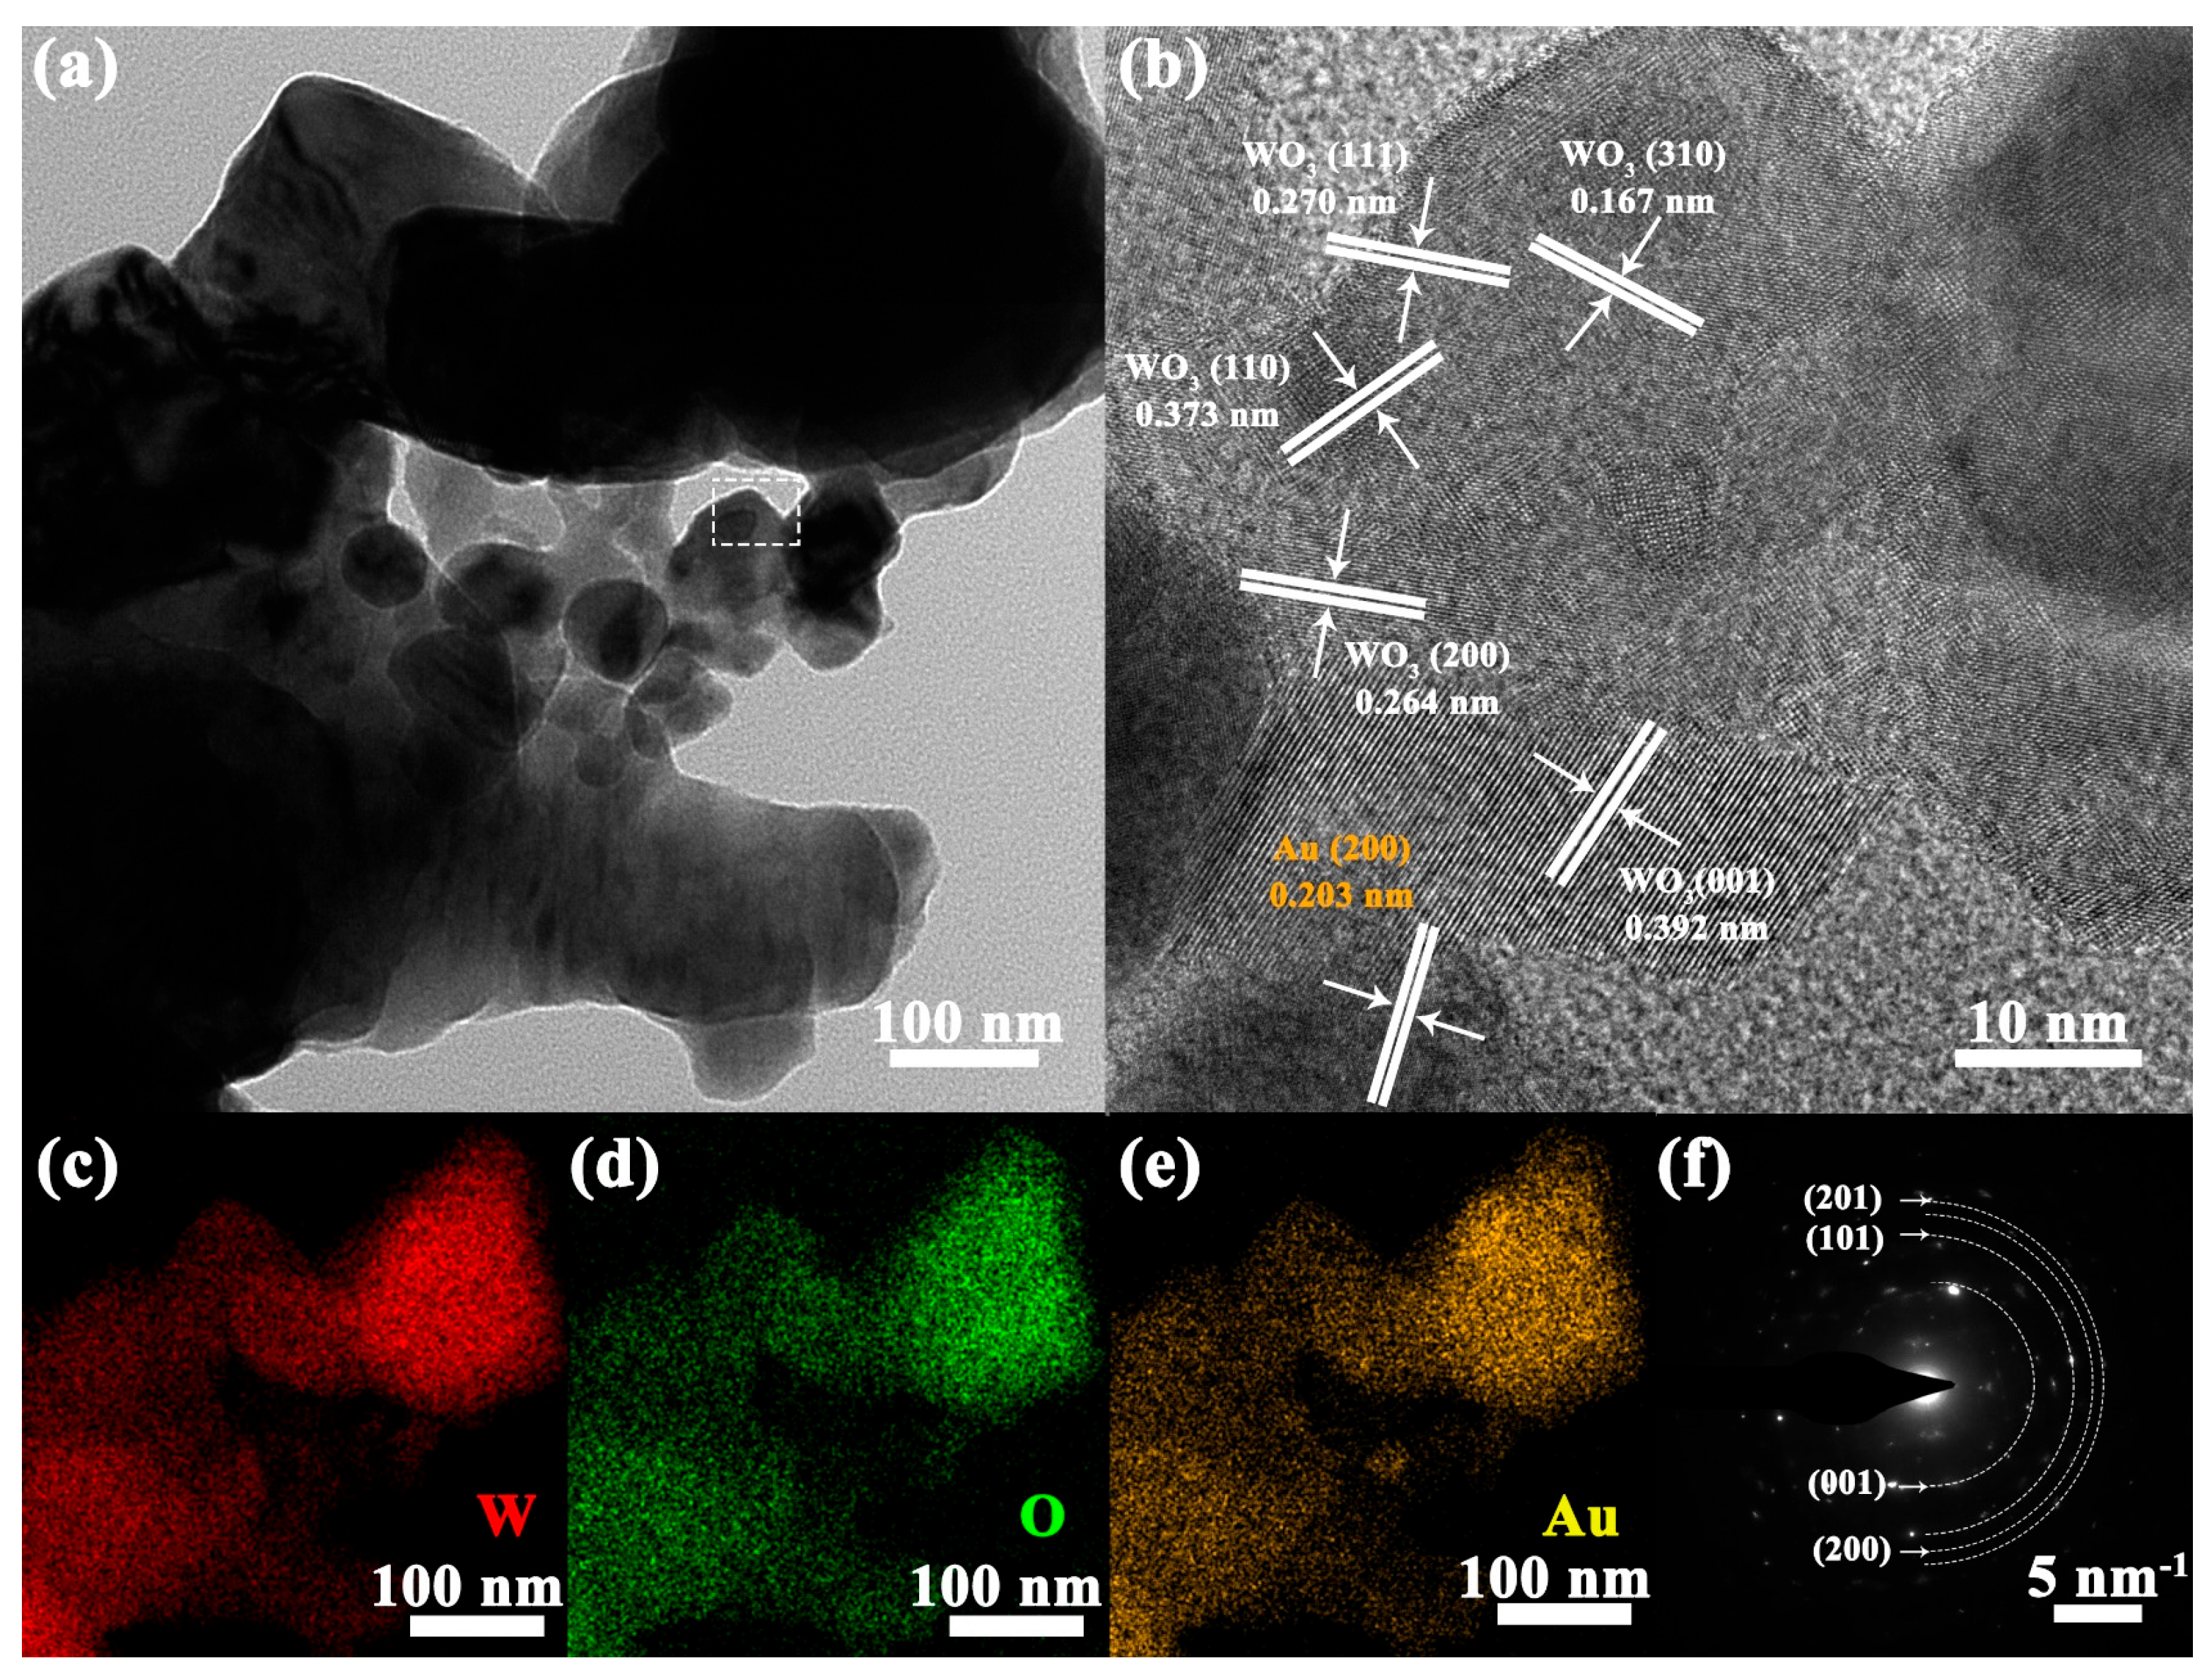
3.1. Structural and Morphological Characteristics

The crystalline phases of all the samples were characterized by XRD. In Figure 1, the diffraction peaks of WO3 can be categorized as monoclinic WO3 (PDF: 85-807) with lattice parameters of a = 7.297 nm, b = 90.91 nm, and c = 7.688 nm. No impurity phases were detected, implying that the material is of high purity. For the WO3-1%E+Au sample, there was no diffraction peak corresponding to the Au element due to the low addition of Au (1 mol%). According to the Debye-Scherrer formula, the grain sizes of all samples are approximately 34.73 nm, 24.36 nm, and 26.21 nm [33]:
D = 0.9 λ / β c o s ( θ )
Here, λ is the wavelength of X-ray radiation, λ = 0.1542 nm, β is the full width at half maximum (FWHM), and θ is the Bragg diffraction angle. Compared to the WO3 sample, WO3-1%E and WO3-1%E+Au samples exhibit smaller grain sizes. A smaller grain size usually indicates a more compact and ordered crystal structure with higher lattice strain [34,35]. Smaller grain size also produces a larger surface area at the grain boundaries, which provides more active sites and reactivity [36] and effectively promotes charge transfer and surface reaction with the target gas [37].
The morphology of the prepared samples was evaluated by FESEM. Figure 2a,b shows the unetched WO3 samples. The WO3 samples prepared using phosphotungstic acid and carbon spheres produced WO3 particles with an average size of about 200−300 nm after calcination. The carbon spheres did not act as supporting templates in the morphology formation of the WO3 samples, mainly due to the weak interaction between the carbon sphere templates and phosphotungstic acid, which was not sufficient to affect the growth morphology of the WO3 nanoparticles.
WO3-1%E samples with uniform macroporous structure were obtained after the addition of etchant NaHCO3 to the reaction solution (Figure 2c,d and Figure S2). This may be attributed to the fact that NaHCO3, as a strong alkaline and weakly acidic etchant, dissolves and binds the boundaries of independently grown WO3 nanoparticles to each other, encapsulating the carbon sphere templates. After removing the carbon spheres by sintering, the porous structured WO3 consisting of boundary fuzzy particles was finally obtained (Figure 2d). The SEM images of the WO3-1%E+Au samples are shown in Figure 2e,f. The morphology of the samples was not much affected by the introduction of chloroauric acid, and the particle morphology of the samples still maintained a uniform porous structure.
In addition, in order to investigate the effect of NaHCO3 content on the product morphology, different concentrations of NaHCO3 (0.5% NaHCO3, 1% NaHCO3, 3% NaHCO3, and 5% NaHCO3) were selected and added to the reaction system, and the SEM images of the samples obtained are shown in Figure S3. It can be seen that at lower NaHCO3 concentrations, the etching effect on WO3 particles is not obvious, and the particle boundaries are not effectively bound. With the increase in NaHCO3 concentration, the size of WO3 particles decreases gradually. It is worth noting that when the concentration of NaHCO3 rises, the inter-particle bonding breaks down, causing the carbon spheres to lose their ability to sustain the sensing materials.
TEM and HRTEM measurements were used to analyze the morphology and structure of the WO3-1%E+Au sample. As shown in Figure 3a, the sample was formed by the accumulation of particles. Figure 3b shows the HRTEM image within the white dashed box in Figure 3a, where the crystal spacing corresponding to the WO3 (111), (310), (110), (200), and (001) crystal planes and the Au (200) crystal plane can be clearly observed. In addition, the EDS (Energy Dispersive X-ray Spectroscopy) maps in Figure 3c–e show the distribution of tungsten (W), oxygen (O), and small amounts of gold (Au) in the WO3-1%E+Au sample. It can be seen that the Au element is uniformly distributed in the WO3 sensitive matrix. Figure 3f shows a typical pattern of WO3 where characteristic monoclinic reflections are observed, corresponding to the (201), (101), (200), and (201) crystal planes of WO3.
XPS detection was used to determine the chemical valence states of the elements in the samples. For the WO3-1%E+Au sample, a wide scan XPS spectrum was obtained between 0 and 1100 eV (Figure 4a), and the peaks were observed matching the elements C, W, O, and Au. The XPS measurements were calibrated using the characteristic carbon peak (C 1s) with a binding energy of 284.8 eV. In the XPS spectrum (Figure 4b), the peaks matching the W element can be observed at binding energies of 41.3 eV, 37.8 eV, and 35.7 eV, corresponding to W6+ 5p5/2, W6+ 4f5/2, and W6+ 4f7/2 [38,39].
In Figure 4c, the O 1s peak of WO3-1%E+Au exhibits asymmetry and can be decomposed into two distinct components: lattice oxygen (OI) with lower binding energy and surface oxygen (OII) with higher binding energy [40,41]. Surface oxygen can be attributed to oxygen species such as O O2−, or OH on the WO3 surface [42]. These oxygen species play a significant role in improving the gas-sensing performance. The O 1s spectra of WO3 and WO3-1%E are shown in Figure S4. The calculated content of OII in WO3-1%E+Au (47.62%) is higher than that of WO3 (46.04%) and WO3-1%E (46.76%). This suggests that the Au loading on the surface of WO3 enhances the adsorption of the oxygen species, thus providing more opportunities for the absorption of the detected gas. Figure 4d depicts the Au 4f peaks for WO3-1%E+Au. The peaks observed at 83.7 eV and 87.4 eV correspond to Au 4f7/2 and Au 4f5/2, respectively, which can predominantly be ascribed to the presence of metallic Au0 [43].
The measured BET surface areas of WO3, WO3-1%E, and WO3-1%E+Au are 22.03, 28.25, and 26.55 m2/g, respectively (Figure 5a–c). All N2 adsorption-desorption isotherms showed typical IV isotherms with hysteresis loops in the high relative pressure range [44]. The pore size distribution curves of all samples separately are shown in Figure 5d–f. The BJH pore size distribution curves all peaked around 50 nm, indicating that both samples have microporous structures. These microporous structures are due to the stacking of WO3 particles, which is favorable for the transmission of the detected gas and contact with the sensing material.

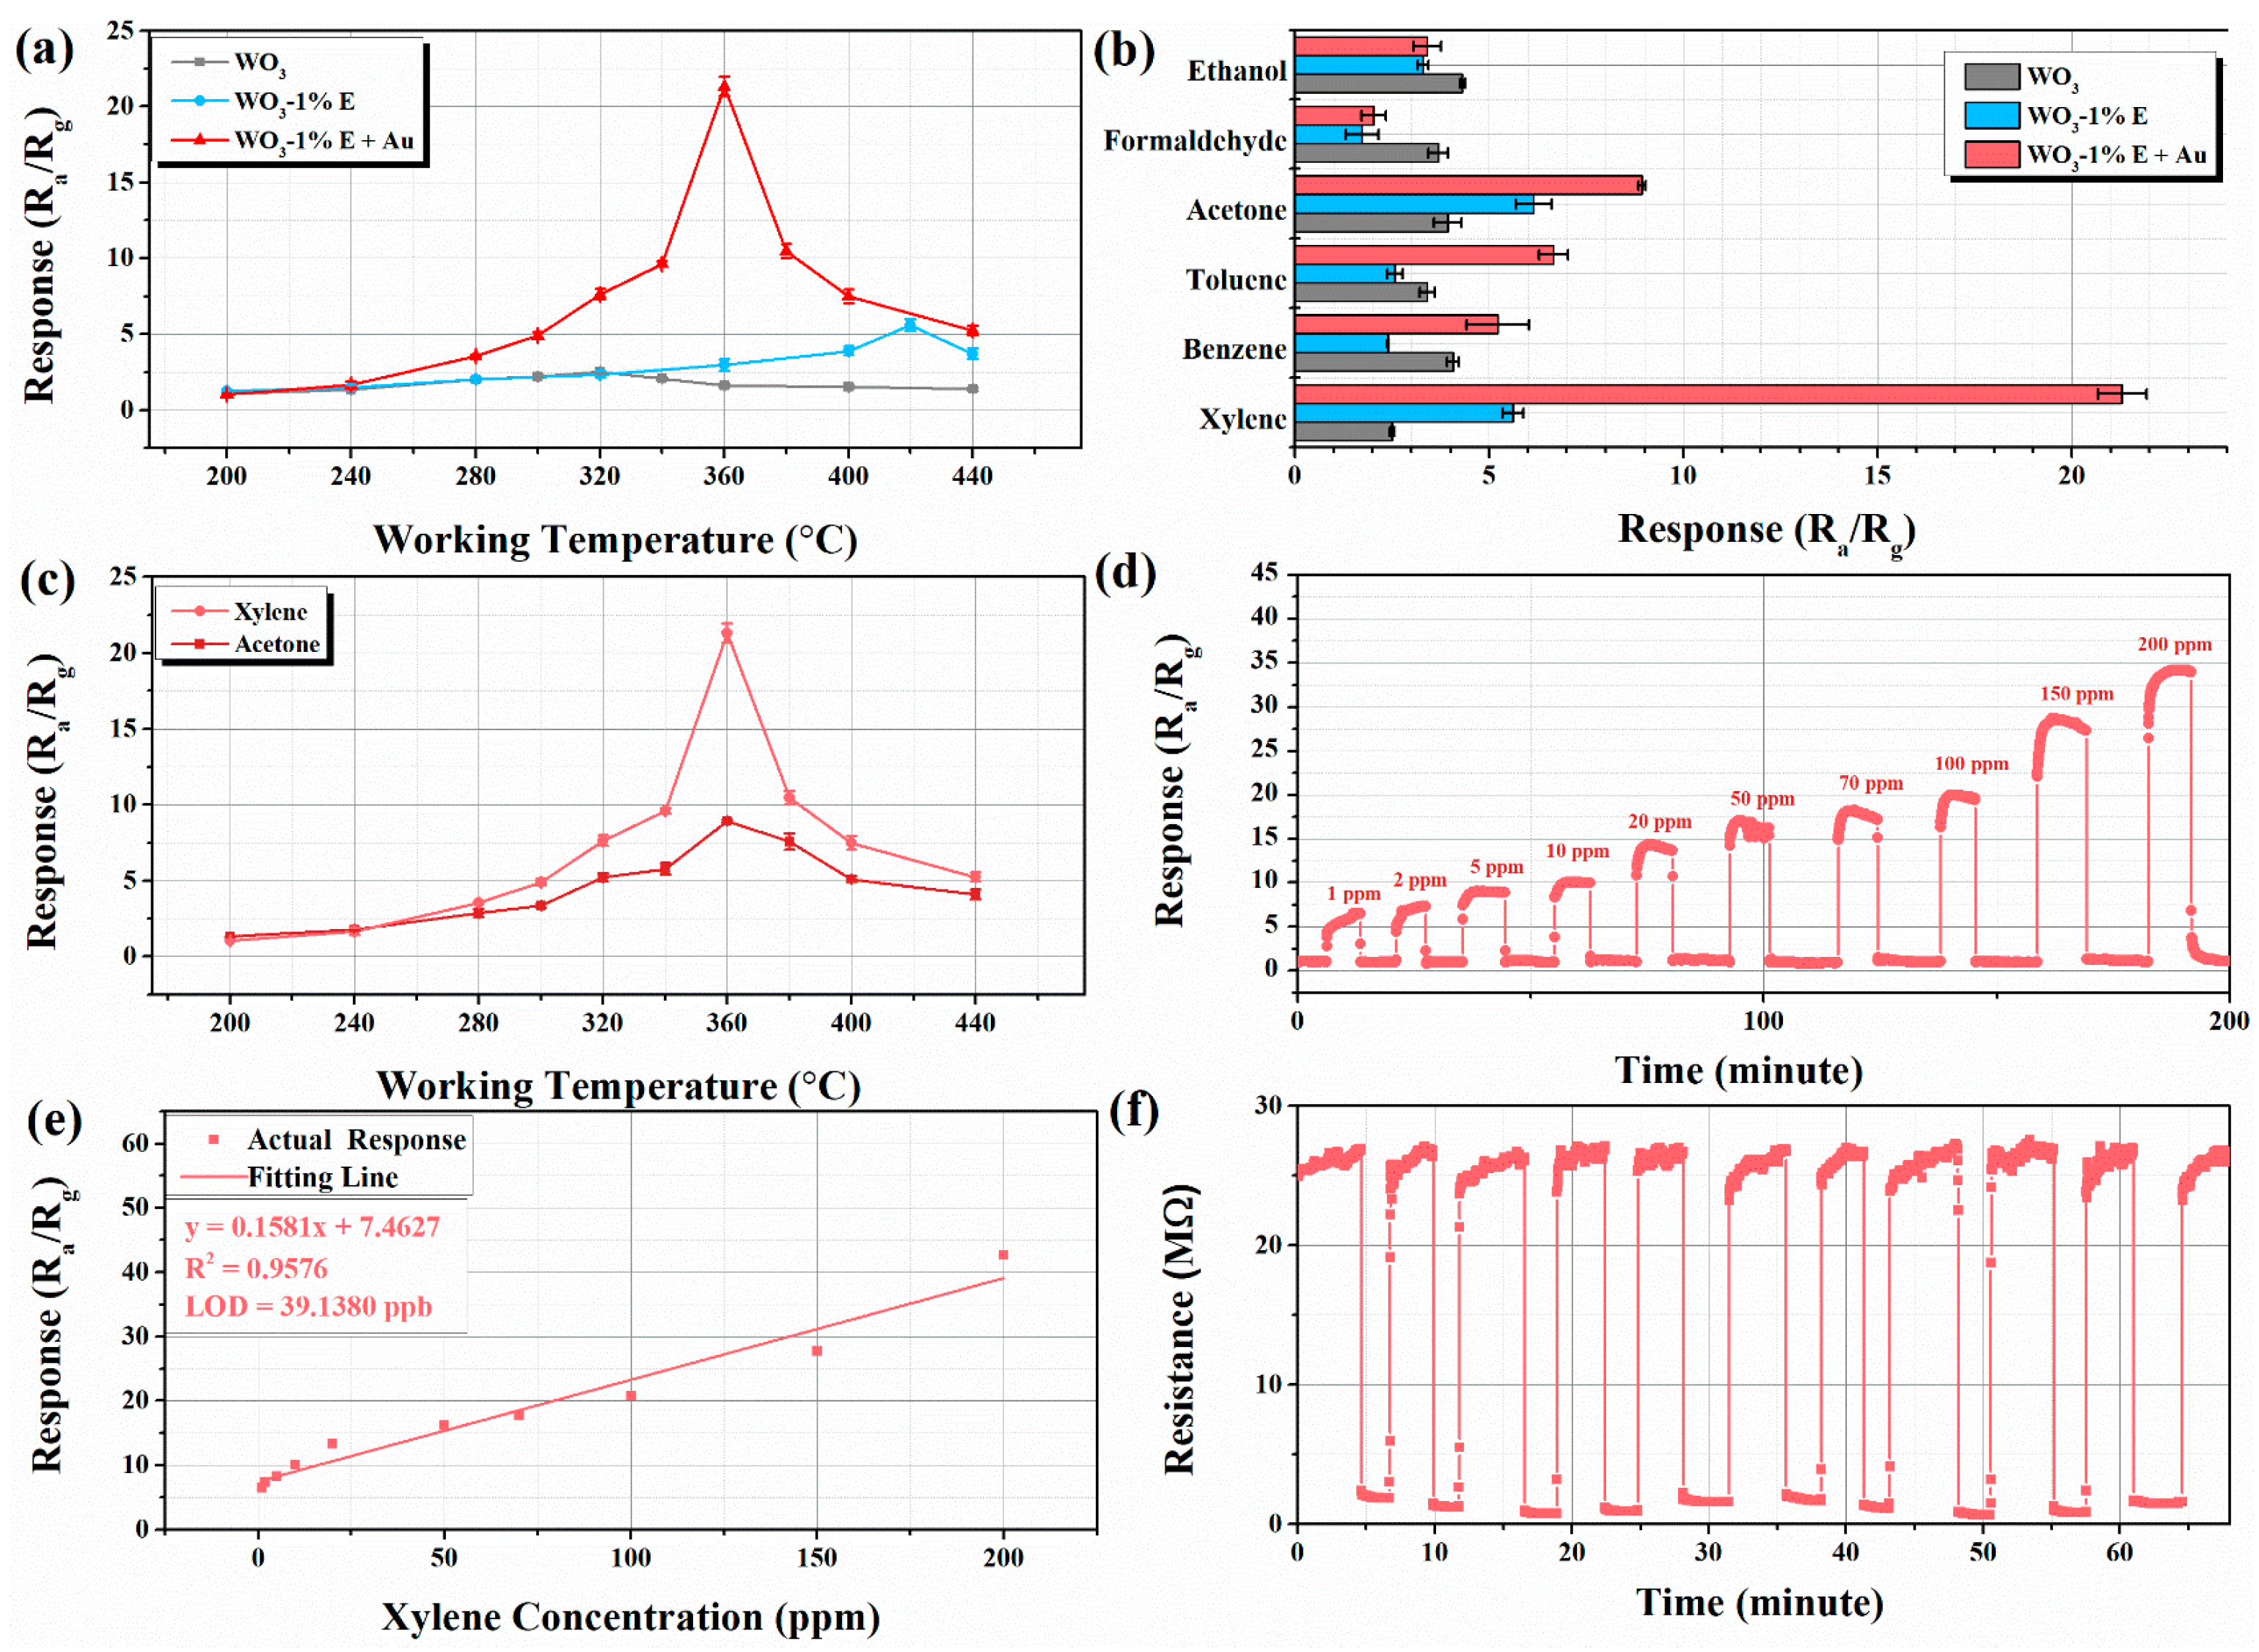
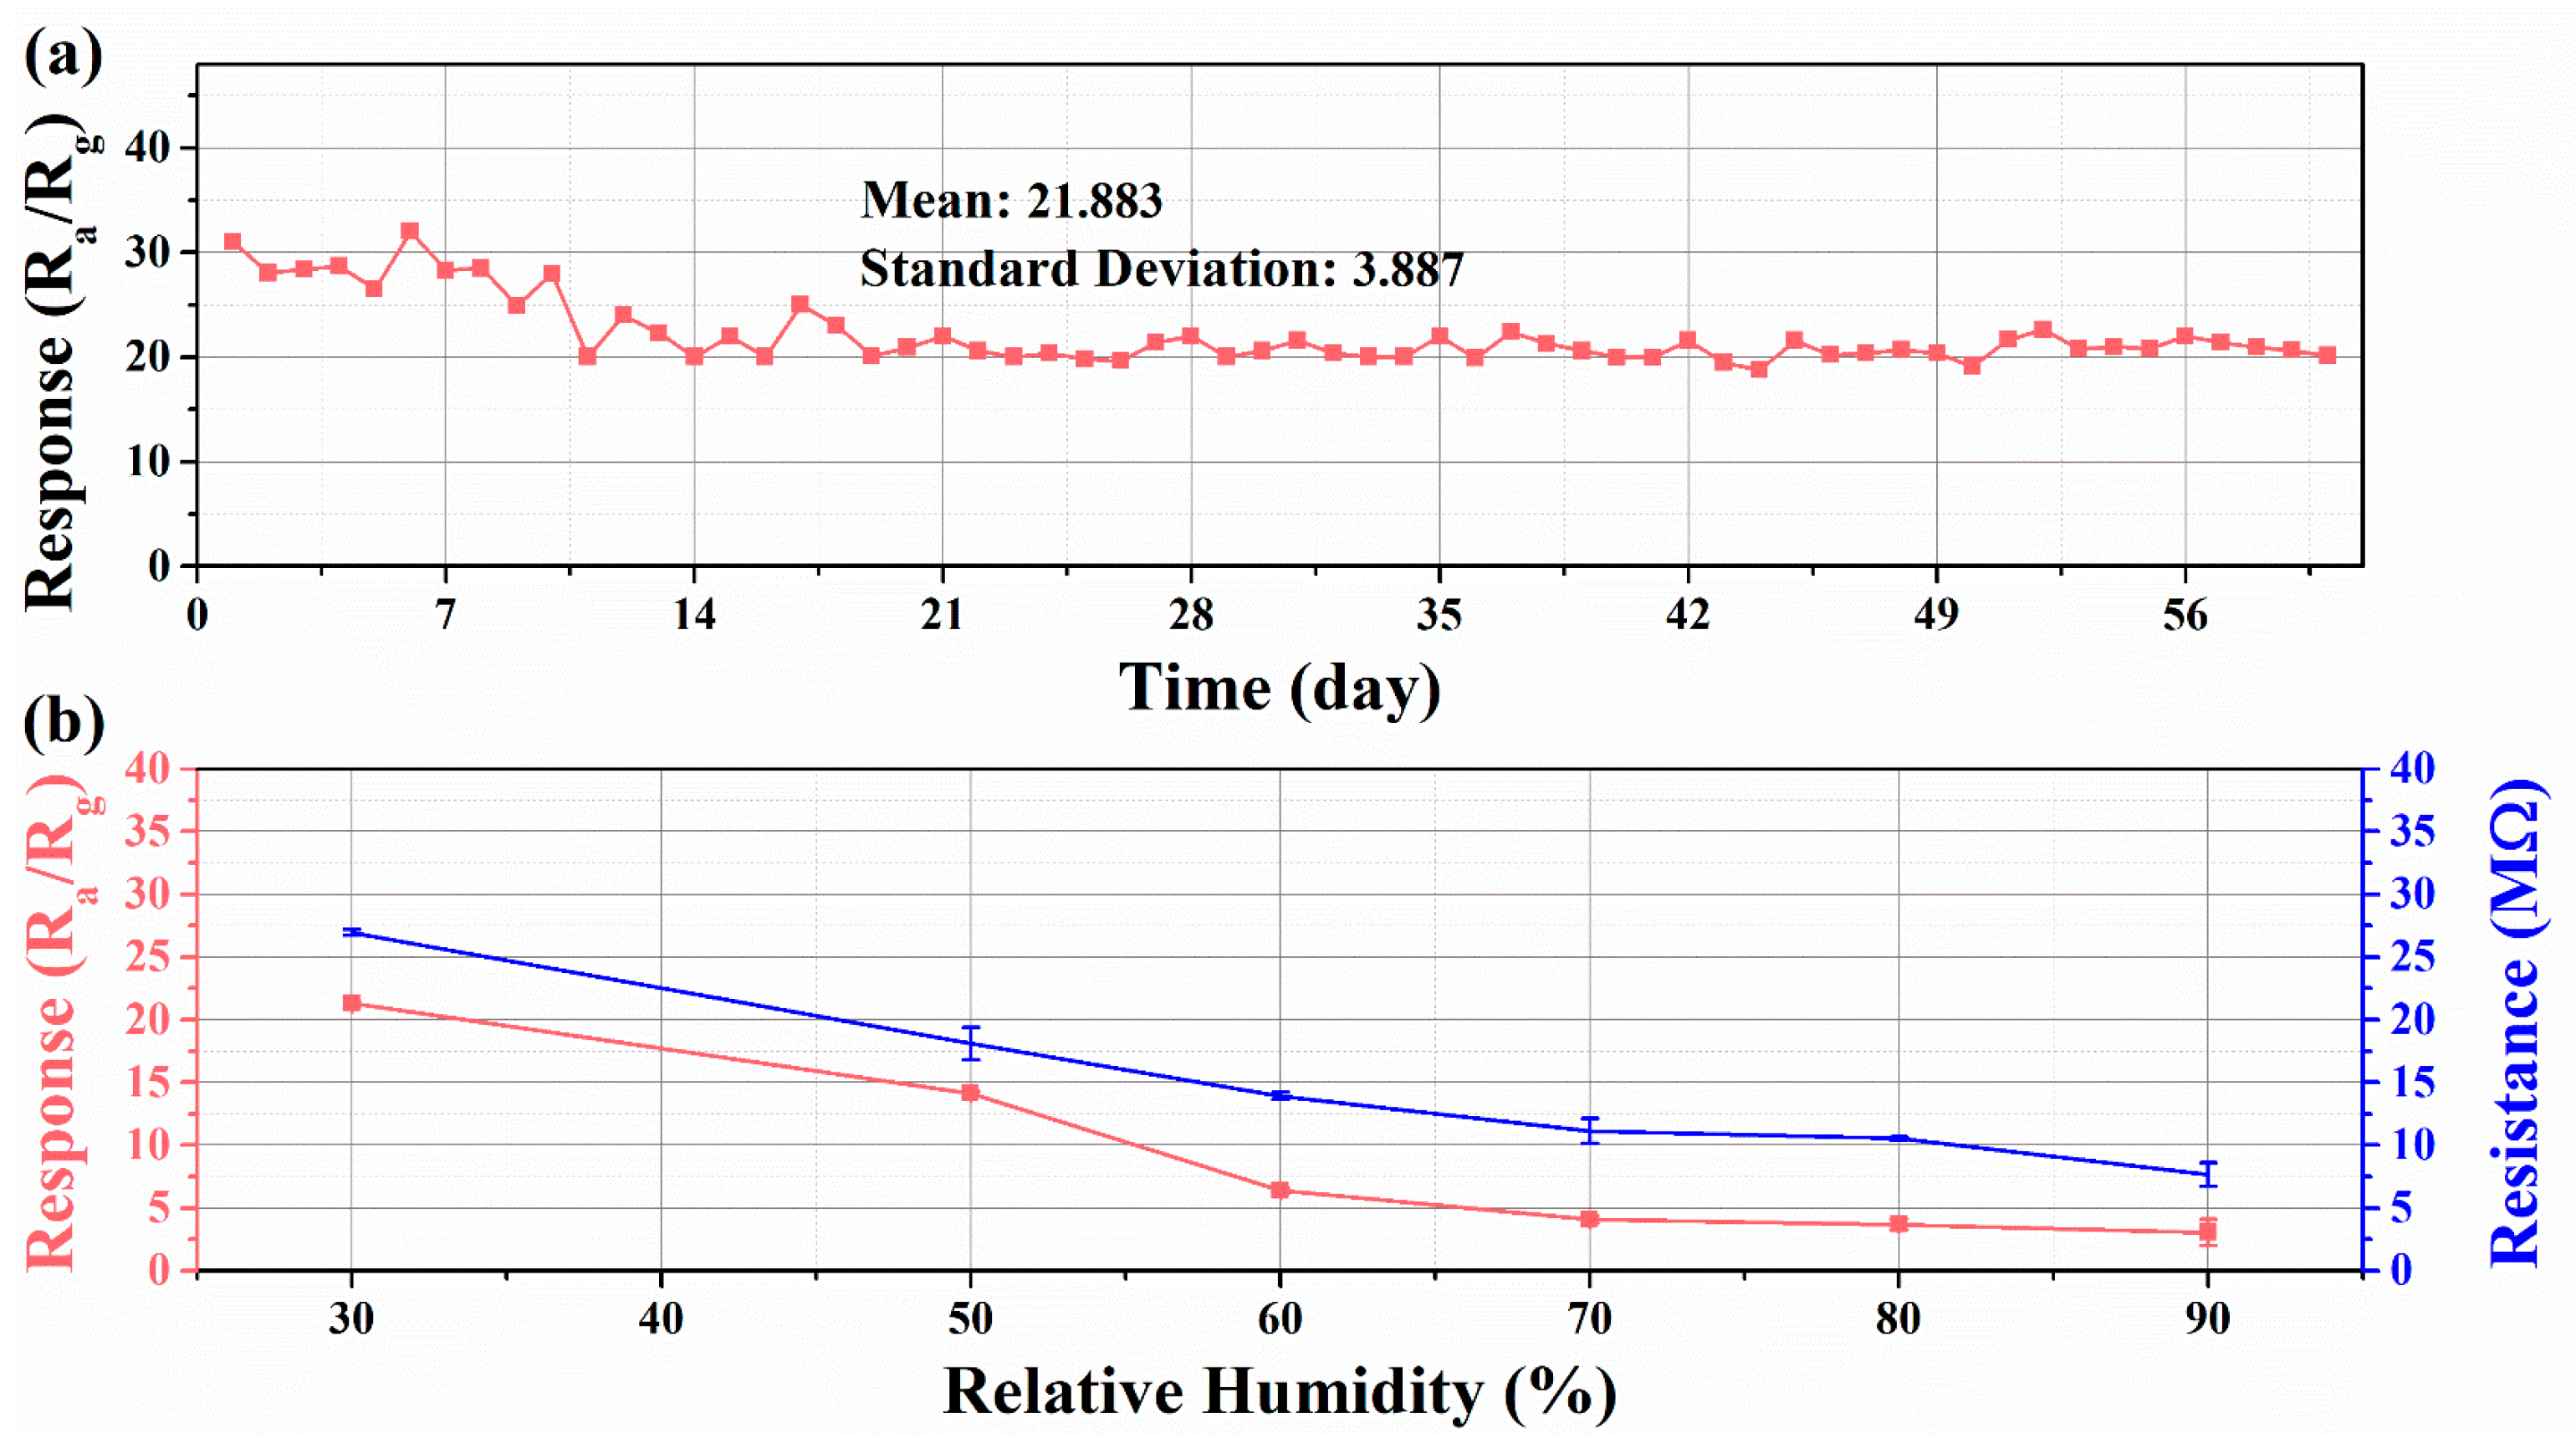
3.2. Gas Sensing Performance

Figure 6a shows the response values of all sensors to xylene at different operating temperatures. All sensors showed a tendency to increase and then decrease as the operating temperature increased. Compared with other sensors, WO3-1%E+Au had the highest response value of 21.3 to 100 ppm xylene at the optimum working temperature of 360 °C. In addition, the gas-sensitive properties of WO3 etched with different concentrations of NaHCO3 and decorated with different amounts of Au to xylene were analyzed, as shown in Figures S5 and S6. The results showed that 1% NaHCO3 and 1% Au was the optimal ratio when the sensor obtained the best sensing performance to xylene.
The selectivity of the sensor is of great value in practical applications. Figure 6b shows the selectivity of the sensors towards 100 ppm of different target gases at 360 °C, including xylene, benzene, toluene, acetone, formaldehyde, and ethanol. In the figure, the response value of WO3-1%E+Au sensor for xylene is significantly higher than the other gases, which indicates its high selectivity towards xylene. It is noteworthy that WO3 and WO3-1%E exhibited a higher selectivity to acetone than the WO3-1%E+Au sensor. After the introduction of Au, the selectivity of the sensor to the gas changed, indicating that Au facilitates the response to xylene. Figure 6c presented that the WO3-1%E+Au sensor exhibited higher response values for xylene than for acetone over a wide temperature range of 280–440 °C, indicating the excellent selectivity of the WO3-1%E+Au sensor for xylene.
Figure 6d shows the dynamic sensor response of the WO3-1%E+Au sensor at 360 °C as a function of different xylene concentrations. As depicted, the response of the sensor increased with increasing gas concentration. At the end of each concentration detection, the device resistance value was fully recovered to the initial state after the removal of xylene. As shown in Figure 6d, xylene concentrations as low as 1 ppm can be detected with a response value of 6.48. A linear relationship (y = 0.1581x + 7.4627) was fitted based on the relationship between the sensor response value and the xylene concentration (Figure 6e). The correlation coefficient R2 of the fitted results is 0.9576, indicating a very good fit. According to the fitted curve, the theoretical limit of detection (LOD) [45,46] for the sensor can be calculated as 39.138 ppb.
The repeatability of the WO3-1%E+Au sensor was tested for 10 cycles at 360 °C, and the resistance signal curve is shown in Figure 6f. It can be seen that the fabricated sensor responds and recovers quickly to 100 ppm xylene with no significant fluctuation in the response resistance, which indicates that the sensor has good reproducibility.
Considering the importance of the response and recovery speeds for the practical application of the sensor, the response/recovery time of the prepared sensors was examined as shown in Figure 7a–c. The response/recovery times were tested for 100 ppm xylene at their respective optimal operating temperatures: 17/127 s (WO3), 12/16 s (WO3-1%E), 1/11 s (WO3-1%E+Au). The above studies show that the NaHCO3 etchant-treated WO3 (namely, WO3-1%E and WO3-1%E+Au) sensitive materials have faster response/recovery. This is related to the uniform macroporous structure of the sensitive materials, which is favorable for the contact between the gas and the sensitive materials and the transport of the gas. The introduction of the Au element as a catalyst accelerated the reaction of xylene gas with the sensitive materials, resulting in the fastest response/recovery for WO3-1%E+Au.
The WO3-1%E+Au sensor was tested continuously for 60 days under laboratory conditions to figure out the long-term stability. The variation of the response value with time was plotted in Figure 8a. The response values of the sensor fluctuated slightly in the first 20 days but gradually stabilized over time. There is no significant decay in the response value during the measurement. The mean and standard deviation of the response values within 60 days were calculated to be 21.883 and 3.887, respectively, indicating that the sensor can be used for xylene detection in practical situations and the sensing performance remains stable [47].
The effect of humidity on sensor performance should not be ignored, as sensors are often exposed to different humidity environments in actual test scenarios [48]. Figure 8b shows the response and resistance changes of the WO3-1%E+Au sensor to 100 ppm xylene at various relative humidities. As depicted, the initial resistance and response value decreases to some extent as the relative humidity increases. The reason for this phenomenon is that water molecules react with adsorbed oxygen to form hydroxyl groups on the surface of the sensitive material and release electrons, so the resistance value of the sensor decreases in high-humidity environments [49,50]. In addition, water molecules have a competitive relationship with xylene gas [51], so the response value of the sensor deteriorates in high-humidity environments.

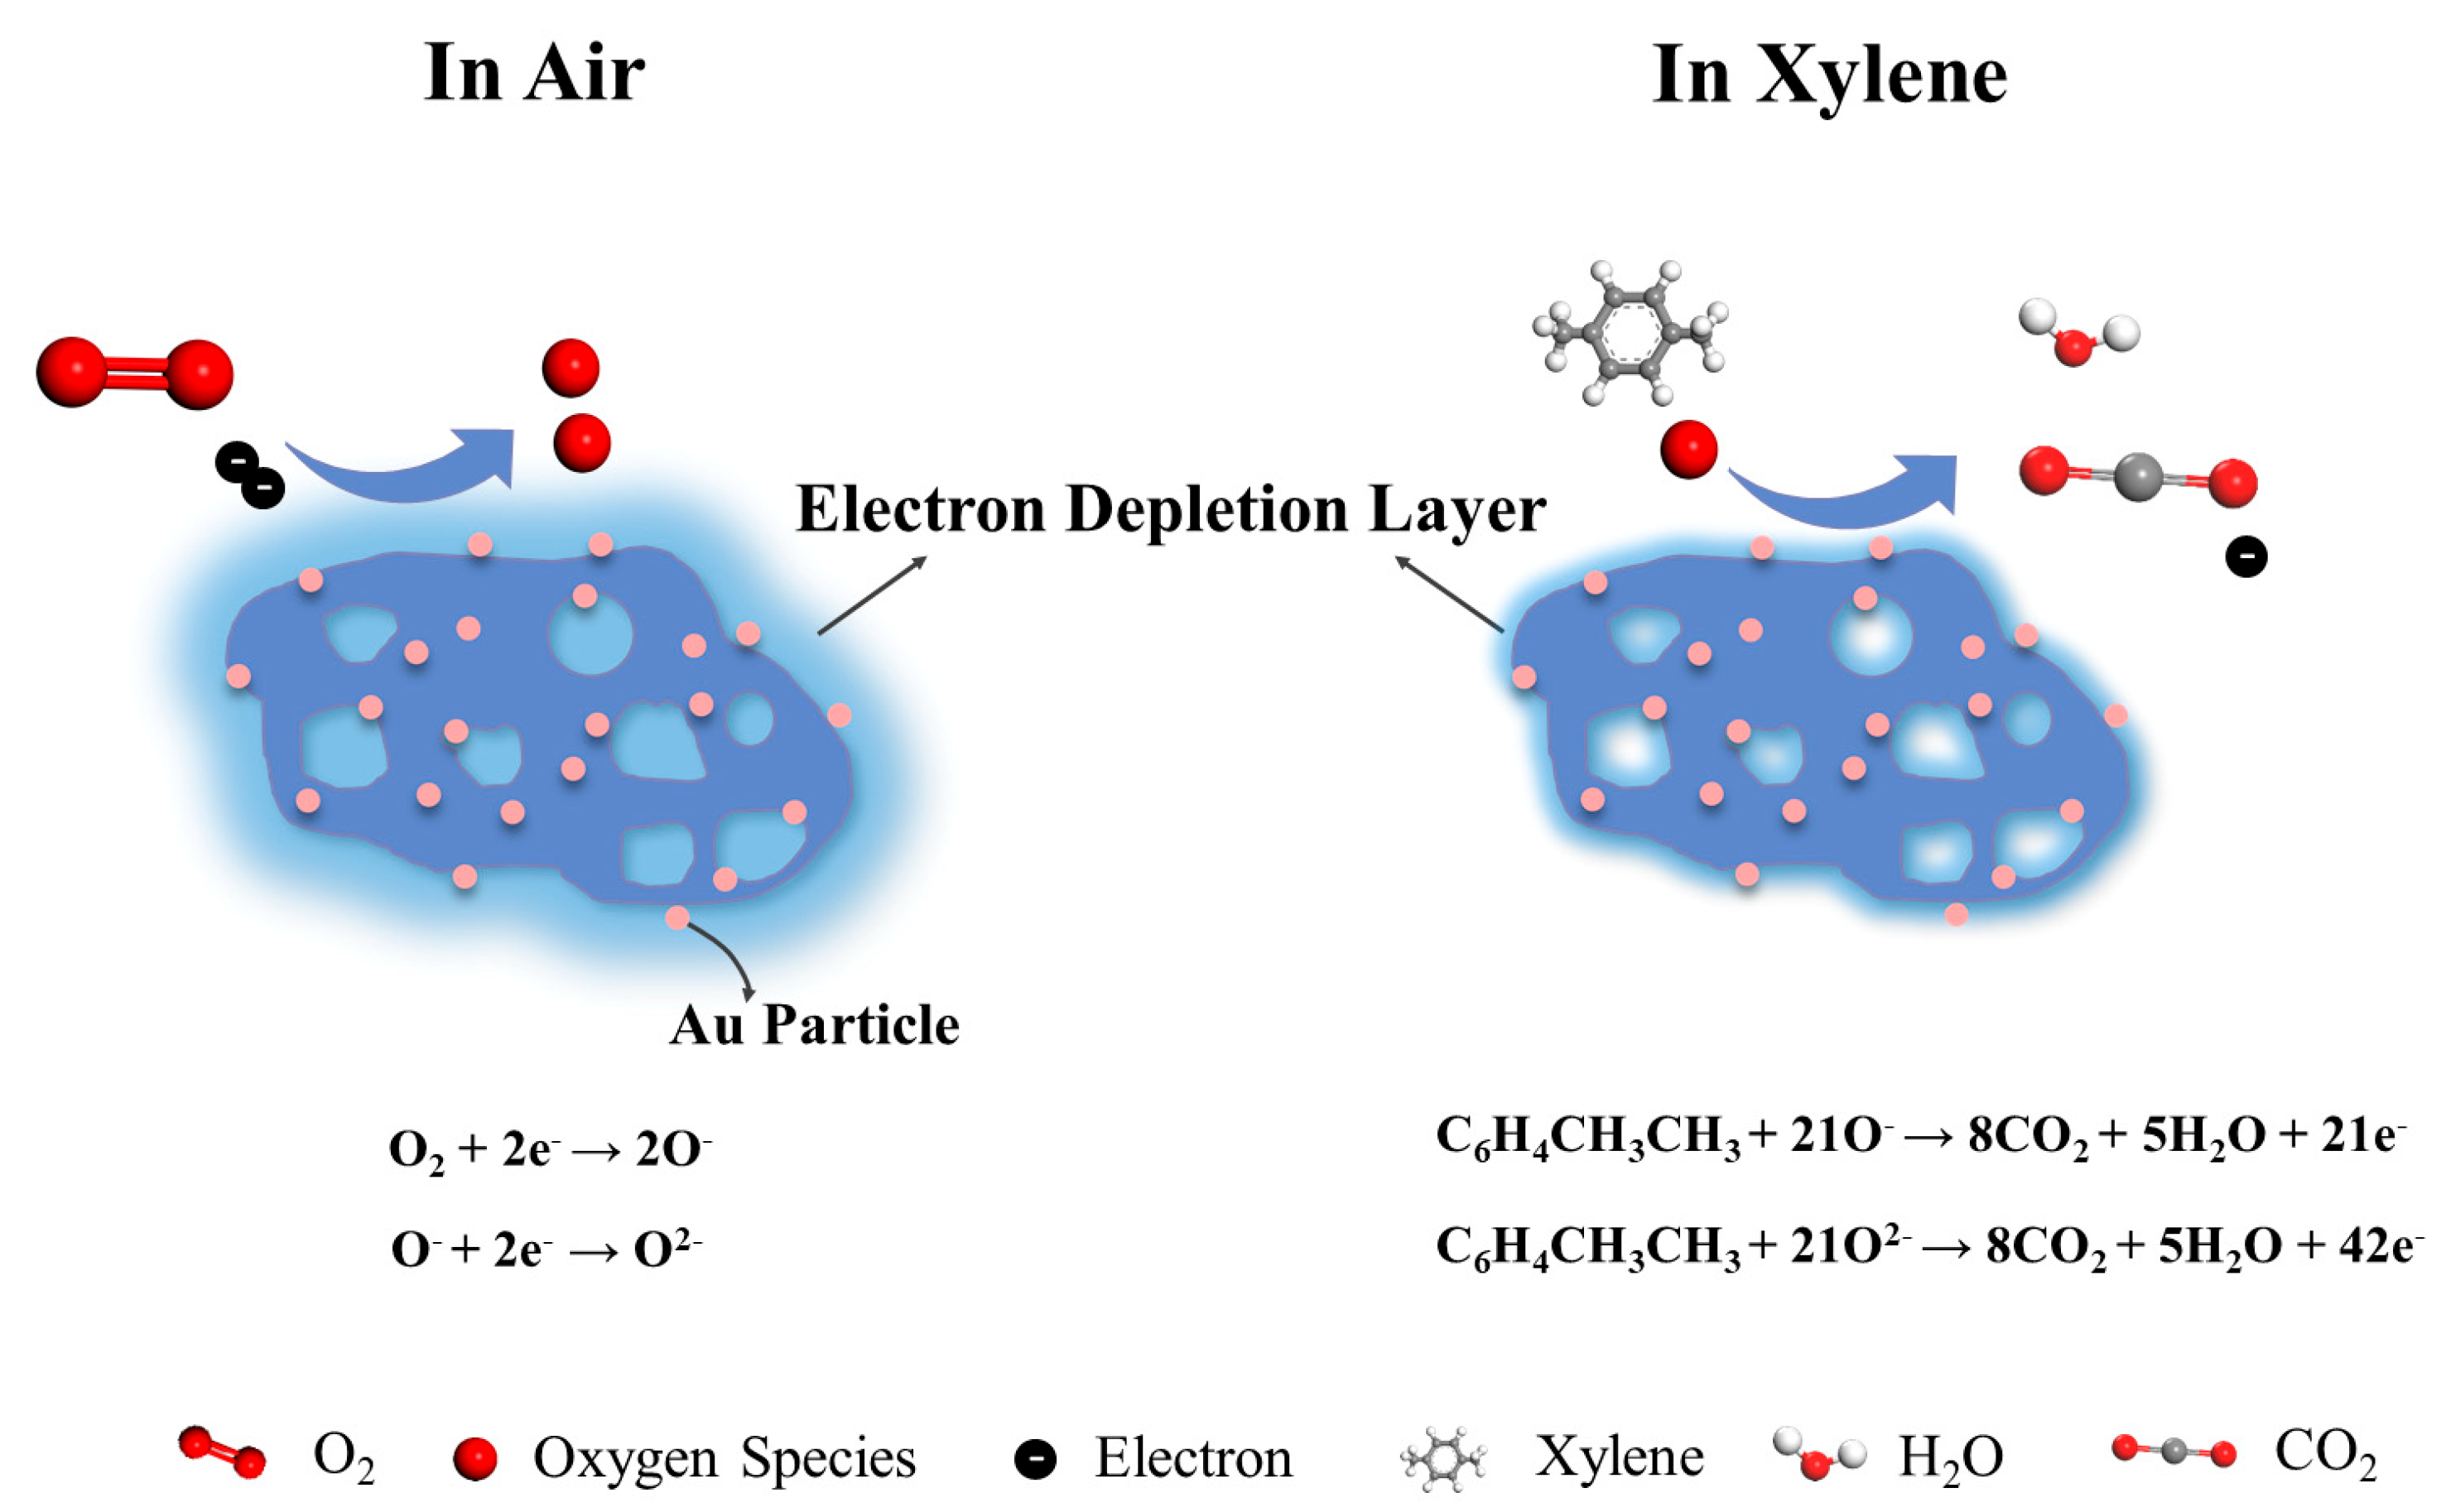
3.3. Sensing Mechanisms

As an n-type MOS, the main carriers in WO3 are electrons, and WO3 primarily relies on the surface interaction between the adsorbed oxygen and the target gas to generate electron transfer and cause resistance changes. The whole sensing and detection process involves a sequence of reactions of adsorption, oxidation, and desorption (Figure 9). When exposed to air, WO3 absorbs oxygen molecules from the air, and electrons in the WO3 conduction band will be captured by the absorbed oxygen to form oxygen species ions (O2, O and O2−). The reaction process can be described using the following formulas [52]:
O 2 g a s O 2 ( a d s )
O 2 a d s + e O 2 a d s ( T < 100   ° )
O 2 a d s + e 2 O a d s ( 100   ° C < T < 300   ° C )
O a d s + e O 2 a d s ( T > 300   ° C )
Upon exposure to a reducing gas such as xylene, the xylene molecules will interact with the oxygen species adsorbed on the surface and release the captured electrons back into the conduction band. This results in a decrease in the thickness of the electron depletion layer, an increase in conductivity, and a corresponding decrease in sensor resistance. The reaction between xylene and oxygen species can be expressed by the following formulas [53]:
C 6 H 4 C H 3 C H 3 a d s + 21 O a d s 8 C O 2 + 5 H 2 O + 21 e
C 6 H 4 C H 3 C H 3 a d s + 21 O 2 a d s 8 C O 2 + 5 H 2 O + 42 e
The enhanced gas sensing performance of WO3-1%E+Au could be attributed to the following mechanisms:
NaHCO3 etching causes defects on the WO3 surface, which increases the specific surface area and provides more active sites for gas adsorption. The increase in surface roughness and porosity also contributes to the improvement of gas diffusion and transport and increases the interaction between gas molecules and the sensing material. Moreover, the active sites generated by etching help to enhance the adsorption and catalytic properties [54]. This will promote the reaction between the target gas and the WO3 material, thus effectively enhancing the gas-sensing performance of the sensor.
The work function mismatch between Au (Φ = 5.1 eV) and WO3 (Φ = 4.4 eV) creates a potential barrier, causing majority carriers to accumulate at the interface between Au and WO3 [55,56]. The formation of a Schottky barrier increases the thickness of the electron depletion layer, providing more available carriers for oxygen adsorption in air [57]. Meanwhile, Au is able to promote the dissociation of oxygen molecules, resulting in highly reactive chemisorbed oxygen ions [26]. Additionally, Au acts as a catalyst to accelerate the surface reaction. This combined effect of enhanced oxygen dissociation and catalytic activity enables the sensor to exhibit excellent sensing characteristics [58].
The introduction of Au particles improves the selectivity for xylene. This is due to the fact that the strong electronic effect of xylene gas molecules can form a coupling effect with specific noble metals, which significantly affects the adsorption behavior of the gas molecules on metals [26]. Au nanoparticles catalyze the dehydrogenation reaction of C-H bonds in xylene [59]. Moreover, the planar structure of the benzene ring and Π conjugated system in xylene make it more reactive with oxygen ions adsorbed on the surface of the Au-loaded sensor than other VOC gases [60,61,62].

4. Conclusions

In this paper, Au was introduced together with NaHCO3 as an etchant to prepare WO3-1%E+Au with a homogeneous macroporous structure and rough surface. The carbon sphere template and the etchant worked in concert to create a lot of pores during this process, and the etched samples showed a higher response value and faster response/recovery rate than the pristine WO3. In addition, the Au decoration greatly enhanced the response of the WO3-1%E+Au sensor to xylene, and more importantly, the selectivity of the sensor to xylene was optimized. These findings highlight the importance of surface modification in enhancing gas sensor performance and are significant for improving the selectivity of volatile organic compounds (VOCs) gas sensors.

Supplementary Materials

The following supporting information can be downloaded at: https://www.mdpi.com/article/10.3390/mi16060646/s1, Figure S1 SEM image of carbon spheres, Figure S2 Low magnification SEM image of WO3-1%E, Figure S3 SEM images of samples using different amount of NaHCO3 as etchant: (a) 0.5% NaHCO3, (b) 1% NaHCO3, (c) 3% NaHCO3 and (d) 5% NaHCO3, Figure S4 The XPS O1s spectra of (a) WO3, (b) WO3-1%E, Figure S5 The samples using different amount of NaHCO3 as etchant: (a) optimum working temperature to 100 ppm xylene, (b) responses to 100 ppm different target gases at 420 ℃, (c–f) dynamic response-recovery curves to 100 ppm xylene at 420 ℃, Figure S6 The WO3-1%E samples adding different molar ratio of Au atom: (a) optimum working temperature to 100 ppm xylene, (b) responses to 100 ppm different target gases at their optimum operating temperature, (c–f) dynamic response-recovery curves to 100 ppm xylene at their optimum operating temperature.

Author Contributions

Methodology, X.H.; Software, Y.M.; Validation, W.C. and Y.X.; Investigation, X.L.; Data curation, S.S.; Writing—original draft, Y.W.; Writing—review & editing, Z.L.; Funding acquisition, P.C. All authors have read and agreed to the published version of the manuscript.

Funding

This work was supported by the National Key Research and Development Program (Nos. 2021YFC3090400 and 2021YFC3090402), the National Natural Science Foundation of China (Nos. 62271378 and 22205169), Ministry of Public Security Science and Technology Program Projects (No. 2022ZB40), Natural Science Basic Research Program of Shaanxi (Program No. 2023-JC-YB-506), Shaanxi Provincial Natural Science Foundation (No. B022330003), Fundamental Research Funds for the Central Universities (Nos. JB211308, XJS221309, and XJS221313), and Inner Mongolia Autonomous Region Science and Technology Plan Project (Nos. 2020GG0185, 2021GG0160, and 2022YFHH0073).

Data Availability Statement

No new data were created or analyzed in this study.

Conflicts of Interest

The authors declare no conflicts of interest.

References

  1. Lu, Y.; Liu, J.; Lu, B.; Jiang, A.; Wan, C. Study on the removal of indoor VOCs using biotechnology. J. Hazard. Mater. 2010, 182, 204–209. [Google Scholar] [CrossRef] [PubMed]
  2. Woellner, M.; Hausdorf, S.; Klein, N.; Mueller, P.; Smith, M.W.; Kaskel, S. Adsorption and Detection of Hazardous Trace Gases by Metal-Organic Frameworks. Adv. Mater. 2018, 30, 1704679. [Google Scholar] [CrossRef] [PubMed]
  3. Mirzaei, A.; Kim, J.-H.; Kim, H.W.; Kim, S.S. Resistive-based gas sensors for detection of benzene, toluene and xylene (BTX) gases: A review. J. Mater. Chem. C 2018, 6, 4342–4370. [Google Scholar] [CrossRef]
  4. Kim, H.J.; Yoon, J.W.; Choi, K.I.; Jang, H.W.; Umar, A.; Lee, J.H. Ultraselective and sensitive detection of xylene and toluene for monitoring indoor air pollution using Cr-doped NiO hierarchical nanostructures. Nanoscale 2013, 5, 7066–7073. [Google Scholar] [CrossRef]
  5. Gao, H.; Wei, D.; Lin, P.; Liu, C.; Sun, P.; Shimanoe, K.; Yamazoe, N.; Lu, G. The design of excellent xylene gas sensor using Sn-doped NiO hierarchical nanostructure. Sens. Actuators B-Chem. 2017, 253, 1152–1162. [Google Scholar] [CrossRef]
  6. Zhao, Q.; Du, Q.; Yang, Y.; Zhao, Z.; Cheng, J.; Bi, F.; Shi, X.; Xu, J.; Zhang, X. Effects of regulator ratio and guest molecule diffusion on VOCs adsorption by defective UiO-67: Experimental and theoretical insights. Chem. Eng. J. 2022, 433, 134510. [Google Scholar] [CrossRef]
  7. Yang, X.; Deng, Y.; Yang, H.; Liao, Y.; Cheng, X.; Zou, Y.; Wu, L.; Deng, Y. Functionalization of Mesoporous Semiconductor Metal Oxides for Gas Sensing: Recent Advances and Emerging Challenges. Adv. Sci. 2023, 10, 2204810. [Google Scholar] [CrossRef]
  8. Zhang, S.; Yang, M.; Liang, K.; Turak, A.; Zhang, B.; Meng, D.; Wang, C.; Qu, F.; Cheng, W.; Yang, M. An acetone gas sensor based on nanosized Pt-loaded Fe2O3 nanocubes. Sens. Actuators B-Chem. 2019, 290, 59–67. [Google Scholar] [CrossRef]
  9. Xie, S.; Zhao, C.; Shen, J.; Wei, J.; Liu, H.; Pan, Y.; Zhao, Y.; Zhu, Y. Hierarchical Flower-like WO3 Nanospheres Decorated with Bimetallic Au and Pd for Highly Sensitive and Selective Detection of 3-Hydroxy-2-butanone Biomarker. ACS Sens. 2023, 8, 728–738. [Google Scholar] [CrossRef]
  10. Van Toan, N.; Hung, C.M.; Hoa, N.D.; Van Duy, N.; Le, D.T.T.; Hoa, N.T.T.; Viet, N.N.; Phuoc, P.H.; Van Hieu, N. Enhanced NH3 and H2 gas sensing with H2S gas interference using multilayer SnO2/Pt/WO3 nanofilms. J. Hazard. Mater. 2021, 412, 125181. [Google Scholar] [CrossRef]
  11. Hu, J.; Xiong, X.; Guan, W.; Long, H.; Zhang, L.; Wang, H. Self-templated flower-like WO3-In2O3 hollow microspheres for conductometric acetone sensors. Sens. Actuators B-Chem. 2022, 361, 131705. [Google Scholar] [CrossRef]
  12. Dong, C.; Zhao, R.; Yao, L.; Ran, Y.; Zhang, X.; Wang, Y. A review on WO3 based gas sensors: Morphology control and enhanced sensing properties. J. Alloys Compd. 2020, 820, 153194. [Google Scholar] [CrossRef]
  13. Kang, M.; Cho, I.; Park, J.; Jeong, J.; Lee, K.; Lee, B.; Del Orbe Henriquez, D.; Yoon, K.; Park, I. High Accuracy Real-Time Multi-Gas Identification by a Batch-Uniform Gas Sensor Array and Deep Learning Algorithm. ACS Sens. 2022, 7, 430–440. [Google Scholar] [CrossRef] [PubMed]
  14. Choi, M.S.; Na, H.G.; Mirzaei, A.; Bang, J.H.; Oum, W.; Han, S.; Choi, S.-W.; Kim, M.; Jin, C.; Kim, S.S.; et al. Room-temperature NO2 sensor based on electrochemically etched porous silicon. J. Alloys Compd. 2019, 811, 151975. [Google Scholar] [CrossRef]
  15. Yuan, T.; Ma, Z.; Nekouei, F.; Zhang, W.; Xu, J. Zeolitic imidazolate framework-derived n-ZnO/p-Co3O4 heterojunction by ion-etching method for superior CO toxic gas sensor. Sens. Actuators B-Chem. 2023, 374, 132717. [Google Scholar] [CrossRef]
  16. Xuan, J.; Wang, L.; Zou, Y.; Li, Y.; Zhang, H.; Lu, Q.; Sun, M.; Yin, G.; Zhou, A. Room-temperature gas sensor based on in situ grown, etched and W-doped ZnO nanotubes functionalized with Pt nanoparticles for the detection of low-concentration H2S. J. Alloys Compd. 2022, 922, 166158. [Google Scholar] [CrossRef]
  17. Gruber, D.; Kraus, F.; Müller, J. A novel gas sensor design based on CH4/H2/H2O plasma etched ZnO thin films. Sens. Actuators B-Chem. 2003, 92, 81–89. [Google Scholar] [CrossRef]
  18. Lee, J.S.; Park, J.W.; Shin, S.M. Fabrication of a micro catalytic gas sensor using thin film process and Si anisotropic etching techniques. Sens. Actuators B-Chem. 1997, 45, 265–269. [Google Scholar] [CrossRef]
  19. Hazra, S.K.; Basu, S. High sensitivity and fast response hydrogen sensors based on electrochemically etched porous titania thin films. Sens. Actuators B-Chem. 2006, 115, 403–411. [Google Scholar] [CrossRef]
  20. Radzali, R.; Hassan, Z.; Zainal, N.; Yam, F.K. Preparation of porous InAlGaN/Si(111) by photoelectrochemical etching for high performance hydrogen gas sensors at room temperature. Sens. Actuators B-Chem. 2015, 213, 276–284. [Google Scholar] [CrossRef]
  21. Qin, Y.; Wang, Y.; Liu, Y.; Zhang, X. KOH post-etching-induced rough silicon nanowire array for H2 gas sensing application. Nanotechnology 2016, 27, 465502. [Google Scholar] [CrossRef] [PubMed]
  22. Lee, J.; Jung, Y.; Sung, S.H.; Lee, G.; Kim, J.; Seong, J.; Shim, Y.-S.; Jun, S.C.; Jeon, S. High-performance gas sensor array for indoor air quality monitoring: The role of Au nanoparticles on WO3, SnO2, and NiO-based gas sensors. J. Mater. Chem. A 2021, 9, 1159–1167. [Google Scholar] [CrossRef]
  23. van den Broek, J.; Abegg, S.; Pratsinis, S.E.; Güntner, A.T. Highly selective detection of methanol over ethanol by a handheld gas sensor. Nat. Commun. 2019, 10, 4420. [Google Scholar] [CrossRef]
  24. Kumar, S.; Lawaniya, S.D.; Agarwal, S.; Yu, Y.T.; Nelamarri, S.R.; Kumar, M.; Mishra, Y.K.; Awasthi, K. Optimization of Pt nanoparticles loading in ZnO for highly selective and stable hydrogen gas sensor at reduced working temperature. Sens. Actuators B-Chem. 2023, 375, 132943. [Google Scholar] [CrossRef]
  25. Yuan, Z.; Zhang, H.; Li, J.; Meng, F.; Yang, Z.; Zhang, H. Ag Nanoparticle-Modified ZnO-In2O3 Nanocomposites for Low-Temperature Rapid Detection Hydrogen Gas Sensors. IEEE Trans. Instrum. Meas. 2023, 72, 1–12. [Google Scholar] [CrossRef]
  26. Zhu, L.Y.; Ou, L.X.; Mao, L.W.; Wu, X.Y.; Liu, Y.P.; Lu, H.L. Advances in Noble Metal-Decorated Metal Oxide Nanomaterials for Chemiresistive Gas Sensors: Overview. Nano-Micro Lett. 2023, 15, 89. [Google Scholar] [CrossRef]
  27. Park, S.; Lim, Y.; Oh, D.; Ahn, J.; Park, C.; Kim, M.; Jung, W.; Kim, J.; Kim, I.-D. Steering selectivity in the detection of exhaled biomarkers over oxide nanofibers dispersed with noble metals. J. Mater. Chem. A 2023, 11, 3535–3545. [Google Scholar] [CrossRef]
  28. Barbosa, M.S.; Suman, P.H.; Kim, J.J.; Tuller, H.L.; Varela, J.A.; Orlandi, M.O. Gas sensor properties of Ag- and Pd-decorated SnO micro-disks to NO2, H2 and CO: Catalyst enhanced sensor response and selectivity. Sens. Actuators B-Chem. 2017, 239, 253–261. [Google Scholar] [CrossRef]
  29. Liu, Y.; Li, X.; Wang, Y.; Li, X.; Cheng, P.; Zhao, Y.; Dang, F.; Zhang, Y. Hydrothermal synthesis of Au@SnO2 hierarchical hollow microspheres for ethanol detection. Sens. Actuators B-Chem. 2020, 319, 128299. [Google Scholar] [CrossRef]
  30. Zhang, X.; Lan, W.; Xu, J.; Luo, Y.; Pan, J.; Liao, C.; Yang, L.; Tan, W.; Huang, X. ZIF-8 derived hierarchical hollow ZnO nanocages with quantum dots for sensitive ethanol gas detection. Sens. Actuators B-Chem. 2019, 289, 144–152. [Google Scholar] [CrossRef]
  31. Liu, L.; Li, X.; Dutta, P.K.; Wang, J. Room temperature impedance spectroscopy-based sensing of formaldehyde with porous TiO2 under UV illumination. Sens. Actuators B-Chem. 2013, 185, 1–9. [Google Scholar] [CrossRef]
  32. Wei, D.; Huang, Z.; Wang, L.; Chuai, X.; Zhang, S.; Lu, G. Hydrothermal synthesis of Ce-doped hierarchical flower-like In2O3 microspheres and their excellent gas-sensing properties. Sens. Actuators B-Chem. 2018, 255, 1211–1219. [Google Scholar] [CrossRef]
  33. Li, H.; Wu, C.-H.; Liu, Y.-C.; Yuan, S.-H.; Chiang, Z.-X.; Zhang, S.; Wu, R.-J. Mesoporous WO3-TiO2 heterojunction for a hydrogen gas sensor. Sens. Actuators B-Chem. 2021, 341, 130035. [Google Scholar] [CrossRef]
  34. Hu, J.; Zhuang, Z.; Liu, F.; Liu, X.; Liu, Z. Investigation of grain boundary and orientation effects in polycrystalline metals by a dislocation-based crystal plasticity model. Comput. Mater. Sci. 2019, 159, 86–94. [Google Scholar] [CrossRef]
  35. Korotcenkov, G.; Han, S.D.; Cho, B.K.; Brinzari, V. Grain Size Effects in Sensor Response of Nanostructured SnO2-and In2O3-Based Conductometric Thin Film Gas Sensor. Crit. Rev. Solid State Mater. Sci. 2009, 34, 1–17. [Google Scholar] [CrossRef]
  36. Solis, J.L.; Saukko, S.; Kish, L.; Granqvist, C.G.; Lantto, V. Semiconductor gas sensors based on nanostructured tungsten oxide. Thin Solid Film. 2001, 391, 255–260. [Google Scholar] [CrossRef]
  37. Gurlo, A. Nanosensors: Towards morphological control of gas sensing activity. SnO2, In2O3, ZnO and WO3 case studies. Nanoscale 2011, 3, 154–165. [Google Scholar] [CrossRef]
  38. Verma, A.; Yadav, B.C. 2D/2D Nanostructured System Based on WO3/WS2 for Acetone Sensor and Breath Analyzer. ACS Appl. Nano Mater. 2023, 6, 5493–5507. [Google Scholar] [CrossRef]
  39. Wang, Y.; Shi, T.; Fan, Q.Y.; Liu, Y.; Zhang, A.A.; Li, Z.Q.; Hao, Y.H.; Chen, L.; Liu, F.R.; Gu, X.J.; et al. Discovering Surface Structure and the Mechanism of Graphene Oxide-Triggered CeO2-WO3/TiO2 Catalysts for NO Abatement with NH3. ACS Catal. 2022, 12, 8386–8403. [Google Scholar] [CrossRef]
  40. Zhang, X.L.; Huang, W.; Xia, Z.X.; Xian, M.; Bu, F.; Liang, F.B.; Feng, D.X. One-pot synthesis of S-scheme WO3/BiOBr heterojunction nanoflowers enriched with oxygen vacancies for enhanced tetracycline photodegradation. Sep. Purif. Technol. 2022, 290, 120897. [Google Scholar] [CrossRef]
  41. Nayak, A.K.; Das, A.K.; Pradhan, D. High Performance Solid-State Asymmetric Supercapacitor using Green Synthesized Graphene-WO3 Nanowires Nanocomposite. ACS Sustain. Chem. Eng. 2017, 5, 10128–10138. [Google Scholar] [CrossRef]
  42. Yang, D.J.; Kamienchick, I.; Youn, D.Y.; Rothschild, A.; Kim, I.D. Ultrasensitive and Highly Selective Gas Sensors Based on Electrospun SnO2 Nanofibers Modified by Pd Loading. Adv. Funct. Mater. 2010, 20, 4258–4264. [Google Scholar] [CrossRef]
  43. Liu, Z.Y.; Kou, J.; Sun, C.B. Highly efficient electroextraction of gold and simultaneous iodine regeneration using ionic liquid 1-ethyl-3-methylimidazolium dicyanamide. Sep. Purif. Technol. 2023, 318, 123961. [Google Scholar] [CrossRef]
  44. Qiu, Y.H.; Wang, Y.P. Controllable synthesis of W18O49 nanoneedles for high-performance NO2gas sensors. J. Alloys Compd. 2023, 944, 169199. [Google Scholar] [CrossRef]
  45. Lu, Y.; Zhang, J.F.; Wang, W.; Fan, Y.Z.; Liu, C.X.; Zhou, J.R.; Liu, D.L.; Ruan, S.P. Au-Pd modified SnS2 nanosheets for conductometric detection of xylene gas. Sens. Actuators B-Chem. 2022, 351, 130907. [Google Scholar] [CrossRef]
  46. Li, X.; Tan, T.; Ji, W.; Zhou, W.L.; Bao, Y.W.; Xia, X.H.; Zeng, Z.F.; Gao, Y. Remarkably Enhanced Methane Sensing Performance at Room Temperature via Constructing a Self-Assembled Mulberry-Like ZnO/SnO2 Hierarchical Structure. Energy Environ. Mater. 2023, 7, e12624. [Google Scholar] [CrossRef]
  47. Wang, X.; Wang, T.K.; Si, G.K.; Li, Y.; Zhang, S.W.; Deng, X.L.; Xu, X.J. Oxygen vacancy defects engineering on Ce-doped alpha-Fe2O3 gas sensor for reducing gases. Sens. Actuators B-Chem. 2020, 302, 127165. [Google Scholar] [CrossRef]
  48. Tai, H.L.; Duan, Z.H.; Wang, Y.; Wang, S.; Jiang, Y.D. Paper-Based Sensors for Gas, Humidity, and Strain Detections: A Review. ACS Appl. Mater. Interfaces 2020, 12, 31037–31053. [Google Scholar] [CrossRef]
  49. Liu, S.; Wang, M.; Ge, C.; Zhang, X.; Lei, S.; Hussain, S.; Wang, M.; Qiao, G.; Liu, G. ZnO/Ti3C2 composite with oxygen vacancies and Schottky barrier for effective detection of ppb-level NO2 at room temperature. Appl. Surf. Sci. 2023, 610, 155440. [Google Scholar] [CrossRef]
  50. Zhang, Y.; Qin, C.; Zhang, R.; Zhang, Y.; Wang, Y.; Zhang, Z.; Cao, J. Construction of hierarchical In2O3/In2S3 microsphere heterostructures for TEA detection. J. Mater. 2022, 8, 1113–1121. [Google Scholar] [CrossRef]
  51. Ueda, T.; Boehme, I.; Hyodo, T.; Shimizu, Y.; Weimar, U.; Barsan, N. Effects of Gas Adsorption Properties of an Au-Loaded Porous In2O3 Sensor on NO2-Sensing Properties. ACS Sens. 2021, 6, 4019–4028. [Google Scholar] [CrossRef] [PubMed]
  52. Li, C.; Choi, P.G.; Masuda, Y. Large-lateral-area SnO2 nanosheets with a loose structure for high-performance acetone sensor at the ppt level. J. Hazard. Mater. 2023, 455, 131592. [Google Scholar] [CrossRef] [PubMed]
  53. Li, F.; Ruan, S.; Zhang, N.; Yin, Y.; Guo, S.; Chen, Y.; Zhang, H.; Li, C. Synthesis and characterization of Cr-doped WO3 nanofibers for conductometric sensors with high xylene sensitivity. Sens. Actuators B-Chem. 2018, 265, 355–364. [Google Scholar] [CrossRef]
  54. Han, X.; Niu, Y.; Yu, C.; Liu, Z.; Huang, H.; Huang, H.; Li, S.; Guo, W.; Tan, X.; Qiu, J. Ultrafast construction of interfacial sites by wet chemical etching to enhance electrocatalytic oxygen evolution. Nano Energy 2020, 69, 104367. [Google Scholar] [CrossRef]
  55. Cui, X.X.; Tian, X.; Xiao, X.C.; Chen, T.; Wang, Y.D. Au Modified Hollow Cube Sn-MOF Derivatives for Highly Sensitive, Great Selective, and Stable Detection of n-Butanol at Room Temperature. Adv. Mater. Technol. 2023, 8, 2300572. [Google Scholar] [CrossRef]
  56. Wang, X.H.; Meng, X.N.; Gao, W. Ultrahigh-response sensor based on hierarchical Pd-WO3 nanoflowers for rapid hydrogen detection. Sens. Actuators B-Chem. 2023, 387, 133790. [Google Scholar] [CrossRef]
  57. Horprathum, M.; Srichaiyaperk, T.; Samransuksamer, B.; Wisitsoraat, A.; Eiamchai, P.; Limwichean, S.; Chananonnawathorn, C.; Aiempanakit, K.; Nuntawong, N.; Patthanasettakul, V.; et al. Ultrasensitive Hydrogen Sensor Based on Pt-Decorated WO3 Nanorods Prepared by Glancing-Angle dc Magnetron Sputtering. ACS Appl. Mater. Interfaces 2014, 6, 22051–22060. [Google Scholar] [CrossRef]
  58. Guo, J.; Zhang, J.; Zhu, M.; Ju, D.X.; Xu, H.Y.; Cao, B.Q. High-performance gas sensor based on ZnO nanowires functionalized by Au nanoparticles. Sens. Actuators B-Chem. 2014, 199, 339–345. [Google Scholar] [CrossRef]
  59. Hjiri, M. Strategies to detect xylene gas using chemoresistive gas sensors: An overview. J. Ind. Eng. Chem. 2024, 139, 56–73. [Google Scholar] [CrossRef]
  60. Li, F.; Guo, S.J.; Shen, J.L.; Shen, L.; Sun, D.M.; Wang, B.; Chen, Y.; Ruan, S.P. Xylene gas sensor based on Au-loaded WO3· H2O nanocubes with enhanced sensing performance. Sens. Actuators B-Chem. 2017, 238, 364–373. [Google Scholar] [CrossRef]
  61. Xie, S.H.; Liu, Y.X.; Deng, J.G.; Zhao, X.T.; Yang, J.; Zhang, K.F.; Han, Z.; Arandiyan, H.; Dai, H.X. Effect of transition metal doping on the catalytic performance of Au-Pd/3DOM Mn2O3 for the oxidation of methane and o-xylene. Appl. Catal. B-Environ. 2017, 206, 221–232. [Google Scholar] [CrossRef]
  62. Park, S.W.; Jeong, S.Y.; Yoon, J.W.; Lee, J.H. General Strategy for Designing Highly Selective Gas-Sensing Nanoreactors: Morphological Control of SnO2 Hollow Spheres and Configurational Tuning of Au Catalysts. ACS Appl. Mater. Interfaces 2020, 12, 51607–51615. [Google Scholar] [CrossRef]
Figure 1. X-ray diffraction patterns of all samples.
Micromachines 16 00646 g001
Figure 2. SEM images of (a,b) WO3, (c,d) WO3-1%E, and (e,f) WO3-1%E+Au.
Micromachines 16 00646 g002
Figure 3. WO3-1%E+Au sample: (a) TEM image, (b) High-resolution TEM selected area image of (a), (ce) Elemental mapping images of W, O, and Au elements, and (f) Selected area electron diffraction image.
Micromachines 16 00646 g003
Figure 4. The XPS spectra of WO3-1%E+Au sample: (a) Full survey spectra, (b) W6+, (c) O 1s, (d) Au 4f.
Micromachines 16 00646 g004
Figure 5. N2 adsorption-desorption isotherm and pore size curves of (a,d) WO3, (b,e) WO3-1%E, (c,f) WO3-1%E+Au.
Micromachines 16 00646 g005
Figure 6. Response of all samples (a) to 100 ppm xylene at various temperatures, (b) to different 100 ppm gases at their optimal working temperature, and (c) to xylene and acetone at various temperatures. (d) Response curves for different concentrations of xylene at 360 °C. (e) Linear correlation between response and concentration at 360 °C. (f) Repeatability test of WO3-1%E+Au sample.
Micromachines 16 00646 g006
Figure 7. Dynamic response-recovery curves of (a) WO3, (b) WO3-1%E, (c) WO3-1%E+Au to 100 ppm xylene at their respective optimal working temperatures.
Micromachines 16 00646 g007
Figure 8. (a) Long-term stability test of WO3-1%E+Au at 360 °C and (b) response of WO3-1%E+Au to 100 ppm xylene at 360 °C and resistance change in air at various humidity.
Micromachines 16 00646 g008
Figure 9. Schematic of the simulated reaction mechanism of WO3-1%E+Au with xylene.
Micromachines 16 00646 g009
Disclaimer/Publisher’s Note: The statements, opinions and data contained in all publications are solely those of the individual author(s) and contributor(s) and not of MDPI and/or the editor(s). MDPI and/or the editor(s) disclaim responsibility for any injury to people or property resulting from any ideas, methods, instructions or products referred to in the content.

