
Design of an Electronic Nose System with Automatic End-Tidal Breath Gas Collection for Enhanced Breath Detection Performance

 ,
, 
Abstract

1. Introduction
2. Electronic Nose Device
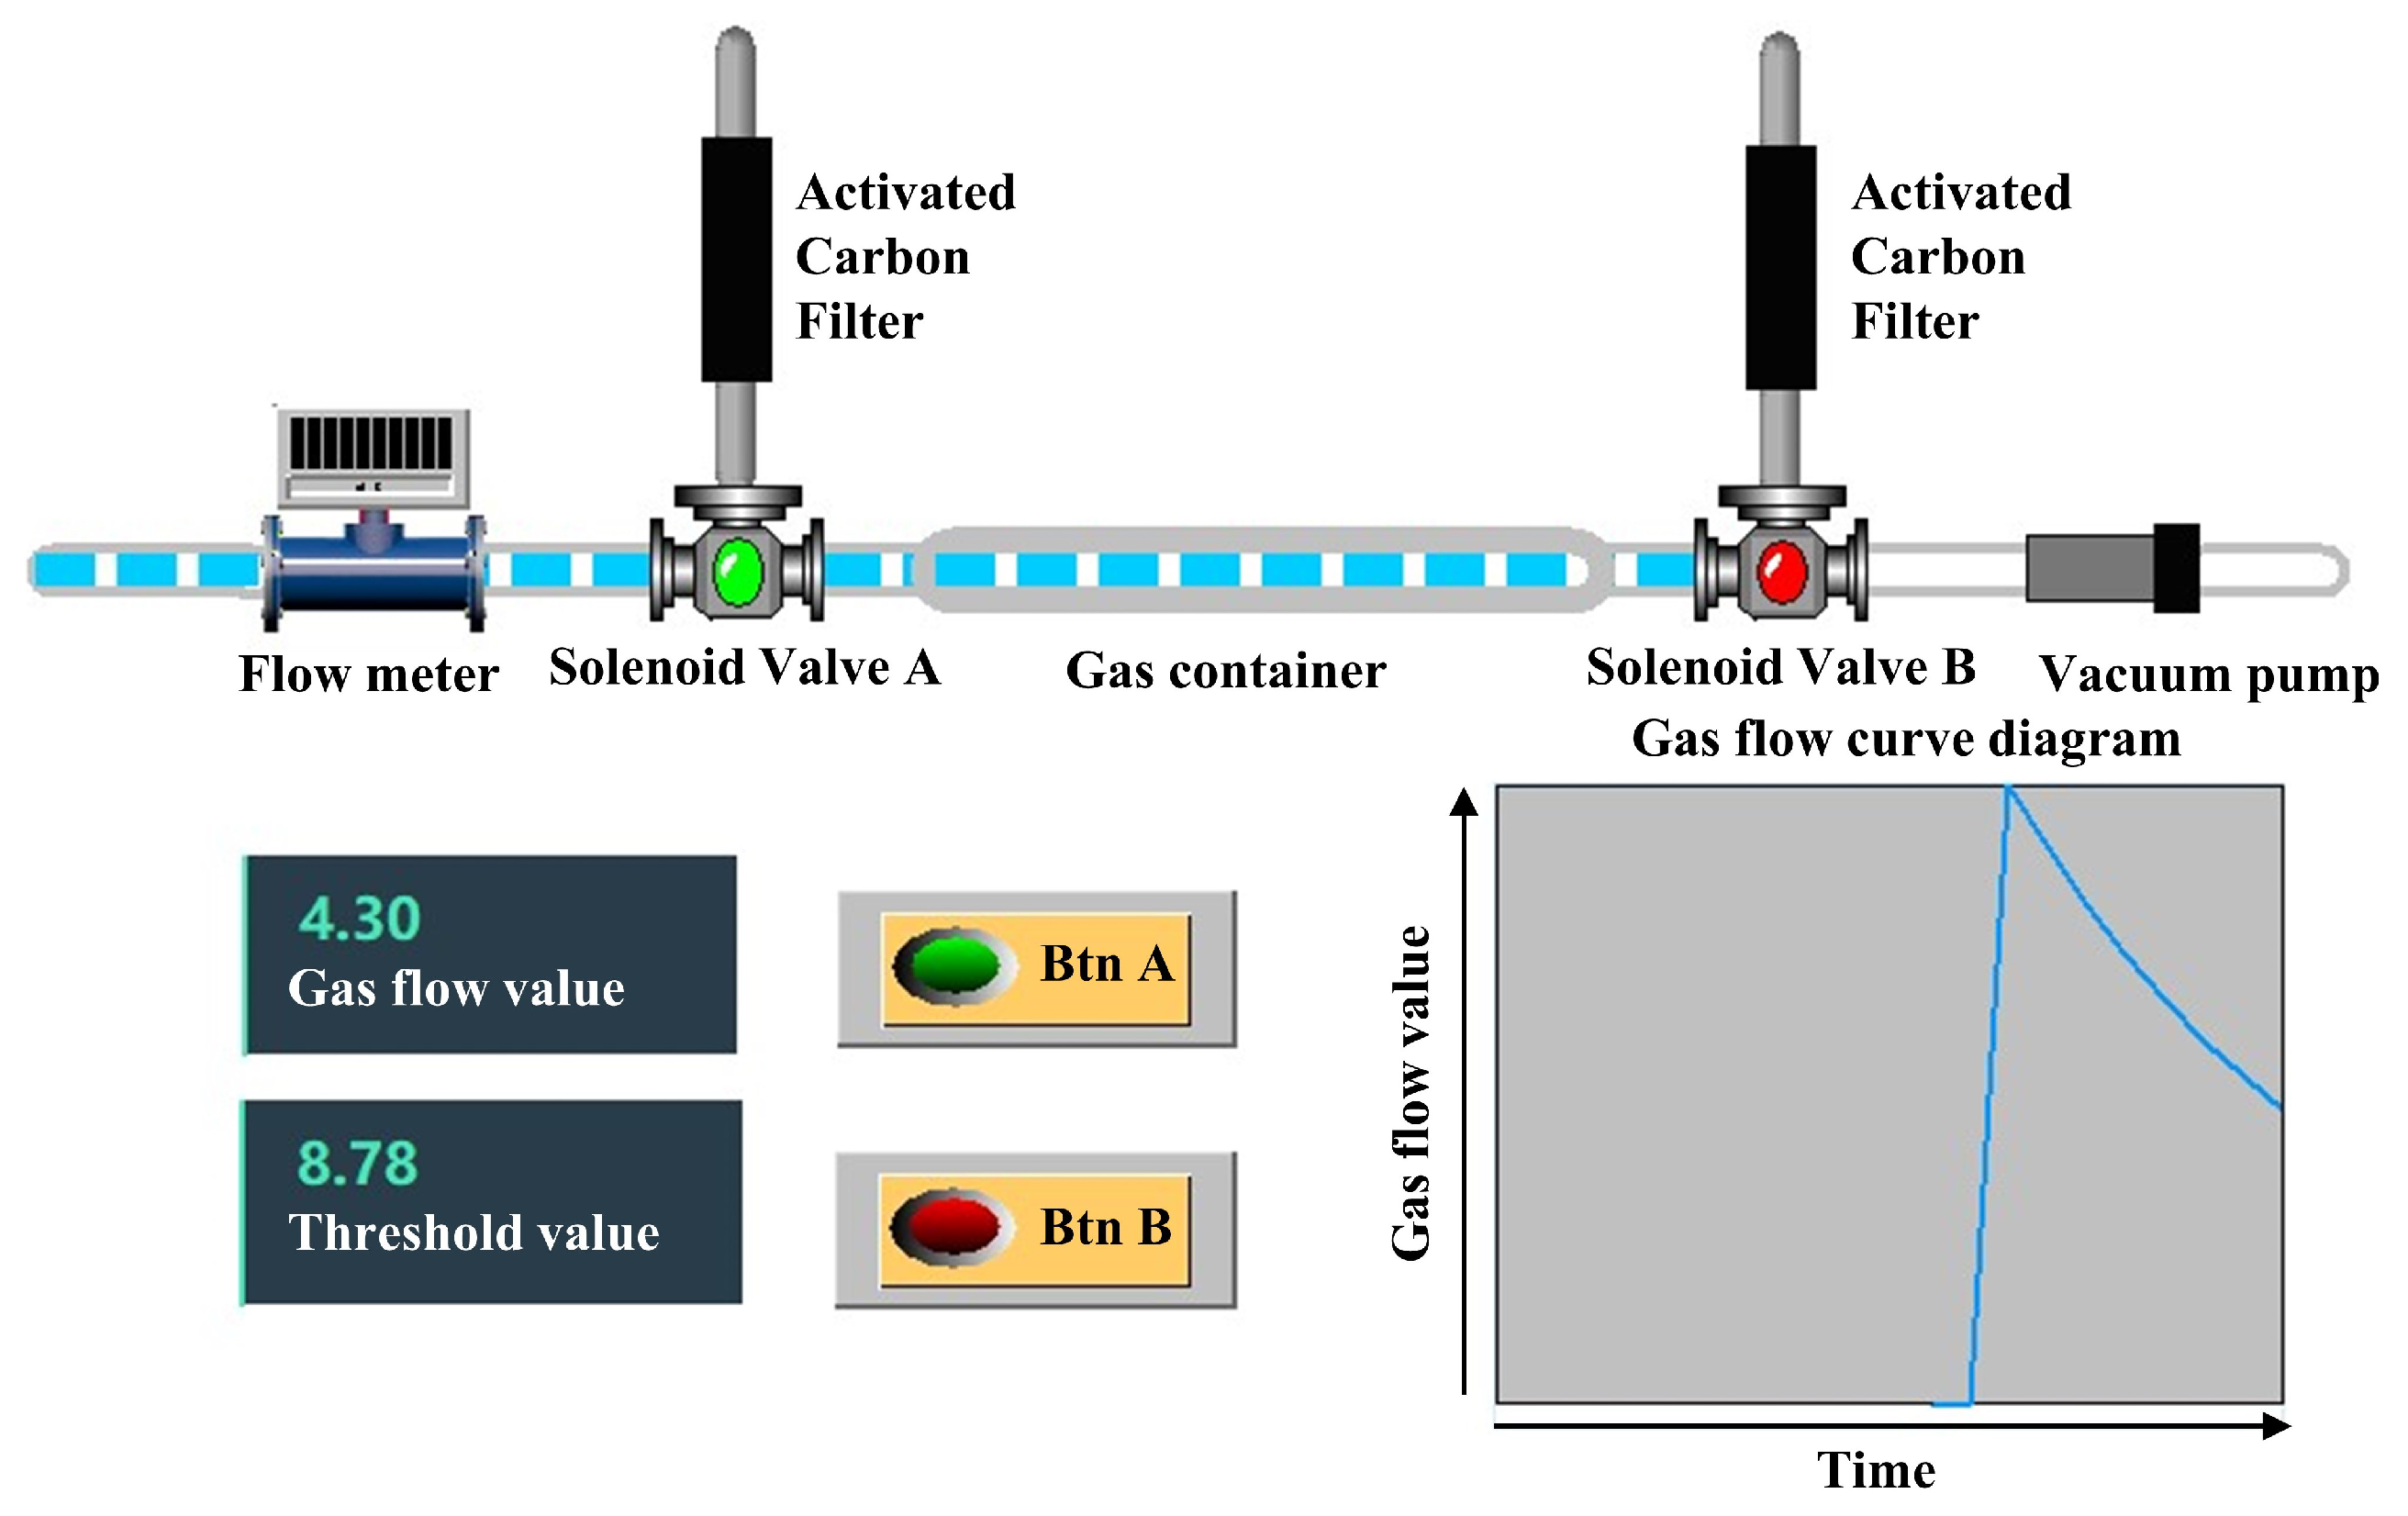
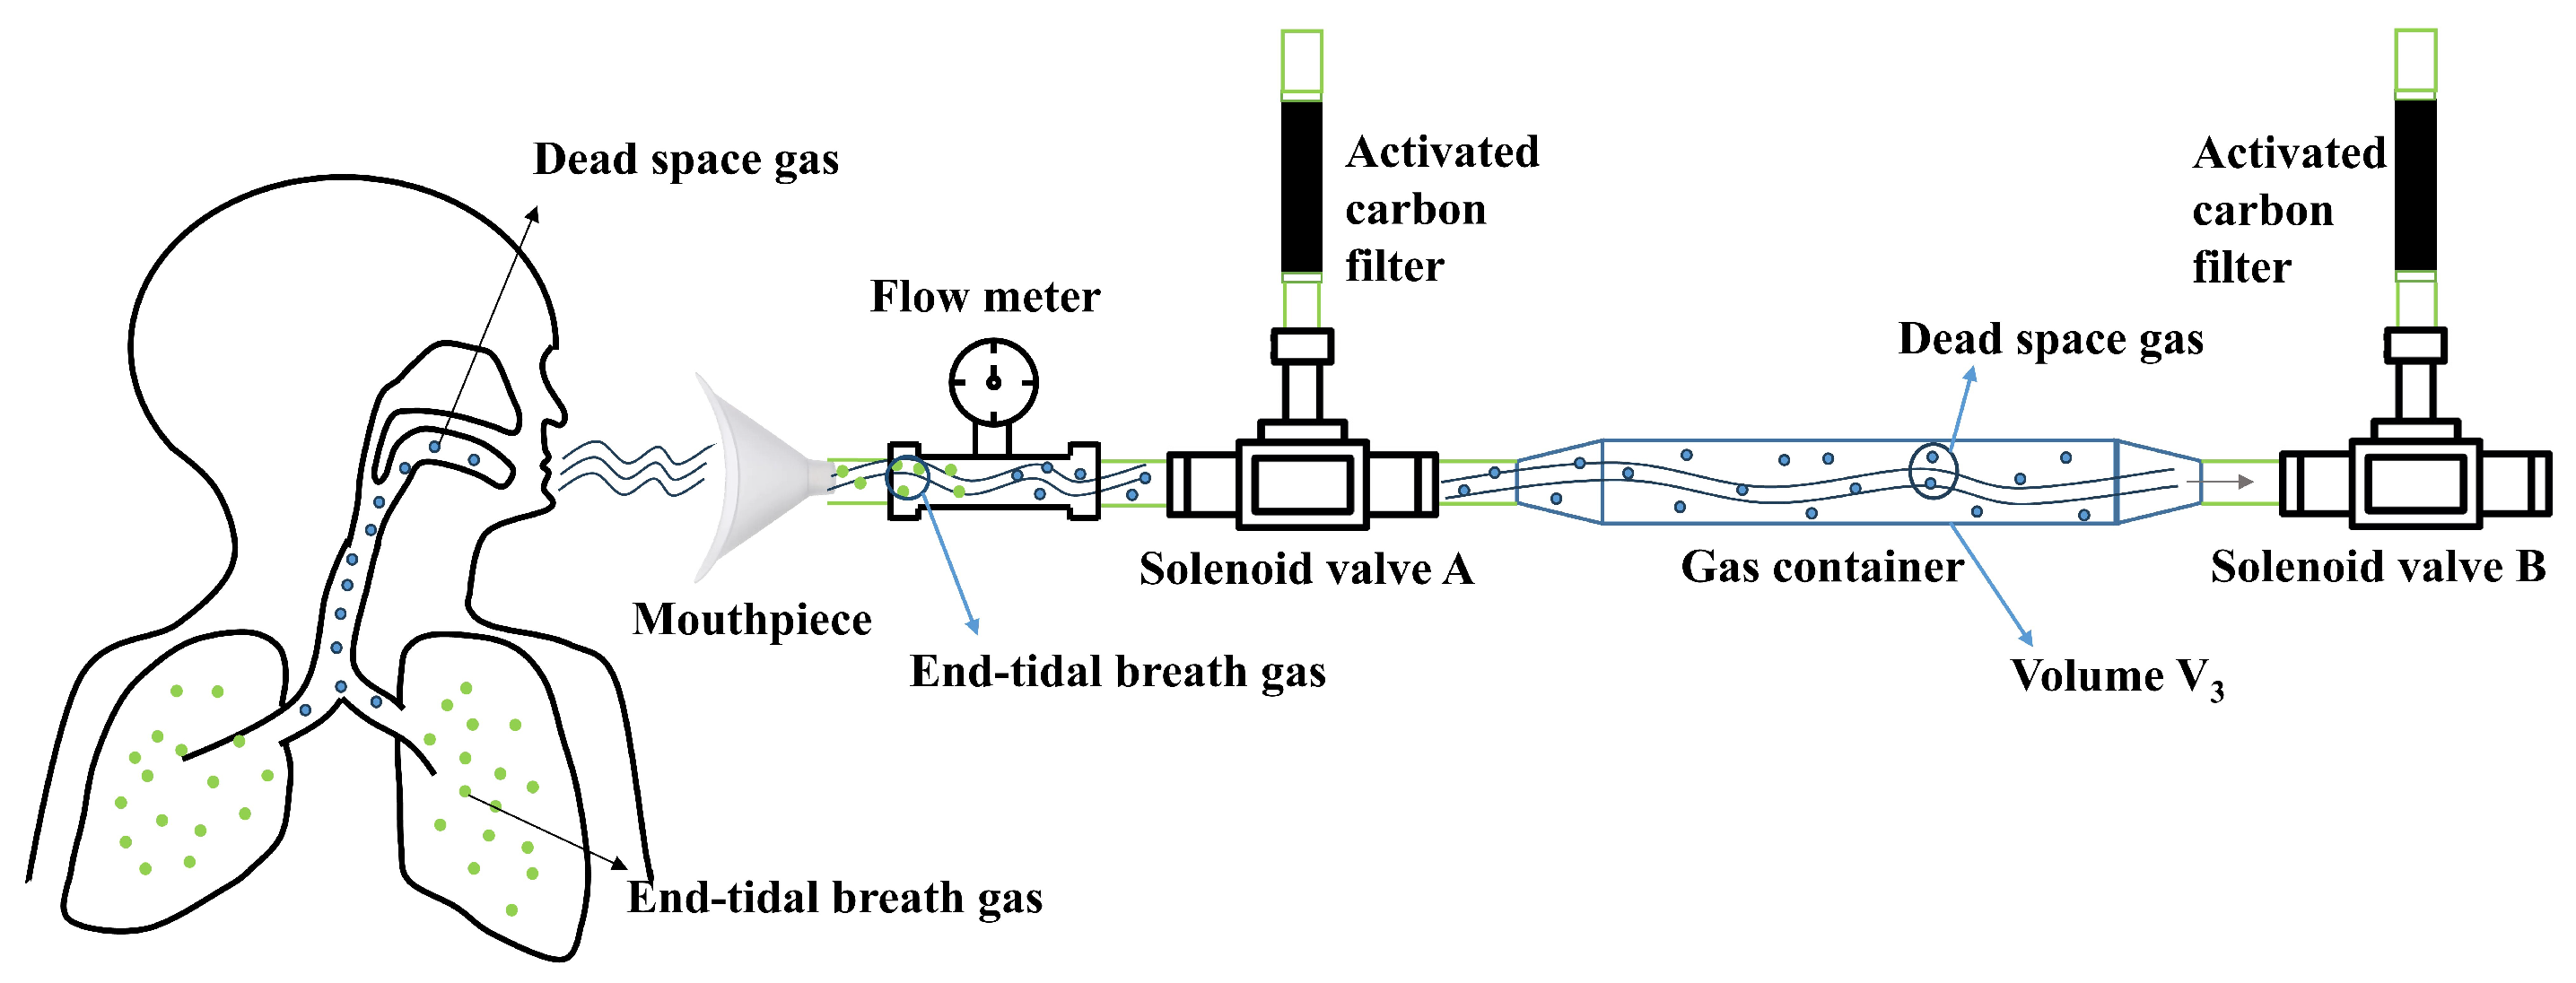
2.1. Gas Collection Module Design and Methodology
2.2. Sensor Chamber Design
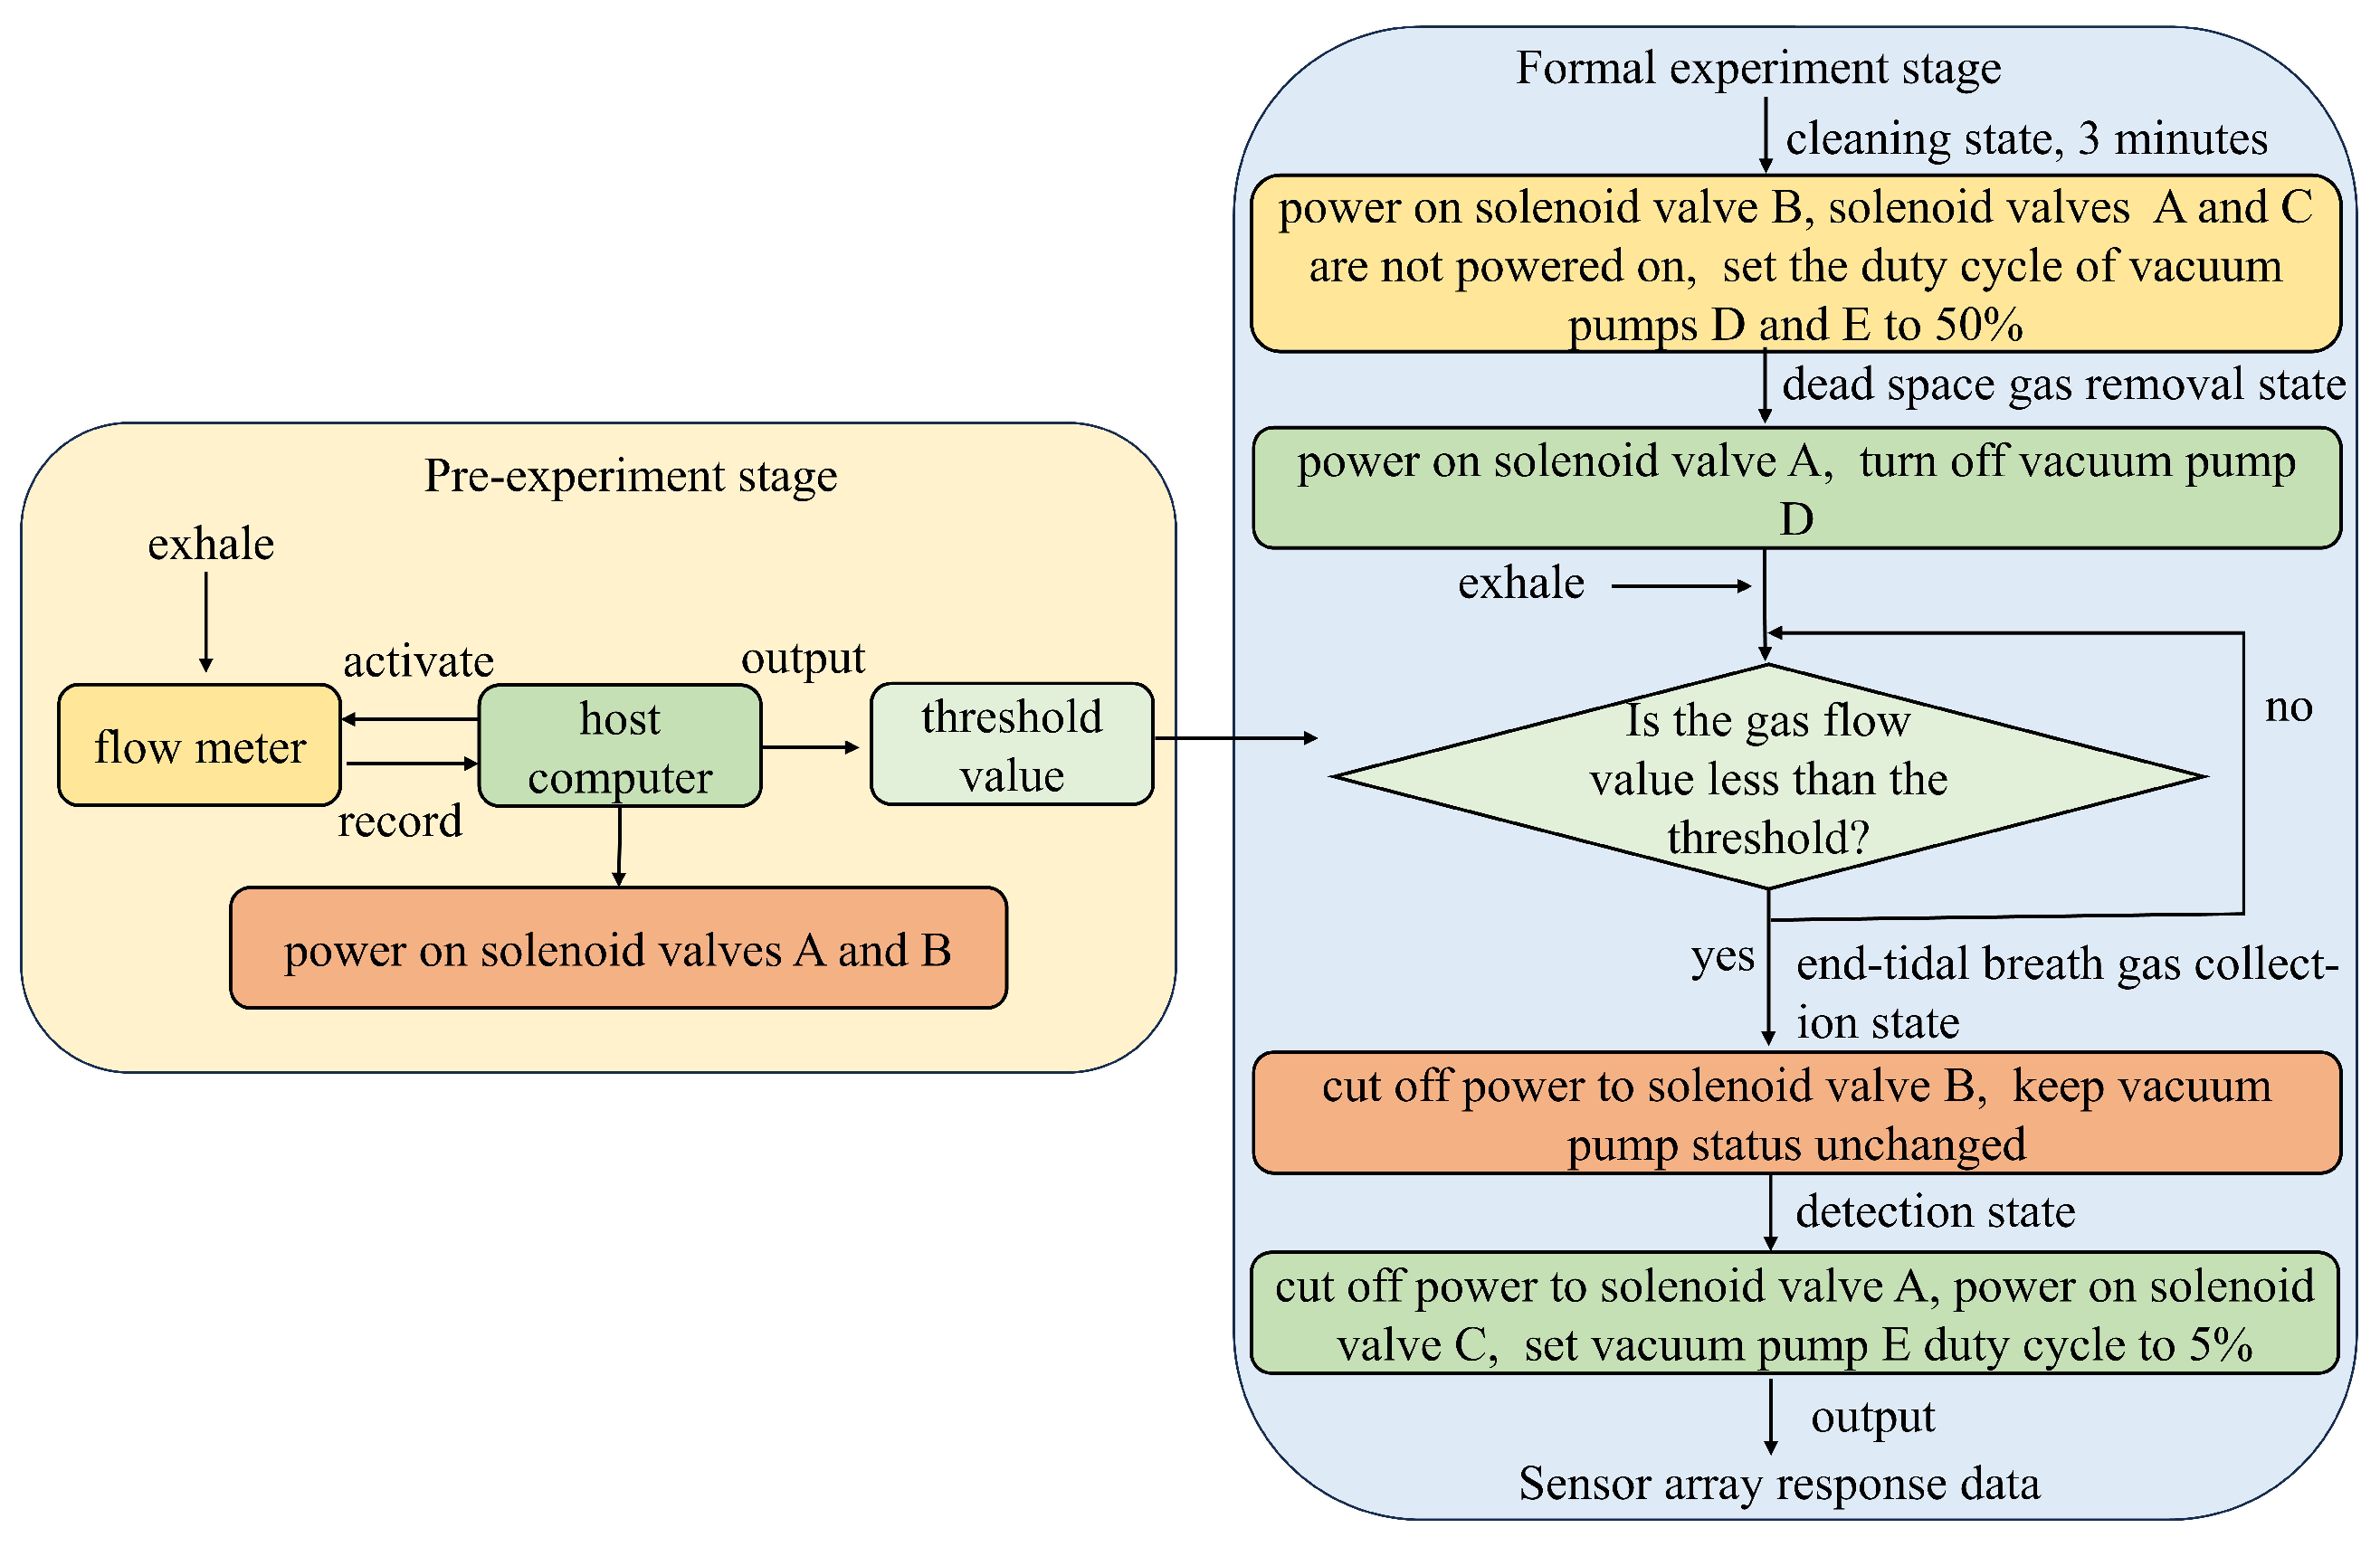
2.3. System Control Flow
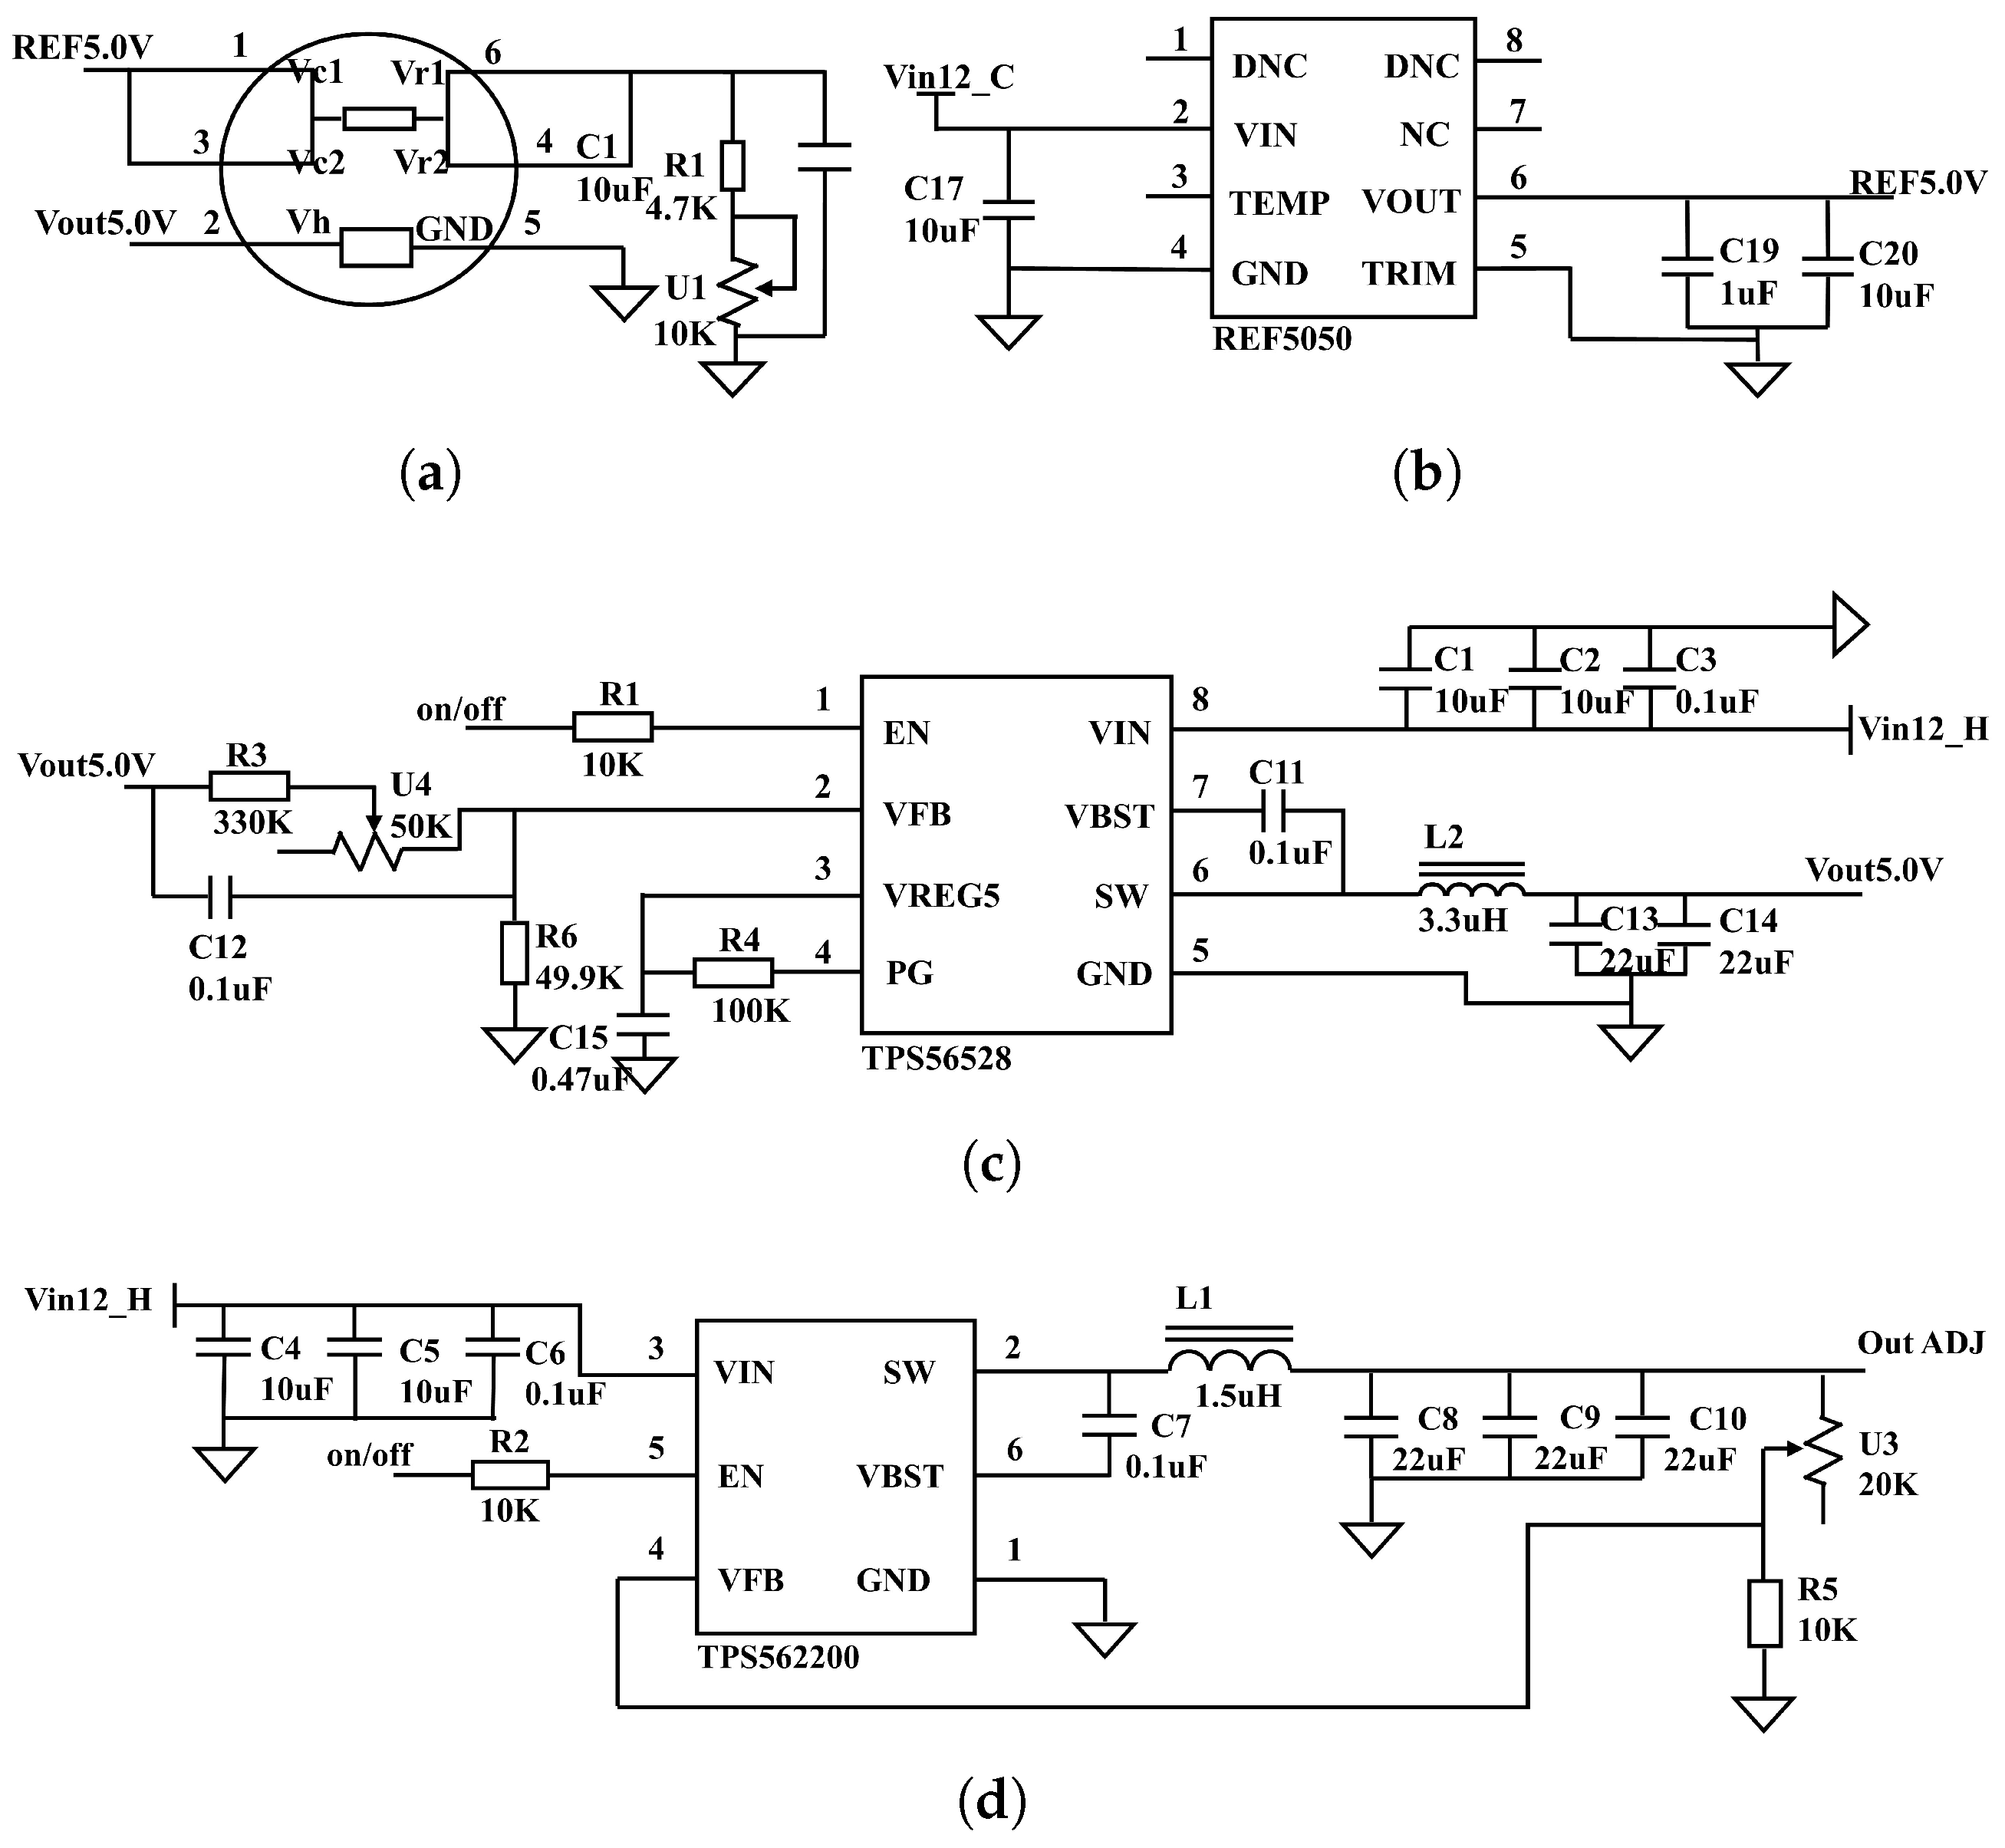
2.4. Detection Module Circuit Design
3. Experimental Operation
3.1. Experimental Design
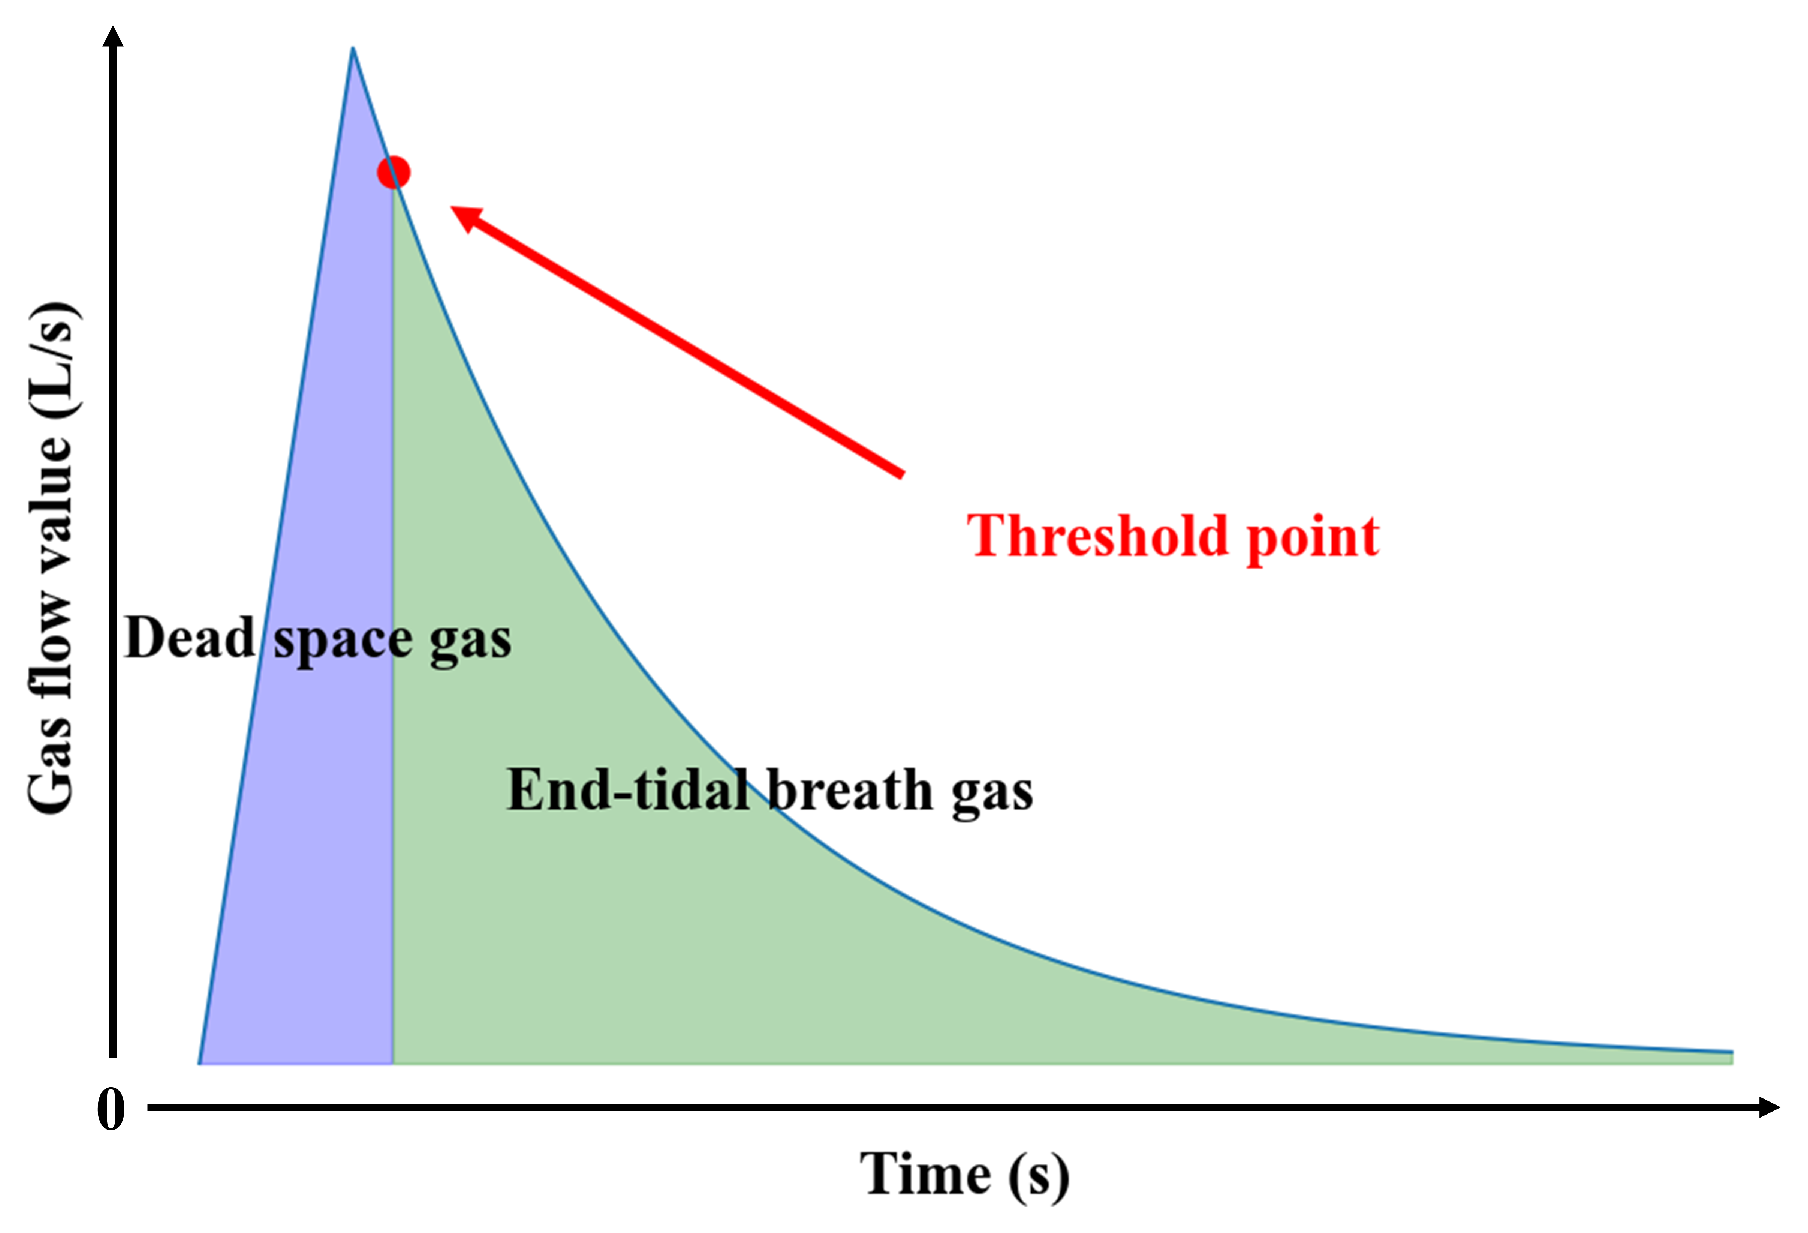
3.2. Determination of the Separation Threshold
4. Experimental Results and Discussion
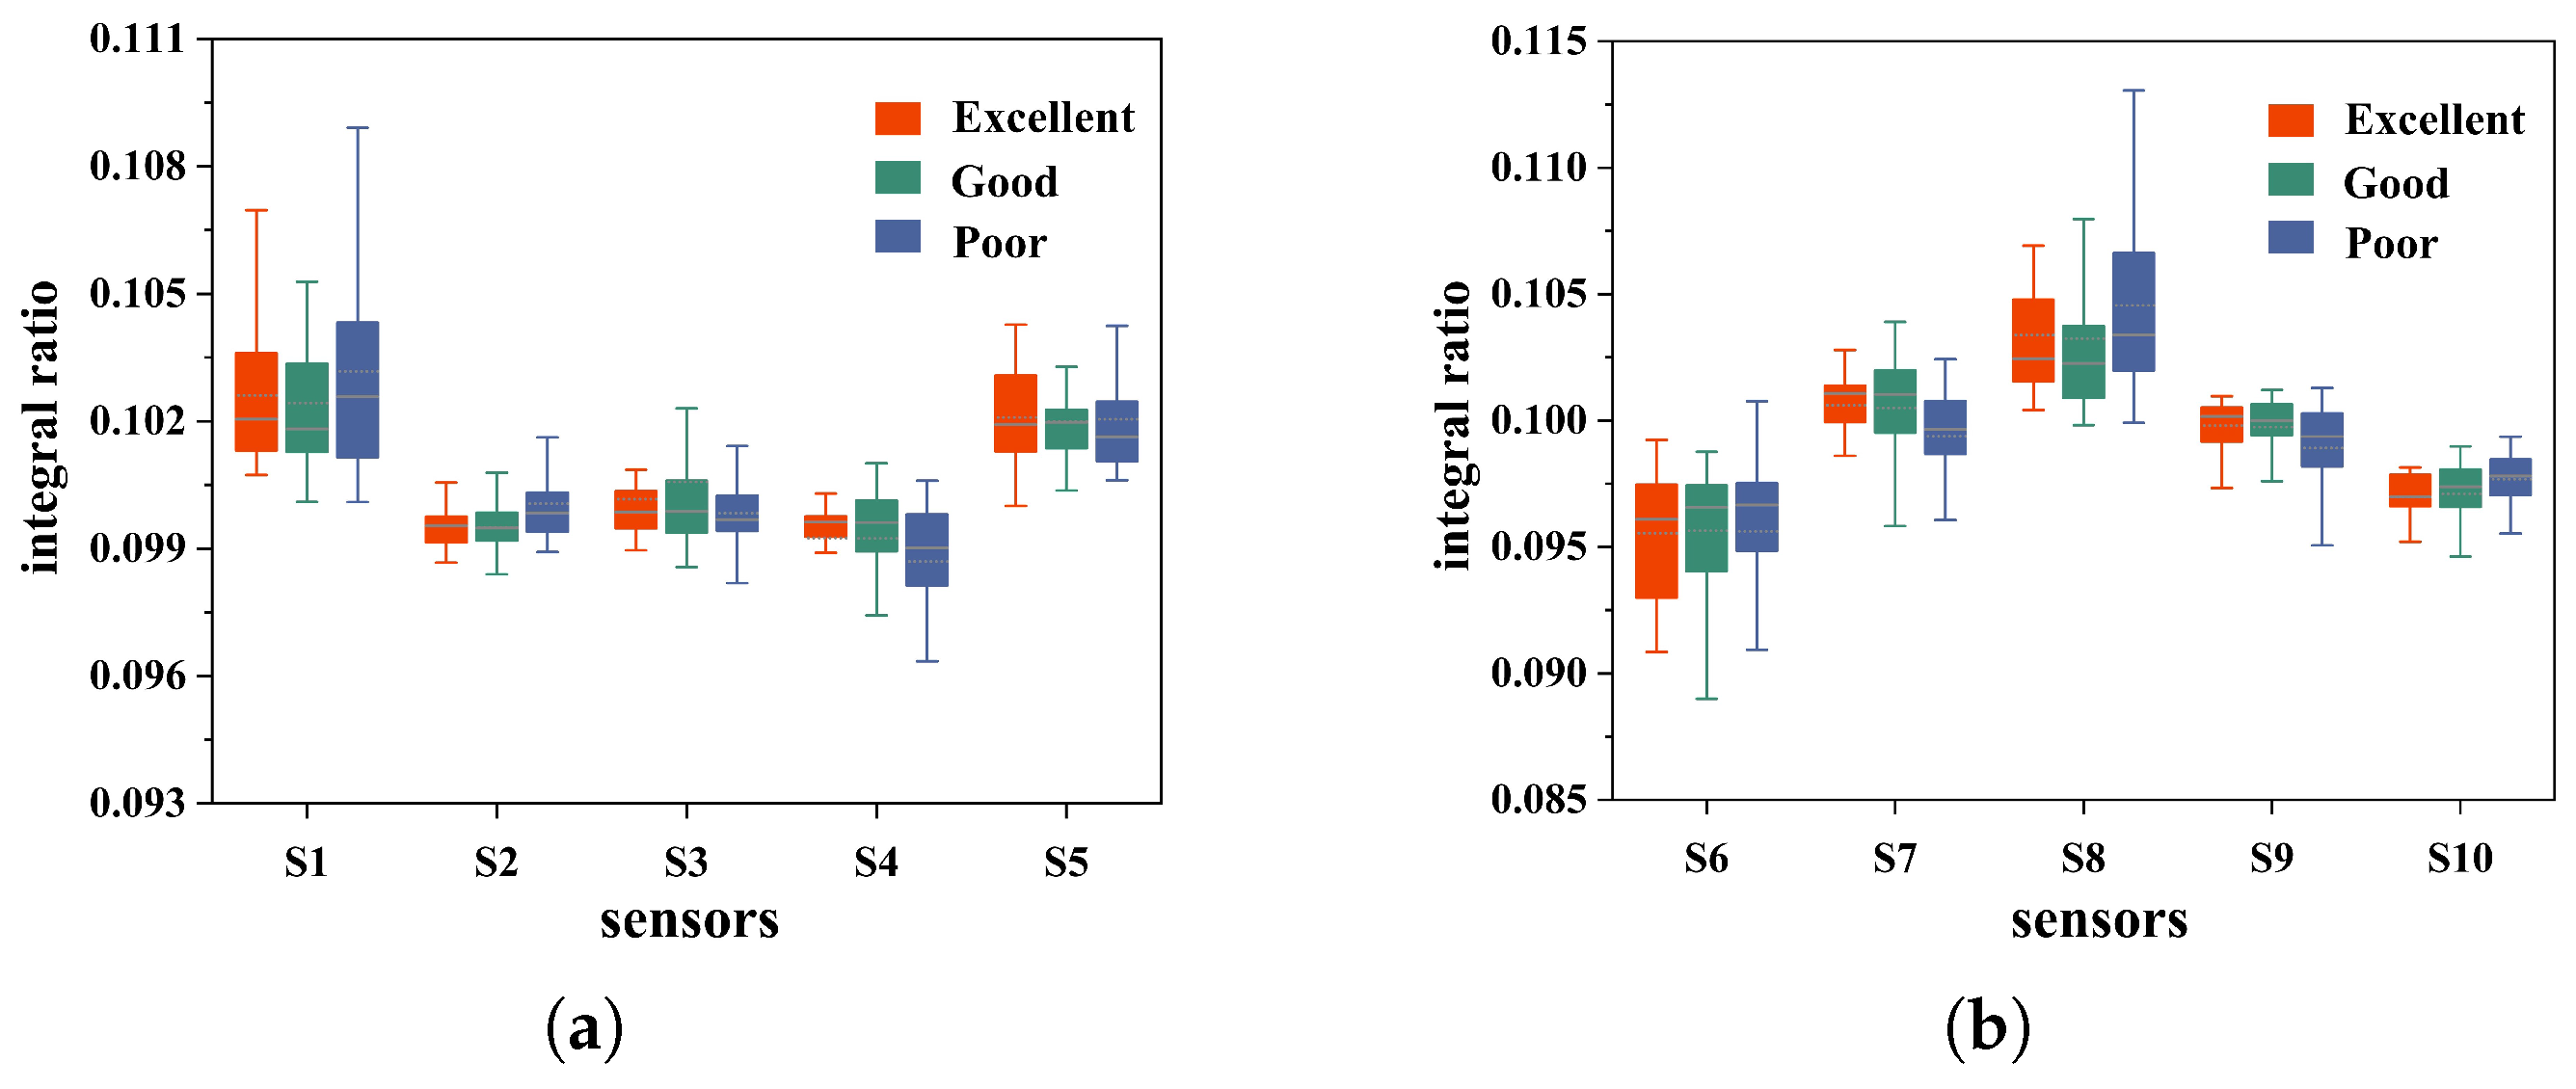
4.1. Data Feasibility Analysis and Preprocessing
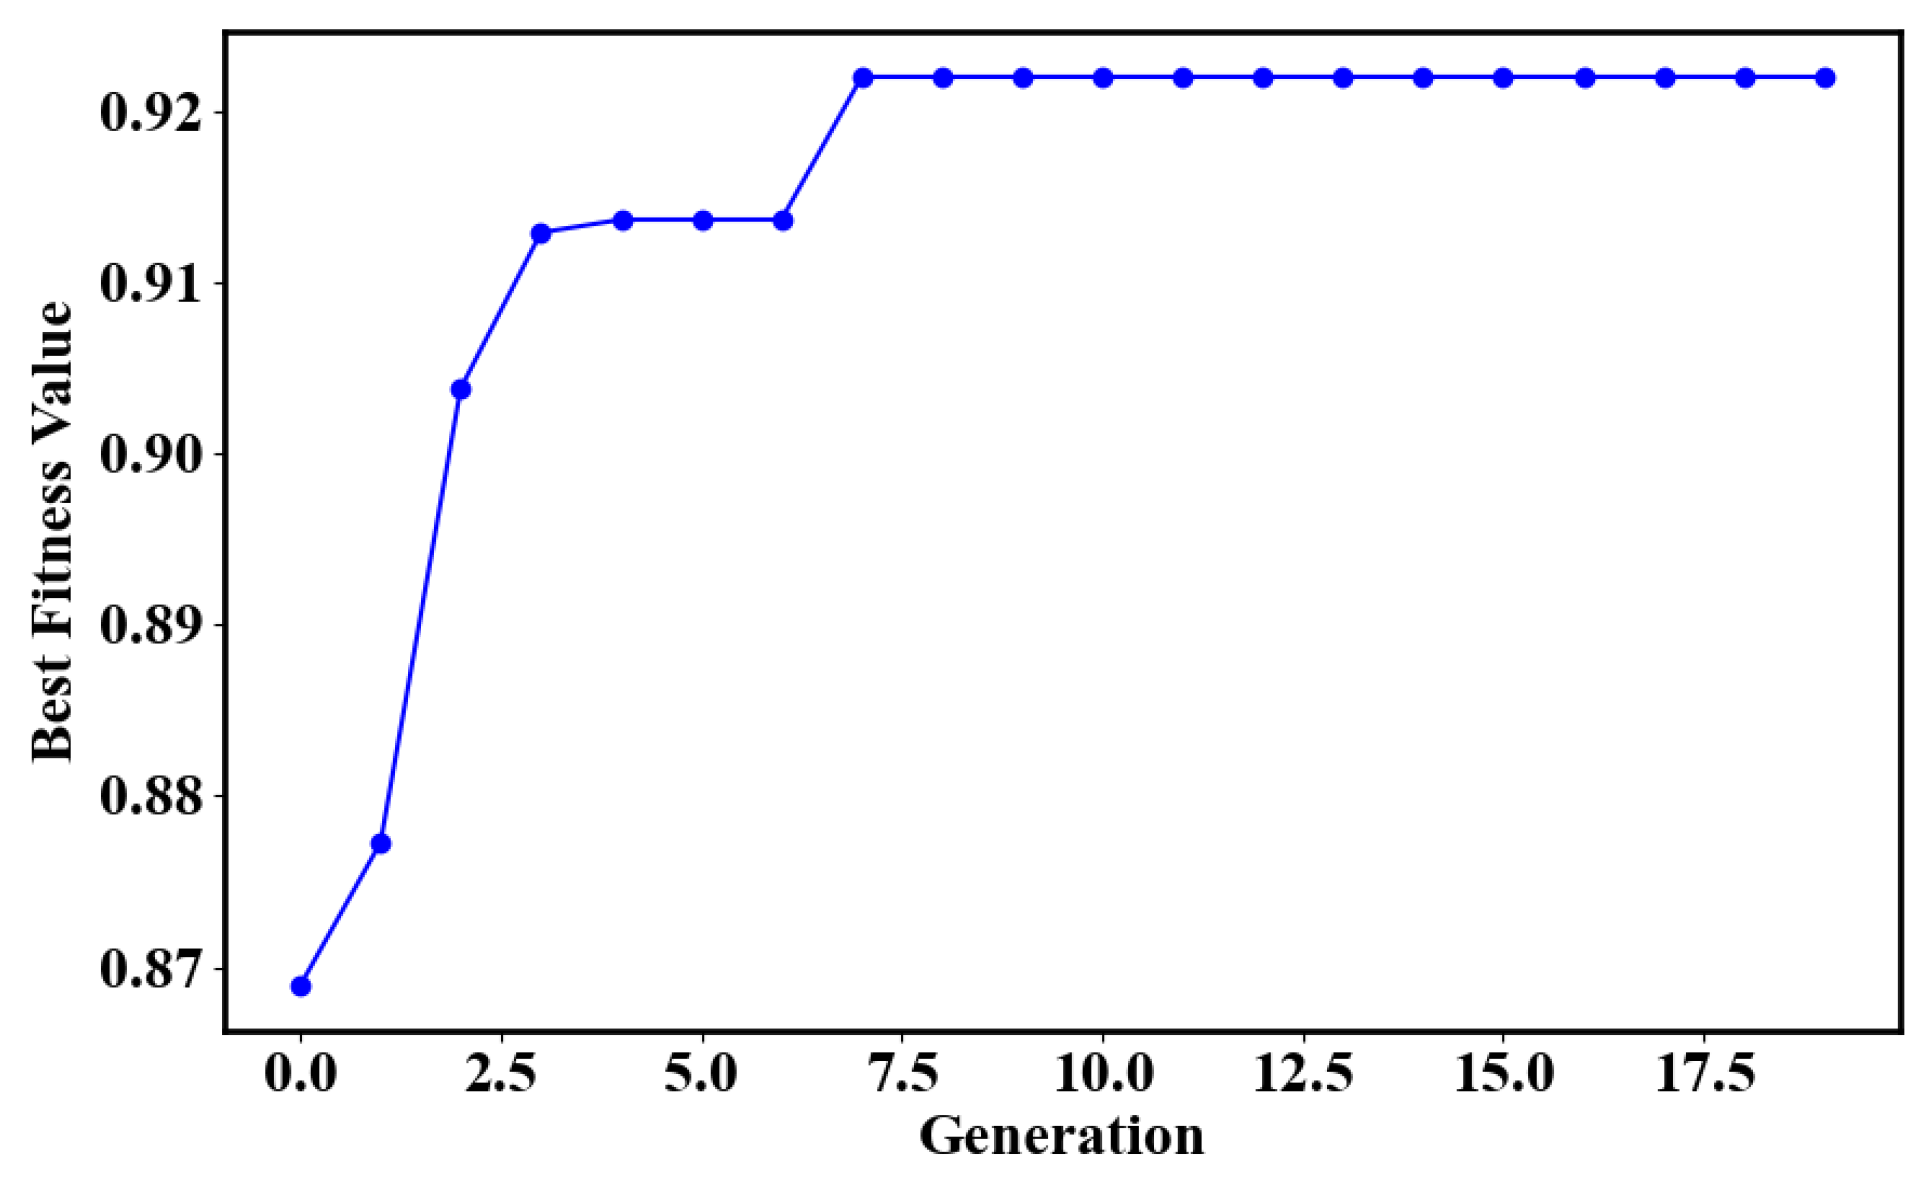
4.2. Classification and Model Validation
5. Conclusions
Author Contributions
Funding
Institutional Review Board Statement
Informed Consent Statement
Data Availability Statement
Conflicts of Interest
Appendix A
Appendix A.1

| Number | Sensor | Target Gas |
|---|---|---|
| 1 | MQ-138 | toluene, acetone, ethanol, hydrogen |
| 2 | MQ-136 | hydrogen sulfide |
| 3 | MQ-8 | hydrogen |
| 4 | MQ-5 | methane, propane |
| 5 | MQ-7B | carbon monoxide |
| 6 | WSP2110 | acetone, toluene, alcohol |
| 7 | MQ-4B | methane |
| 8 | MP-9 | carbon monoxide, methane |
| 9 | MP-4 | methane |
| 10 | MP-135 | hydrogen, alcohol, carbon monoxide |
Appendix A.2
| Date of Experiment: | Subject: | Health Status: |
|---|---|---|
| 1. Are you currently experiencing gastrointestinal distress? | ||
| 2. Do you currently have any respiratory complaints, such as coughing or nasal congestion? | ||
| 3. Have you had any recent symptoms of panic and weakness? | ||
| 4. How was the quality of your sleep last night? | ||
| 5. Are you experiencing toothache, mouth eruptions, and yellowing of the urine? | ||
| 6. Do you currently have a cold? | ||
| Note: | ||
| Score: | ||
Appendix A.3
Appendix A.4
| PCA-SVM | PCA-RF | PCA-KNN | |
|---|---|---|---|
| Accuracy | 65.71% | 56.16% | 54.29% |
References
- Li, Y.; Wei, X.; Zhou, Y.; Wang, J.; You, R. Research progress of electronic nose technology in exhaled breath disease analysis. Microsyst. Nanoeng. 2023, 9, 129. [Google Scholar] [CrossRef]
- Shanmugasundaram, A.; Manorama, S.V.; Kim, D.-S.; Jeong, Y.-J.; Weon Lee, D. Toward Point-of-Care chronic disease Management: Biomarker detection in exhaled breath using an E-Nose sensor based on rGO/SnO2 superstructures. Chem. Eng. J. 2022, 448, 137736. [Google Scholar] [CrossRef]
- Moon, H.G.; Jung, Y.; Han, S.D.; Shim, Y.-S.; Shin, B.; Lee, T.; Kim, J.-S.; Lee, S.; Jun, S.C.; Park, H.-H.; et al. Chemiresistive Electronic Nose toward Detection of Biomarkers in Exhaled Breath. ACS Appl. Mater. Interfaces 2016, 8, 20969–20976. [Google Scholar] [CrossRef]
- Wilder-Smith, C.H.; Olesen, S.S.; Materna, A.; Drewes, A.M. Breath methane concentrations and markers of obesity in patients with functional gastrointestinal disorders. United Eur. Gastroenterol. J. 2017, 6, 595–603. [Google Scholar] [CrossRef]
- Scharte, M.; von Ostrowski, T.A.; Daudel, F.; Freise, H.; Van Aken, H.; Bone, H.G. Endogenous carbon monoxide production correlates weakly with severity of acute illness. Eur. J. Anaesthesiol. 2006, 23, 117–122. [Google Scholar] [CrossRef]
- Esfahani, S.; Wicaksono, A.; Mozdiak, E.; Arasaradnam, R.P.; Covington, J.A. Non-Invasive Diagnosis of Diabetes by Volatile Organic Compounds in Urine Using FAIMS and Fox4000 Electronic Nose. Biosensors 2018, 8, 121. [Google Scholar] [CrossRef]
- Wang, X.; Li, H.; Wang, Y.; Fu, B.; Ai, B. Intelligent Detection and Odor Recognition of Cigarette Packaging Paper Boxes Based on a Homemade Electronic Nose. Micromachines 2024, 15, 458. [Google Scholar] [CrossRef]
- Meléndez, F.; Sánchez, R.; Fernández, J.Á.; Belacortu, Y.; Bermúdez, F.; Arroyo, P.; Martín-Vertedor, D.; Lozano, J. Design of a Multisensory Device for Tomato Volatile Compound Detection Based on a Mixed Metal Oxide—Electrochemical Sensor Array and Optical Reader. Micromachines 2023, 14, 1761. [Google Scholar] [CrossRef]
- Sánchez, C.; Santos, J.P.; Lozano, J. Use of Electronic Noses for Diagnosis of Digestive and Respiratory Diseases through the Breath. Biosensors 2019, 9, 35. [Google Scholar] [CrossRef]
- Aghoutane, Y.; Brebu, M.; Moufid, M.; Ionescu, R.; Bouchikhi, B.; El Bari, N. Detection of Counterfeit Perfumes by Using GC-MS Technique and Electronic Nose System Combined with Chemometric Tools. Micromachines 2023, 14, 524. [Google Scholar] [CrossRef]
- Yang, H.-Y.; Chen, W.-C.; Tsai, R.-C. Accuracy of the Electronic Nose Breath Tests in Clinical Application: A Systematic Review and Meta-Analysis. Biosensors 2021, 11, 469. [Google Scholar] [CrossRef]
- Westenbrink, E.; Arasaradnam, R.P.; O’Connell, N.; Bailey, C.; Nwokolo, C.; Bardhan, K.D.; Covington, J.A. Development and application of a new electronic nose instrument for the detection of colorectal cancer. Biosens. Bioelectron. 2015, 67, 733–738. [Google Scholar] [CrossRef]
- Lee, C.-H.; Chen, I.-T.; Yang, H.-C.; Chen, Y.J. An AI-powered Electronic Nose System with Fingerprint Extraction for Aroma Recognition of Coffee Beans. Micromachines 2022, 13, 1313. [Google Scholar] [CrossRef]
- Zhang, J.; Xue, Y.; Sun, Q.; Zhang, T.; Chen, Y.; Yu, W.; Xiong, Y.; Wei, X.; Yu, G.; Wan, H.; et al. A miniaturized electronic nose with artificial neural network for anti-interference detection of mixed indoor hazardous gases. Sens. Actuators B 2021, 326, 128822. [Google Scholar] [CrossRef]
- Saidi, T.; Zaim, O.; Moufid, M.; El Bari, N.; Ionescu, R.; Bouchikhi, B. Exhaled breath analysis using electronic nose and gas chromatography–mass spectrometry for non-invasive diagnosis of chronic kidney disease, diabetes mellitus and healthy subjects. Sens. Actuators B 2018, 257, 178–188. [Google Scholar] [CrossRef]
- Rahman, S.; Alwadie, A.S.; Irfan, M.; Nawaz, R.; Raza, M.; Javed, E.; Awais, M. Wireless E-Nose Sensors to Detect Volatile Organic Gases through Multivariate Analysis. Micromachines 2020, 11, 597. [Google Scholar] [CrossRef]
- Das, P.; Marvi, P.K.; Ganguly, S.; Tang, X.; Wang, B.; Srinivasan, S.; Rajabzadeh, A.R.; Rosenkranz, A. MXene-Based Elastomer Mimetic Stretchable Sensors: Design, Properties, and Applications. Nano-Micro Lett. 2024, 16, 135. [Google Scholar] [CrossRef]
- Ward, A.; Petrie, A.; Honek, J.F.; Tang, X.S. Analyte-Dependent Sensing Mechanisms: The Fabrication and Characterization of a 32-Channel Array of SWCNT-TF Chemiresistive Sensors. IEEE Nanotechnol. Mag. 2014, 8, 29–37. [Google Scholar] [CrossRef]
- van den Velde, S.; Quirynen, M.; van Hee, P.; van Steenberghe, D. Differences between Alveolar Air and Mouth Air. Anal. Chem. 2007, 79, 3425–3429. [Google Scholar] [CrossRef]
- Caro, J.; Gallego, M. Alveolar Air and Urine Analyses As Biomarkers of Exposure to Trihalomethanes in an Indoor Swimming Pool. Environ. Sci. Technol. 2008, 42, 5002–5007. [Google Scholar] [CrossRef]
- Hao, Y.; Liang, X.; Mingfu, C.; Xing, C.; Ping, W.; Jiwei, J.; Yuelin, W. Detection volatile organic compounds in breath as markers of lung cancer using a novel electronic nose. In Proceedings of the Sensor, 2003 IEEE, Toronto, ON, Canada, 22–24 October 2003; pp. 1333–1337. [Google Scholar]
- Castellanos, M.; Xifra, G.; Fernández-Real, J.M.; Sánchez, J.M. Breath gas concentrations mirror exposure to sevoflurane and isopropyl alcohol in hospital environments in non-occupational conditions. J. Breath Res. 2016, 10, 016001. [Google Scholar] [CrossRef]
- Alonso, M.; Castellanos, M.; Sanchez, J.M. Evaluation of potential breath biomarkers for active smoking: Assessment of smoking habits. Anal. Bioanal. Chem. 2010, 396, 2987–2995. [Google Scholar] [CrossRef]
- Wang, X.R.; Lizier, J.T.; Berna, A.Z.; Bravo, F.G.; Trowell, S.C. Human breath-print identification by E-nose, using information-theoretic feature selection prior to classification. Sens. Actuators B 2015, 217, 165–174. [Google Scholar] [CrossRef]
- Grabowska-Polanowska, B.; Faber, J.; Skowron, M.; Miarka, P.; Pietrzycka, A.; Śliwka, I.; Amann, A. Detection of potential chronic kidney disease markers in breath using gas chromatography with mass-spectral detection coupled with thermal desorption method. J. Chromatogr. A 2013, 1301, 179–189. [Google Scholar] [CrossRef]
- Mieth, M.; Schubert, J.K.; Gröger, T.; Sabel, B.; Kischkel, S.; Fuchs, P.; Hein, D.; Zimmermann, R.; Miekisch, W. Automated Needle Trap Heart-Cut GC/MS and Needle Trap Comprehensive Two-Dimensional GC/TOF-MS for Breath Gas Analysis in the Clinical Environment. Anal. Chem. 2010, 82, 2541–2551. [Google Scholar] [CrossRef]
- Guo, L.; Wang, C.; Chi, C.; Wang, X.; Liu, S.; Zhao, W.; Ke, C.; Xu, G.; Li, E. Exhaled breath volatile biomarker analysis for thyroid cancer. Transl. Res. 2015, 166, 188–195. [Google Scholar] [CrossRef]
- Panigrahi, S.; Balasubramanian, S.; Gu, H.; Logue, C.M.; Marchello, M. Design and development of a metal oxide based electronic nose for spoilage classification of beef. Sens. Actuators B 2006, 119, 2–14. [Google Scholar] [CrossRef]
- Aghili, N.S.; Rasekh, M.; Karami, H.; Edriss, O.; Wilson, A.D.; Ramos, J. Aromatic Fingerprints: VOC Analysis with E-Nose and GC-MS for Rapid Detection of Adulteration in Sesame Oil. Sensors 2023, 23, 6294. [Google Scholar] [CrossRef]
- Chen, H.; Huo, D.; Zhang, J. Gas Recognition in E-Nose System: A Review. IEEE Trans. Biomed. Circuits Syst. 2022, 16, 169–184. [Google Scholar] [CrossRef]
- Binson, V.A.; Subramoniam, M.; Sunny, Y.; Mathew, L. Prediction of Pulmonary Diseases With Electronic Nose Using SVM and XGBoost. IEEE Sens. J. 2021, 21, 20886–20895. [Google Scholar] [CrossRef]
- de la Rica-Martinez, A.; Martínez-Muñoz, G.; Sanjuan, M.A.; Conesa-Celdrán, A.; Garcia-Moreno, L.; Estan-Cerezo, G.; Oates, M.J.; Gonzalo-Jimenez, N.; Ruiz-Canales, A. Low-Cost Electronic Nose for the Determination of Urinary Infections. Sensors 2024, 24, 157. [Google Scholar] [CrossRef]
- Li, Z.; Yu, J.; Dong, D.; Yao, G.; Wei, G.; He, A.; Wu, H.; Zhu, H.; Huang, Z.; Tang, Z. E-nose based on a high-integrated and low-power metal oxide gas sensor array. Sens. Actuators B 2023, 380, 133289. [Google Scholar] [CrossRef]
- Güney, S.; Atasoy, A. Multiclass classification of n-butanol concentrations with k-nearest neighbor algorithm and support vector machine in an electronic nose. Sens. Actuators B 2012, 166–167, 721–725. [Google Scholar] [CrossRef]
- Qian, J.; Tian, F.; Luo, Y.; Lu, M.; Zhang, A. A Novel Multisensor Detection System Design for Low Concentrations of Volatile Organic Compounds. IRE Trans. Ind. Electron. 2022, 69, 5314–5324. [Google Scholar] [CrossRef]
- Robertson, H.T. Dead space: The physiology of wasted ventilation. Eur. Respir. J. 2014, 45, 1704–1716. [Google Scholar] [CrossRef]
- Gertler, R. Respiratory Mechanics. Anesthesiol. Clin. 2021, 39, 415–440. [Google Scholar] [CrossRef]
- Gray, J.S.; Grodins, F.S.; Carter, E.T. Alveolar and Total Ventilation and the Dead Space Problem. J. Appl. Physiol. 1956, 9, 307–320. [Google Scholar] [CrossRef]
- Petersson, J.; Glenny, R.W. Gas Exchange in the Lung. Semin. Respir. Crit. Care Med. 2023, 44, 555–568. [Google Scholar] [CrossRef]
- Xu, J.; Zhang, J.; Feng, L.; Qiu, J. Self-rated health of population in southern China: Association with socio-demographic characteristics measured with multiple-item self-rated health measurement scale. BMC Public Health 2010, 10, 393. [Google Scholar] [CrossRef]
- Wannamethee, G.; Shaper, A.G. Self-assessment of Health Status and Mortality in Middle-Aged British Men. Int. J. Epidemiol. 1991, 20, 239–245. [Google Scholar] [CrossRef]
- Parissis, J.T.; Nikolaou, M.; Farmakis, D.; Paraskevaidis, I.A.; Bistola, V.; Venetsanou, K.; Katsaras, D.; Filippatos, G.; Kremastinos, D.T. Self-assessment of health status is associated with inflammatory activation and predicts long-term outcomes in chronic heart failure. Eur. J. Heart Fail. 2009, 11, 163–169. [Google Scholar] [CrossRef]
- Luo, H.; Jia, P.; Qiao, S.; Duan, S. Enhancing electronic nose performance based on a novel QPSO-RBM technique. Sens. Actuators B 2018, 259, 241–249. [Google Scholar] [CrossRef]
- Zhou, Y.; Zhang, T.; Hu, J. System Design and SVM Identification Algorithm for the Ultrasonically Catalyzed Single-Sensor E-Nose. IEEE Trans. Instrum. Meas. 2022, 71, 1–9. [Google Scholar] [CrossRef]
- Hendrick, H.; Hidayat, R.; Horng, G.J.; Wang, Z.H. Non-Invasive Method for Tuberculosis Exhaled Breath Classification Using Electronic Nose. IEEE Sens. J. 2021, 21, 11184–11191. [Google Scholar] [CrossRef]
- Gu, S.; Chen, W.; Wang, Z.; Wang, J.; Huo, Y. Rapid detection of Aspergillus spp. infection levels on milled rice by headspace-gas chromatography ion-mobility spectrometry (HS-GC-IMS) and E-nose. LWT 2020, 132, 109758. [Google Scholar] [CrossRef]
- Capman, N.S.S.; Zhen, X.V.; Nelson, J.T.; Chaganti, V.R.S.K.; Finc, R.C.; Lyden, M.J.; Williams, T.L.; Freking, M.; Sherwood, G.J.; Bühlmann, P.; et al. Machine Learning-Based Rapid Detection of Volatile Organic Compounds in a Graphene Electronic Nose. ACS Nano 2022, 16, 19567–19583. [Google Scholar] [CrossRef]
- Guo, D.; Zhang, D.; Li, N.; Zhang, L.; Yang, J. A Novel Breath Analysis System Based on Electronic Olfaction. IEEE Trans. Biomed. Eng. 2010, 57, 2753–2763. [Google Scholar] [CrossRef]
- Li, W.; Liu, H.; Xie, D.; He, Z.; Pi, X. Lung Cancer Screening Based on Type-different Sensor Arrays. Sci. Rep. 2017, 7, 1969. [Google Scholar] [CrossRef]
- Tirzīte, M.; Bukovskis, M.; Strazda, G.; Jurka, N.; Taivans, I. Detection of lung cancer in exhaled breath with an electronic nose using support vector machine analysis. J. Breath Res. 2017, 11, 036009. [Google Scholar] [CrossRef]
- Fernandes, M.P.; Venkatesh, S.; Sudarshan, B.G. Early Detection of Lung Cancer Using Nano-Nose—A Review. Open Biomed. Eng. J. 2015, 9, 228–233. [Google Scholar] [CrossRef]


| Parameter Combination (c,) | (0.01,1) | (0.1,1) | (1,1) | (1,10) | (10,100) | GA(1,0.2) |
|---|---|---|---|---|---|---|
| Accuracy | 39.49% | 62.29% | 69.25% | 91.19% | 50.95% | 92.06% |
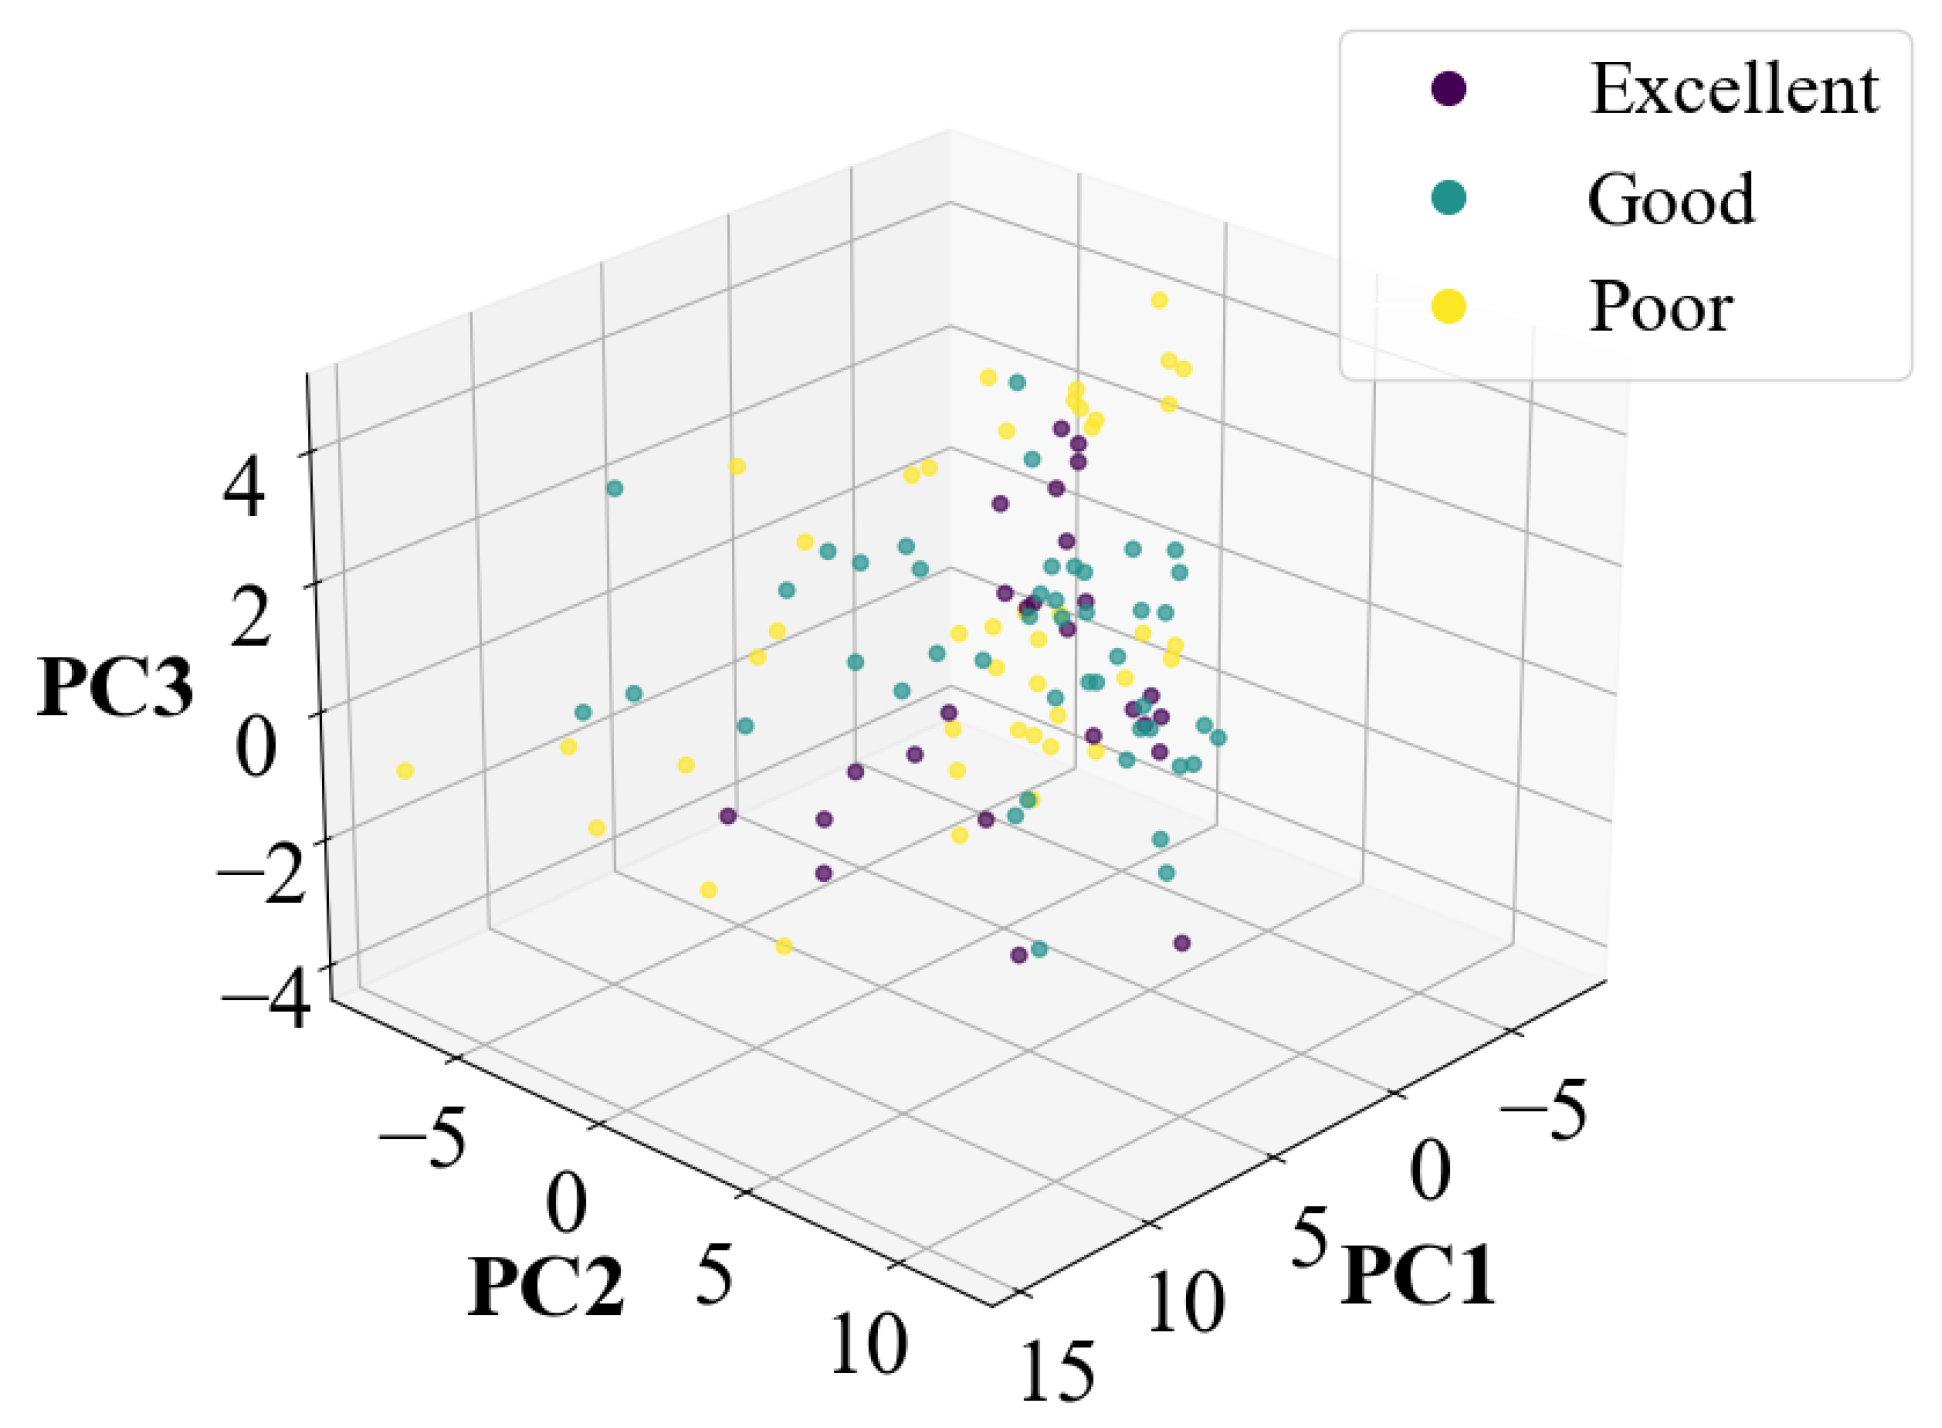
| Index | Excellent | Good | Poor | |
|---|---|---|---|---|
| LDA-SVM | Accuracy | 92.06% | ||
| Recall | 92% | 93.33% | 90.83% | |
| Precision | 96.67% | 90.14% | 93.06% | |
| F1 Score | 93.74% | 91.44% | 91.88% | |
| LDA-RF | Accuracy | 90.32% | ||
| Recall | 92% | 91.11% | 88.33% | |
| Precision | 93.81% | 90.14% | 91.28% | |
| F1 Score | 92.20% | 90.12% | 89.61% | |
| LDA-KNN | Accuracy | 93.04% | ||
| Recall | 92.31% | 97.78% | 88.64% | |
| Precision | 96% | 88% | 97.50% | |
| F1 Score | 94.12% | 92.63% | 92.86% |
Disclaimer/Publisher’s Note: The statements, opinions and data contained in all publications are solely those of the individual author(s) and contributor(s) and not of MDPI and/or the editor(s). MDPI and/or the editor(s) disclaim responsibility for any injury to people or property resulting from any ideas, methods, instructions or products referred to in the content. |
© 2025 by the authors. Licensee MDPI, Basel, Switzerland. This article is an open access article distributed under the terms and conditions of the Creative Commons Attribution (CC BY) license (https://creativecommons.org/licenses/by/4.0/).
Share and Cite
Xu, D.; Liu, P.; Meng, X.; Chen, Y.; Du, L.; Zhang, Y.; Qiao, L.; Zhang, W.; Kuang, J.; Liu, J. Design of an Electronic Nose System with Automatic End-Tidal Breath Gas Collection for Enhanced Breath Detection Performance. Micromachines 2025, 16, 463. https://doi.org/10.3390/mi16040463
Xu D, Liu P, Meng X, Chen Y, Du L, Zhang Y, Qiao L, Zhang W, Kuang J, Liu J. Design of an Electronic Nose System with Automatic End-Tidal Breath Gas Collection for Enhanced Breath Detection Performance. Micromachines. 2025; 16(4):463. https://doi.org/10.3390/mi16040463
Chicago/Turabian StyleXu, Dongfu, Pu Liu, Xiangming Meng, Yizhou Chen, Lei Du, Yan Zhang, Lixin Qiao, Wei Zhang, Jiale Kuang, and Jingjing Liu. 2025. "Design of an Electronic Nose System with Automatic End-Tidal Breath Gas Collection for Enhanced Breath Detection Performance" Micromachines 16, no. 4: 463. https://doi.org/10.3390/mi16040463
APA StyleXu, D., Liu, P., Meng, X., Chen, Y., Du, L., Zhang, Y., Qiao, L., Zhang, W., Kuang, J., & Liu, J. (2025). Design of an Electronic Nose System with Automatic End-Tidal Breath Gas Collection for Enhanced Breath Detection Performance. Micromachines, 16(4), 463. https://doi.org/10.3390/mi16040463