4.1. Principle of the Feed-Through Effect
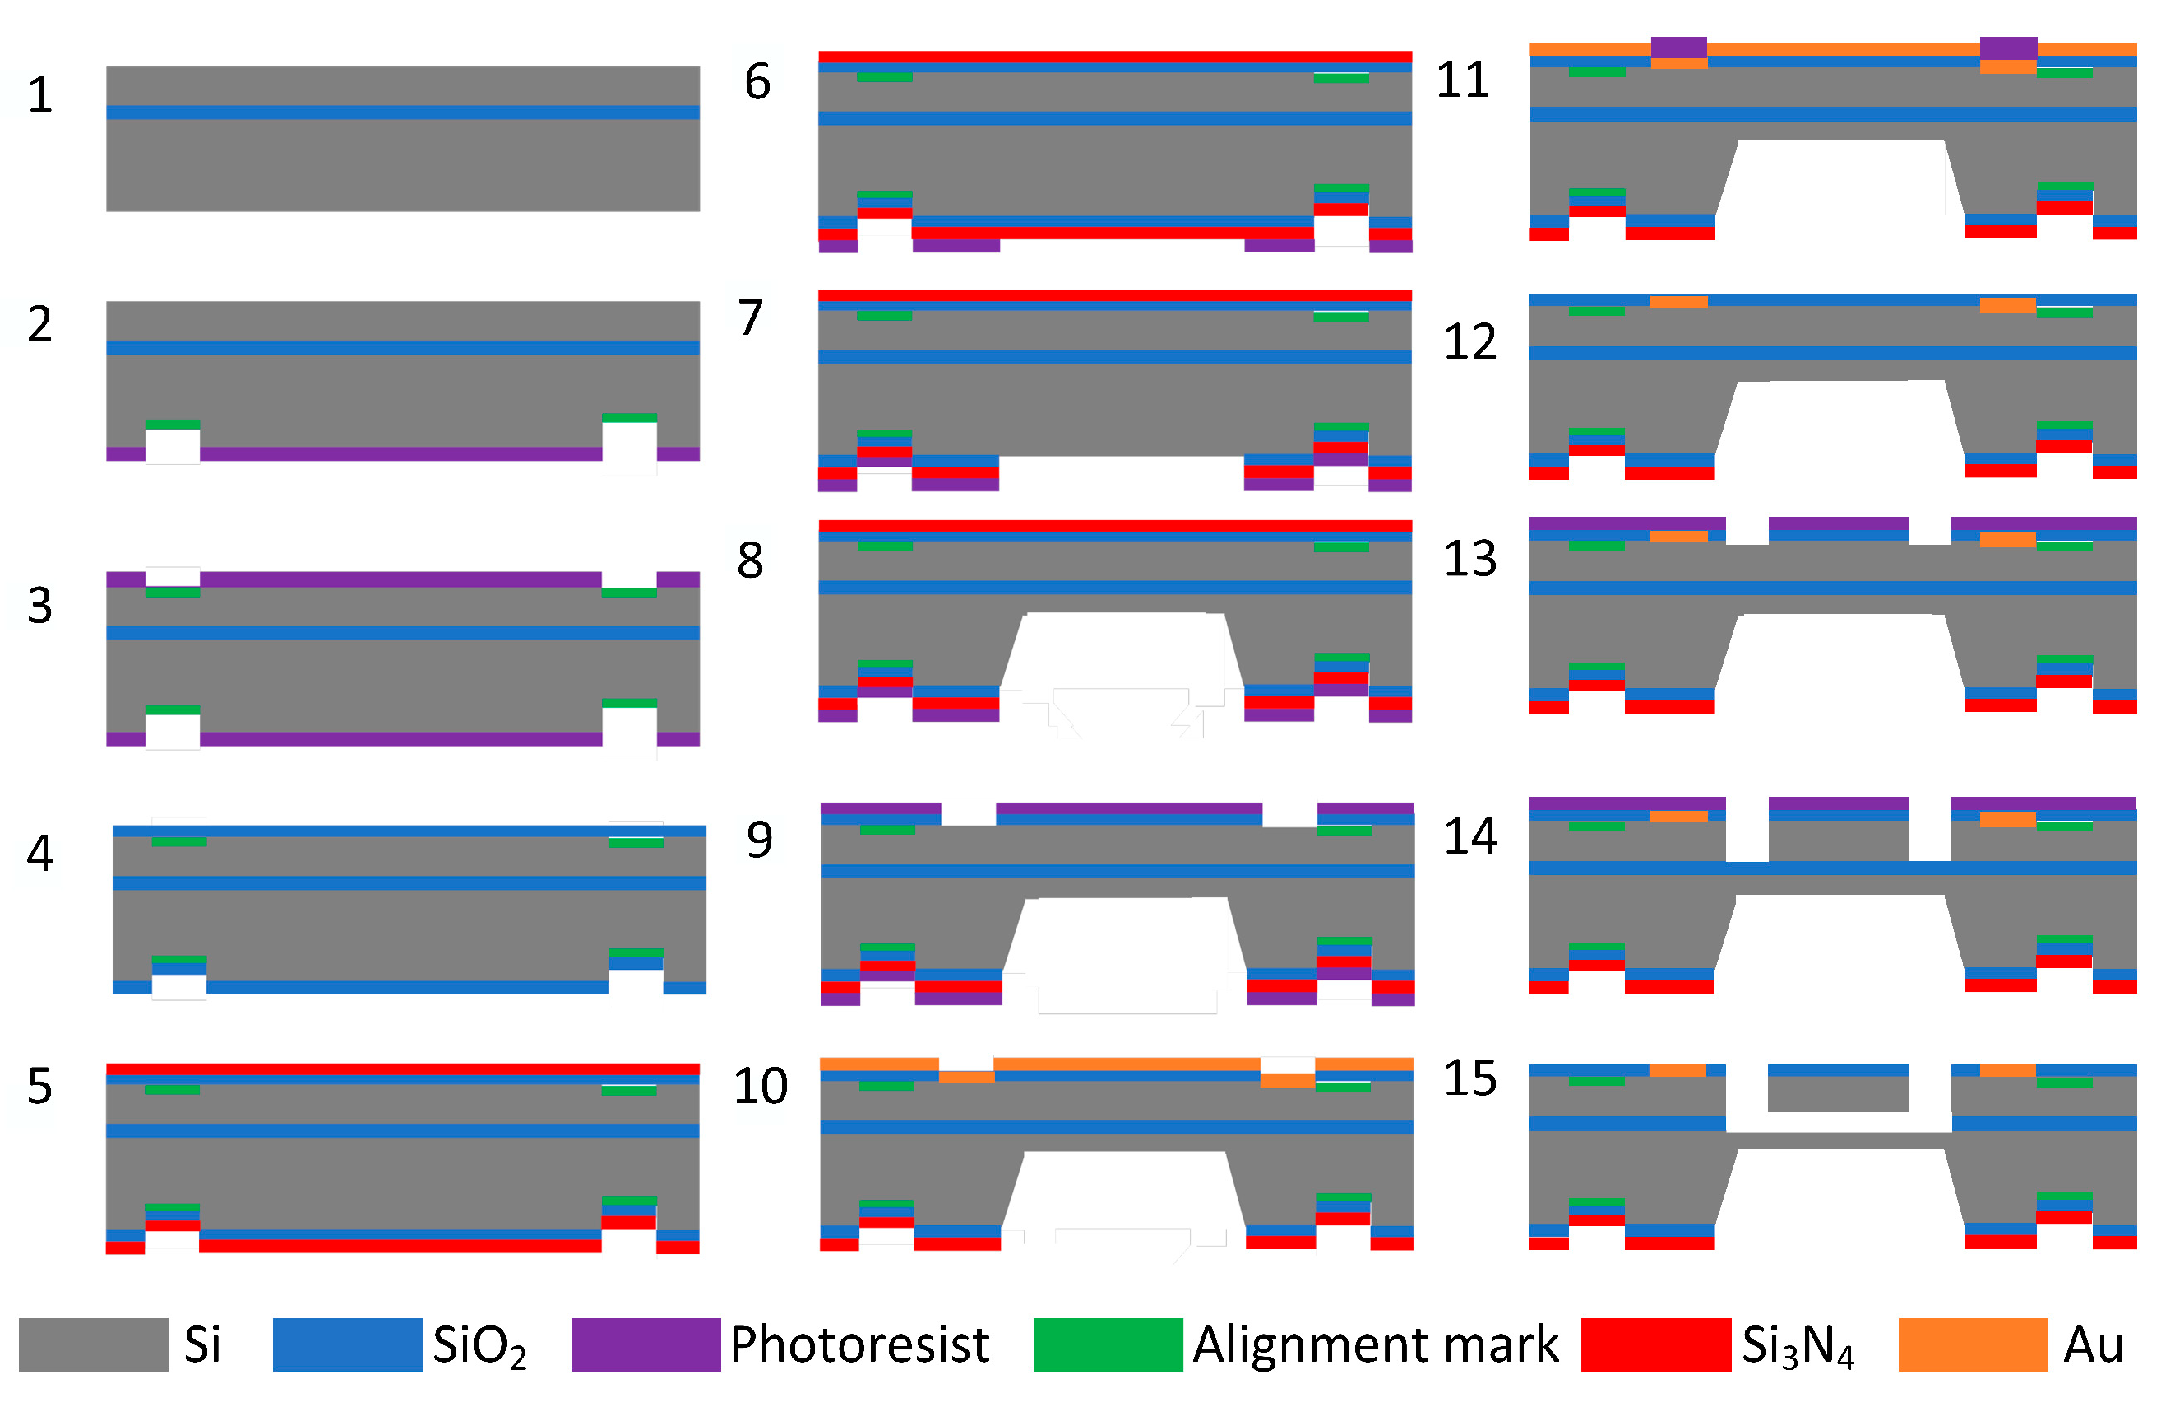
In this study, SOI (N-type <100>) wafers were used to fabricate pressure sensors. Initially, SOI wafers (top silicon 35 μm, buried oxygen layer 3 μm thick, 30,000 Å ± 500 Å, bottom silicon 400 μm thick) were prepared as shown in
Figure 5(1). This was followed by backside lithography and front-side lithography and thermal oxygen growth of SiO
2, as shown in
Figure 5(2–4). LPCVD deposited Si
3N
4 with a thickness of 1000 Å as a blocking layer for KOH etching as shown in
Figure 5(5–8), and backside lithography was performed, thereby opening the etching window for KOH solution. Si
3N
4 was etched using RIE with an etch thickness of 1000 Å, BOE etched SiO
2 with a thickness of 3000 Å, and KOH solution (concentration: 30%, temperature 80 °C) etched the back cavity to an etch depth of 325 μm. As shown in
Figure 5(9), photolithography was carried out to lithograph the metal dot window, remove the Si
3N
4, and etch the oxide layer. The next step is to sputter Au on the upper surface with a thickness of 200 nm, perform photolithography, and etch the Au layer to make the metal dots, as shown in
Figure 5(10–12). Subsequently, photolithography is performed to make the resonance structure graphical and etch the structure of the resonance layer, as shown in
Figure 5(13,14). Finally, scribing is performed to release the chip structure and complete the device processing, as shown in
Figure 5(15).
Figure 6 presents the top view and structural diagram of the resonant pressure sensor. The studied resonant pressure sensor features a dual resonator structure, comprising a long beam and a short beam. Positioned at the middle and edge of the pressure-sensitive diaphragm, they maximize the pressure-frequency response. The device enhances resonator sensitivity through differential output. Each resonator in the sensor adopts a double-beam resonator structure, generating symmetrical modes. This configuration suppresses nonlinear vibration, enhances device stability and vibration uniformity, and improves the coupling effect.
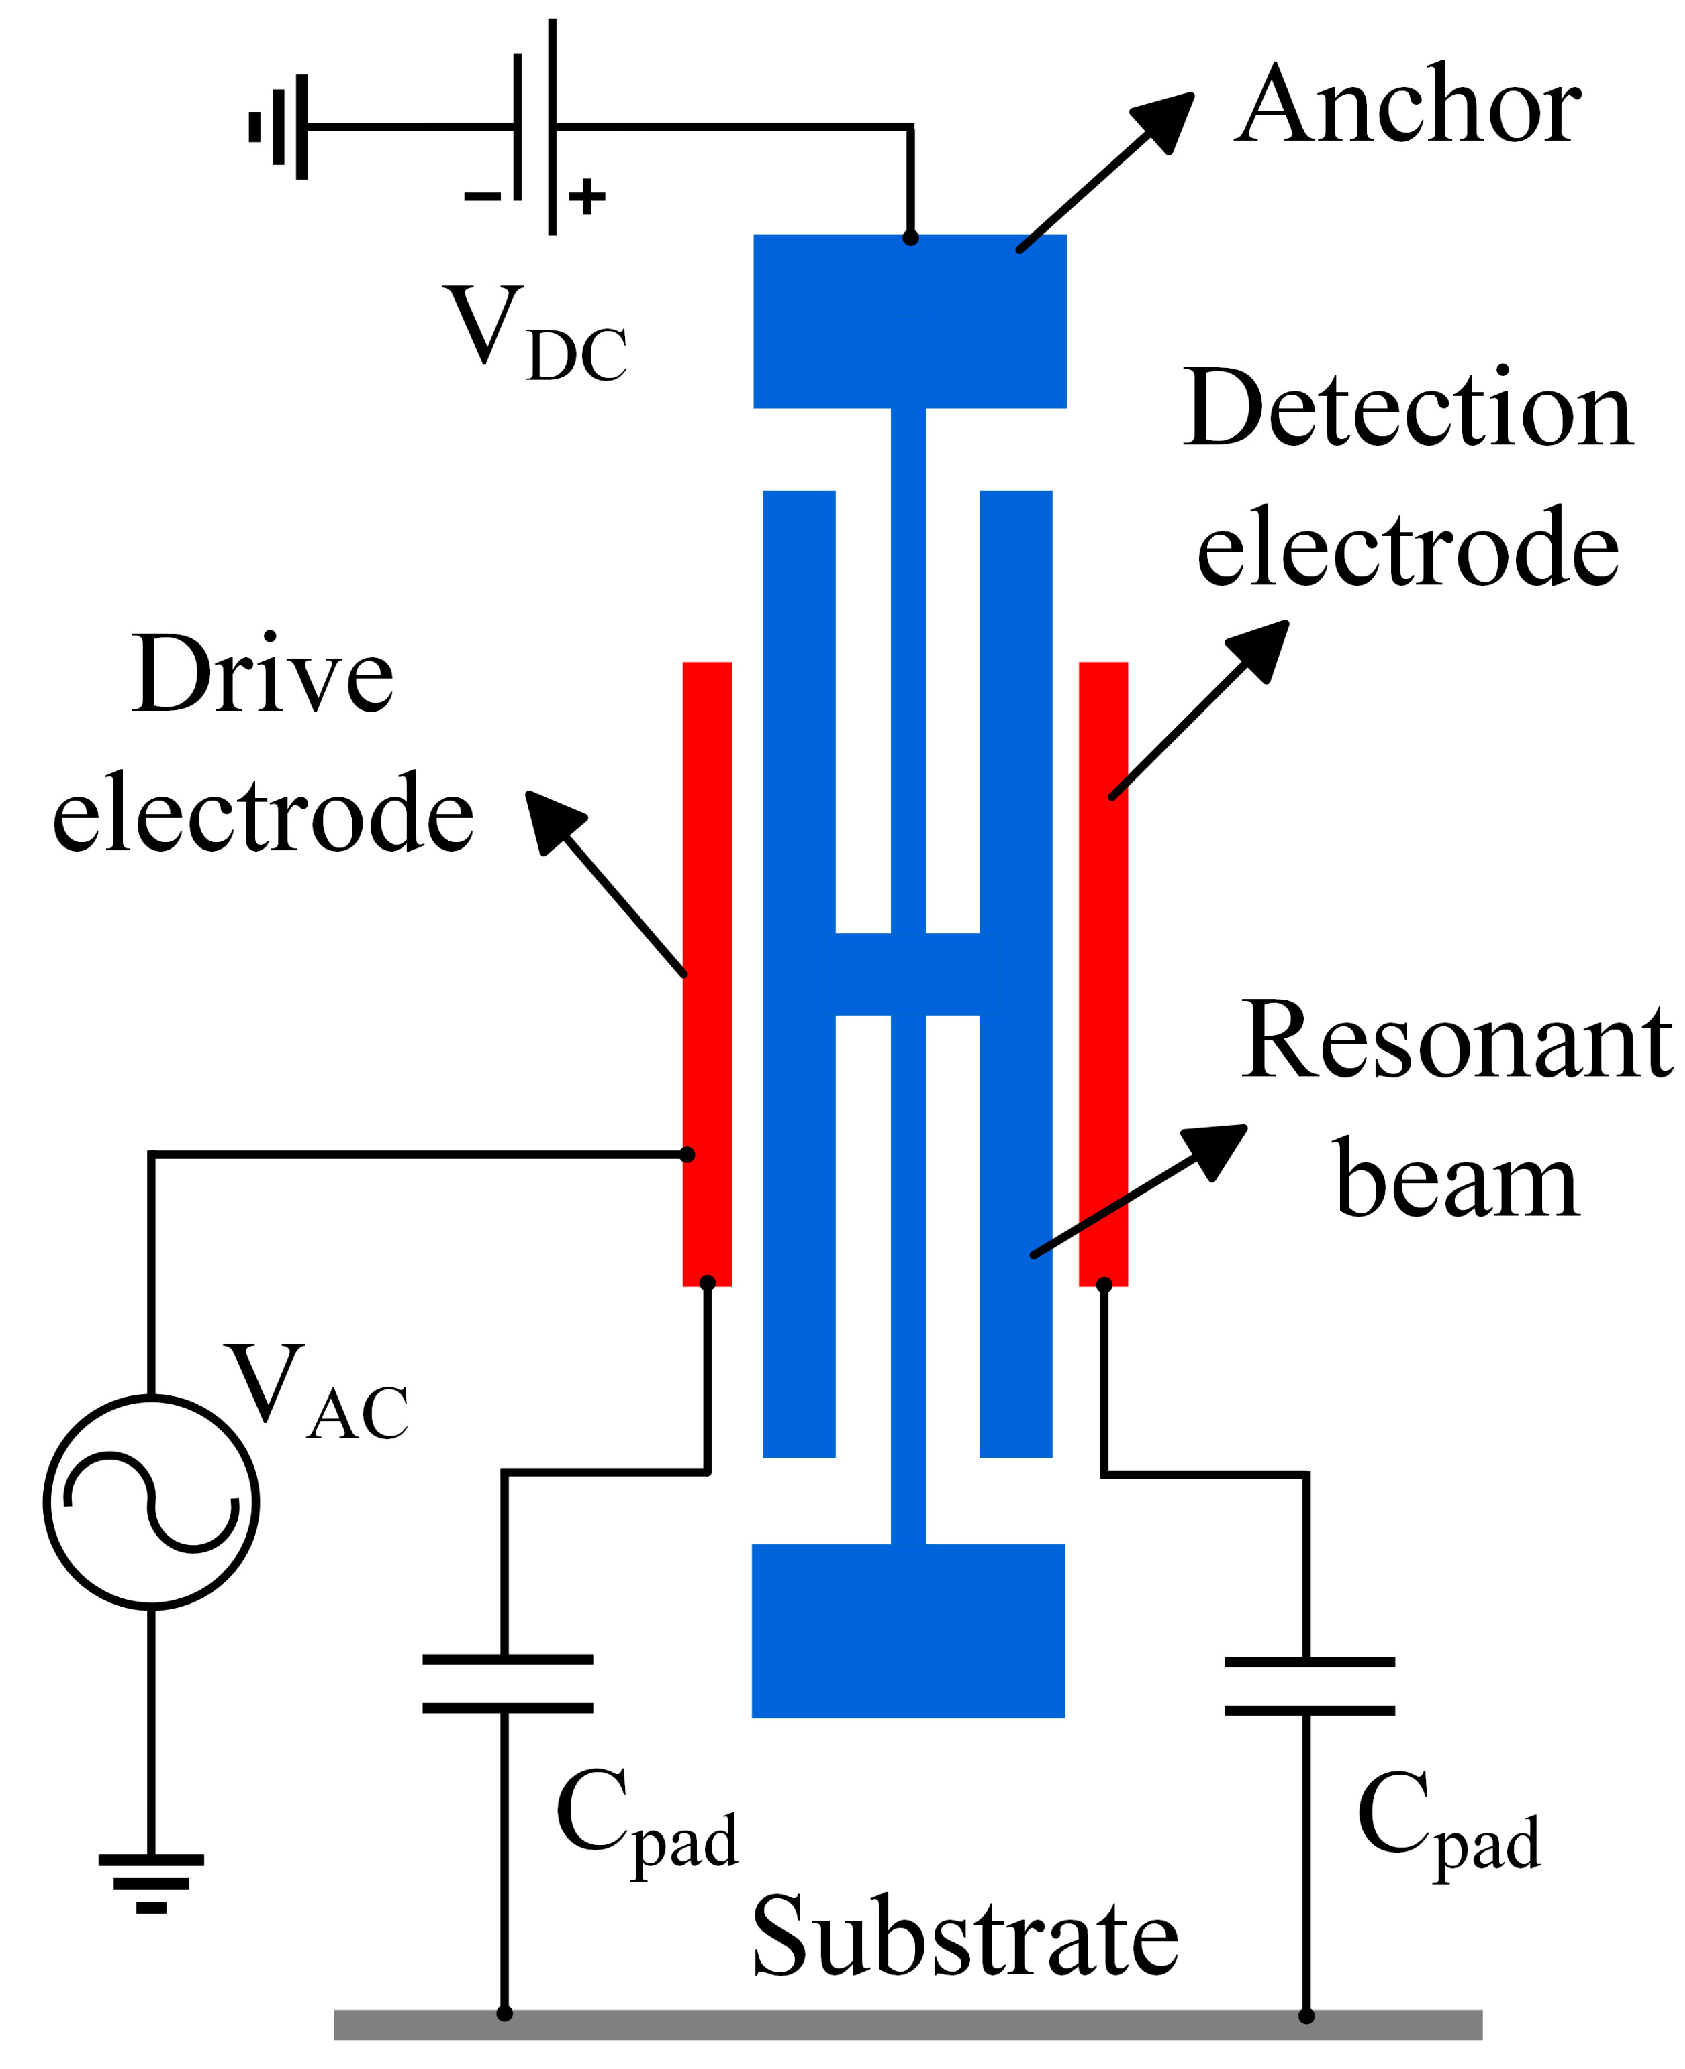
Figure 7 shows the schematic diagram of the feed-through effect of the resonant pressure sensor. Due to the presence of feed-through capacitance C
pad in the silicon micro-resonant pressure sensor chip itself, the interference resulting from the coupling of the drive signal with the detection signal is called the feed-through effect. Under the influence of the feed-through capacitance, part of the sensor’s drive signal is transmitted directly to the detection circuit, which is called the feed-through signal. The feed-through signal is not generated by the actual vibration of the pressure sensor; the signal will make the sensor output frequency signal not accurately reflect the measured pressure changes. The feed signal and pressure changes caused by the change of the detection signal law are different, resulting in the relationship between the pressure sensor output frequency and the pressure value producing a nonlinear error, affecting the measurement accuracy. If the measured pressure value change is slight, the pressure sensor output frequency change is also slight; the feed signal may mask the frequency change, reducing the signal-to-noise ratio of the detection signal. Pressure sensors require greater pressure changes to produce detectable frequency changes, reducing the sensitivity of the pressure sensor. All these effects lead to serious deviations of the measured resonant frequency and quality factor from the actual values, which cannot truly reflect the performance of the device and, in severe cases, can lead to the inability of the entire pressure test system to test the input external parameters. Due to the complex structure and precision processing of resonant pressure sensors, it is difficult to eliminate the feed-through effect from the structure. Therefore, this paper considers the use of circuit compensation technology to suppress the feed-through effect of the sensor.
Preliminary tests revealed a significant feed-through effect in the short beam resonator of the resonant pressure sensor. In a pressure-free vacuum environment, its initial resonant frequency is 34,964 Hz. When the resonant sensor works, its mechanical parameters and electrical parameters can be transformed into each other to establish the corresponding equivalent electrical model. Consequently, an equivalent circuit model for the short beam resonator can be developed to analyze the influence of the feed-through effect on the pressure sensor test. When the short-beam resonator is in the resonant state, the resonator structure can be equated to a mass-spring-damped second-order system, as shown in
Figure 8a. Where
m is the equivalent mass of the resonator,
k is the equivalent stiffness of the resonator,
c is the equivalent damping coefficient of the resonator,
Fd is the electrostatic driving force applied to the resonator, and
x is the small displacement of the resonator. The equivalent electrical model of the short beam resonator is established based on the equivalent mechanical model of the resonant sensor [
16], as shown in
Figure 8b. Where
RS is the equivalent resistance of the short beam resonator,
LS is the equivalent inductance,
CS is the equivalent capacitance, and
Cpad is the equivalent feed-through capacitance of the short beam resonator.
According to
Figure 8a, the kinetic equation of the resonator can be obtained from Newton’s second law, and the equation is denoted as:
where
Ad is the amplitude of the driving force and
ωd is the angular frequency of the driving force. Equation (9) can be simplified to:
where
ωn denotes the intrinsic angular frequency of the resonator and
Q denotes the quality factor of the resonator. The sensor’s drive voltage is formed by superimposing DC and AC components. This configuration determines the driving force magnitude, as shown in the following equation:
where E is the energy carried by the capacitor,
S is the relative area of the capacitor, vacuum permittivity
ε0 = 8.85418 × 10
−12 F/m,
εr is the relative permittivity of the capacitor, and
x0 is the initial distance between the two plates of the capacitor. It can be seen that the electrostatic force is a nonlinear function of the driving voltage and vibration displacement. Typically, in resonant sensors, the static gap
x0 between the resonant beam and metal electrodes is significantly larger than the vibration displacement
x. Then, Equation (11) can be localized by performing a Taylor expansion at
x0 to achieve local linearization, which can be simplified to:
In the equation, the first term represents the electrostatic attraction between the two plates of the capacitor, which is usually used to drive the resonant beam and is independent of the displacement change
x of the resonant beam. The second term represents the repulsive force, which is linearly related to the displacement variation
x of the resonant beam and affects the stiffness factor of the resonant beam. Substituting Equation (12) into Equation (9) reduces to:
Neglecting the effect of electrostatic force on the stiffness of the resonant transducer, the above equation can be simplified to:
The sensor employs differential technology and single-frequency electrostatic drive, permitting neglect of the DC and octave terms in Equation (14). The equation can be simplified to:
Equation (16) is obtained by derivation:
where
v is the speed of vibration of the resonator. Furthermore, during sensor operation, a weak capacitive signal emerges between the resonator and differential detection electrodes. Under the DC bias voltage, the charge signal undergoes displacement, generating a weak current output, which can be represented as [
16]:
When K = 2
C0VDC/
x0, the above equation can be simplified to:
According to
Figure 8b, the second-order differential equation of this equivalent electrical model can be expressed as:
Substituting Equation (18) into Equation (19), the above equation reduces to:
In addition:
where
ω is the intrinsic angular frequency,
α is the damping ratio, and
Q is the quality factor. Comparing Equations (16) and (20), it is obtained that:
The series resonant frequency of the equivalent electrical model is obtained at this point:
The specific parameters of the equivalent electrical model are calculated based on the above equation, and the specific parameters of the equivalent electrical model are shown in
Table 1.
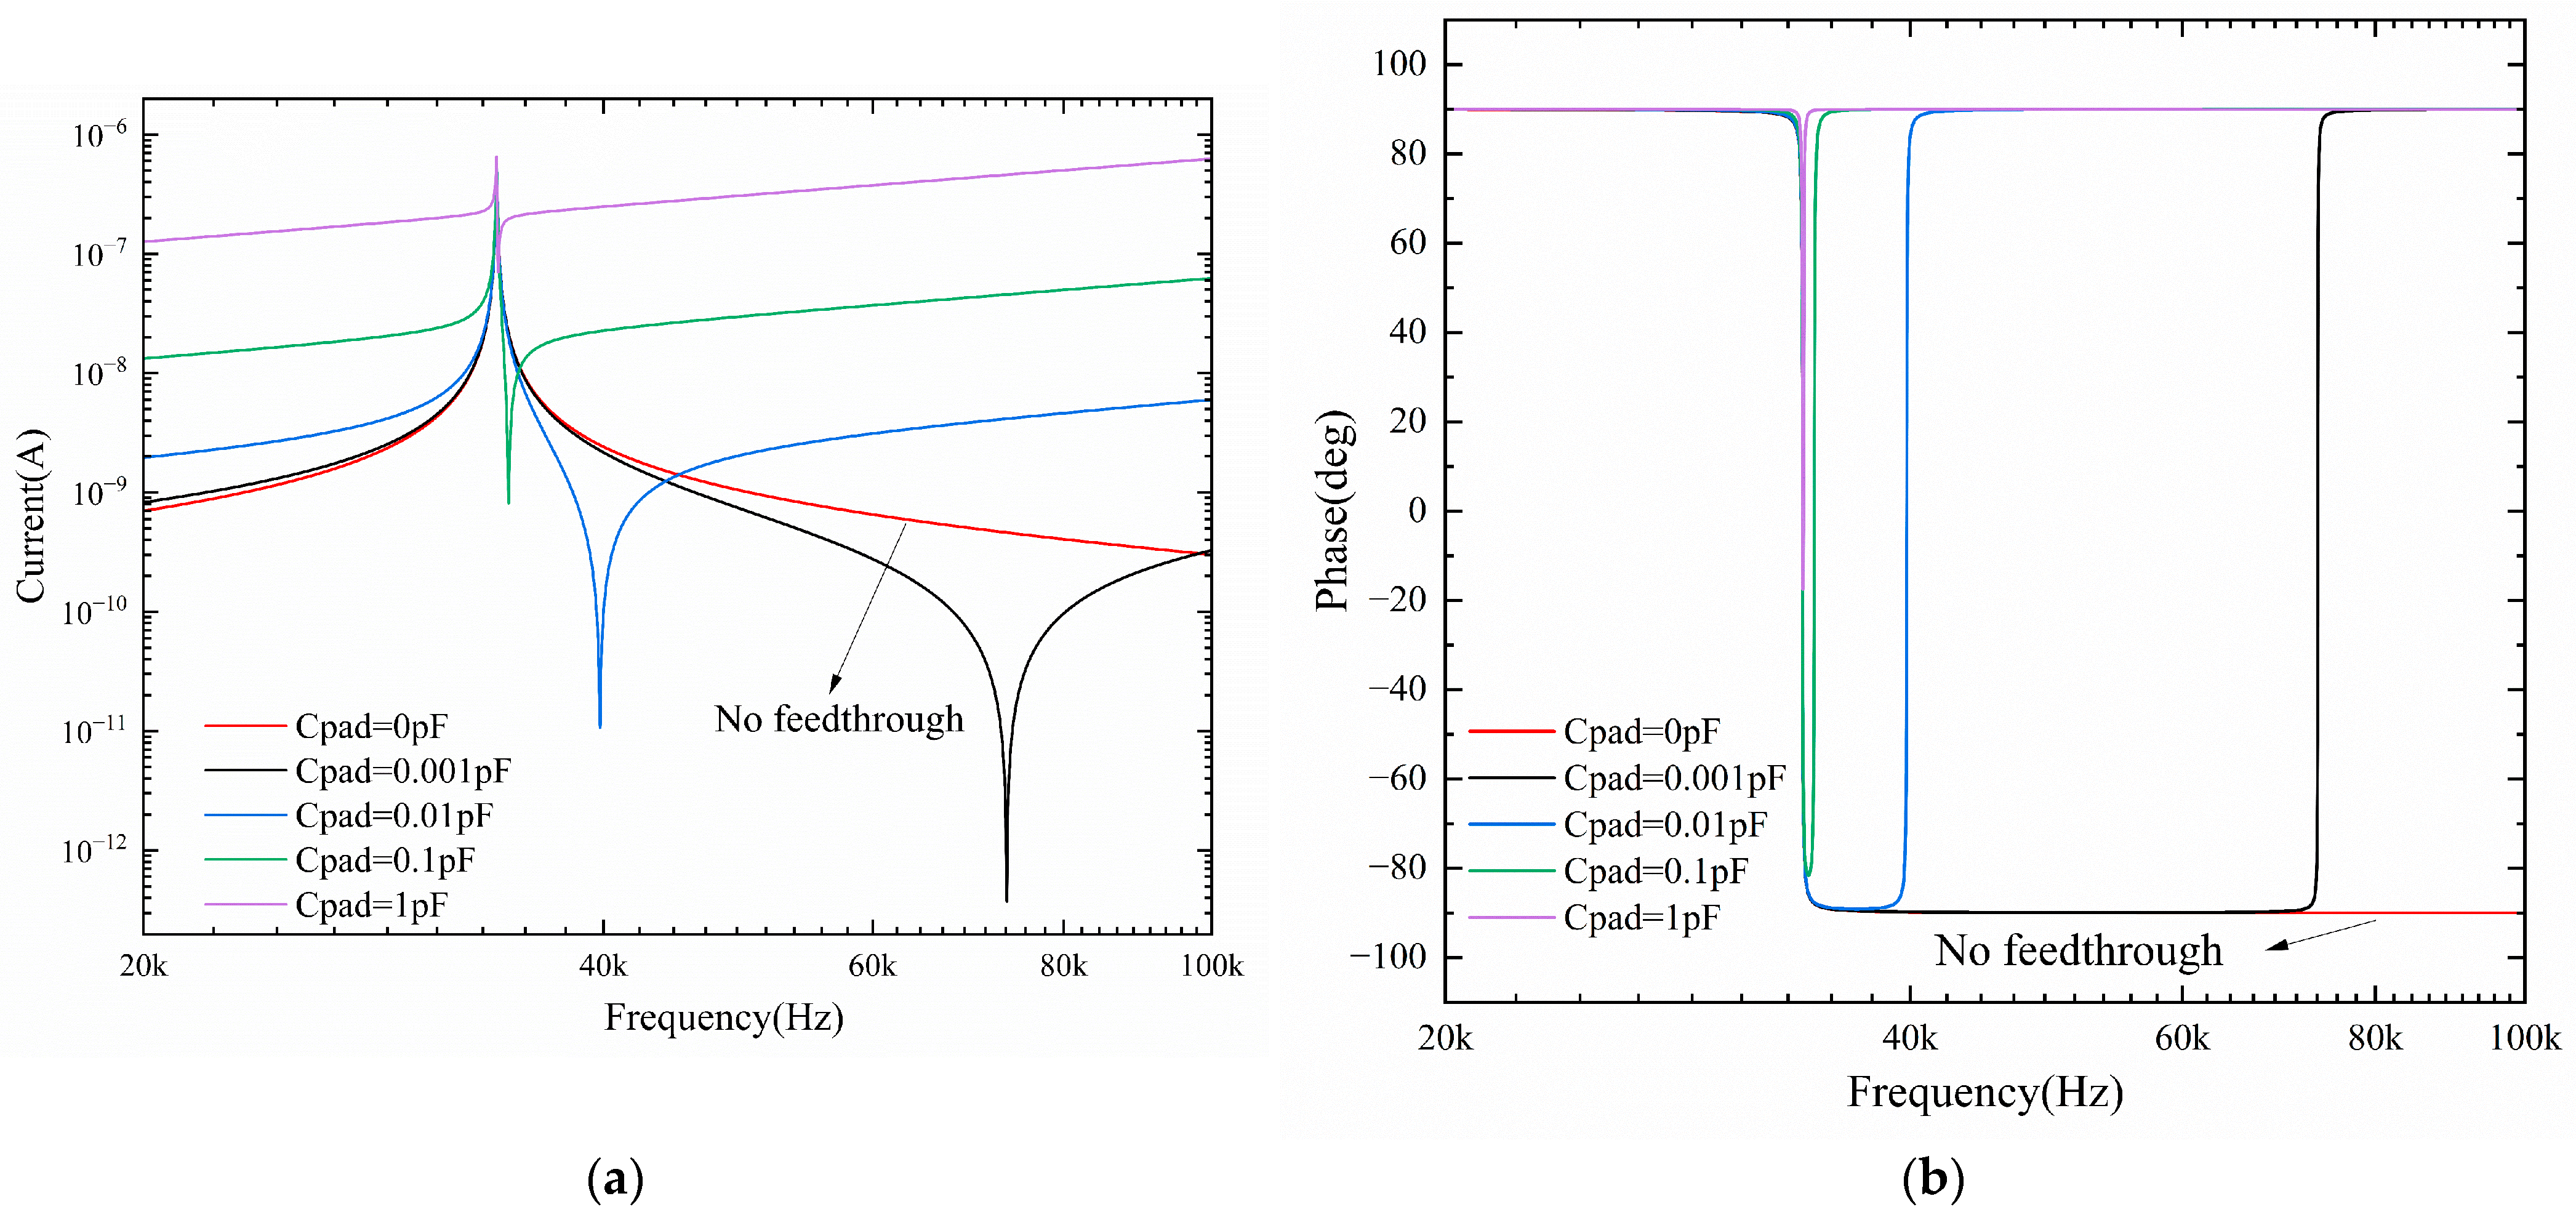
When the equivalent circuit model of the short beam resonator exists with different sizes of feed-through capacitance, the influence of the feed-through effect on its frequency response curve is shown in
Figure 9. From the simulation results, it can be seen that when there is a feed-through effect in the equivalent circuit model of the sensor, two resonant frequencies appear in its frequency characteristic curve. This is manifested in the amplitude–frequency characteristic curve by the appearance of two resonance peaks, one with a very large value and one with a very small value. The extreme value of the resonance peak for the resonance frequency of the sensor 34 kHz, the very small value of the resonance peak for the equivalent circuit of the feed-through capacitor introduced by the interference frequency. The phase–frequency characteristic curve of the equivalent circuit shows a sudden phase change corresponding to the resonance peak. When the feed-through capacitance of the sensor is increased, the amplitude–frequency characteristic curve of the equivalent circuit is shifted upward, the resonance frequency of the maximum value is shifted, and the resonance peak of the minimum value is gradually close to the resonance peak of the maximum value. When the feed-through capacitance is large enough, the resonance peaks corresponding to the extreme values on the amplitude–frequency characteristic curve coincide with the resonance peaks corresponding to the very small values, and there is no sudden phase change on the phase–frequency characteristic curve. This is specifically shown by the absence of resonant peaks, resonant frequencies, and corresponding phase transitions on the resonator’s sweep curve.
The above analysis indicates that the feed-through effect not only introduces interference frequencies into the sensor’s frequency response curve but also causes the sensor’s output signal to contain numerous feed-through signals. Severe feed-through signals can entirely overwhelm the sensor’s output useful signals, leading to the entire sensor test system’s failure.
4.2. Feed-Through Compensation Circuit
For the feed-through effect of silicon micro-resonant pressure sensors, differential detection techniques, EAM techniques, feed-through compensation circuits, and feed-through compensation algorithms are often used to realize the reduction or elimination of feed-through signals [
17,
18,
19,
20]. In addition, resonant pressure sensors using a piezoelectric drive/piezoresistive mode of operation can reduce the feed-through effect of the pressure sensor. However, it requires the use of special piezoelectric materials or strain gauges, etc. The choice of materials is relatively limited, and the manufacturing process may be more complex, resulting in higher costs. Due to the aging of the material, temperature changes, and other factors, its output signal may drift, resulting in reduced accuracy and stability. Sensors using electrostatic actuation/capacitive detection technology, on the other hand, have lower power consumption and higher accuracy and stability. This type of pressure sensor usually uses materials such as monocrystalline silicon to make the pressure membrane and sensitive elements, and the choice of materials is more flexible. With the development of microelectromechanical systems (MEMS) technology, its manufacturing cost is gradually reduced, and it can realize mass production. Therefore, it is of practical application to study the feed-through effect generated by resonant pressure sensors under the electrostatic actuation/capacitive detection technique.
The differential detection circuit’s ability to suppress feed-through signals is predicated on the device exhibiting good symmetry. Owing to manufacturing errors in device processing technology, process technology level, structural symmetry, and other factors, the symmetry of the MEMS resonant device falls short of the ideal state or is even suboptimal. In practice, while the resonant sensor test system can utilize a differential detection circuit to suppress the device’s feed-through effect, it cannot fully eliminate this effect. Consequently, differential drive and detection technology is employed to suppress the feed-through effect at its generation end. Additionally, a feed-through compensation circuit is designed to completely eliminate the feed-through effect.
The feed-through compensation circuit is based on the sensor test circuit, an additional compensation circuit to suppress the feed-through effect. It does not depend on the symmetry of the device itself, nor does it need to reduce the electrostatic drive efficiency. Theoretically, it can eliminate the feed-through effect and apply it to resonant pressure sensors with varying performance parameters.
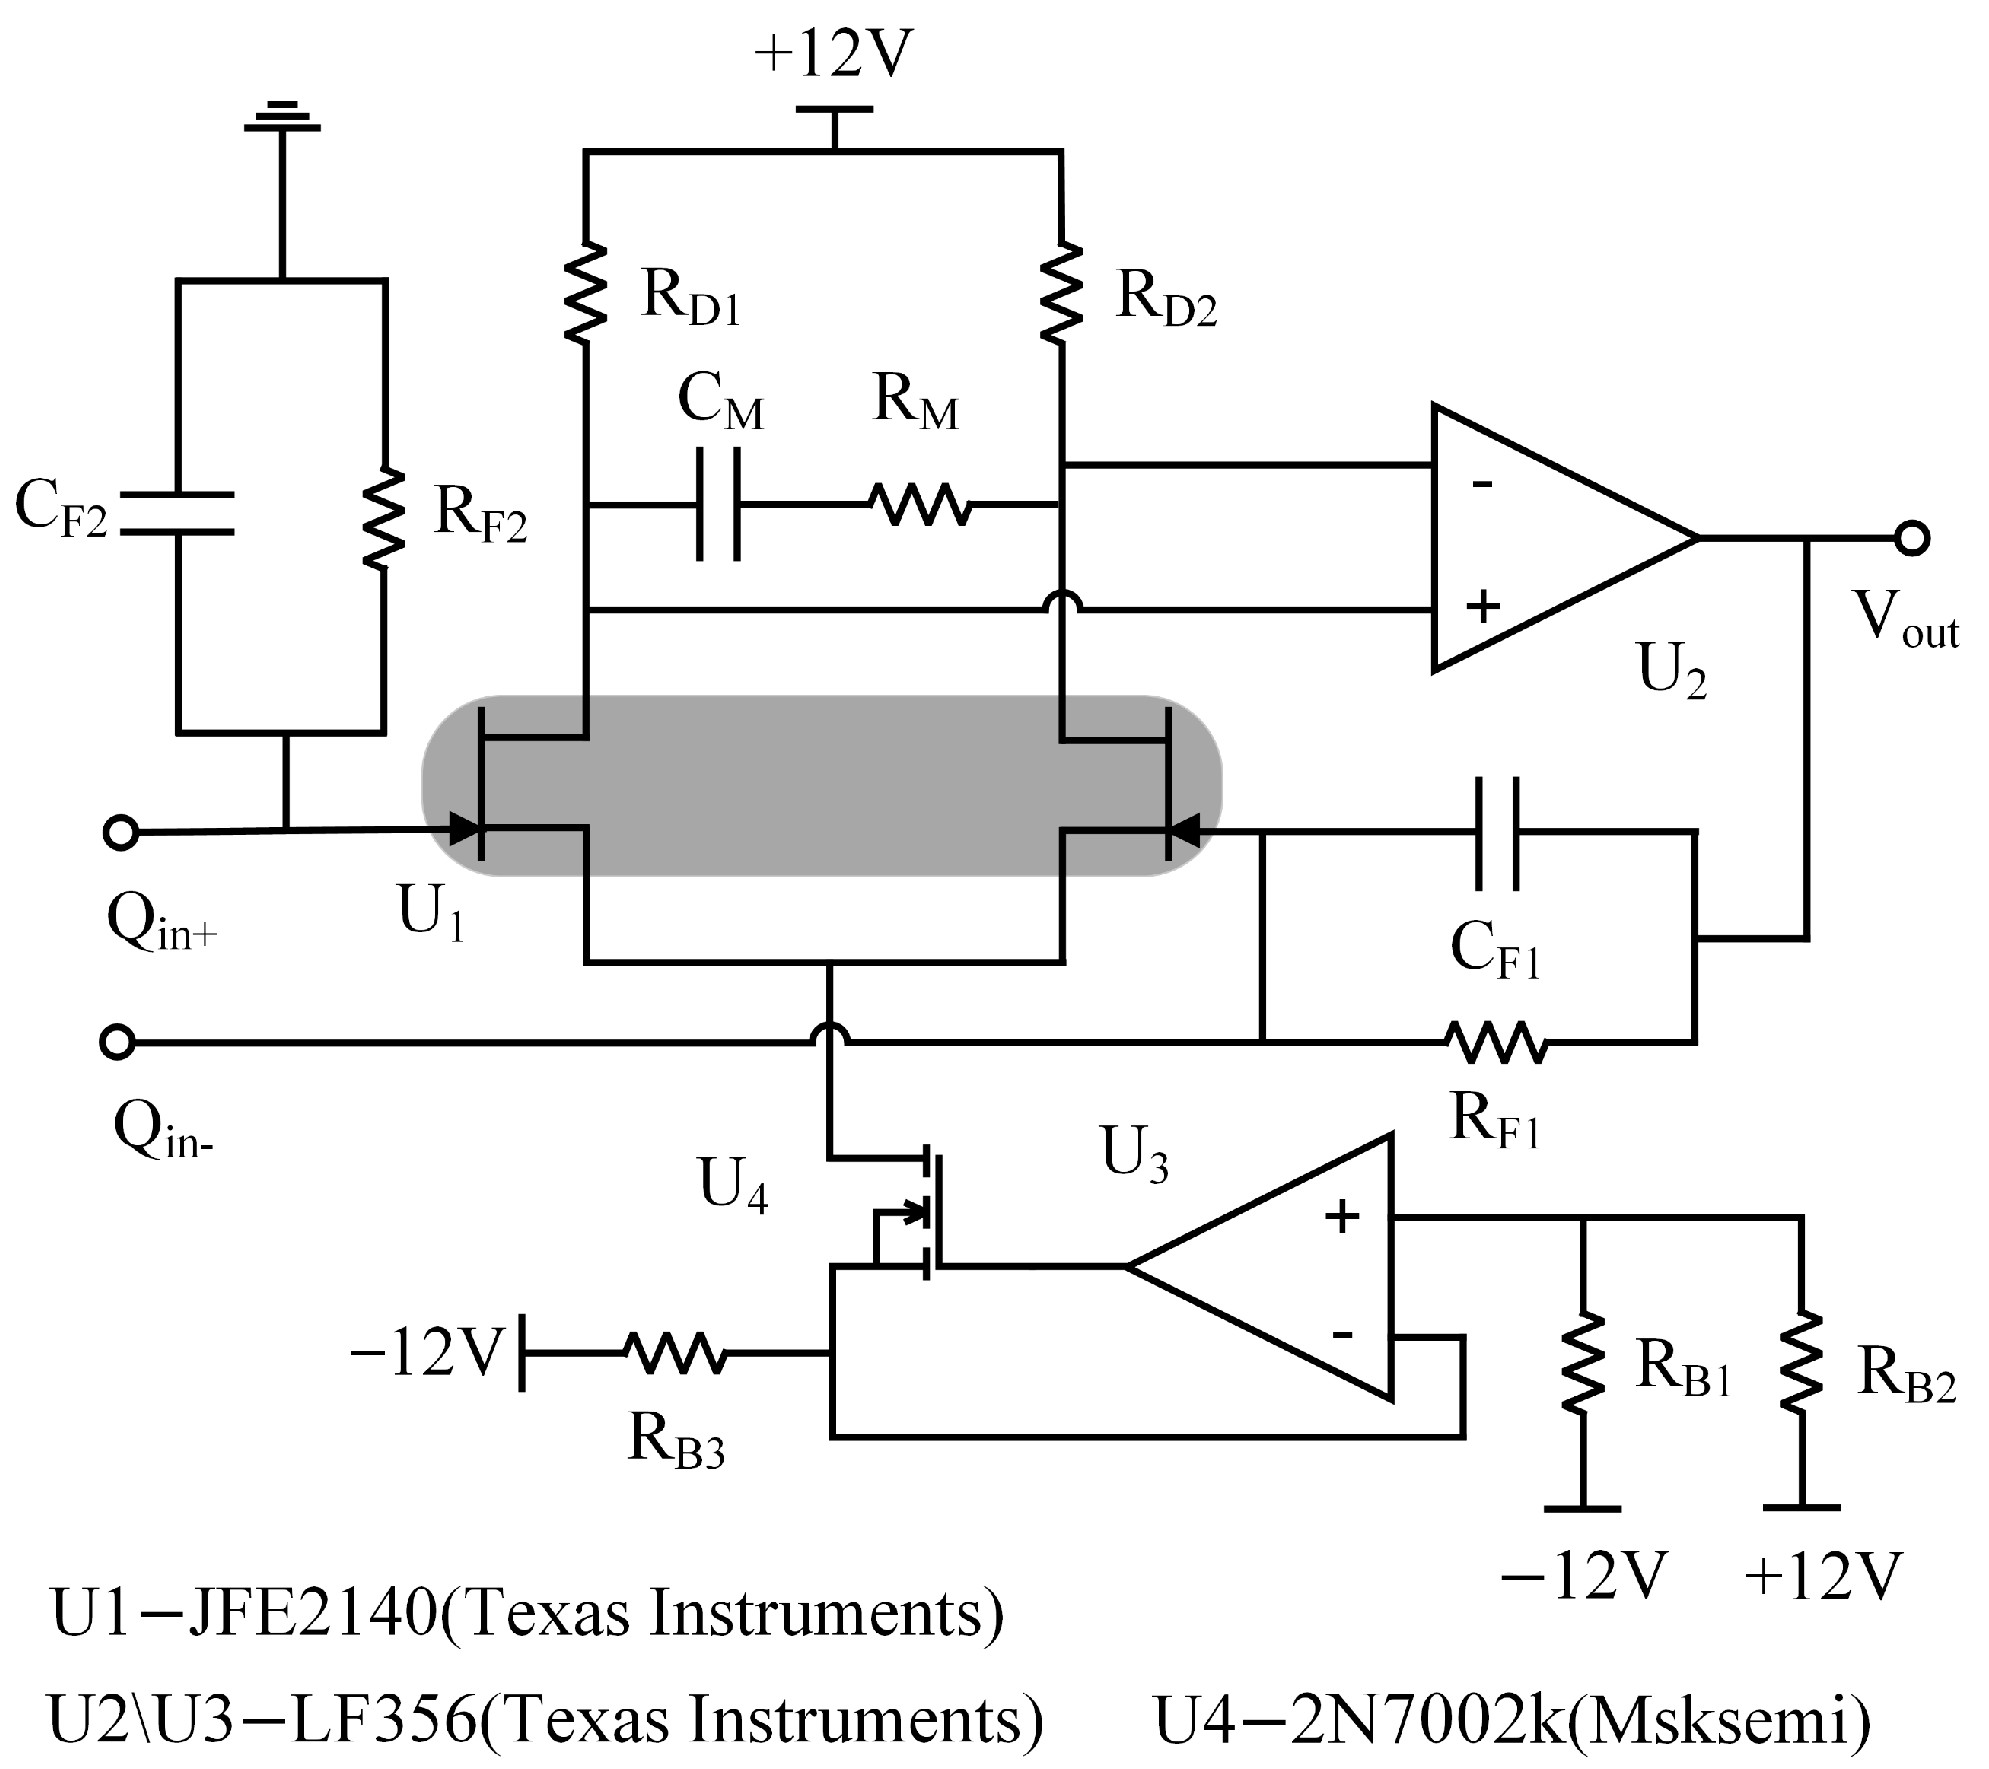
Figure 10 illustrates the equivalent circuit of the feed-through compensation circuit. No DC bias voltage is applied to the resonator, and the AC drive voltage is in the mV range. This implies the resonator is not resonated, with the feed-through effect generating a feed-through signal at the detection electrode. The AC drive voltage on the drive electrode splits into two paths: one passes through the device’s feed-through capacitor, generating a feed-through signal that the charge amplifier outputs as AC voltage V
1; the other travels through the amplifier and phase-shift circuits, which control amplitude and phase via compensating capacitor C
padc to produce voltage V
2. V
2 matches V
1 in amplitude but is opposite in phase, counteracting the feed-through voltage and thus nullifying the sensor’s feed-through effect. The above analysis shows that the feed-through compensation accuracy of the resonant pressure sensor mainly depends on the noise performance of the charge amplifier, amplitude control of the amplifier circuit, and phase shift circuit’s phase control.
4.3. Compensated Experimental Testing
The feed-through compensation experiment tests the sensor using a feed-through compensation circuit based on differential drive and differential detection, with the compensation coefficient test scheme depicted in
Figure 10. The laboratory-prepared resonant pressure sensor serves as the test object, with the sensor test system established as per
Figure 10. The test equipment comprises a HF2LI lock-in amplifier (Zurich Instruments AG, Technoparkstrasse, Zurich, Switzerland), a DC power supply, a vacuum chamber, and a test circuit. The HF2LI lock-in amplifier, featuring an oscilloscope and frequency sweep function, supplies an AC drive voltage V
AC. The DC power supply provides a DC bias voltage V
DC for the transducer, while the vacuum chamber maintains a 2 Pa vacuum level to minimize air damping.
Disconnect switch S and use the oscilloscope function to record the circuit noise of the detection circuit noted as noise N1. The signal generator outputs an AC drive signal with an amplitude of 200 mV and a phase of 0° to act on the sensor. Since the sensor chip is not applied to the DC bias voltage, the device is in a quiescent state; at this time, the detection circuit output signals are feeder signals. After determining the feed-through signal, open the switch S of the feed-through compensation circuit and adjust the size and phase of the compensation voltage V2. The compensated circuit output noise N2 is comparable to the original circuit noise N1 of the circuit, thus suppressing the feed-through effect of the resonant pressure sensor. At this time, the DC bias voltage is applied to the sensor, the device resonates, and the signals detected by the detection circuit are all resonant signals of the device’s vibration. Post-testing, the feed-through compensation circuit’s compensation coefficients are determined as amplification coefficient A = 0.568 and phase shift angle φ = −127°.
With the DC bias voltage V
DC set at 20 V and the AC drive voltage V
AC at 200 mV for the resonant pressure sensor.
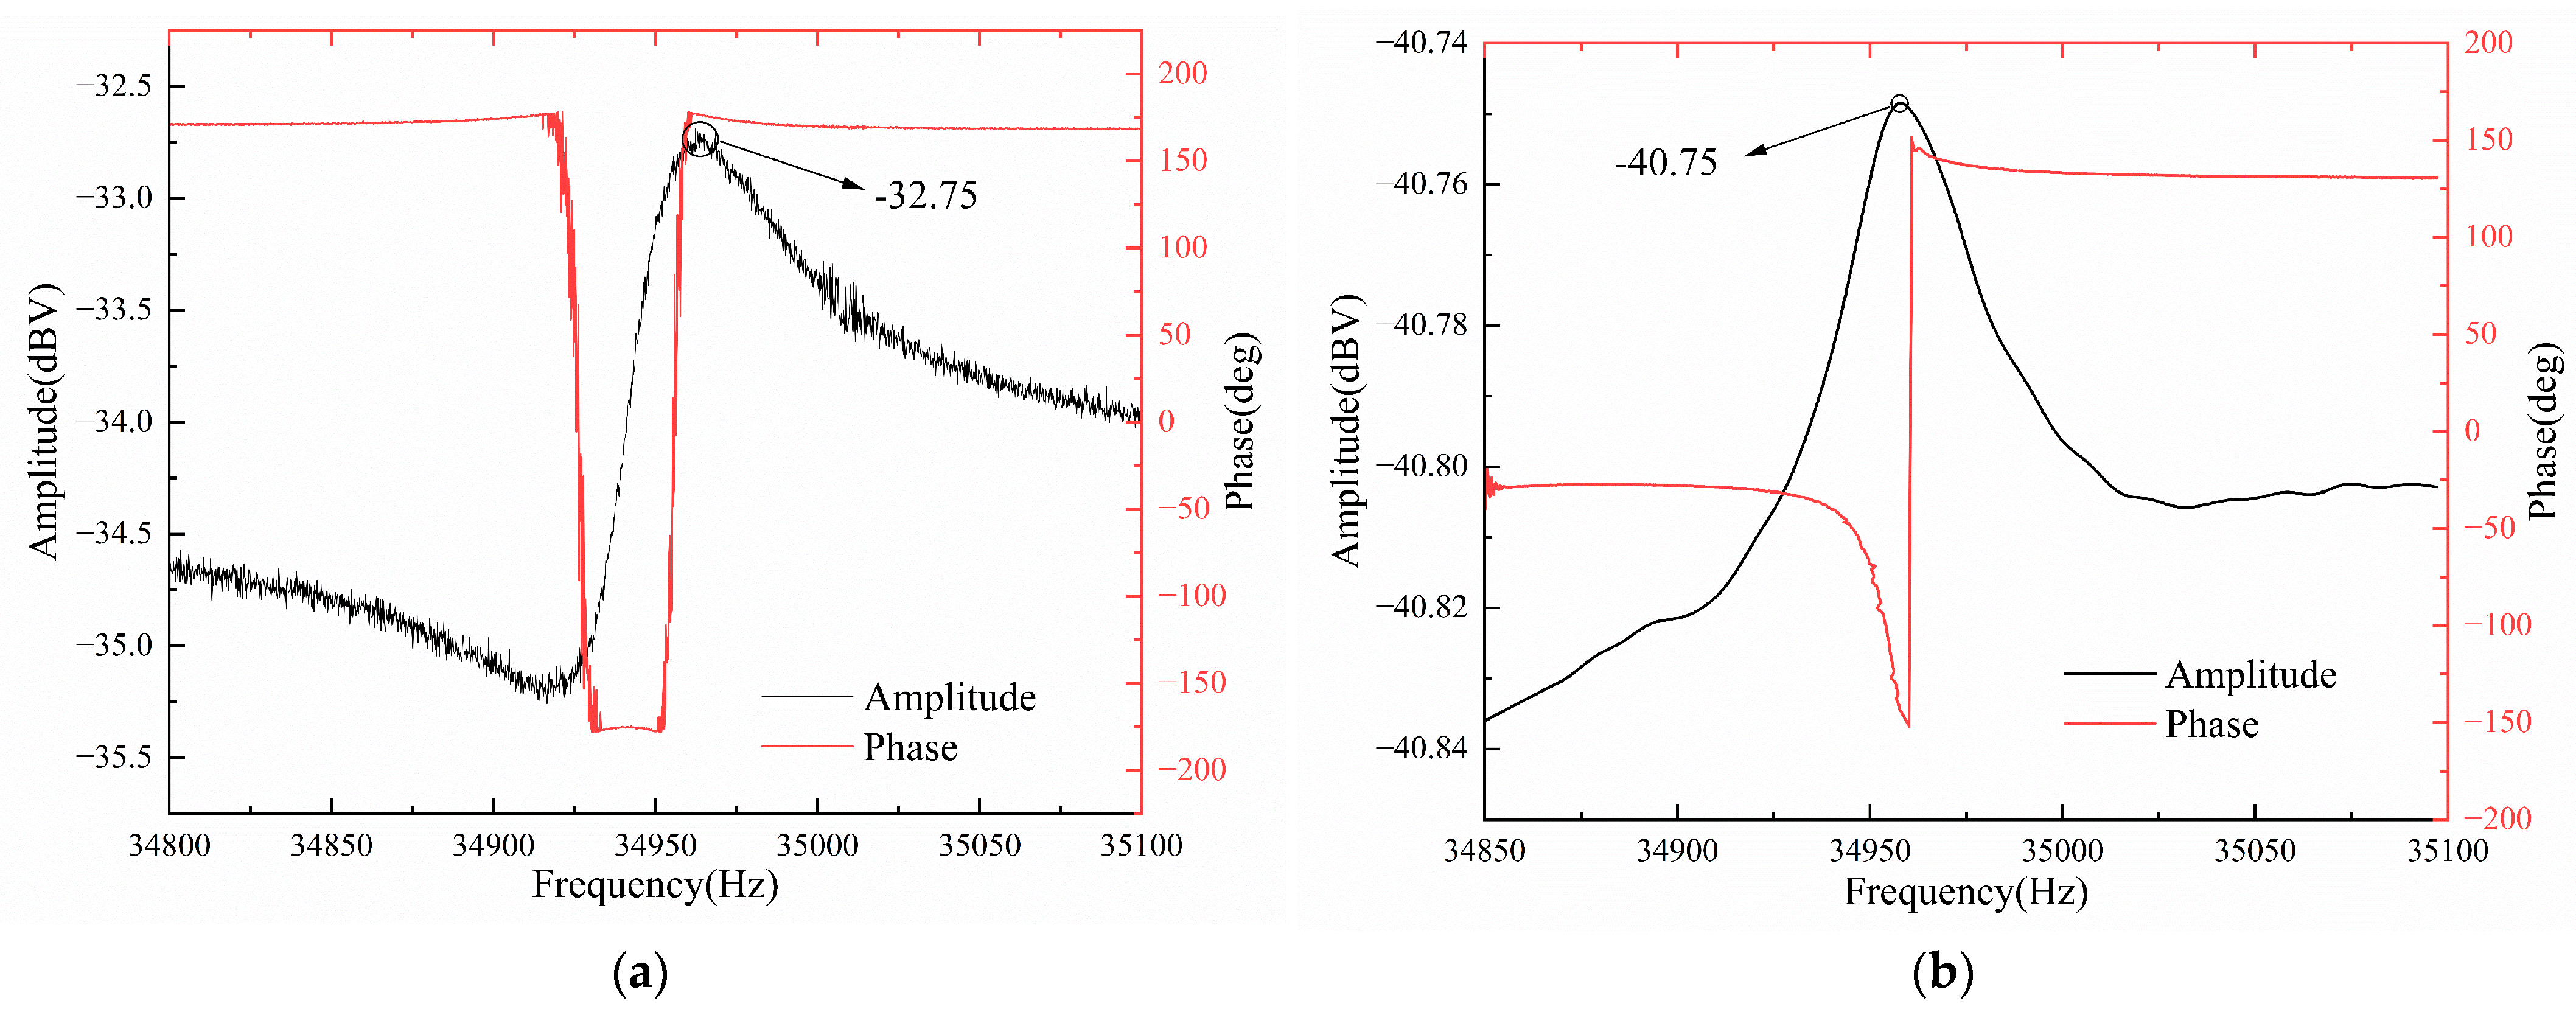
Figure 10 illustrates the experimental results comparing the sensor’s frequency sweep with and without the feed-through compensation circuit. The black curve indicates the amplitude variation during the frequency sweep test, while the red curve shows the phase variation. As shown in
Figure 11a, when there is no feed-through compensation circuit, two resonant peaks appear on the amplitude–frequency characteristic curve of the pressure sensor. The resonance frequency corresponding to the very small value is the interference frequency introduced by the feed-through capacitor, 34,919 Hz, and the resonance frequency corresponding to the very large value is the intrinsic resonance frequency of the sensor, 34,964 Hz, with a resonance peak of −32.75 dBV. This resonance peak includes the effect of feed-through signals, which, in practical applications of sensors, can lead to a decrease in the sensitivity and linearity of the pressure sensor. Also, the phase–frequency characteristic curve undergoes a sudden phase shift near these two resonant frequencies.
As shown in
Figure 11b, when the feed-through compensation circuit is connected, the interference frequency of 34,919 Hz introduced by the feed-through capacitor and its resonance peak disappear on the sweep curve, and the corresponding phase mutation also disappears. This shows that the feed-through compensation circuit can realize feed-through compensation or even completely eliminate the feed-through effect of the sensor to improve the detection quality. After the realization of feed-through compensation, the resonance peak of the pressure sensor is −40.75 dBV, and the resonance peak is reduced by 8 dBV, which significantly reduces the impact of the feed-through signal on the resonance peak. At this time, the resonant frequency of the pressure sensor is measured to be 34,958 Hz, and the quality factor Q is 1326. The experimental test results are consistent with the simulation analysis results of the equivalent circuit model, which further illustrates the correctness of the equivalent electrical model of the sensor.
By comparing with most of the current feed-through effect suppression techniques [
10,
18,
19,
20,
21,
22,
23,
24], the resonant pressure sensor used in this paper has a slightly lower quality factor Q, but the proposed feed-through compensation circuit can also achieve higher compensation accuracy. Compared with Zhang et al. who used a half-frequency driving technique to excite a resonator with low Q, the feed-through compensation circuit de-signed in this paper can effectively suppress the feed-through effect of the resonant pressure sensor without decreasing the driving efficiency, eliminating the interference frequency of the pressure sensor, and reducing the resonance peak by 60%.


