Article

Design of Metamaterial Sensor for Non Destructive Testing of Aircraft Composite Skin Damage

School of Aeronautics and Astronautics, University of Electronic Science and Technology of China, Chengdu 611731, China
*
Author to whom correspondence should be addressed.
Micromachines 2025, 16(3), 284; https://doi.org/10.3390/mi16030284
Submission received: 11 February 2025 / Revised: 26 February 2025 / Accepted: 27 February 2025 / Published: 28 February 2025
(This article belongs to the Special Issue Metamaterials for Sensing Applications)

Abstract

:
The detection of aircraft skin is an important part of the process of aircraft design, manufacturing, and application. This paper proposes a metamaterial sensor for non-destructive detection of aircraft composite skin damage. Firstly, Using the perturbation theory, an electromagnetic nondestructive detection model of aircraft composite skin is established. Then, according to the plasmon theory, a nested multi-layer complementary split resonant ring (CSRR) metamaterial sensor is designed. Simulation using the high frequency structure simulator (HFSS), it shows that it can effectively detect defect with diameters of 2 mm and above and burial depth within 3 mm. Finally, the physical test is carried out, and the 10 mm diameter defect in the aircraft composite skin sample can be detected.

1. Introduction

Carbon fiber reinforced polymer (CFRP) has the advantages of light weight [1], high compressive strength [2], and fatigue resistance [3], and is widely used in the field of aircraft [4]. However, composite materials are damaged during use due to impact, such as surface dents, delamination, matrix cracking, fiber breakage, etc., which will directly affect the strength, stiffness, fatigue life and other properties of the material, causing safety hazards. Therefore, the detection of defects in aircraft composite skin is extremely important.
Nowadays, the non-destructive testing (NDT) methods for aircraft composite skin mainly include the following: infrared thermal imaging [5], ultrasonic testing [6], X-ray testing [7] and eddy current testing [8]. However, ultrasonic testing requires coupling agents, eddy current testing incapable of detecting metallic materials and has low resolution, infrared thermal imaging can easily damage the surface of an aircraft, X-ray testing lack convenience. In order to overcomes the shortcomings of traditional testing method, The metamaterial sensor is proposed for Nondestructive testing of aircraft composite skin.
Split resonant ring (SRR) and its complementary structure are often used in near-field microwave non-destructive testing due to their good electromagnetic field local characteristics [9,10]. Albishi, A. M used a complementary split ring resonator fed by a microstrip transmission line as a sensor to detect cracks on a metal surface covered or hidden by a dielectric layer [11]. Zhen Li proposed a method for impact damage detection of carbon fiber based on a complementary split ring resonator sensor [12]. The traditional CSRR structure has problems such as high resonant frequency and unfocused energy. Therefore, this paper improves on the CSRR structure and proposes a nested multi-layer CSRR structure, which maintains a more focused energy and has a lower operating frequency than the CSRR structure of the same size.
This paper is organized as follows. We investigate the model of aircraft composite skin defects in Section 2. In Section 3, nested multi-layer CSRR metamaterial sensor is designed. The simulation and experiment are shown in Section 4 and finally, we present our conclusions about the work in Section 6.

2. Model of Aircraft Composite Skin Defect

The detection of aircraft composite skin using CSRR can be equivalent to a resonator. The resonator loaded with the sample to be tested is considered as a complete resonator, and the resonant frequency is disturbed by the defect of the sample to be tested, which can be analyzed based on perturbation theory [13]. A resonator that is disturbed by a change in dielectric constant or permeability is shown in Figure 1.
If E ¯ 0 , H ¯ 0 is the field of the original resonant cavity, while E ¯ , H ¯ The field in the disturbed resonant cavity. So, the Maxwell rotation equations in these two cases are shown in Equations (1), (2), (3), and (4), respectively.
× E ¯ 0 = j ω 0 μ H ¯ 0
× H ¯ 0 = j ω 0 ϵ E ¯ 0
× E ¯ = j ω μ + Δ μ H ¯
× H ¯ = j ω ϵ + Δ ϵ E ¯
where, ω 0 is the resonant frequency of the original resonant cavity, ω   is the resonant frequency of the perturbation cavity, Δ ϵ and Δ μ are the change in material properties inside the resonant cavity caused by defects.
Multiplying the conjugate of Equation (1) by H ¯ and Equation (4) by the conjugate of E ¯ 0 yields Equations (5) and (6), respectively.
H ¯ · × E ¯ 0 = j ω 0 μ H ¯ · H ¯ 0
E ¯ 0 · × H ¯ = j ω ϵ + Δ ϵ E ¯ 0 · E ¯
where, E ¯ 0 is the conjugate of E ¯ 0 , H ¯ 0 is the conjugate of H ¯ 0 .
Subtracting Equation (6) from Equation (5), combined with vector transformation formula · A ¯ × B ¯ = B ¯ · × A ¯ A ¯ · × B ¯ , yields Equation (7).
· E ¯ 0 × H ¯ = j ω 0 μ H ¯ · H ¯ 0 j ω ϵ + Δ ϵ E ¯ 0 · E ¯
Similarly, multiplying the conjugate of Equation (2) by E ¯ and Equation (3) by the conjugate of H ¯ 0 yields Equations (8) and (9), respectively.
E ¯ · × H ¯ 0 = j ω 0 ϵ E ¯ 0 · E ¯
H ¯ 0 · × E ¯ = j ω μ + Δ μ H ¯ 0 · H ¯
Subtracting Equation (8) from Equation (9), combined with vector transformation formula · A ¯ × B ¯ = B ¯ · × A ¯ A ¯ · × B ¯ , yields Equation (10).
· E ¯ × H ¯ 0 = j ω μ + Δ μ H ¯ 0 · H ¯ + j ω 0 ϵ E ¯ 0 · E ¯
Add Equation (7) and Equation (10), then integrate them over the volume V 0 , and combine the divergence theorem to obtain Equation (11).
  V 0 · E ¯ 0 × H ¯ + E ¯ × H ¯ 0 d v = j V 0 ω 0 ϵ ω ( ϵ + Δ ϵ ) E ¯ 0 · E ¯ + ω 0 μ ω ( μ + Δ μ ) H ¯ 0 · H ¯ d v = 0
where, V 0 is the volume of the resonant cavity.
By organizing Equation (11), Equation (12) can be obtained.
ω ω 0 ω = V 0 Δ ϵ E ¯ · E ¯ 0 + Δ μ H ¯ · H ¯ 0 d v V 0 ϵ E ¯ · E ¯ 0 + μ H ¯ · H ¯ 0 d v
If Δ ϵ and Δ μ are small, the original field E ¯ 0 and H ¯ 0 can be approximated as the perturbation field E ¯ and H ¯ , and ω 0 can be approximated as ω. Equation (12) is transformed into Equation (13).
ω ω 0 ω 0 V 0 Δ ϵ E ¯ 0 2 + Δ μ H ¯ 0 2 d v V 0 ϵ E ¯ 0 2 + μ H ¯ 0 2 d v
Based on the above analysis, changes in the dielectric constant and magnetic permeability in a resonant cavity will cause changes in the resonant frequency. Therefore, by detecting the change in resonant frequency, the changes in dielectric constant and magnetic permeability can be detected.
The metamaterial sensor designed in this paper is attached to the surface of an aircraft skin. The coverage area of the metamaterial sensor is equivalent to a resonant cavity. Damage to the aircraft skin causes a change in the dielectric constant in the resonant cavity, resulting in a shift in the resonant frequency of the metamaterial sensor. Implement the detection of aircraft skin damage.

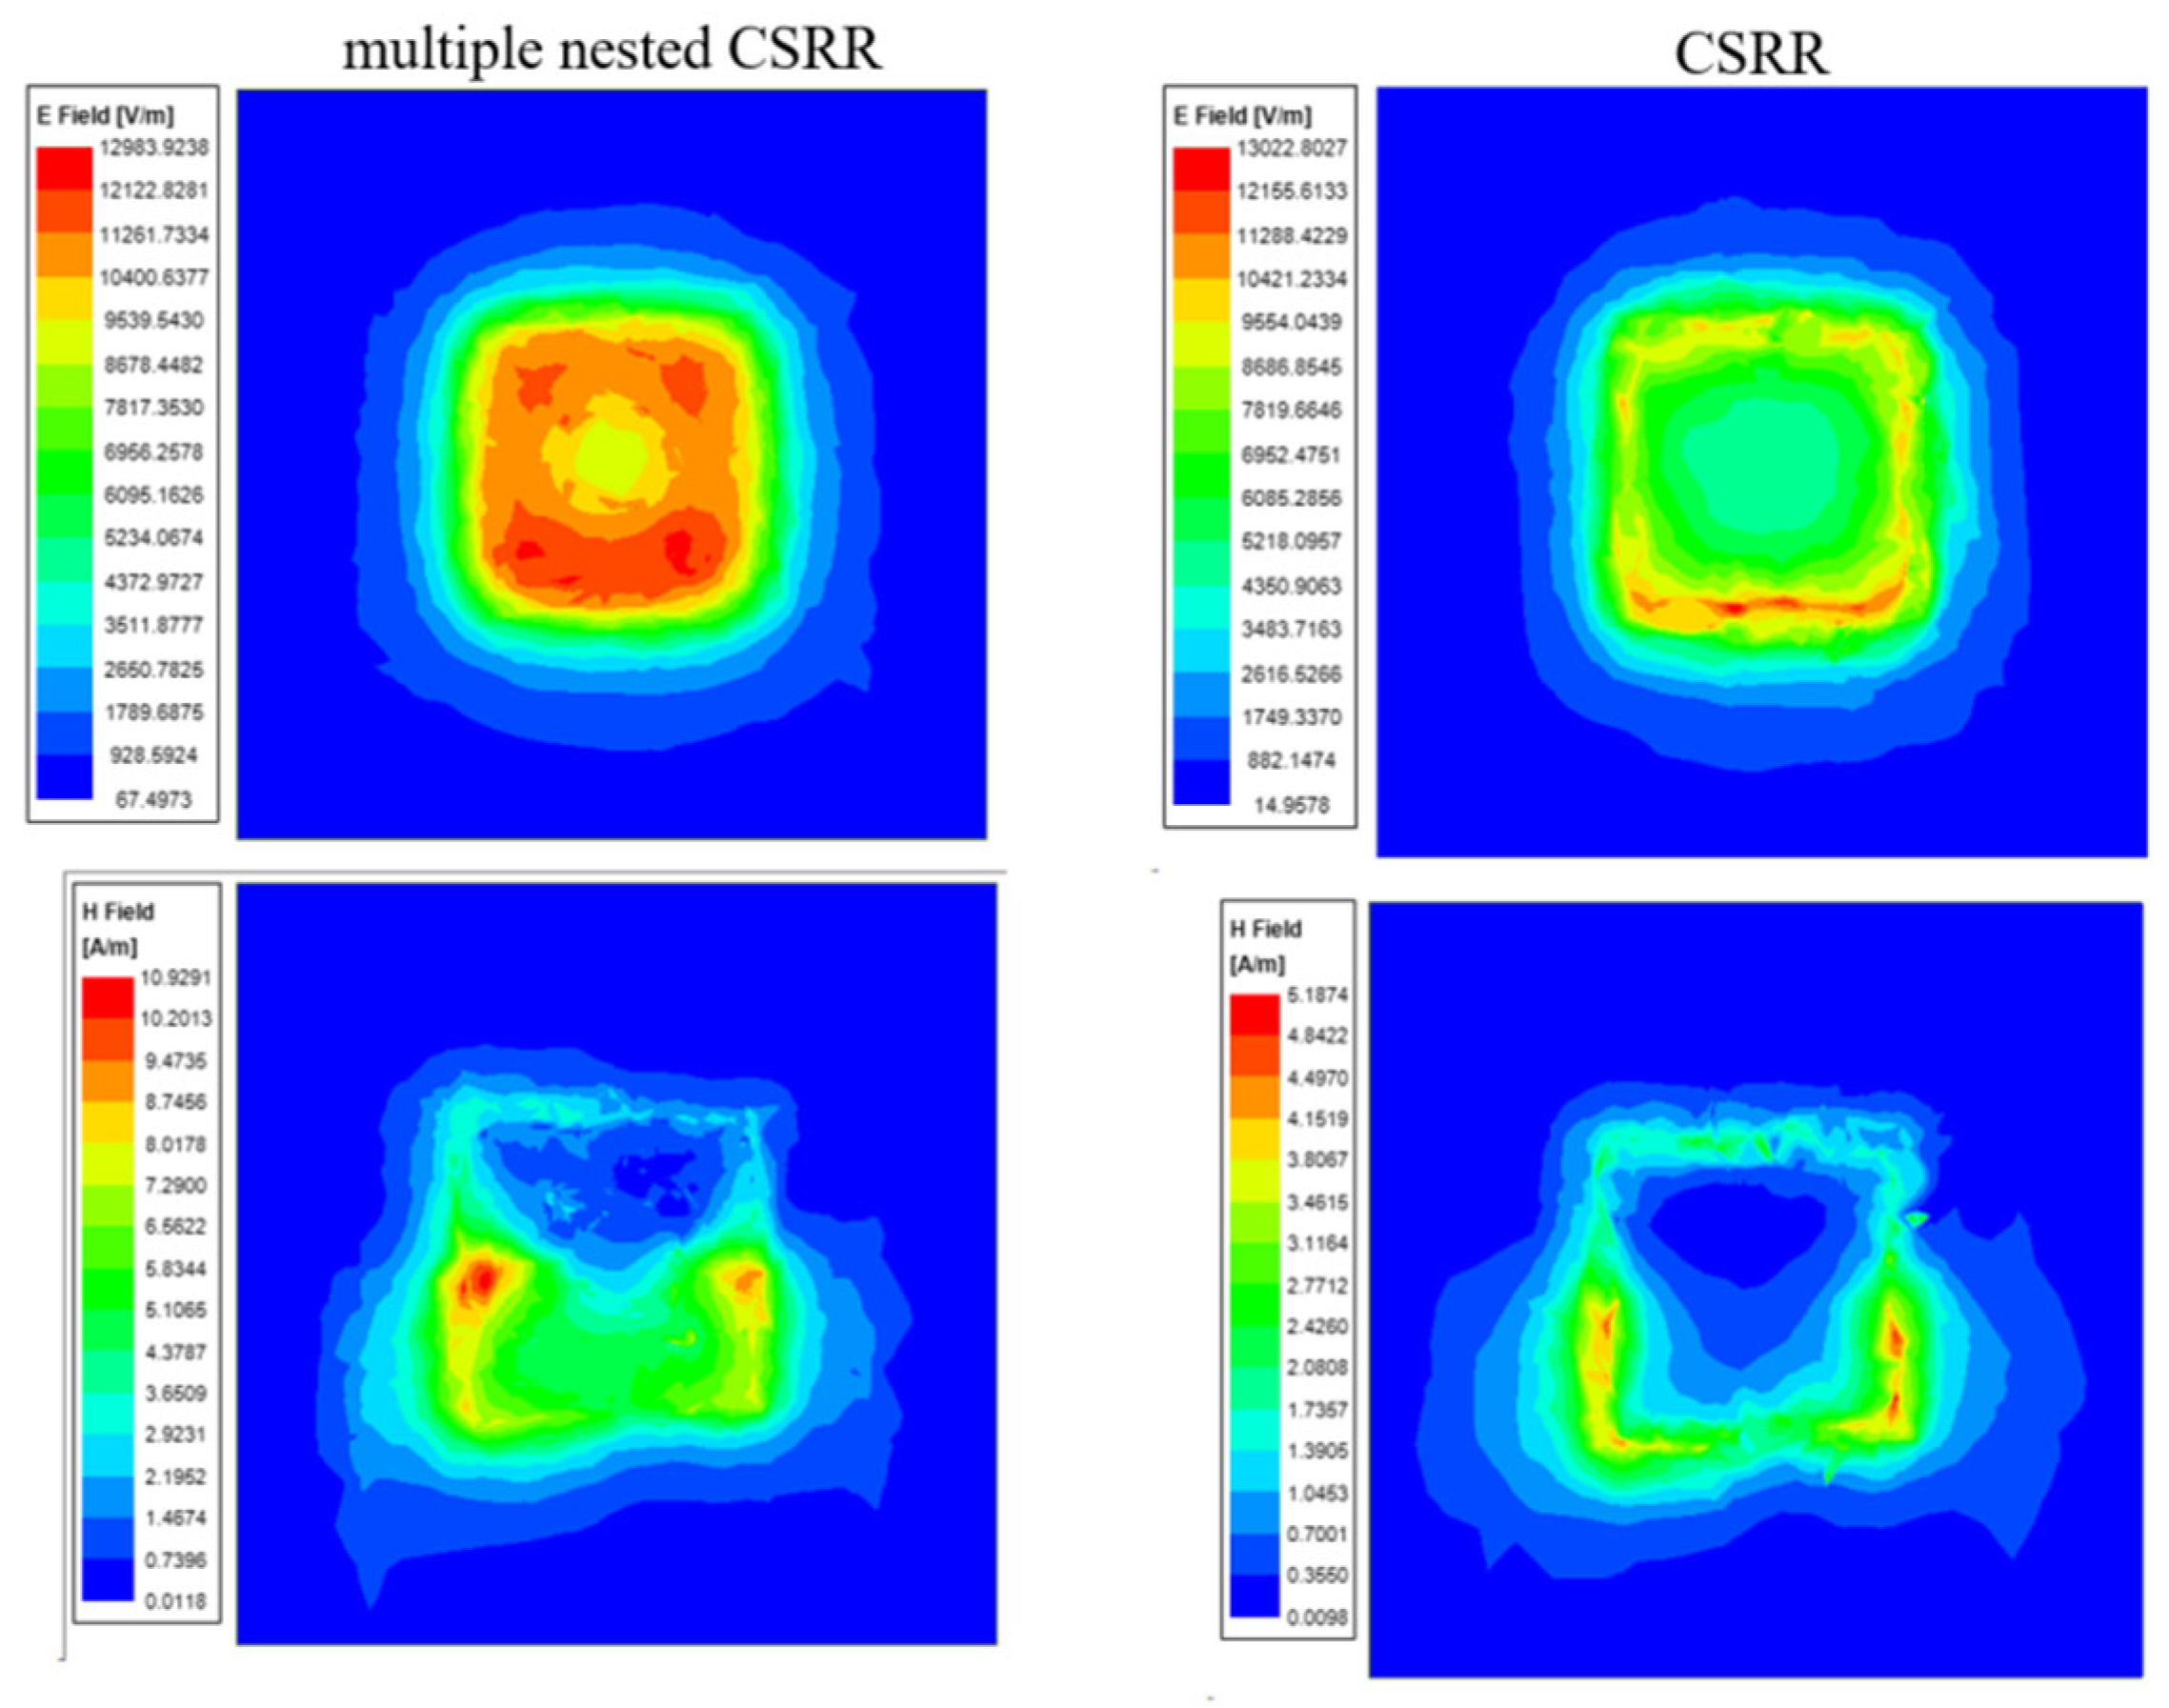
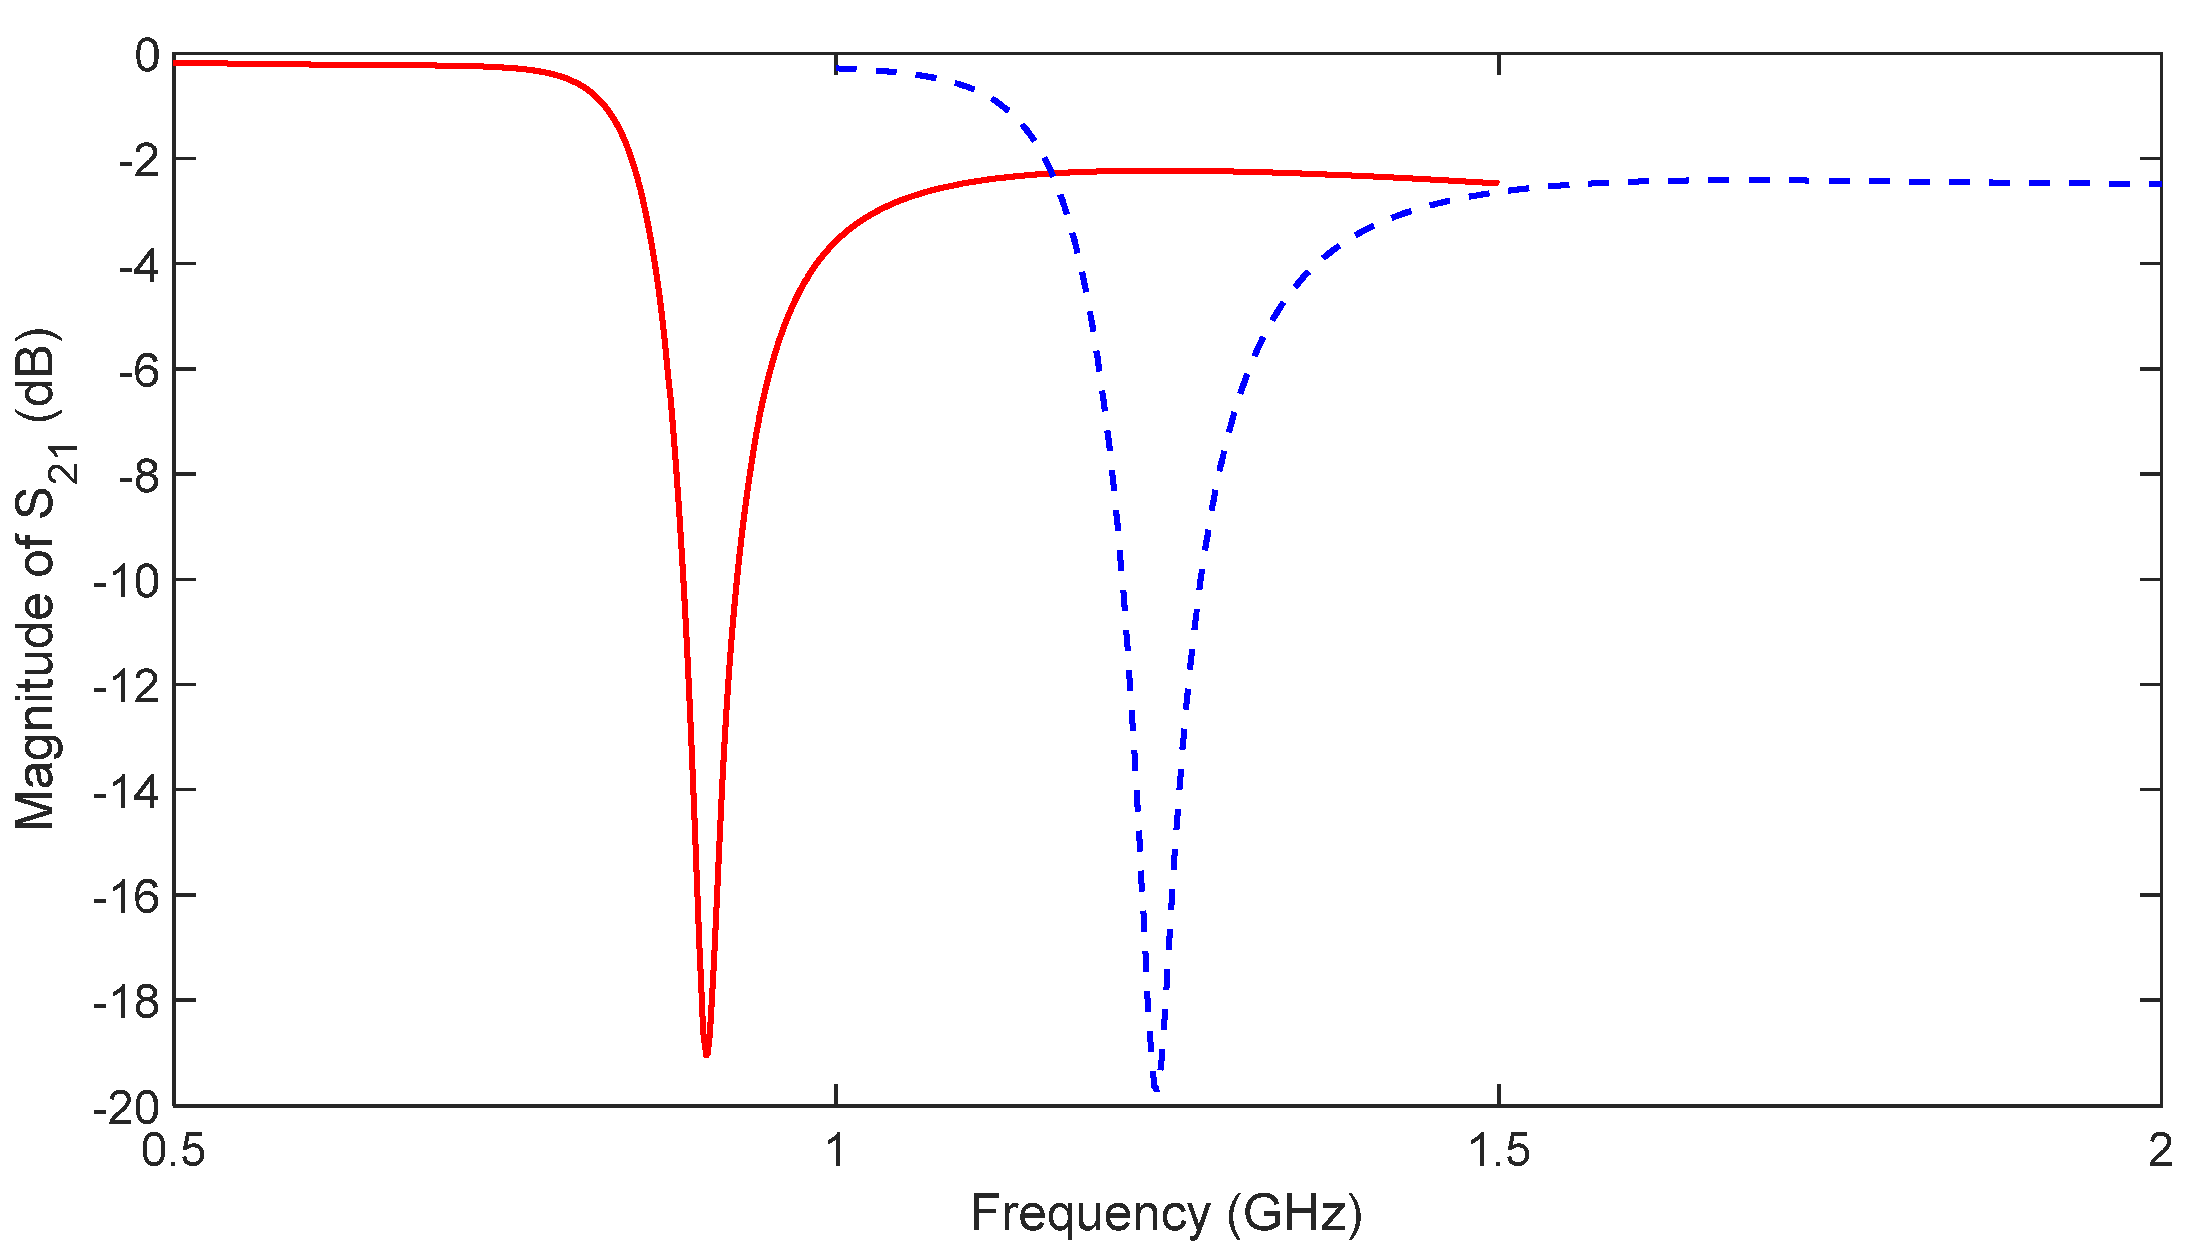
3. Design of Nested Multi-Layer CSRR Metamaterial Sensor

According to reference [14], the dielectric constant of aircraft composite skin was obtained through experimental testing, and its resonant frequency was approximately 0.9 GHz. Therefore, the resonant frequency of metamaterial sensor is selected as 0.9 GHz. The proposed nested multi-layer CSRR metamaterial sensor structure is shown in Figure 2. The microstrip transmission line substrate is FR4-epoxy with a thickness of 0.1 mm, its relative dielectric constant is 4.4, the loss tangent is 0.02, and the size is 60 mm × 20 mm. The metal conductor strip width of the microstrip transmission line is 1.86 mm to achieve 50-ohm impedance matching. The metal strip and ground plate material of the microstrip transmission line are both copper, with a thickness of 35 um. Next, design and analyze the shape of the metasurface sensor, the width of the ring gap, the width of the metal ring, the edge length of the outermost ring, and the number of nested layers to obtain the optimal aircraft composite skin detection metasurface sensor.
Design circular and square metasurface sensors with identical ring gap width, metal ring width, outermost ring edge length or diameter, and nesting layers. Use HFSS to design two types of shape sensors as shown in Figure 3 and simulate them to obtain the frequency response of their S21 parameters as shown in Figure 4. According to the analysis of Figure 4, the resonant frequency of the circular structure is 1.093 GHz, while the resonant frequency of the square structure is 0.9025 GHz. Therefore, the resonant frequency of the square structure with the same size is more suitable for aircraft composite skin detection compared to the circular structure.
Using a square structure, the S21 frequency response was analyzed using HFSS for different parameters such as metal ring width, outermost ring edge length, and nesting layers. The simulation results are shown in Figure 5.
According to the analysis of Figure 5a, when g = s = 0.2 mm, the resonant frequency is 0.894 GHz. At the same time, when the ring gap width is between 0.3 mm and 0.5 mm, the resonant frequency of the resonant structure is more sensitive to changes in the ring gap width, with a sensitivity of up to 0.53 GHz/mm. When the ring gap width is less than 0.3 mm, the sensitivity of the resonant frequency to the ring gap width is 0.25 GHz/mm.
The width of the metal ring w varies from 0.1 mm to 0.5 mm with a step size of 0.1 mm. The S21 curve is shown in Figure 5b. As w increases, the resonant frequency of the sensor increases. When w = 0.2 mm, the resonant frequency is 0.9075 GHz.
The side length of the resonant structure changes from 10 mm to 16 mm, with a step size of 2 mm. The S21 curve is shown in Figure 5c. As it increases, the resonant frequency of the sensor decreases. When l = 10 mm, the resonant frequency is 1.174 GHz, while when l = 16 mm, the resonant frequency shifts to 0.645 GHz. When l = 12 mm, the resonant frequency is 0.9002 GHz.
Therefore, when s = 0.2 mm, w = 0.2 mm, and l   = 12 mm, the resonant frequency is more suitable for aircraft composite skin detecting.
The number of nested layers varies from 2 to 15, while parameters such as the outermost ring radius, metal ring width, and gap width remain unchanged. The structure is shown in Figure 6. Simulation and analysis are conducted using HFSS software, and the simulation results are shown in Figure 7. As the number of nested layers increases, the resonant frequency begins to significantly decrease and then tends to remain unchanged. When N = 2, the resonant frequency is 1.2425 GHz, decreasing at a rate of 0.25 GHz/mm. When N = 10, the resonant frequency is 0.9025 GHz, and as the number of embedded rings increases, the resonant frequency remains basically unchanged.
Based on the above analysis, when choosing a square sensor with s = 0.2 mm, w = 0.2 mm, l = 12 mm, and N = 10, the metasurface sensor operates at approximately 9 GHz. More suitable for aircraft composite skin testing. Therefore, the dimensions of the metasurface sensor are shown in Table 1.
Compared with traditional CSRR metasurface sensors, nested multi-layer CSRR metasurface sensor with s = 0.2 mm, w = 0.2 mm, l = 12 mm, and N = 10 is designed, as well as traditional CSRR metasurface sensor with s = 0.2 mm, w = 0.2 mm, and l = 12 mm. Two types of sensing structures are shown in Figure 8, and the HFSS software is used to simulate the two structures. The distribution of electric and magnetic field strength at 1 mm directly above the resonant structure is shown in Figure 9. Analysis of Figure 8 shows that the nested CSRR structure increases the number of layers, resulting in more concentrated electric and magnetic field strength. The traditional CSRR structure is more dispersed in the sensing area. At the same time, the frequency response of two structures S21 is analyzed, and the simulation results are shown in Figure 10. The resonant frequency of the traditional CSRR metasurface sensor is 1.242 GHz, while the resonant frequency of the nested multi-layer CSRR metasurface sensor is 0.902 GHz. The nested multi-layer CSRR metasurface sensor is more suitable for aircraft composite skin detecting.
Similarly, using the aircraft composite skin test object described in Section 4, analyze the attenuation depth of two sensors. The energy attenuation is shown in Figure 11, where x represents depth in millimeters and P (x) is the normalized energy value. The nested multi-layer CSRR structure sensor has lower energy attenuation in the range of 0 mm to 3 mm compared to traditional CSRR structures. Within the depth range of 0 mm to 3 mm, the nested multi-layer CSRR structure sensor has better defect detection performance than traditional CSRR structures.

4. Simulation and Analysis of Aircraft Composite Skin Detection

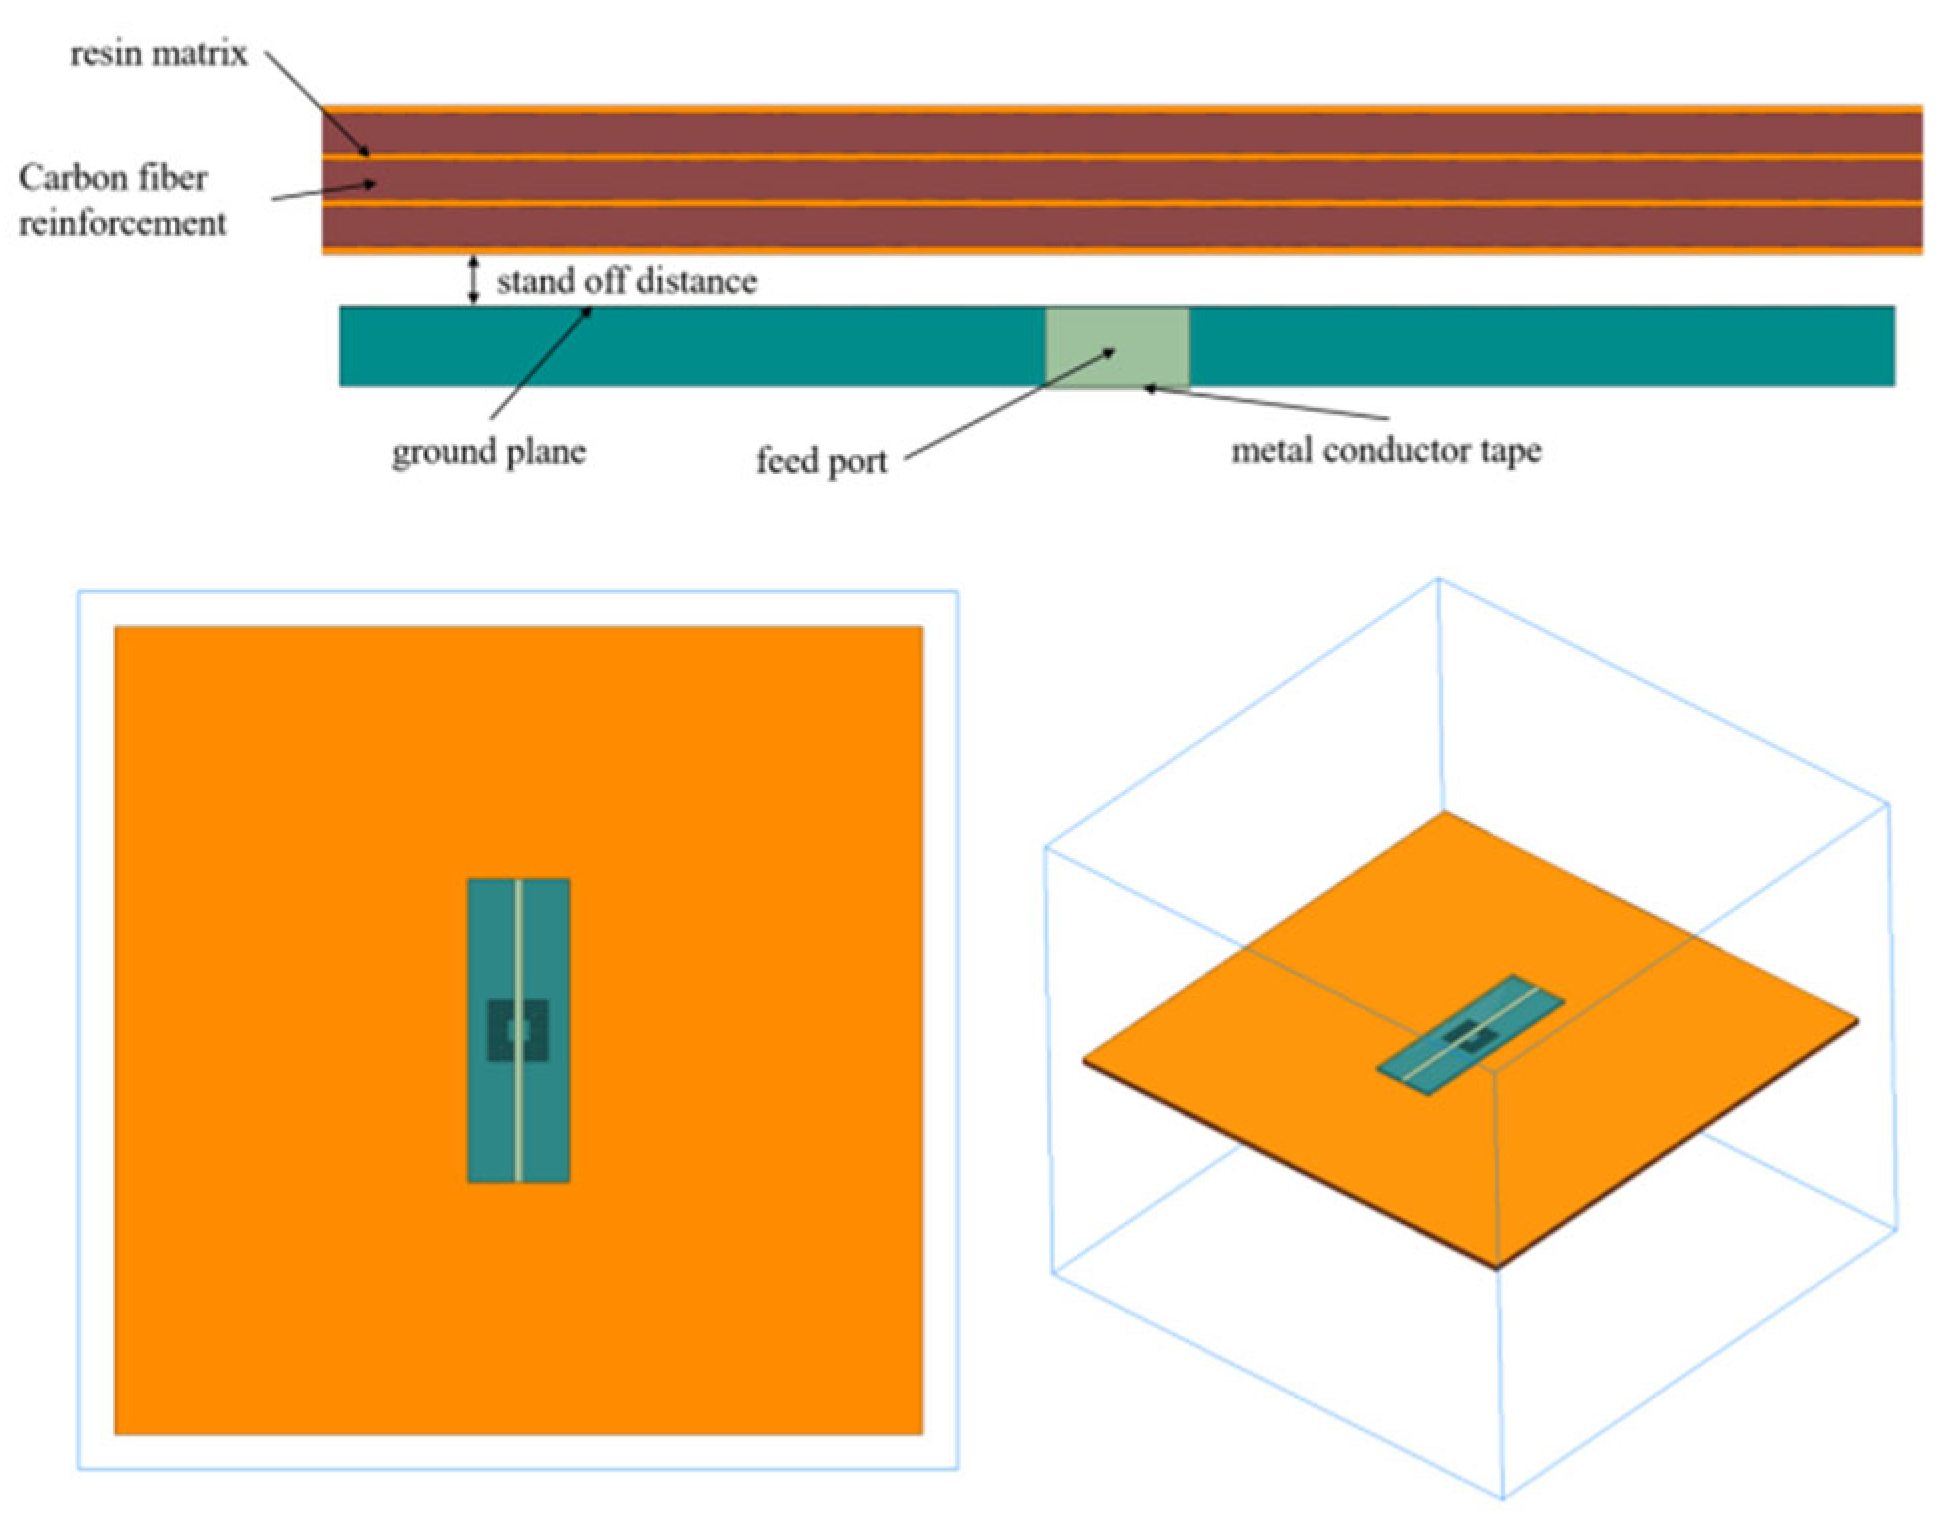
4.1. Simulation Model

In engineering applications, the aircraft composite skin is usually made by stacking multiple layers of pre-impregnated fabric in specific orientations and layer counts. Therefore, a single layer of pre-impregnated fabric often serves as the fundamental unit of the three-dimensional model [15]. The aircraft composite skin sample model was constructed, as shown in Figure 12, which is a three-layer orthogonal plate with a thickness of 1.9 mm, comprising three layers of carbon fiber reinforcements and four layers of resin matrix. The thin plates of resin matrix are used to simulate the resin accumulation between the layers of layup. The thickness of the carbon fiber reinforcement thin plates is set at 0.5 mm, and the thickness of the resin matrix thin plates is set at 0.1 mm. Assuming the fiber direction parallel to the y-axis is 0°, the fiber orientations of the three layers of carbon fiber reinforcements are [0°, 90°, 0°]. The relative permittivity and conductivity of the carbon fiber reinforced plate are set as anisotropic tensors [16], as shown in Table 2. The microstrip sensor is positioned directly above the aircraft composite skin, maintaining 1 mm. The model uses a finite air domain to simulate an unbounded free space, with the air domain boundary conditions set as absorbing boundaries.

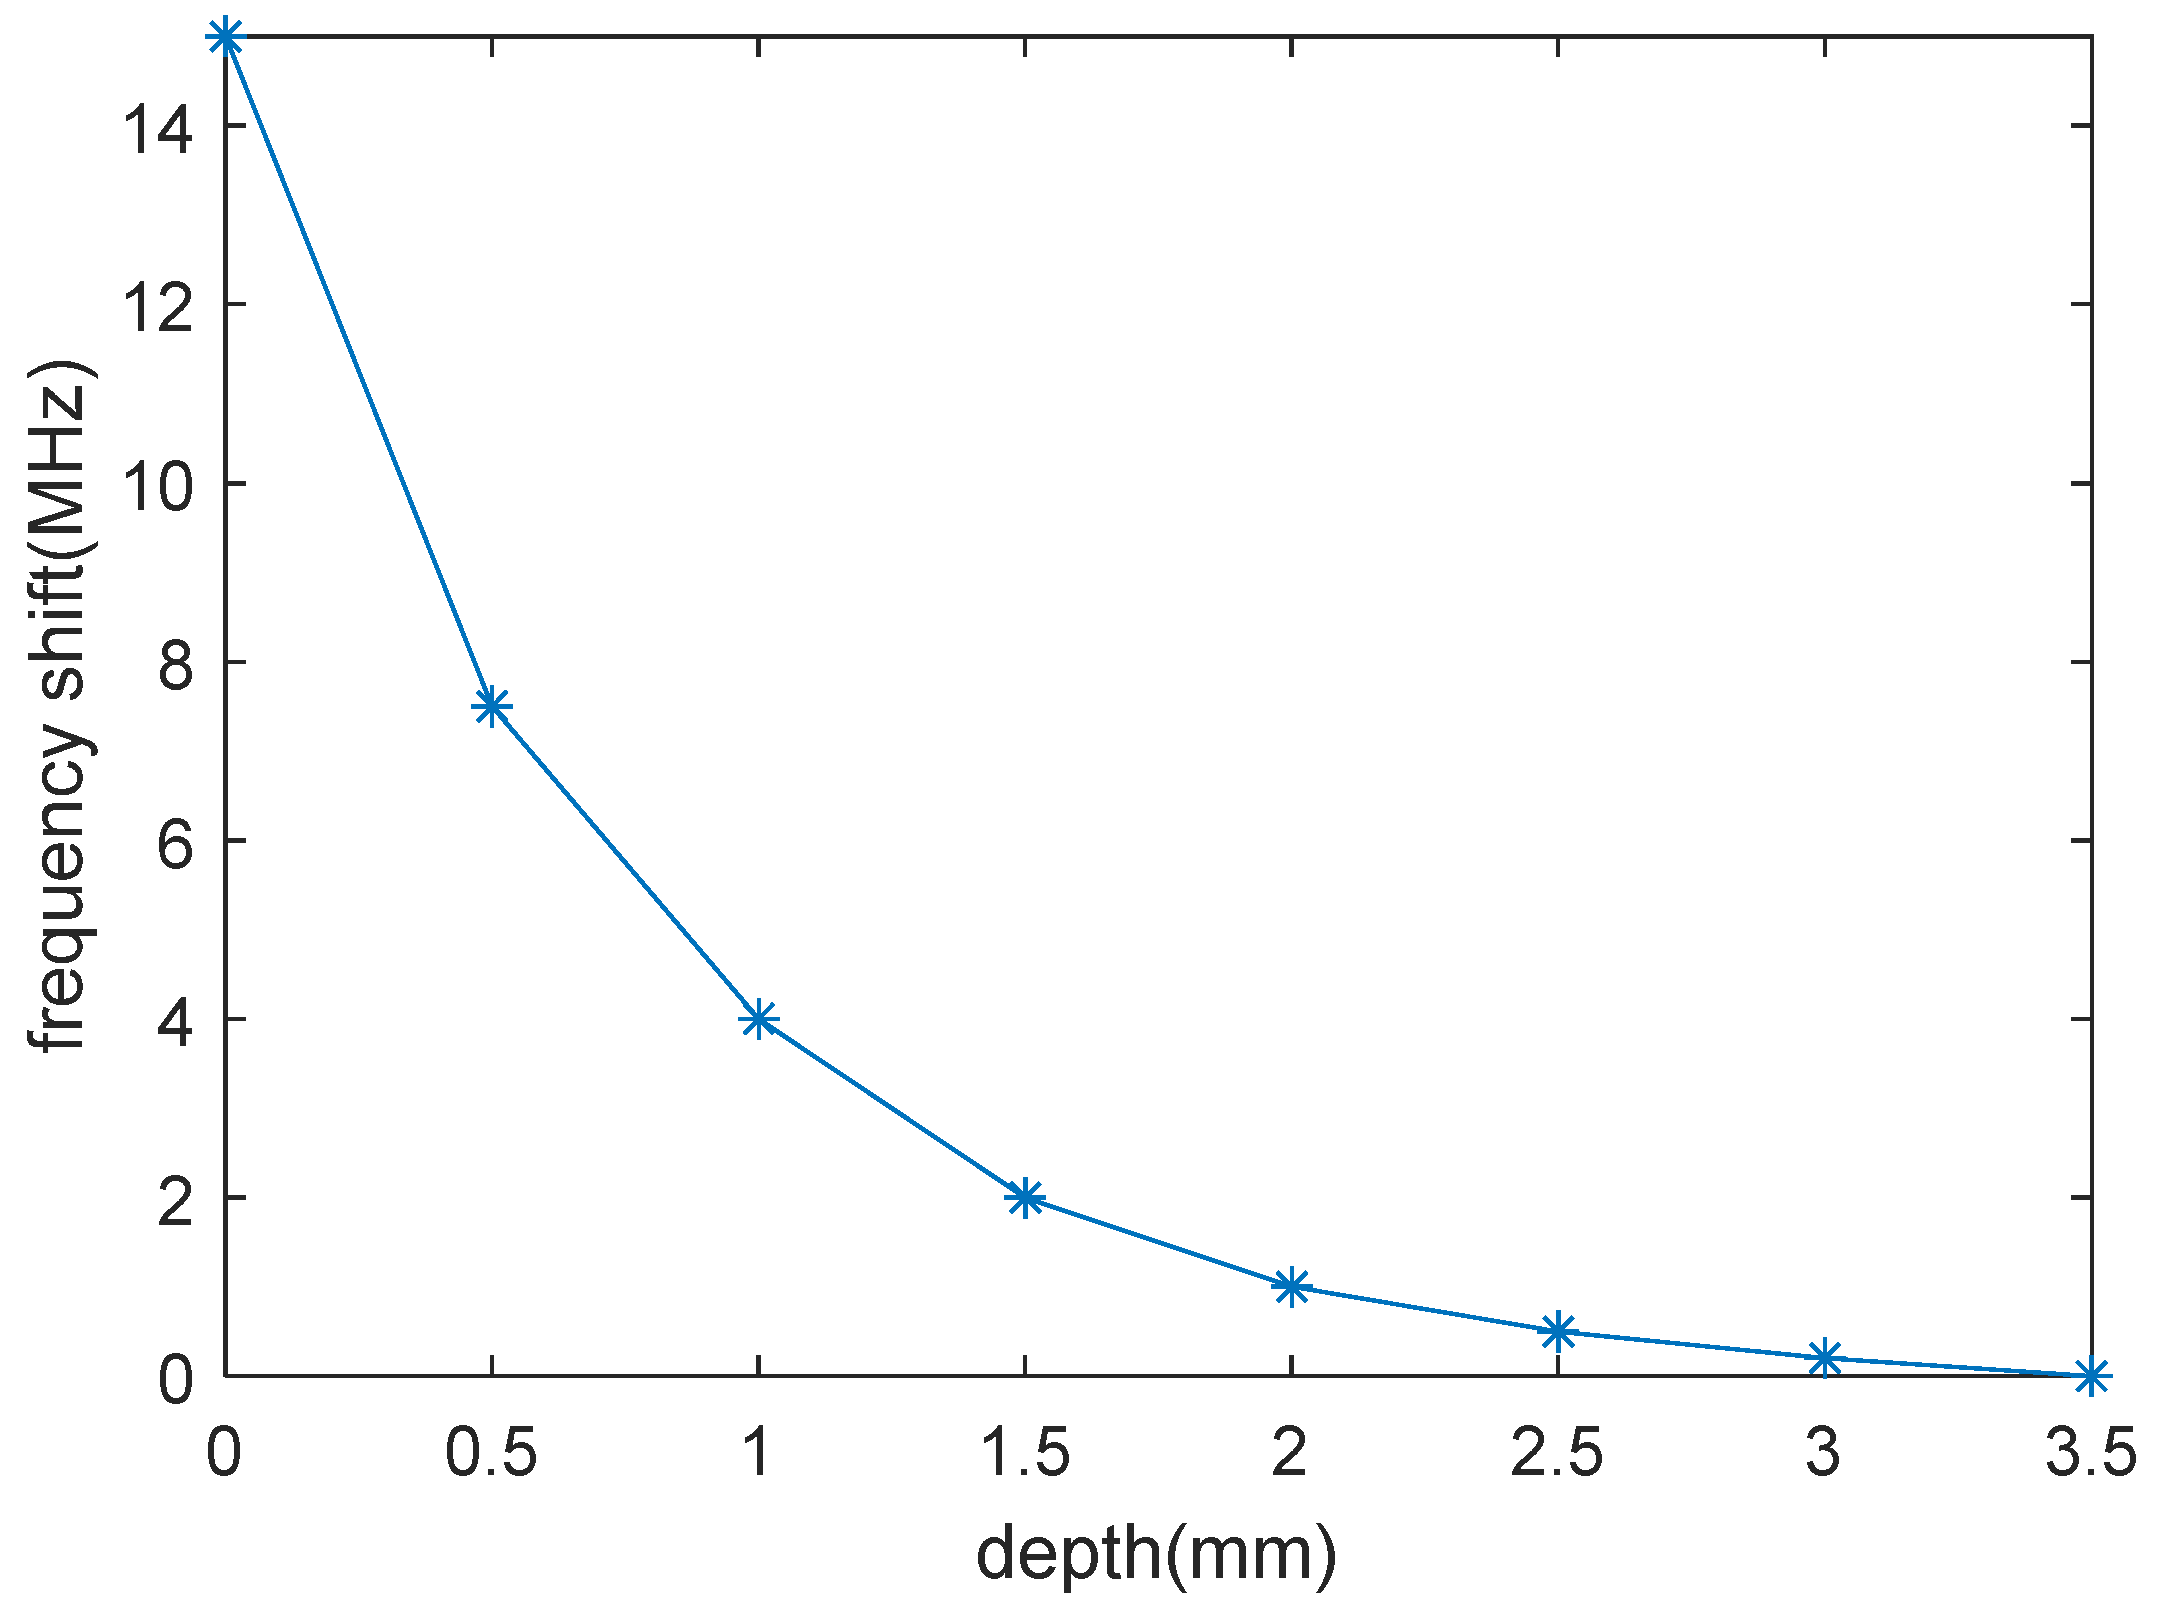
4.2. Detection of Internal Defects in Aircraft Composite Skin

The defect in the aircraft composite skin is a 5 mm × 5 mm × 0.05 mm, located within the resin matrix between the second and third layers of fiber boards, directly beneath the resonant structure of the sensor. Figure 13a displays the distribution of the electric field inside the aircraft composite skin sample when there are no defects. Figure 13b shows the electric field distribution inside the aircraft composite skin sample when it has damage. It is evident from the Figure 13 that there is a significant change in the electric field distribution at the defect site, not only is the intensity of the electric field at the defect site significantly stronger compared to areas without defects, but it is also more concentrated around the area of the defect. The change in the reflection coefficient is related to the field disturbance at the target defect site before and after the defect.
Testing aircraft composite skin samples with and without defects, the frequency response of sensor S21 parameters is shown in Figure 14. From Figure 14, it can be observed that compared to the no-defect aircraft composite skin sample, the aircraft composite skin sample with internal defects shifts the sensor’s resonant frequency from 0.772 GHz to 0.782 GHz. Compared to the resonant frequency, the amplitude of the S21 coefficient remains essentially unchanged. The frequency shift can effectively identify internal damage in aircraft composite skin.
At the same time, the frequency shift of the simulation test defect at different depths of the aircraft skin is shown in Figure 15. Analysis of Figure 15 shows that the frequency shift decreases with increasing defect depth, and when the depth exceeds 3 mm, the frequency shift is difficult to distinguish.
In order to evaluate the detection resolution of nested multi-layer CSRR metasurface sensor, simulations are conducted in HFSS for defects of different sizes. The frequency shift of the nested multi-layer CSRR metasurface sensor is shown as the “red line” in Figure 16. Analysis of Figure 16 shows that when the diameter of the defect is 1 mm or smaller, the resonant frequency shift of the nested multi-layer CSRR sensor is about zero. When the size is greater than or equal to 2 mm, there is a significant resonant frequency shift, and as the defect size increases, the resonant frequency shift of the sensor increases. Compare with the traditional CSRR structure sensor. The resolution of traditional CSRR structure sensors is shown by the “blue line”in Figure 16, and the resolution of traditional CSRR structure sensors is above 4 mm.
Using nested multi-layer CSRR metasurface sensor, the aircraft composite skin sample with dimensions of 20 mm × 20 mm, thickness of 1.9 mm, defect located at the center, size of 5 mm × 5 mm × 0.05 mm, and depth of 0.6 mm is scanned. The scanning step is 1 mm, and a total of 441 points are scanned. The scanning and defect distribution are shown in Figure 17a. The S21 frequency response of each scanning point is obtained using the HFSS simulation software, as shown in Figure 17b. The frequency offset of each scanning point is calculated, as shown in Figure 17c. Using principal component analysis to process frequency offset, that is, firstly covariance the scanned frequency data to obtain the covariance matrix; Then calculate the eigenvalues and eigenvectors of the covariance matrix to obtain the covariance matrix of the principal components; Finally, based on principal component reconstruction data, defect recognition is performed. The defects of the aircraft composite skin sample obtained is shown in Figure 17d. Analysis of Figure 17d shows that nested multi-layer CSRR metasurface sensor can effectively detect defect in the aircraft composite skin sample.
Compared with other detection methods, the comparison results are shown in Table 3. The nested CSRR structure metamaterial sensor exhibits certain advantages, with better resolution than other detection methods.

5. Experiment

5.1. Experimental Platform

Design and manufacture nested multi-layer CSRR metasurface sensor according to the dimensions in Section 3, as shown in Figure 18. Using a vector network analyzer to test the number of sensor parameters, the S21 parameter frequency response was obtained as shown by the “red line” in Figure 19, and the simulation data is shown by the “blue line” in Figure 19. There is a certain gap between the resonant frequency and the simulation results, which is due to the introduction of some additional parasitic capacitance and inductance at the welding point. However, the resonator frequency is within the resonant frequency of the aircraft composite skin and does not affect the detection of defects in the aircraft composite skin.
The tested aircraft composite skin sample is shown in Figure 20, with dimensions of 30 mm × 67 mm × 1.5 mm. Create a defect with a diameter of 10 mm at the white mark shown in Figure 20, located at a depth of 0.6 mm. In practical engineering, defects larger than 10 mm are usually defined as faults. Therefore, the 10 mm defect is selected for testing and verification.
As shown in Figure 21a, the nested multi-layer CSRR Metasurface sensor is placed directly above the aircraft composite skin sample, with the center of the sensor structure aligned with the axis of the sample. The S21 curve of the sensor is measured using Agilent’s N5242A, and its overall detection platform is shown in Figure 21b.

5.2. Experimental Results

The nested multi-layer CSRR metasurface sensor scan along a straight line from point A to point B of the tested aircraft composite skin sample at a step size of 5 mm, scanning a total of 10 positions. The resonance frequency of each scanning point are measured by a vector network analyzer as shown in Figure 22a, and the resonant frequency values of each point are shown in Table 4. According to the analysis of Figure 22a and Table 4, the resonant frequencies of 10 points are located between 0.767605 GHz and 0.801854 GHz. The first and second points have higher frequencies, while the third and fourth points have excessive frequencies. The resonant frequencies of the fifth and subsequent points remain unchanged. Calculate the resonance frequency offset at 10 points as shown in Figure 22b. According to Figure 22b, it can be roughly determined that the defect is located at points 1 and 2, with a size of approximately 10 mm.
Furthermore, defect in the tested aircraft composite skin sample is detected using nested multi-layer CSRR metasurface sensor for two-dimensional scanning with a scanning step of 1 mm. The S21 frequency response curves of each scanning point is shown in Figure 23a. Calculate the resonant frequency offset and obtain the three-dimensional frequency offset map of the tested aircraft composite skin sample as shown in Figure 23b. Denoise the frequency offset map, and the black and white frequency offset map is shown in Figure 23c. According to the analysis of Figure 23c, the defect diameter is about 10 mm, which is basically consistent with the actual defect, thus verifying the feasibility of nested multi-layer CSRR metasurface sensor detection.

6. Conclusions

In the paper, the new nested multi-layer CSRR structured metasurface sensor is proposed. Compared to traditional CSRR structures. On the basis of maintaining the overall size unchanged, add a resonant ring inward to reduce the resonant frequency. Compared with traditional CSRR structures, its sensing area has more concentrated and stronger energy. The designed multi-layer CSRR metasurface sensor is used for detecting internal defects in aircraft composite skin. Through HFSS simulation analysis, nested multi-layer CSRR metasurface sensors can detect defects with a diameter of 2 mm or more and a depth of up to 3 mm. Finally, the aircraft composite skin samples were tested and artificially manufactured defects were successfully detected. The defect location and size matched the actual defects, thereby verifying the effectiveness of the nested multi-layer CSRR metasurface sensor for aircraft composite skin defect detection.

Author Contributions

The authors contribute equally to the article. All authors have read and agreed to the published version of the manuscript.

Funding

This research received no external funding.

Data Availability Statement

The original contributions presented in this study are included in the article. Further inquiries can be directed to the corresponding author.

Conflicts of Interest

The authors declare no conflict of interest.

References

  1. Nassiraei, H.; Rezadoost, P. Local joint flexibility of tubular T/Y-joints retrofitted with GFRP under in-plane bending moment. Mar. Struct. 2021, 77, 102936. [Google Scholar] [CrossRef]
  2. Wu, R.; Zhang, H.; Yang, R.; Chen, W.; Chen, G. Nondestructive Testing for Corrosion Evaluation of Metal under Coating. Sensors 2021, 2021, 6640406. [Google Scholar] [CrossRef]
  3. Nassiraei, H.; Rezadoost, P. Static capacity of tubular X-joints reinforced with fiber reinforced polymer subjected to compressive load. Eng. Struct. 2021, 236, 112041. [Google Scholar] [CrossRef]
  4. Gupta, R.; Mitchell, D.; Blanche, J.; Harper, S.; Tang, W.; Pancholi, K.; Baines, L.; Bucknall, D.G.; Flynn, D. A Review of Sensing Technologies for Non-Destructive Evaluation of Structural Composite Materials. J. Compos. Sci. 2021, 5, 319. [Google Scholar] [CrossRef]
  5. Chrysafi, A.P.; Athanasopoulos, N.; Siakavellas, N.J. Damage detection on composite materials with active thermography and digital image processing. Int. J. Therm. Sci. 2017, 116, 242–253. [Google Scholar] [CrossRef]
  6. Wang, B.; He, P.; Kang, Y.; Jia, J.; Liu, X.; Li, N. Ultrasonic Testing of Carbon FiberReinforced Polymer Composites. J. Sens. 2022, 2022, 5462237. [Google Scholar]
  7. Shoukroun, D.; Massimi, L.; Endrizzi, M.; Bate, D.; Olivo, A.; Fromme, P. Composites impact damage detection and characterization using ultrasound and x-ray NDE techniques. In Health Monitoring of Structural and Biological Systems XIV; SPIE: Bellingham, WA, USA, 2020; Volume 11381, pp. 27–33. [Google Scholar]
  8. Du, Y.; Li, X.; Xie, S.; Yang, S.; Chen, Z. Reconstruction of cracks in a carbon fiberreinforced polymer laminate plate from signals of eddy current testing. J. Compos. Mater. 2020, 54, 3527–3536. [Google Scholar] [CrossRef]
  9. Yang, X.; Yin, Y.; Zhang, D.; Wu, S.; Huang, K.; Yuan, J.; Zhu, Z. Array Waveguide Probe Loaded with Split-Ring Resonators for Sizing the Cracks in Metal Surface. IEEE Microw. Wirel. Compon. Lett. 2018, 28, 171–173. [Google Scholar] [CrossRef]
  10. Hu, B.; Ren, Z.; Boybay, M.S.; Ramahi, O.M. Waveguide Probe Loaded with Split-Ring Resonators for Crack Detection in Metallic Surfaces. IEEE Trans. Microw. Theory Tech. 2014, 62, 871–878. [Google Scholar] [CrossRef]
  11. Albishi, A.M. Complementary Split-Ring Resonator for Crack Detection in Metallic Surfaces. IEEE Microw. Wirel. Compon. Lett. 2012, 22, 330–332. [Google Scholar] [CrossRef]
  12. Li, Z.; Wang, T.; Haigh, A.; Meng, Z.; Wang, P. Non-contact detection of impact damage in carbon fibre composites using a complementary split-ring resonator sensor. J. Electr. Eng. 2019, 70, 489–493. [Google Scholar] [CrossRef]
  13. Pozar, D.M. Microwave Engineering; Publishing House of Elec.: Beijing, China, 2004. [Google Scholar]
  14. Zhao, K.; Jia, Y. Study on Equivalent Modeling Technology of Helicopter Complex Skin Structure. In Proceedings of the IEEE 4th Information Technology and Mechatronics Engineering Conference, Chongqing, China, 14–16 December 2018; Volume 264, p. 268. [Google Scholar]
  15. Holloway, C.L.; Sarto, M.S.; Johansson, M. Analyzing carbonffber composite materials with equivalent-layer models. IEEE Trans. Electromagn. Compat. 2005, 47, 833–844. [Google Scholar] [CrossRef]
  16. Gao, R.X.; Lee, H.M.; Ewe, W.B.; Tay, S.W.; Thitsartarn, W.; Yang, Z.; Mahmoudi, M.; Juanda, E.; Kohler, J.; Wang, W. Electromagnetic characterization and measurement of conductive aircraft CFRP composite for lightning protection and EMI shielding. IEEE Trans. Instrum. Meas. 2023, 72, 1–11. [Google Scholar] [CrossRef]
  17. Jing, Z.; Cai, G.; Yu, X.; Wang, B. Ultrasonic detection and evaluation of delamination defects in carbon ffber composites based on ffnite element simulation. Compos. Struct. 2024, 3535, 118749. [Google Scholar]
  18. Cheng, J.; Zhu, Y.; Wang, B.; Liu, M.; Xu, D.; Qiu, J.; Takagi, T. Noncontact visualization of multiscale defects in CFRP composites using eddy current testing with T-R probe. NDT E Int. 2024, 145, 103138. [Google Scholar] [CrossRef]
  19. Huang, J.; Wei, Q.; Zhuo, L.; Zhu, J.; Li, C.; Wang, Z. Detection and quantiffcation of artiffcial delaminations in CFRP composites using ultrasonic thermography. Infrared Phys. Technol. 2023, 130, 104579. [Google Scholar] [CrossRef]
Figure 1. Change in dielectric constant or permeability (a) the original resonant cavity, (b) the disturbed resonant cavity.
Micromachines 16 00284 g001
Figure 2. Nested multi-layer CSRR metamaterial sensor.
Micromachines 16 00284 g002
Figure 3. Square and circular nested multi-layer CSRR (l = 12 mm, w = 0.2 mm, g = s = 0.2 mm, N = 10).
Micromachines 16 00284 g003
Figure 4. S21-curve of sensors with square and circular shapes.
Micromachines 16 00284 g004
Figure 5. S21-curves of different structural sizes (a) different gap widths, (b) different metal ring widths, (c) different outer ring edge lengths.
Micromachines 16 00284 g005
Figure 6. Nested multi-layer CSRR structure with different nesting layers (l = 12 mm, w = 0.2 mm, g = s = 0.2 mm).
Micromachines 16 00284 g006
Figure 7. (a) Frequency response curves of S21-parameters with different nesting levels; (b) Relationship between resonant frequency and nested layers.
Micromachines 16 00284 g007
Figure 8. Nested multi-layer CSRR Structure and Traditional CSRR Structure.
Micromachines 16 00284 g008
Figure 9. Electric and magnetic field distributions of nested multi-layer CSRR structure and traditional CSRR structure.
Micromachines 16 00284 g009
Figure 10. S21-curve of nested multi-layer CSRR structure and traditional CSRR structure (“red line” represents multi-level CSRR, “blue line” represents traditional CSRR).
Micromachines 16 00284 g010
Figure 11. Relationship between energy attenuation and distance between nested multi-layer CSRR structure and traditional CSRR structure (“red line” represents multi-level CSRR, “blue line” represents traditional CSRR).
Micromachines 16 00284 g011
Figure 12. Aircraft composite skin defect detection simulation model.
Micromachines 16 00284 g012
Figure 13. Electric field distribution diagram.
Micromachines 16 00284 g013
Figure 14. The frequency shift with defects and no defect.
Micromachines 16 00284 g014
Figure 15. The frequency shift with defect depth.
Micromachines 16 00284 g015
Figure 16. Relationship between resonant frequency shift and defect size between nested multi-layer CSRR metasurface sensor and traditional CSRR metasurface sensor.
Micromachines 16 00284 g016
Figure 17. Defect detection of aircraft composite skin samples. (a) Scanning process and defect distribution; (b) Scan the S21 parameter frequency response at each point of the sample; (c) Scan the three-dimensional frequency offset map of each point; (d) Processed frequency offset black and white image.
Micromachines 16 00284 g017
Figure 18. Nested Multi Layer CSRR Metasurface Sensor in Physical Form.
Micromachines 16 00284 g018
Figure 19. Nested multi-layer CSRR metasurface sensor S21 parameter measurement and simulation frequency response(“red line” represents test “blue line” represents simulation).
Micromachines 16 00284 g019
Figure 20. Physical aircraft composite skin sample.
Micromachines 16 00284 g020
Figure 21. Scanning Test Platform. (a) Linear scanning process; (b) Test Platform.
Micromachines 16 00284 g021
Figure 22. Frequency values of aircraft composite skin sample scanned in a straight line at each point. (a) Resonant frequency; (b) Frequency offset.
Micromachines 16 00284 g022
Figure 23. Frequency values of aircraft composite skin sample plane scanning at various points. (a) S21 parameter frequency response; (b) Three dimensional graph of frequency offset distribution; (c) Black and white image of frequency offset distribution.
Micromachines 16 00284 g023
Table 1. Nested multi-layer CSRR structure size parameters.
ParameterUnit (mm)
shapesquare
L 1 12
L 2 12
N10
L 3 4.4
L 4 4.4
w 0.2
s 0.2
g 0.2
Table 2. Material property parameters.
MaterialConductivity (S/m)Relative PermittivityRelative Permeability
longitude carbon fiber 20,000 0 0 0 200 0 0 0 200 3.26 0 0 0 3.02 0 0 0 3.26 1
transverse carbon fiber 200 0 0 0 20,000 0 0 0 200 3.02 0 0 0 3.26 0 0 0 3.26 1
resin matrix04.41
air011
Table 3. Comparison with other detection methods.
ReferencesTypeDefect Detection Resolution
[17]Ultrasonic3 mm
[18,19]eddy current6 mm
The workMetamaterial sensor2 mm
Table 4. Resonant Frequency Values at Linear Scanning Points.
Scan PointsResonant Frequency (GHz)
1 (A)0.793292
20.793292
30.791152
40.789011
50.786871
60.786871
70.786871
80.786871
90.786871
10 (B)0.786871
Disclaimer/Publisher’s Note: The statements, opinions and data contained in all publications are solely those of the individual author(s) and contributor(s) and not of MDPI and/or the editor(s). MDPI and/or the editor(s) disclaim responsibility for any injury to people or property resulting from any ideas, methods, instructions or products referred to in the content.

