
Dielectrophoresis-Enhanced Microfluidic Device with Membrane Filter for Efficient Microparticle Concentration and Optical Detection

Abstract
1. Introduction
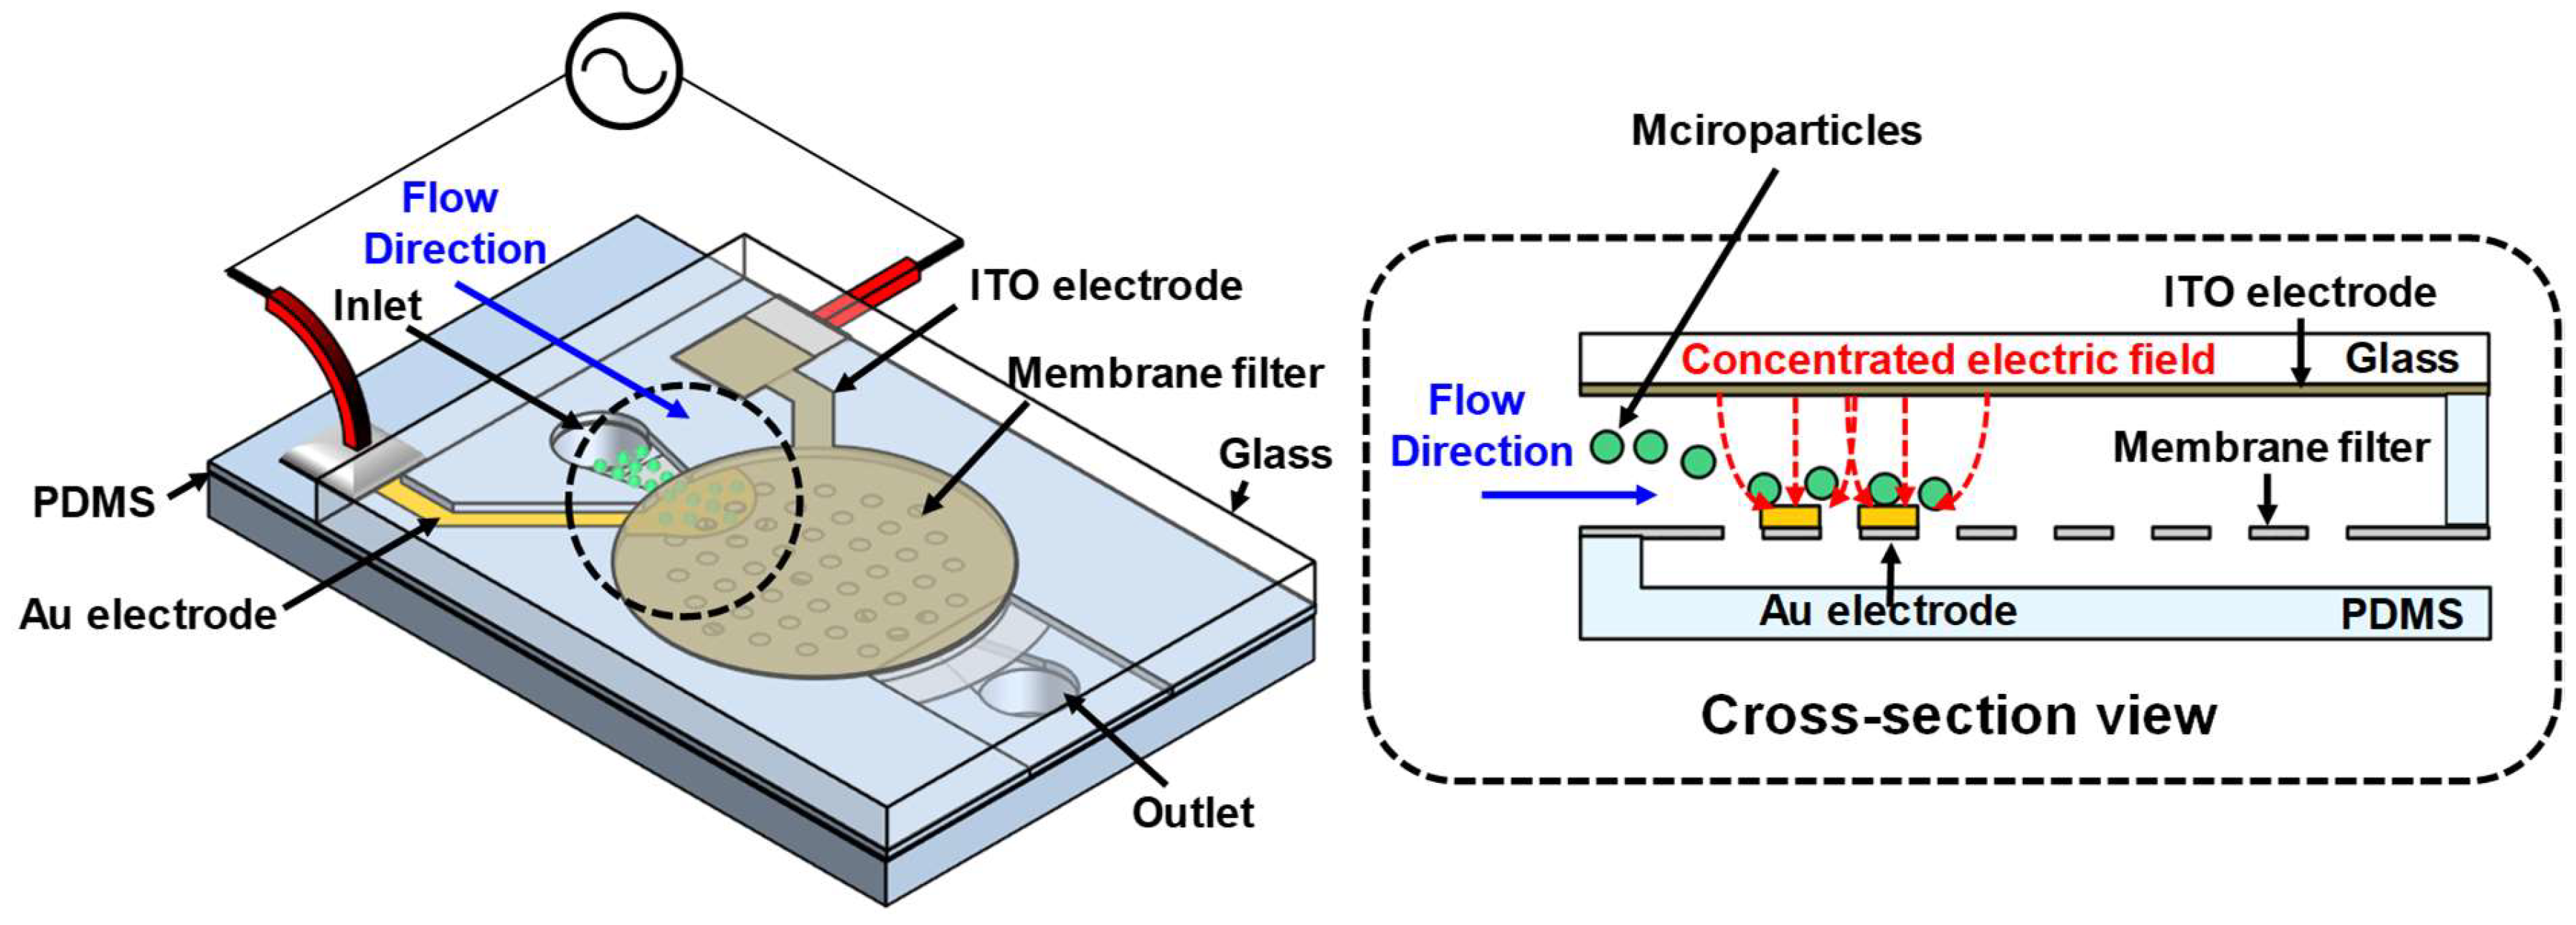
2. Design
3. Materials and Methods
3.1. Materials
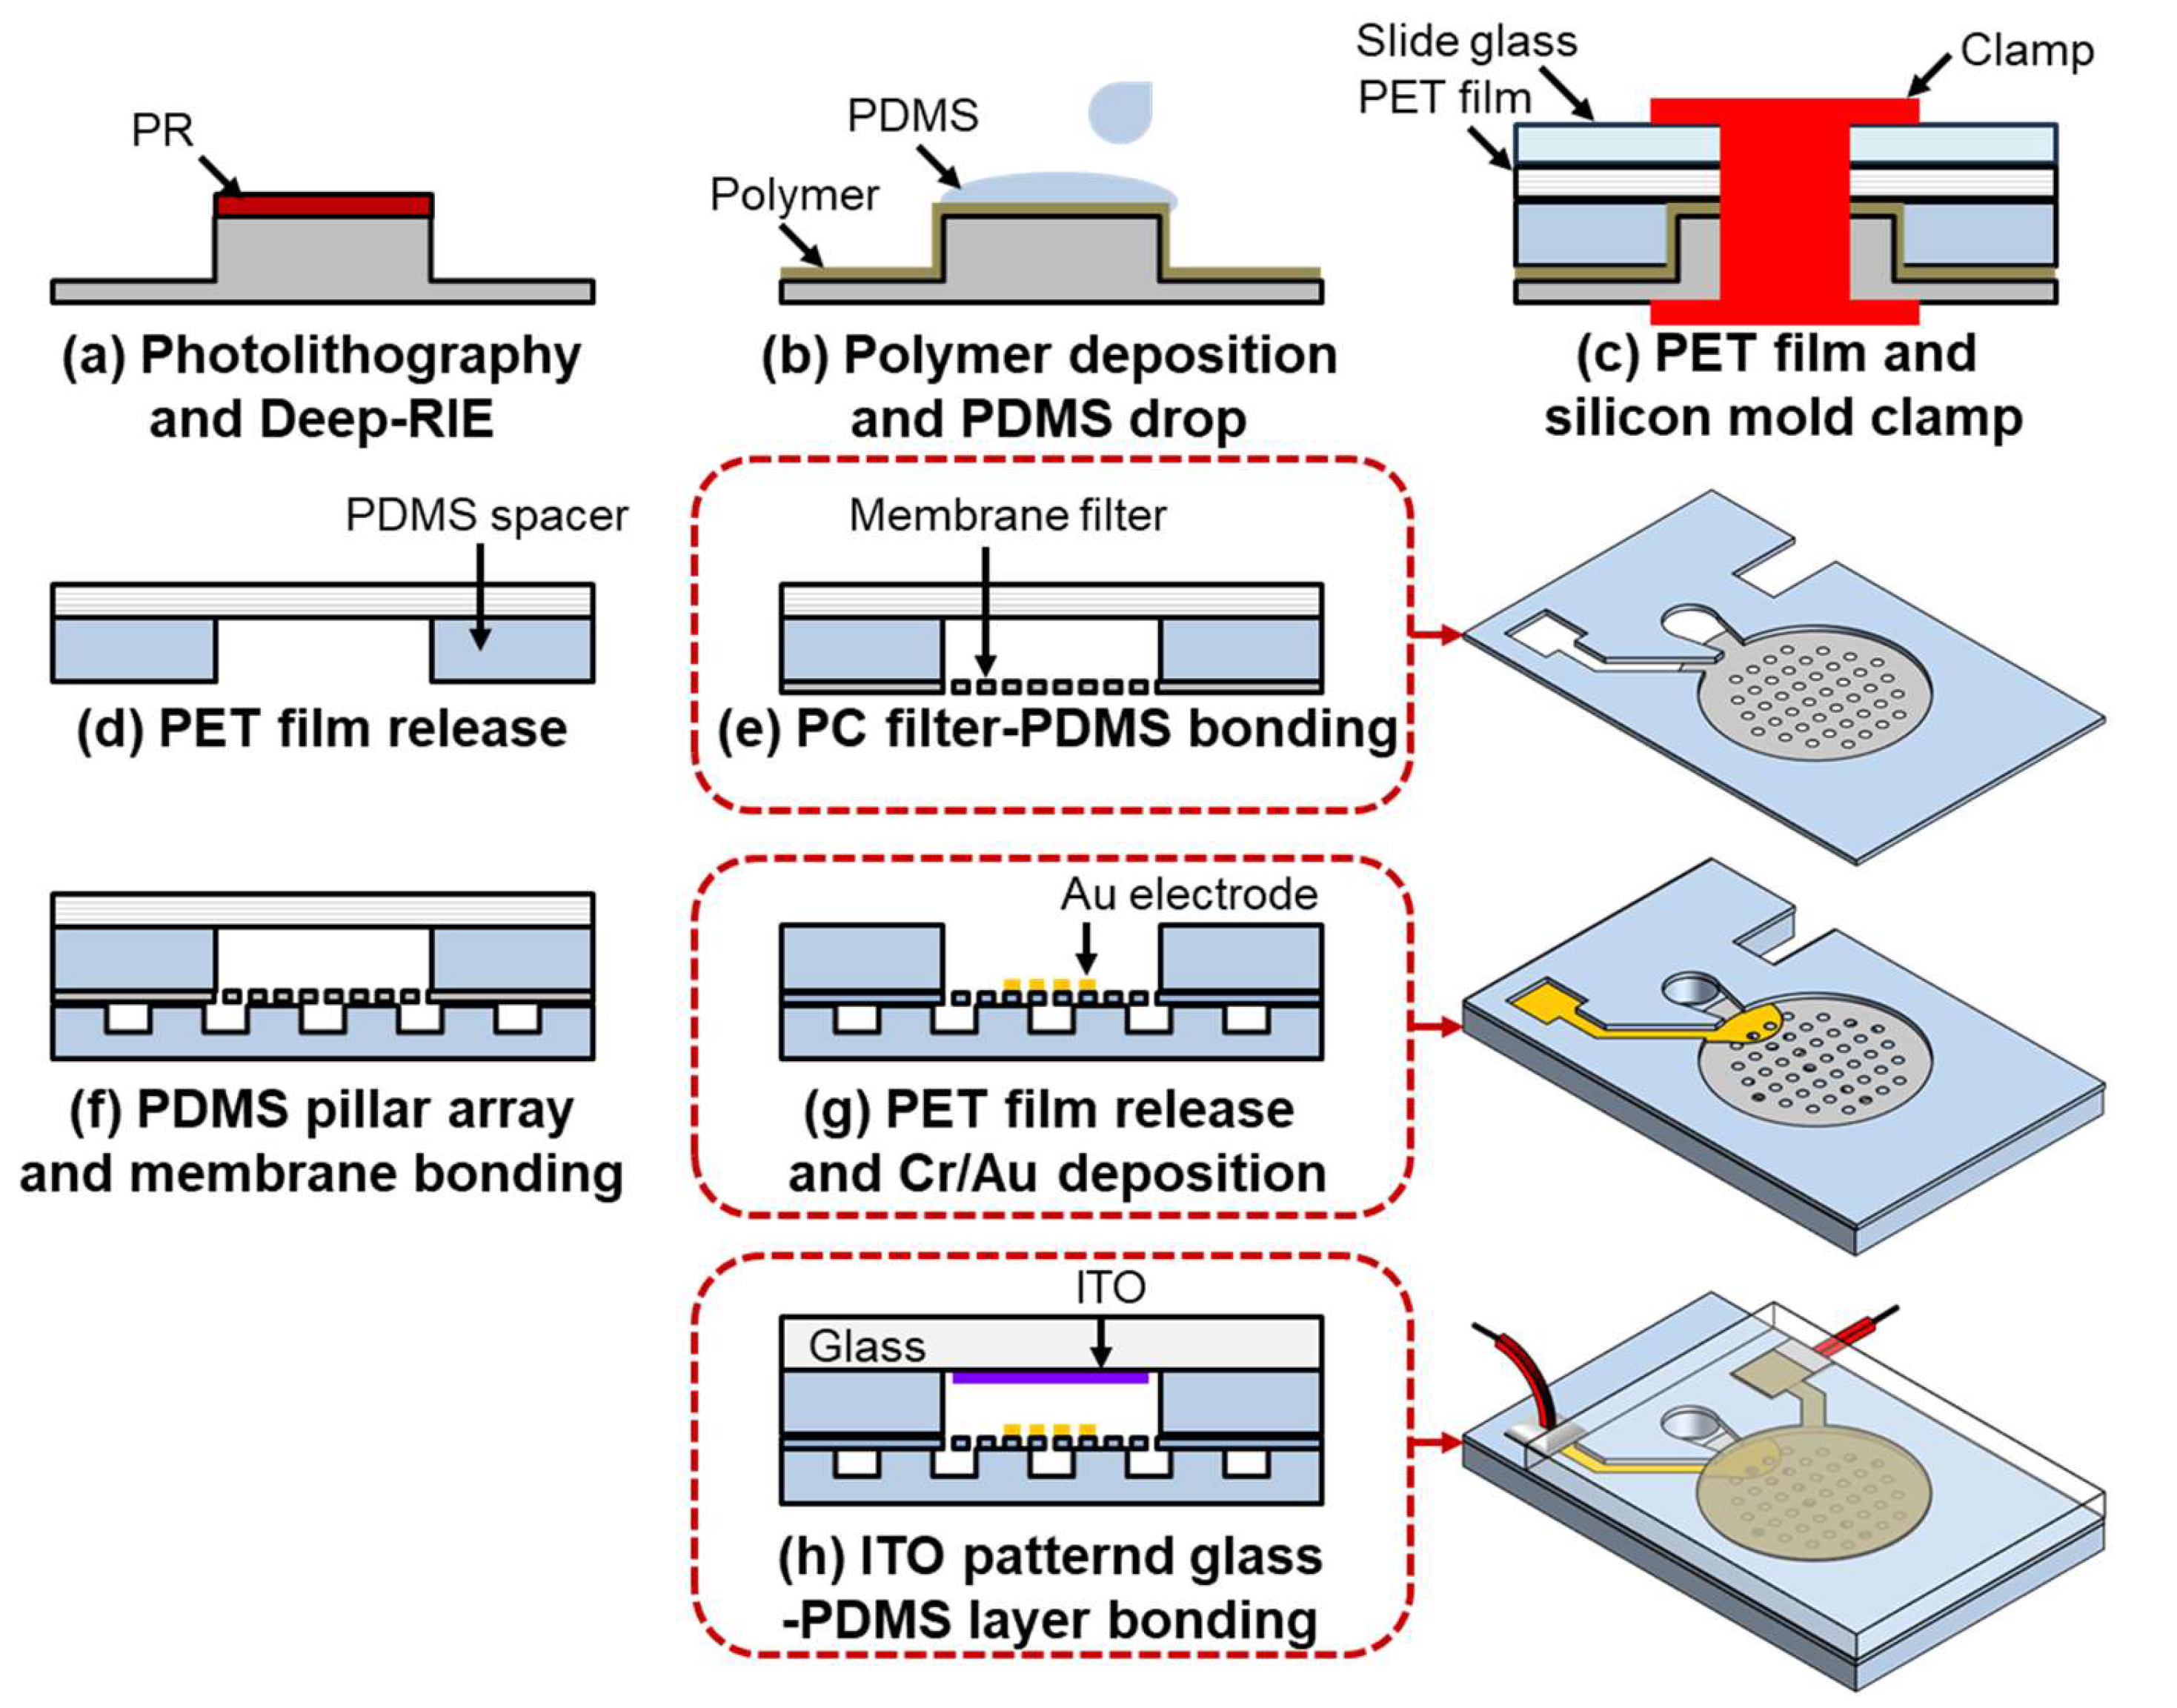
3.2. Fabrication
3.3. Experimental Setup
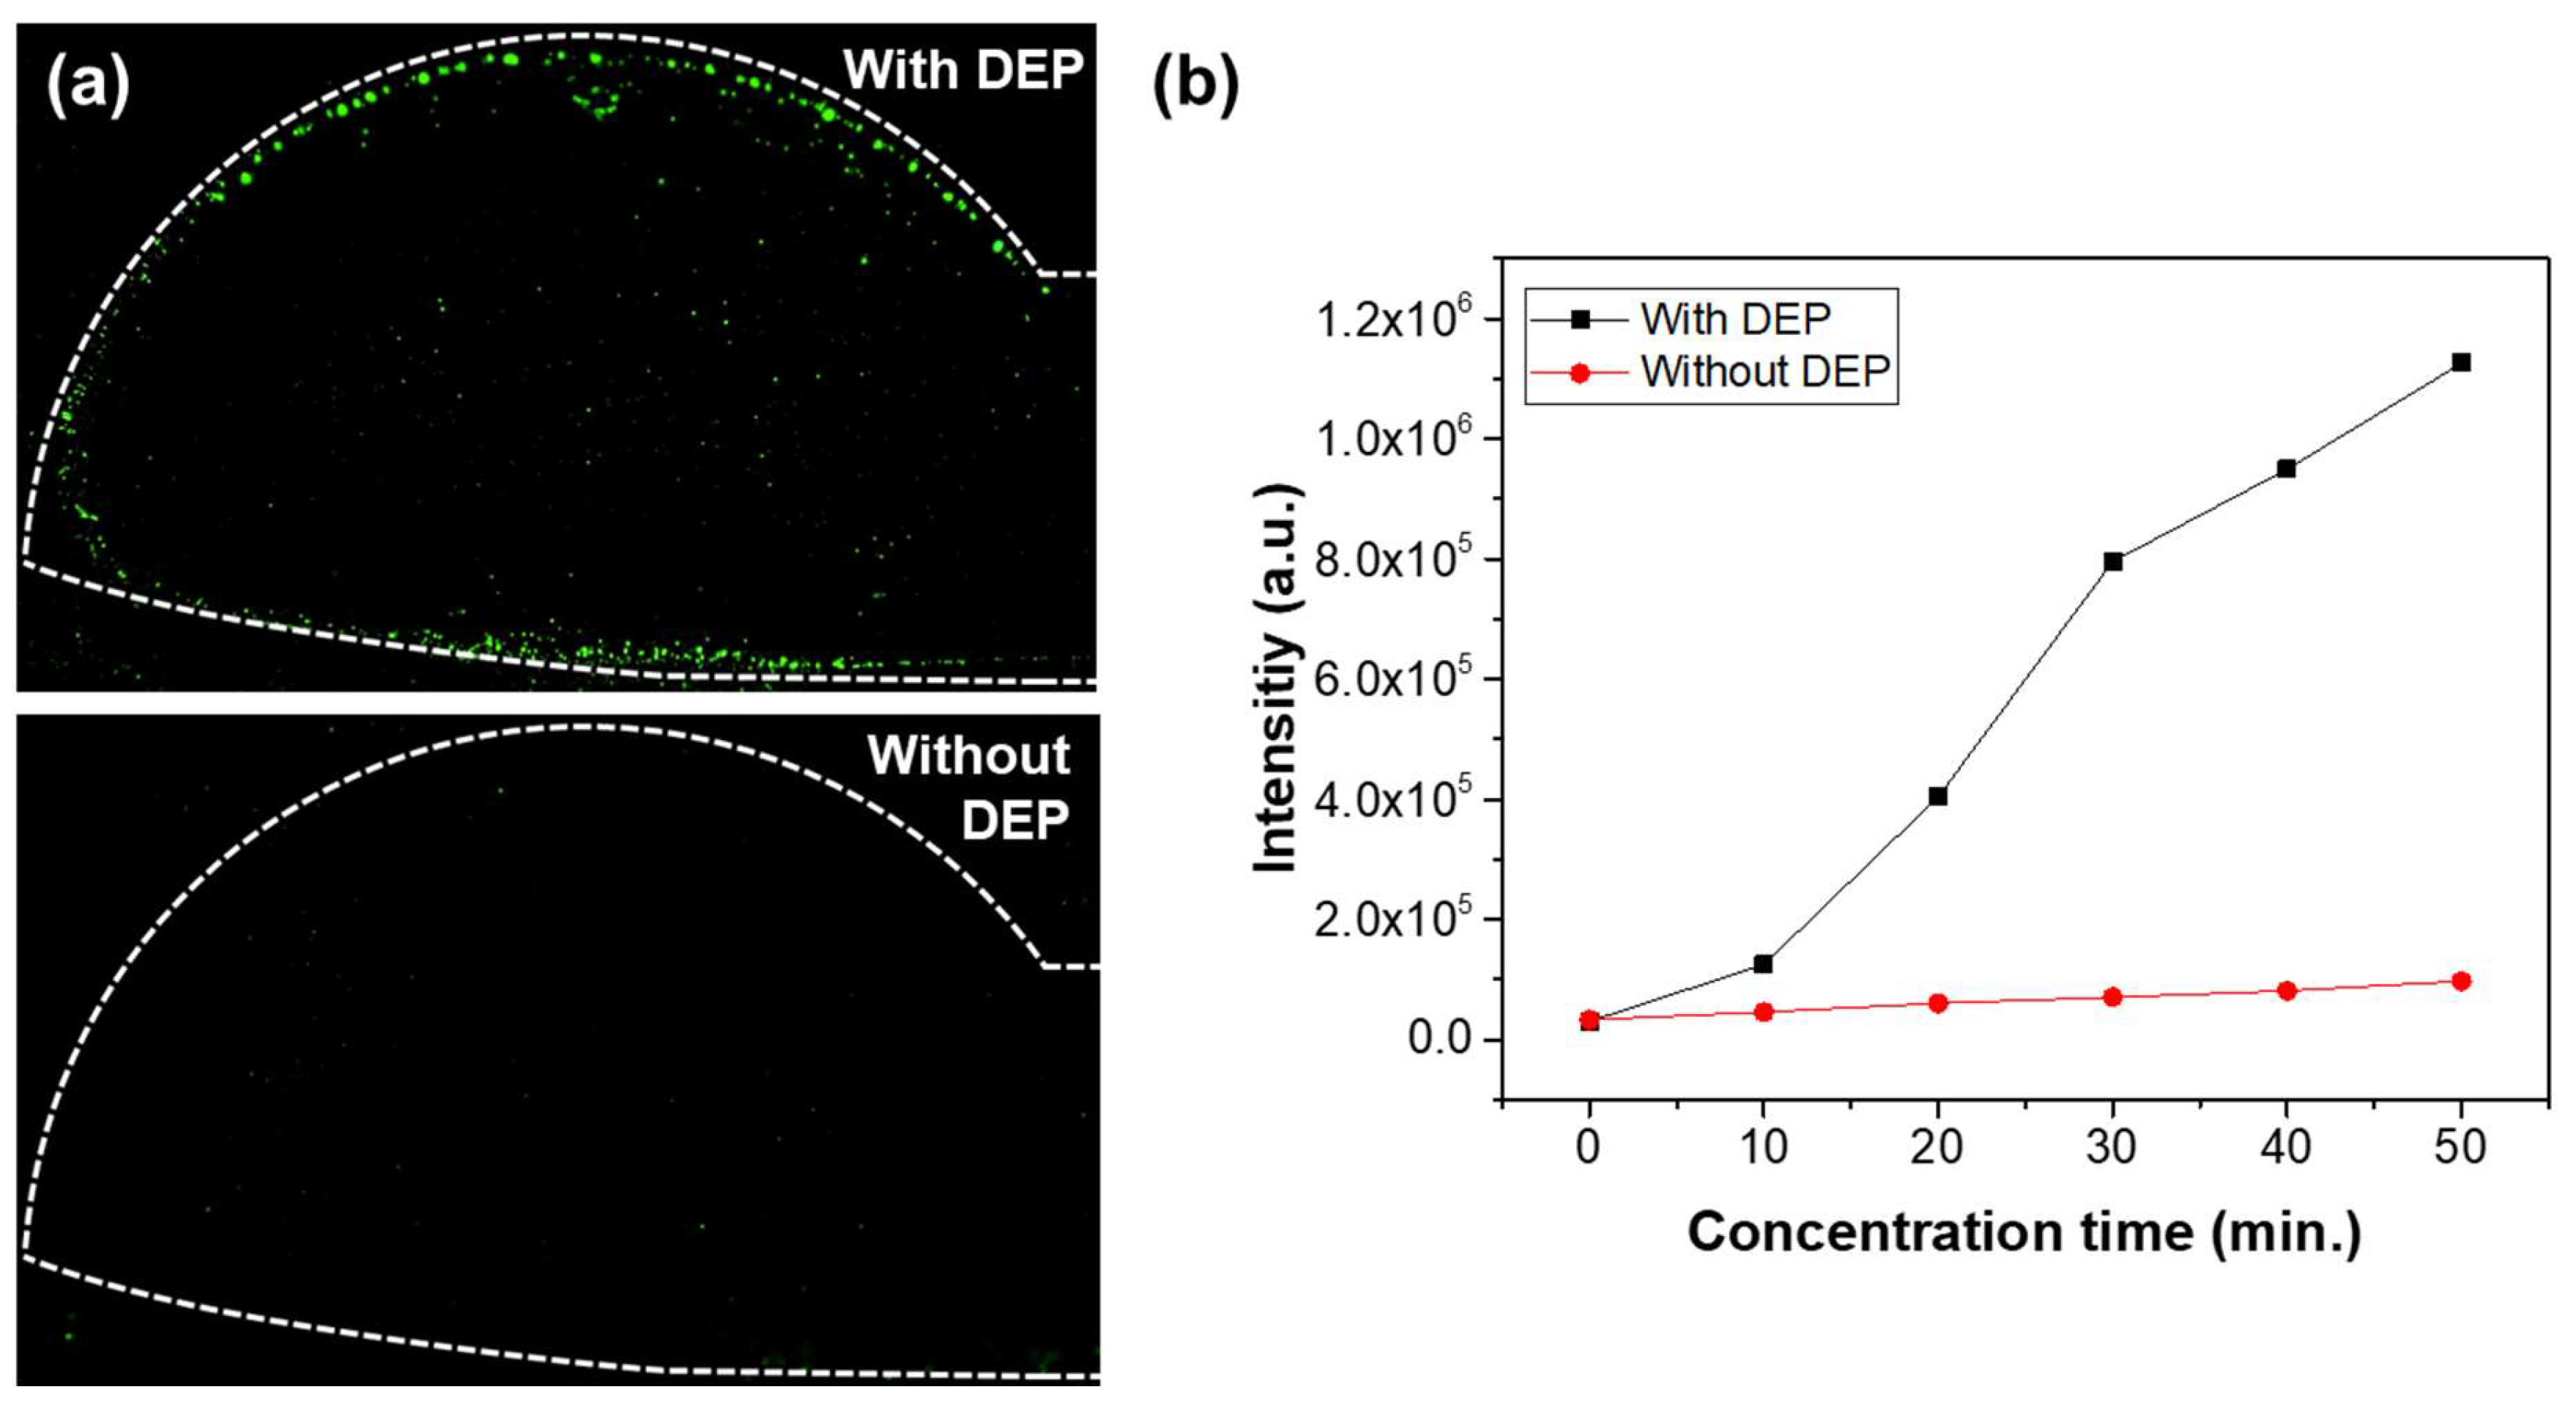
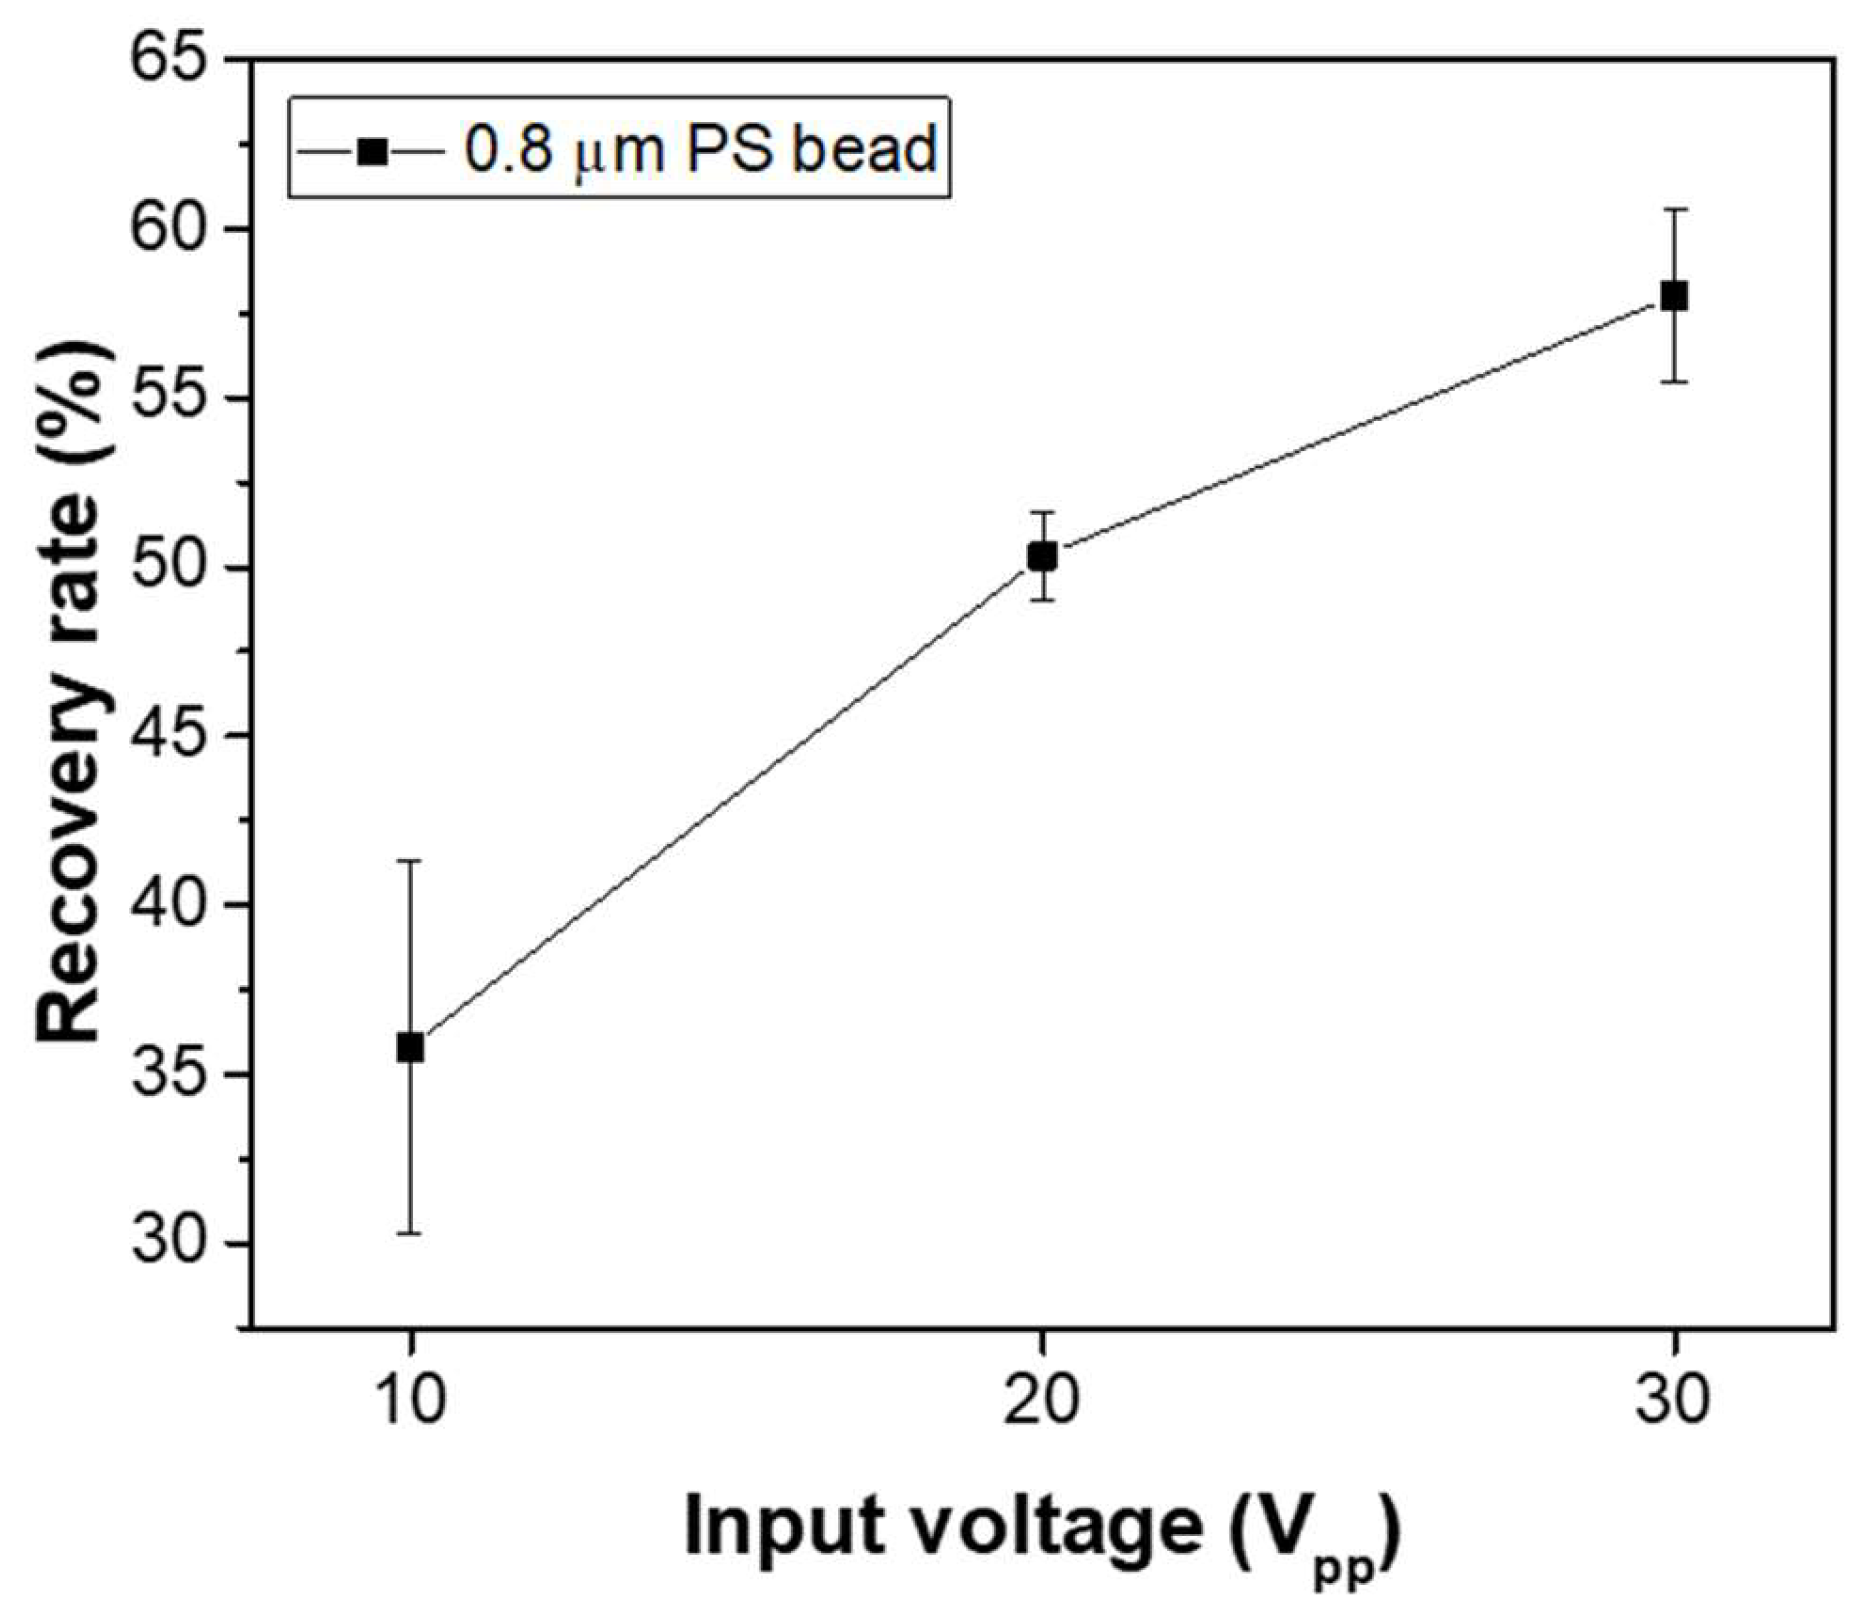
4. Results and Discussion
5. Conclusions
Author Contributions
Funding
Data Availability Statement
Conflicts of Interest
References
- Jokerst, J.C.; Emory, J.M.; Henry, C.S. Advances in microfluidics for environmental analysis. Analyst 2012, 137, 24–34. [Google Scholar] [CrossRef] [PubMed]
- Deng, Y.; Guo, Y.; Xu, B. Recent development of microfluidic technology for cell trapping in single cell analysis: A review. Processes 2020, 8, 1253. [Google Scholar] [CrossRef]
- Hettiarachchi, S.; Cha, H.; Ouyang, L.; Mudugamuwa, A.; An, H.; Kijanka, G.; Kashaninejad, N.; Nguyen, N.-T.; Zhang, J. Recent microfluidic advances in submicron to nanoparticle manipulation and separation. Lab Chip 2023, 23, 982–1010. [Google Scholar] [CrossRef]
- Aryal, P.; Hefner, C.; Martinez, B.; Henry, C.S. Microfluidics in environmental analysis: Advancements, challenges, and future prospects for rapid and efficient monitoring. Lab Chip 2024, 24, 1175–1206. [Google Scholar] [CrossRef] [PubMed]
- Cetin, B.; Özer, M.B.; Solmaz, M.E. Microfluidic bio-particle manipulation for biotechnology. Biochem. Eng. J. 2014, 92, 63–82. [Google Scholar] [CrossRef]
- Chavez-Pineda, O.G.; Rodriguez-Moncayo, R.; Cedillo-Alcantar, D.F.; Guevara-Pantoja, P.E.; Amador-Hernandez, J.U.; Garcia-Cordero, J.L. Microfluidic systems for the analysis of blood-derived molecular biomarkers. J. Electrophor. 2022, 43, 1667–1700. [Google Scholar] [CrossRef] [PubMed]
- Khanthaphixay, B.; Wu, L.; Yoon, J.-Y. Microparticle-based detection of viruses. Biosens. J. 2023, 13, 820. [Google Scholar] [CrossRef] [PubMed]
- Shi, J.; Ahmed, D.; Mao, X.; Lin, S.-C.S.; Lawit, A.; Huang, T.J. Acoustic tweezers: Patterning cells and microparticles using standing surface acoustic waves (SSAW). Lab Chip 2009, 9, 2890–2895. [Google Scholar] [CrossRef] [PubMed]
- Ding, X.; Lin, S.-C.S.; Kiraly, B.; Yue, H.; Li, S.; Chiang, I.-K.; Shi, J.; Benkovic, S.J.; Huang, T.J. On-chip manipulation of single microparticles, cells, and organisms using surface acoustic waves. Proc. Natl. Acad. Sci. USA 2012, 109, 11105–11109. [Google Scholar] [CrossRef]
- Collins, D.J.; Morahan, B.; Garcia-Bustos, J.; Doerig, C.; Plebanski, M.; Neild, A. Two-dimensional single-cell patterning with one cell per well driven by surface acoustic waves. Nat. Commun. 2015, 6, 8686. [Google Scholar] [CrossRef]
- Guo, F.; Mao, Z.; Chen, Y.; Xie, Z.; Lata, J.P.; Li, P.; Ren, L.; Liu, J.; Yang, J.; Dao, M. Three-dimensional manipulation of single cells using surface acoustic waves. Proc. Natl. Acad. Sci. USA 2016, 113, 1522–1527. [Google Scholar] [CrossRef] [PubMed]
- Wu, Y.; Ao, Z.; Chen, B.; Muhsen, M.; Bondesson, M.; Lu, X.; Guo, F. Acoustic assembly of cell spheroids in disposable capillaries. Nanotechnology 2018, 29, 504006. [Google Scholar] [CrossRef]
- Farooq, U.; Liu, X.; Zhou, W.; Hassan, M.; Niu, L.; Meng, L. Cell lysis induced by nanowire collision based on acoustic streaming using surface acoustic waves. Sens. Actuat. B-Chem. 2021, 345, 130335. [Google Scholar] [CrossRef]
- Kim, U.; Oh, B.; Ahn, J.; Lee, S.; Cho, Y. Inertia–acoustophoresis hybrid microfluidic device for rapid and efficient cell separation. J. Sens. 2022, 22, 4709. [Google Scholar] [CrossRef]
- Undvall Anand, E.; Magnusson, C.; Lenshof, A.; Ceder, Y.; Lilja, H.; Laurell, T. Two-step acoustophoresis separation of live tumor cells from whole blood. J. Anal. Chem. 2021, 93, 17076–17085. [Google Scholar] [CrossRef] [PubMed]
- Fakhfouri, A.; Colditz, M.; Devendran, C.; Ivanova, K.; Jacob, S.; Neild, A.; Winkler, A. Fully microfabricated surface acoustic wave tweezer for collection of submicron particles and human blood cells. ACS Appl. Mater. Interfaces 2023, 15, 24023–24033. [Google Scholar] [CrossRef] [PubMed]
- Hayakawa, T.; Akita, Y.; Arai, F. Parallel trapping of single motile cells based on vibration-induced flow. Microfluid. Nanofluidics 2018, 22, 42. [Google Scholar] [CrossRef]
- Lu, X.; Martin, A.; Soto, F.; Angsantikul, P.; Li, J.; Chen, C.; Liang, Y.; Hu, J.; Zhang, L.; Wang, J. Parallel label-free isolation of cancer cells using arrays of acoustic microstreaming traps. Adv. Mater. Technol. 2019, 4, 1800374. [Google Scholar] [CrossRef]
- Ashkin, A.; Dziedzic, J.M.; Bjorkholm, J.E.; Chu, S. Observation of a single-beam gradient force optical trap for dielectric particles. Opt. Lett. 1986, 11, 288–290. [Google Scholar] [CrossRef]
- Zhong, M.-C.; Wei, X.-B.; Zhou, J.-H.; Wang, Z.-Q.; Li, Y.-M. Trapping red blood cells in living animals using optical tweezers. Nat. Commun. 2013, 4, 1768. [Google Scholar] [CrossRef] [PubMed]
- Daly, M.; Sergides, M.; Nic Chormaic, S. Optical trapping and manipulation of micrometer and submicrometer particles. Laser Photonics Rev. 2015, 9, 309–329. [Google Scholar] [CrossRef]
- Zhu, R.; Avsievich, T.; Popov, A.; Meglinski, I. Optical tweezers in studies of red blood cells. Cells 2020, 9, 545. [Google Scholar] [CrossRef] [PubMed]
- Bustamante, C.J.; Chemla, Y.R.; Liu, S.; Wang, M.D. Optical tweezers in single-molecule biophysics. Nat. Rev. Methods Primers 2021, 1, 25. [Google Scholar] [CrossRef]
- Mondal, P.P.; Baro, N.; Singh, A.; Joshi, P.; Basumatary, J. Lightsheet optical tweezer (LOT) for optical manipulation of microscopic particles and live cells. Sci. Rep. 2022, 12, 10229. [Google Scholar] [CrossRef] [PubMed]
- Xie, Y.; Liu, X. Multifunctional manipulation of red blood cells using optical tweezers. J. Biophotonics 2022, 15, e202100315. [Google Scholar] [CrossRef] [PubMed]
- Pohl, H.A. The motion and precipitation of suspensoids in divergent electric fields. J. Appl. Phys. 1951, 22, 869–871. [Google Scholar] [CrossRef]
- Green, N.G.; Morgan, H.; Milner, J.J. Manipulation and trapping of sub-micron bioparticles using dielectrophoresis. J. Biochem. Biophys. Methods 1997, 35, 89–102. [Google Scholar] [CrossRef]
- Sarno, B.; Heineck, D.; Heller, M.J.; Ibsen, S.D. Dielectrophoresis: Developments and applications from 2010 to 2020. J. Electrophor. 2021, 42, 539–564. [Google Scholar] [CrossRef] [PubMed]
- Wang, Y.; Tong, N.; Li, F.; Zhao, K.; Wang, D.; Niu, Y.; Xu, F.; Cheng, J.; Wang, J. Trapping of a single microparticle using AC dielectrophoresis forces in a microfluidic chip. Micromachines 2023, 14, 159. [Google Scholar] [CrossRef] [PubMed]
- Nam, Y.-H.; Lee, S.-Y.; Lee, S.-K.; Kim, J.-H.; Park, J.-H. Microfluidic device with three-dimensional microtip electrodes for efficient capture and concentration of bacteria-sized microparticles using dielectrophoresis. Sens. Actuat. A-Phys. 2024, 379, 115957. [Google Scholar] [CrossRef]
- Varmazyari, V.; Habibiyan, H.; Ghafoorifard, H.; Ebrahimi, M.; Ghafouri-Fard, S. A dielectrophoresis-based microfluidic system having double-sided optimized 3D electrodes for label-free cancer cell separation with preserving cell viability. Sci. Rep. 2022, 12, 12100. [Google Scholar] [CrossRef] [PubMed]
- Xu, X.; Sarder, P.; Li, Z.; Nehorai, A. Optimization of microfluidic microsphere-trap arrays. Biomicrofluidics 2013, 7, 14112. [Google Scholar] [CrossRef]
- Kim, J.; Erath, J.; Rodriguez, A.; Yang, C. A high-efficiency microfluidic device for size-selective trapping and sorting. Lab Chip 2014, 14, 2480–2490. [Google Scholar] [CrossRef] [PubMed]
- Jin, D.; Deng, B.; Li, J.; Cai, W.; Tu, L.; Chen, J.; Wu, Q.; Wang, W. A microfluidic device enabling high-efficiency single cell trapping. Biomicrofluidics 2015, 9, 014101. [Google Scholar] [CrossRef] [PubMed]
- Occhetta, P.; Licini, M.; Redaelli, A.; Rasponi, M. Design of a microfluidic strategy for trapping and screening single cells. Med. Eng. Phys. 2016, 38, 33–40. [Google Scholar] [CrossRef] [PubMed]
- Narayanamurthy, V.; Nagarajan, S.; Samsuri, F.; Sridhar, T. Microfluidic hydrodynamic trapping for single cell analysis: Mechanisms, methods and applications. Anal. Methods 2017, 9, 3751–3772. [Google Scholar] [CrossRef]
- Tayebi, M.; Zhou, Y.; Tripathi, P.; Chandramohanadas, R.; Ai, Y. Exosome purification and analysis using a facile microfluidic hydrodynamic trapping device. J. Anal. Chem. 2020, 92, 10733–10742. [Google Scholar] [CrossRef] [PubMed]
- Lipp, C.; Uning, K.; Cottet, J.; Migliozzi, D.; Bertsch, A.; Renaud, P. Planar hydrodynamic traps and buried channels for bead and cell trapping and releasing. Lab Chip 2021, 21, 3686–3694. [Google Scholar] [CrossRef] [PubMed]
- Lv, D.; Zhang, X.; Xu, M.; Cao, W.; Liu, X.; Deng, J.; Yang, N.; Hu, N. Trapping and releasing of single microparticles and cells in a microfluidic chip. J. Electrophor. 2022, 43, 2165–2174. [Google Scholar] [CrossRef] [PubMed]
- Choi, D.-H.; Yoon, G.-W.; Park, J.W.; Ihm, C.; Lee, D.-S.; Yoon, J.-B. Fabrication of a membrane filter with controlled pore shape and its application to cell separation and strong single cell trapping. J. Micromech. Microeng. 2015, 25, 105007. [Google Scholar] [CrossRef]
- Liang, L.-G.; Kong, M.-Q.; Zhou, S.; Sheng, Y.-F.; Wang, P.; Yu, T.; Inci, F.; Kuo, W.P.; Li, L.-J.; Demirci, U. An integrated double-filtration microfluidic device for isolation, enrichment and quantification of urinary extracellular vesicles for detection of bladder cancer. Sci. Rep. 2017, 7, 46224. [Google Scholar] [CrossRef] [PubMed]
- Lenz, K.D.; Jakhar, S.; Chen, J.W.; Anderson, A.S.; Purcell, D.C.; Ishak, M.O.; Harris, J.F.; Akhadov, L.E.; Kubicek-Sutherland, J.Z.; Nath, P. A centrifugal microfluidic cross-flow filtration platform to separate serum from whole blood for the detection of amphiphilic biomarkers. Sci. Rep. 2021, 11, 5287. [Google Scholar] [CrossRef]
- Vinoth, R.; Sangavi, P.; Nakagawa, T.; Jayaraman, M.; Mohan, A.M.V. All-in-one microfluidic device with an integrated porous filtration membrane for on-site detection of multiple salivary biomarkers. Sens. Actuat. B-Chem. 2023, 379, 133214. [Google Scholar] [CrossRef]
- Nam, Y.H.; Lee, S.; Lee, S.K.; Kim, J.H.; Park, J.H. Microfluidic chip with integrated separation, mixing, and concentration operations for rapid and sensitive bacterial detection utilizing synthetic inorganic antibodies. Sens. Actuat. B-Chem. 2024, 404, 135202. [Google Scholar] [CrossRef]
- Schwaminger, S.; Rottmueller, M.E.; Fischl, R.; Kalali, B.; Berensmeier, S. Detection of targeted bacteria species on filtration membranes. Analyst 2021, 146, 3549–3556. [Google Scholar] [CrossRef]
- Chang, C.H.; Wang, C.L.; Li, B.R. Rapid detection of live bacteria in water using nylon filter membrane-integrated centrifugal microfluidics. Biosens. Bioelectron. 2023, 236, 115403. [Google Scholar] [CrossRef] [PubMed]
- Wang, R.; Xu, Y.; Sors, T.; Irudayaraj, J.; Ren, W.; Wang, R. Impedimetric detection of bacteria by using a microfluidic chip and silver nanoparticle based signal enhancement. Mikrochim. Acta 2018, 185, 184. [Google Scholar] [CrossRef] [PubMed]
- Choi, W.; Min, Y.W.; Lee, K.Y.; Jun, S.; Lee, H.G. Dielectrophoresis-based microwire biosensor for rapid detection of Escherichia coli K-12 in ground beef. LWT 2020, 132, 109230. [Google Scholar] [CrossRef]
- Zhang, J.; Jiang, Y.; Xia, X.; Wu, J.; Almeida, R.; Eda, S.; Qi, H. An on-site, highly specific immunosensor for Escherichia coli detection in field milk samples from mastitis-affected dairy cattle. Biosens. Bioelectron. 2020, 165, 112366. [Google Scholar] [CrossRef]
- Petrovszki, D.; Valkai, S.; Gora, E.; Tanner, M.; Bányai, A.; Fürjes, P.; Dér, A. An integrated electro-optical biosensor system for rapid, low-cost detection of bacteria. Microelectron. Eng. 2021, 239, 111523. [Google Scholar] [CrossRef]


Disclaimer/Publisher’s Note: The statements, opinions and data contained in all publications are solely those of the individual author(s) and contributor(s) and not of MDPI and/or the editor(s). MDPI and/or the editor(s) disclaim responsibility for any injury to people or property resulting from any ideas, methods, instructions or products referred to in the content. |
© 2025 by the authors. Licensee MDPI, Basel, Switzerland. This article is an open access article distributed under the terms and conditions of the Creative Commons Attribution (CC BY) license (https://creativecommons.org/licenses/by/4.0/).
Share and Cite
Nam, Y.-H.; Lee, S.-K.; Park, J.-H. Dielectrophoresis-Enhanced Microfluidic Device with Membrane Filter for Efficient Microparticle Concentration and Optical Detection. Micromachines 2025, 16, 158. https://doi.org/10.3390/mi16020158
Nam Y-H, Lee S-K, Park J-H. Dielectrophoresis-Enhanced Microfluidic Device with Membrane Filter for Efficient Microparticle Concentration and Optical Detection. Micromachines. 2025; 16(2):158. https://doi.org/10.3390/mi16020158
Chicago/Turabian StyleNam, Young-Ho, Seung-Ki Lee, and Jae-Hyoung Park. 2025. "Dielectrophoresis-Enhanced Microfluidic Device with Membrane Filter for Efficient Microparticle Concentration and Optical Detection" Micromachines 16, no. 2: 158. https://doi.org/10.3390/mi16020158
APA StyleNam, Y.-H., Lee, S.-K., & Park, J.-H. (2025). Dielectrophoresis-Enhanced Microfluidic Device with Membrane Filter for Efficient Microparticle Concentration and Optical Detection. Micromachines, 16(2), 158. https://doi.org/10.3390/mi16020158