
Microneedles as Modern Carriers of Plant Extracts


Abstract
1. Introduction
2. Materials and Methods
2.1. Extracts
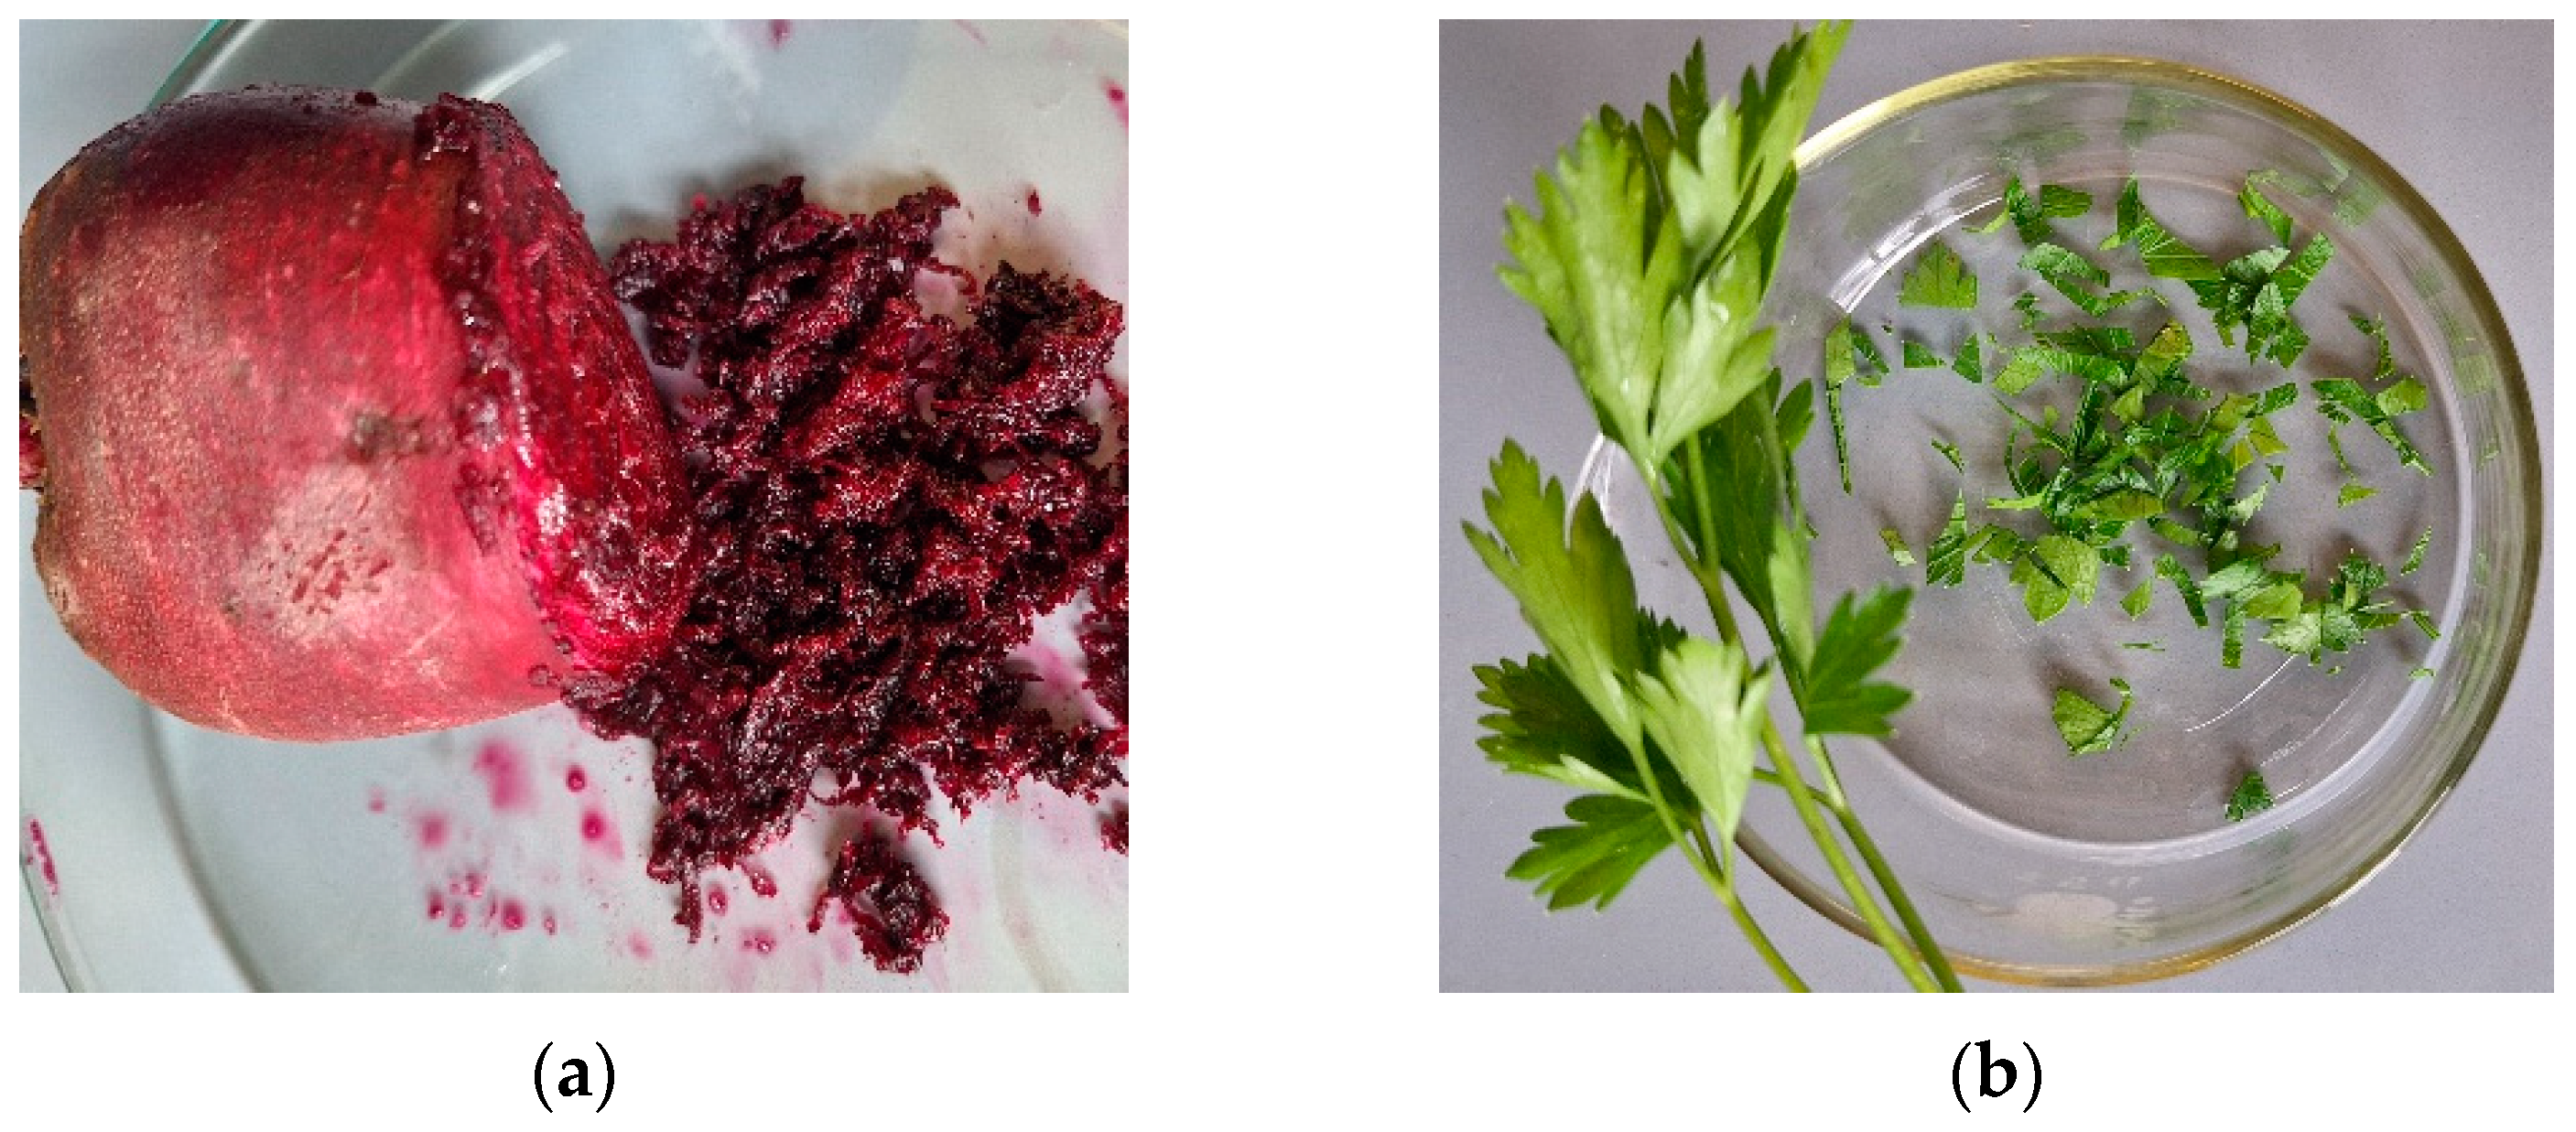
2.1.1. Preparation of the Extracts
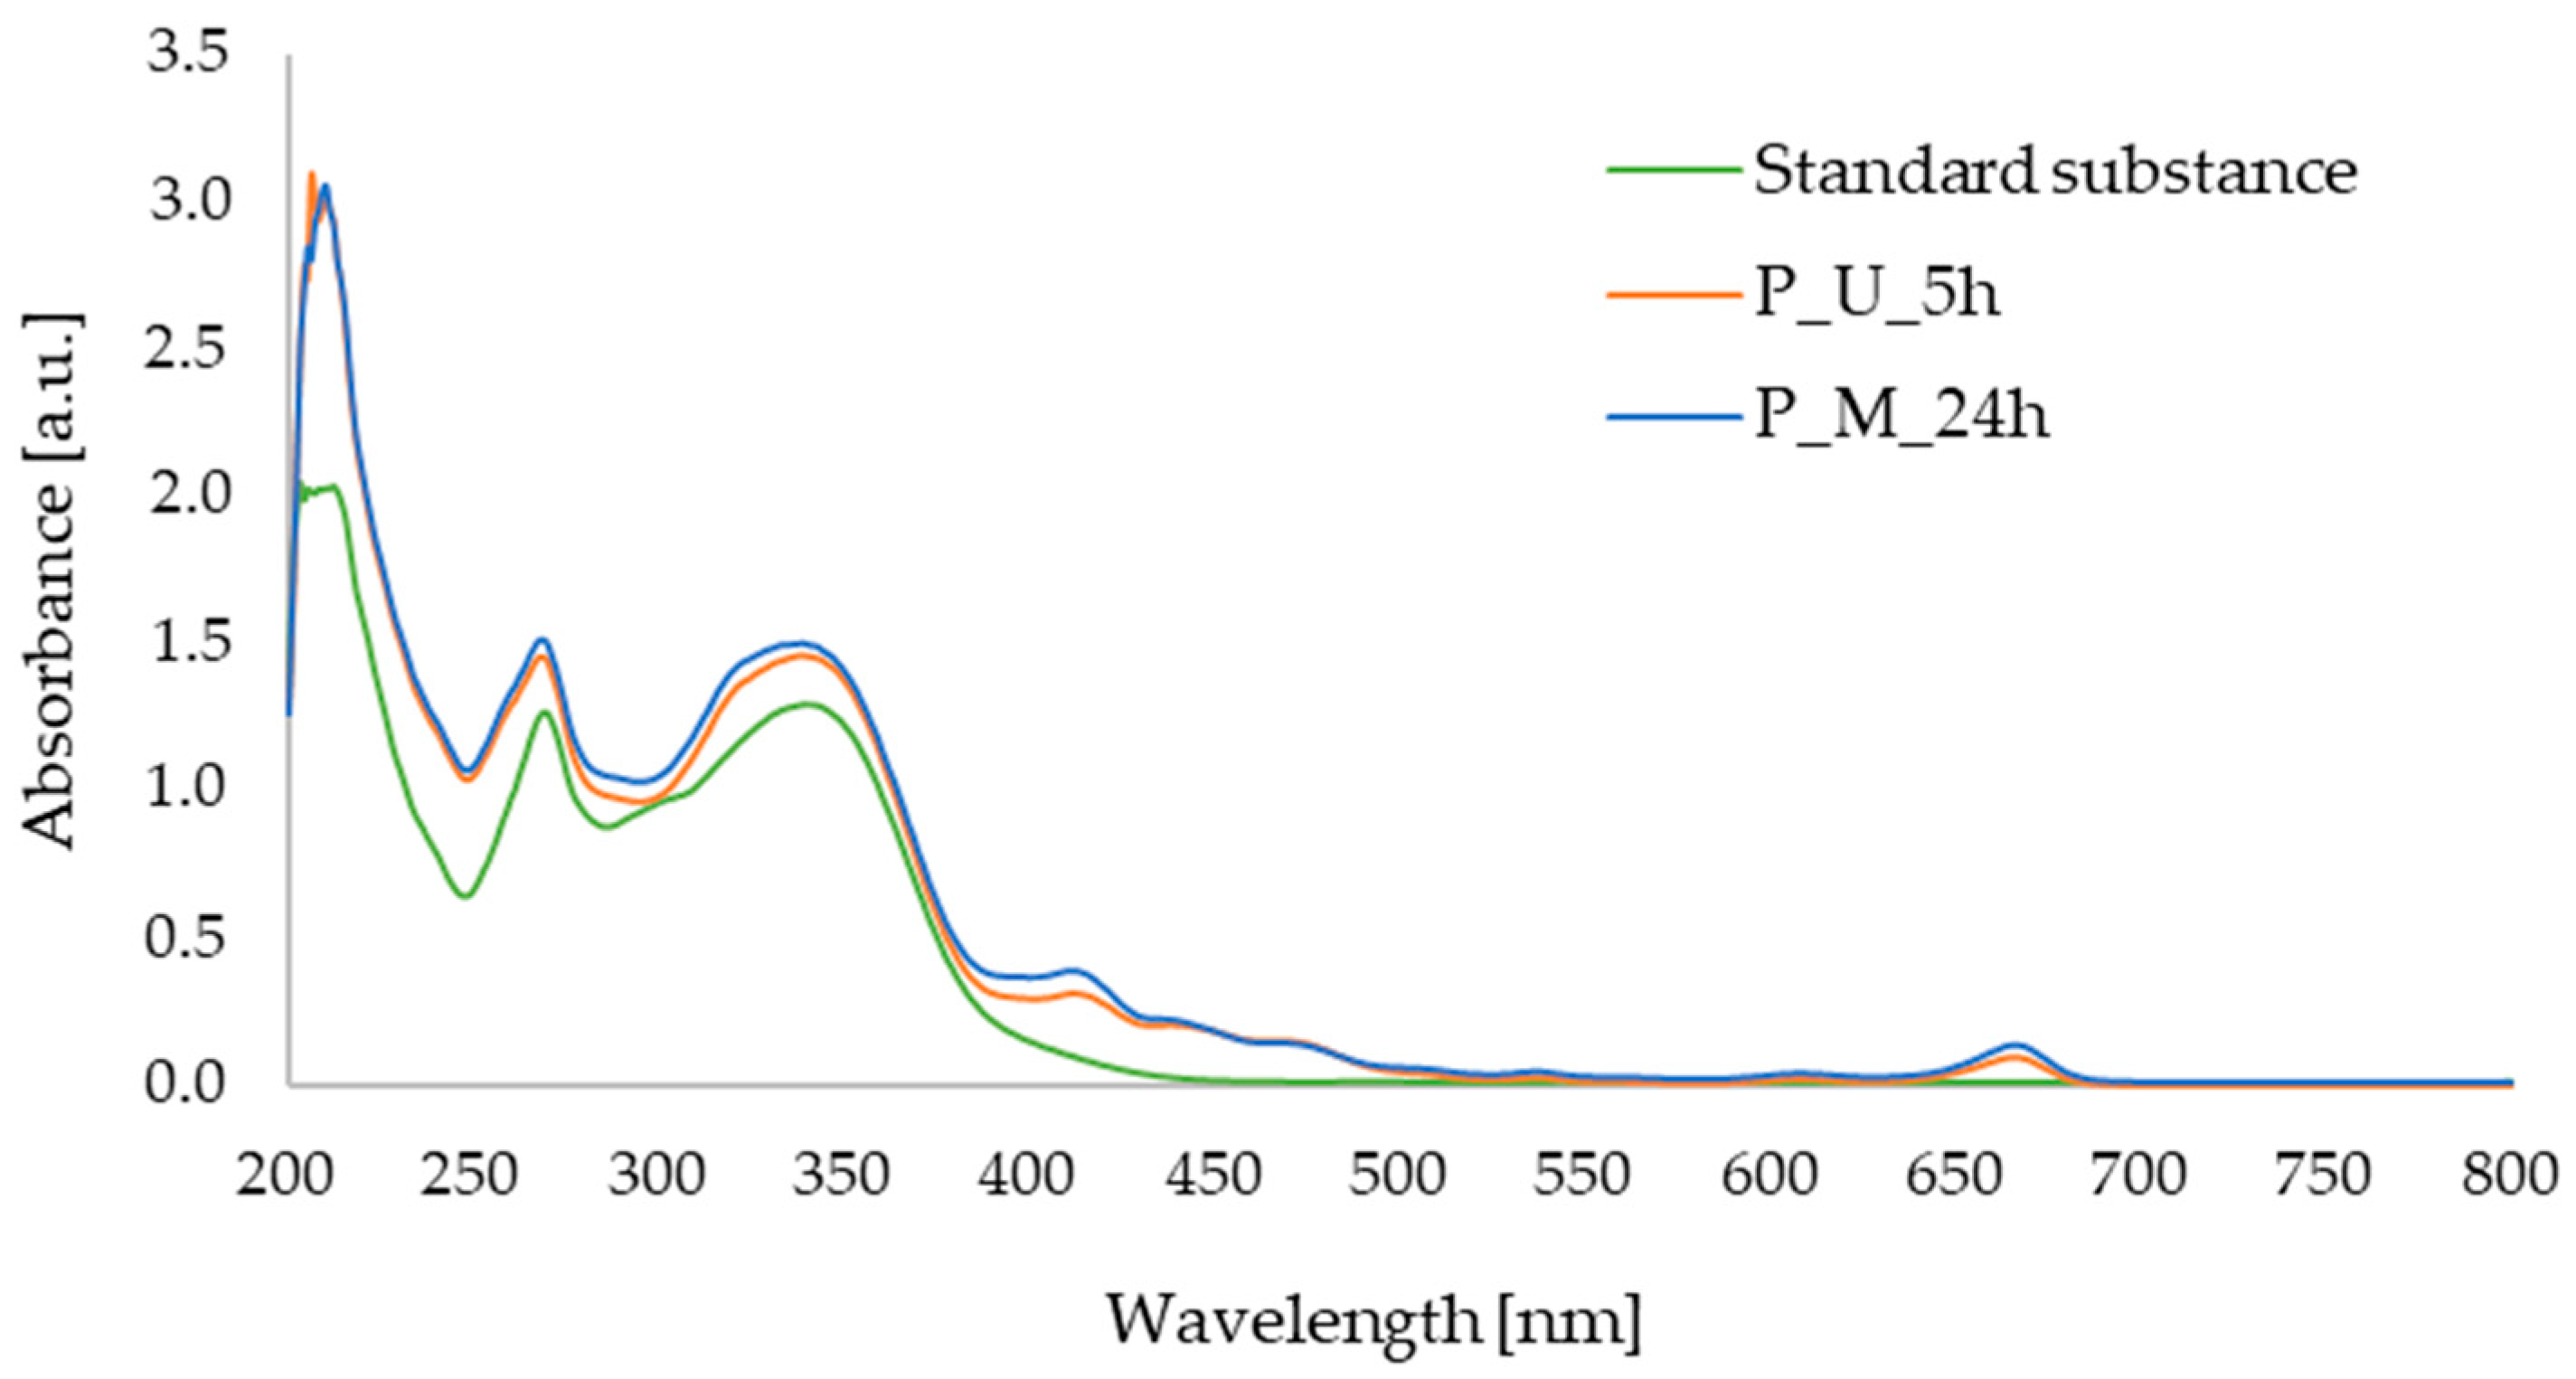
2.1.2. UV–Vis Analysis
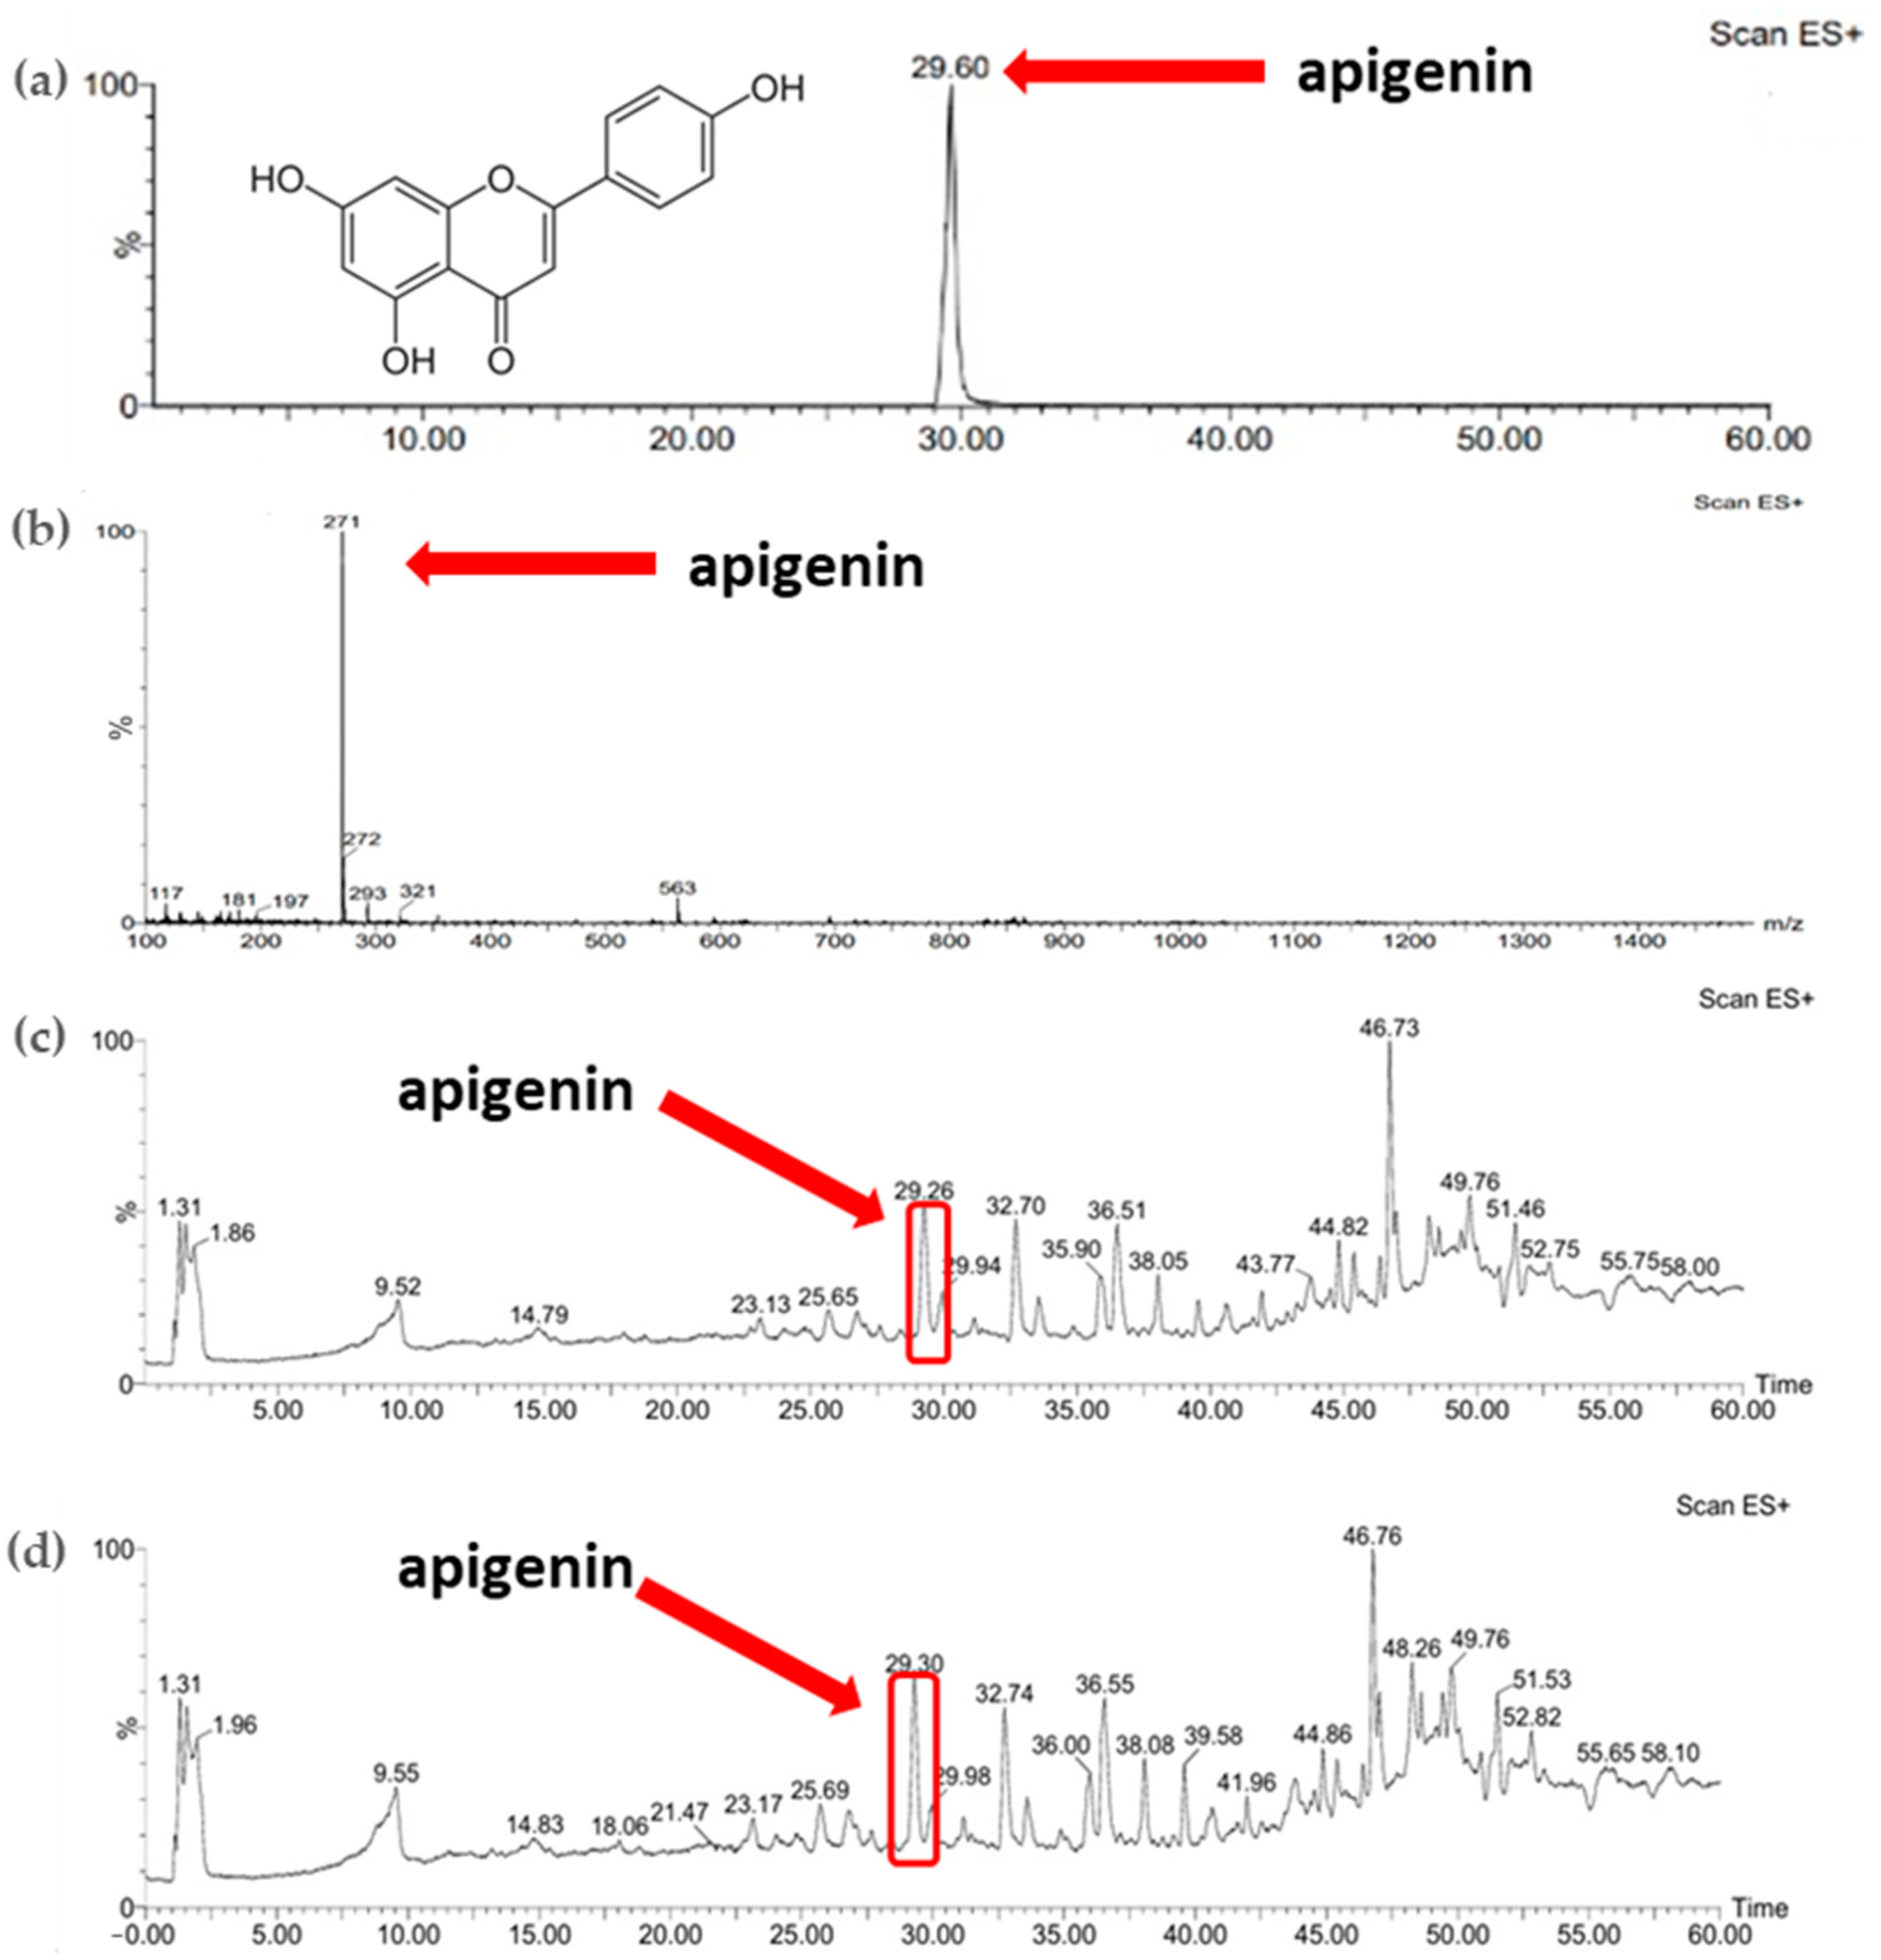
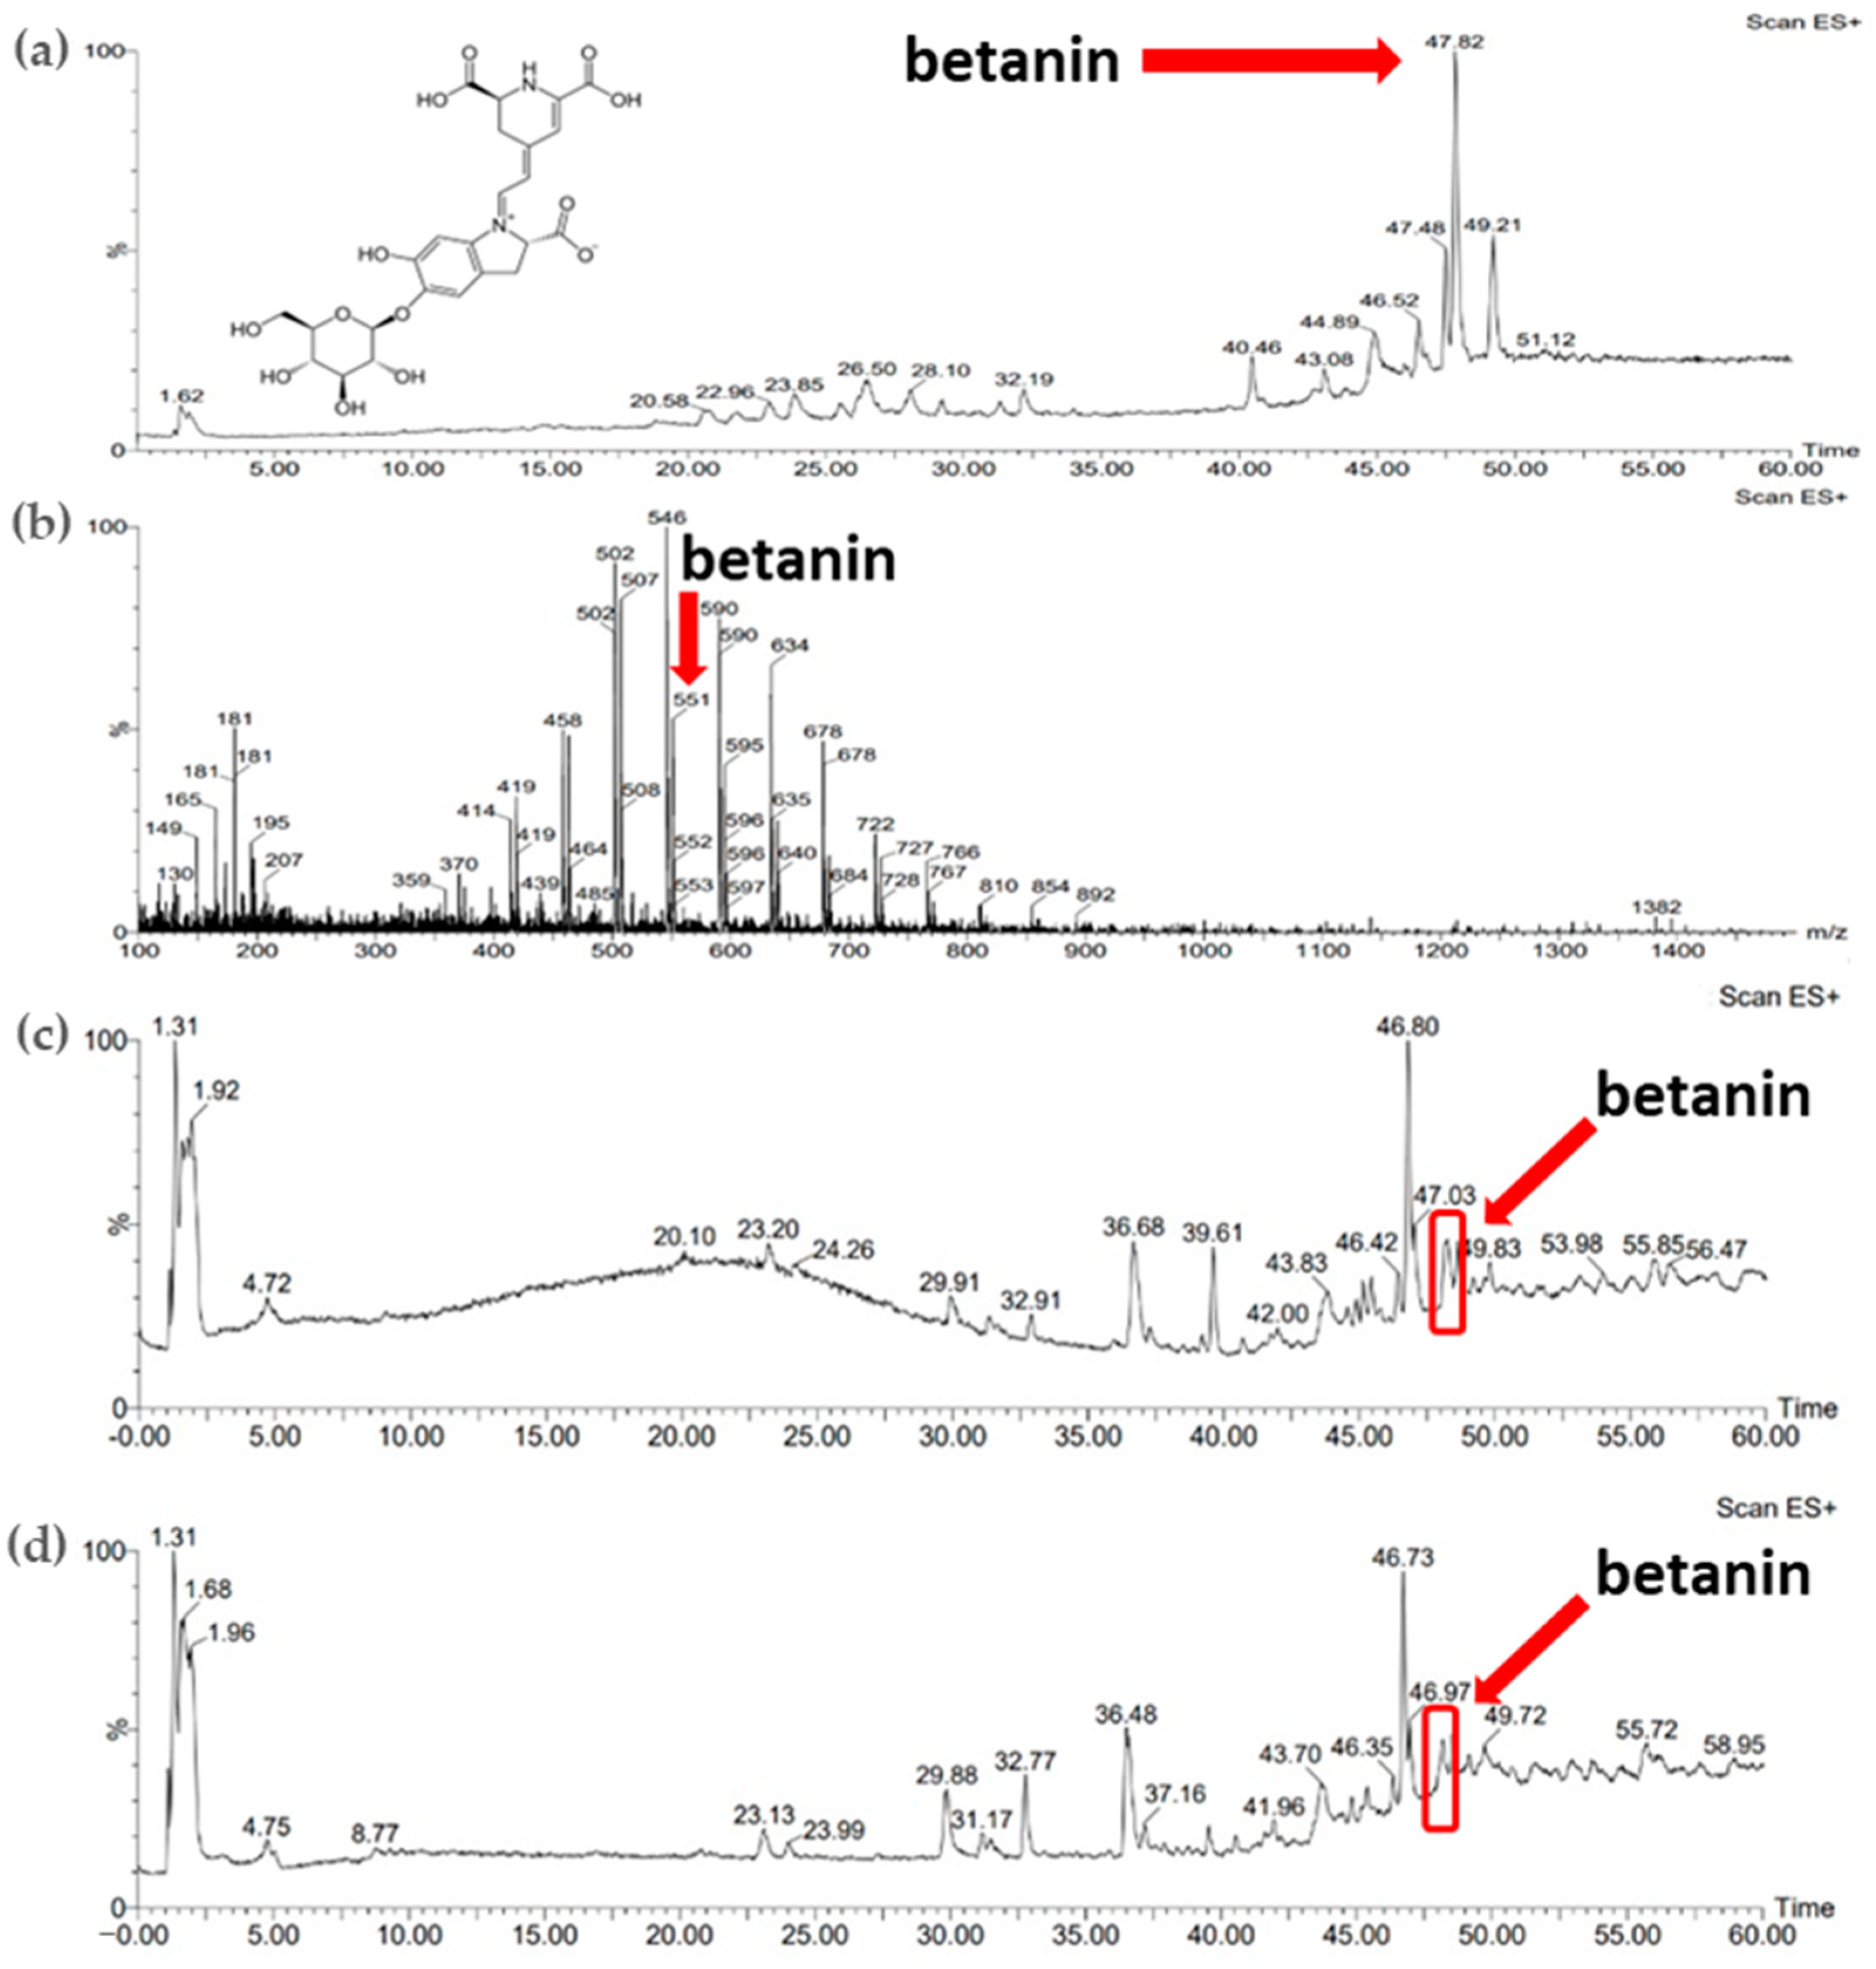
2.1.3. LC–MS Analysis
2.1.4. GC–MS Analysis
2.1.5. FTIR-ATR Analysis
2.1.6. Antioxidant Activity Test
2.2. Microneedles
2.2.1. Silicone Mold Preparation
- Patch size: 8 mm × 8 mm;
- Array size: 10 × 10 needles;
- Needle height: 1 mm;
- Needle base: 0.2 mm;
- Needle pitch (distance between needles): 0.5 mm.
2.2.2. Preparation of the Microneedle Patch
- Ultrasonic bath (37 kHz, 45 min);
- Shaker (300 rpm, 80 min);
- Manual stirring and ultrasonic bath (2 min; 37 kHz, 25 min);
- Manual stirring and shaker (2 min; 300 rpm, 85 min).
- Direct pouring into the mold;
- Sonication (2 min; 37 kHz);
- Shaker (5 min; 300 rpm);
- Freezing (three cycles of freezing at −20 °C for 30 min and thawing at room temperature of approximately 23 °C for 30 min; in total 3 h).
2.2.3. Stereoscopic Microscope
2.2.4. Release Profiles of Active Substance from Microneedles
3. Results
3.1. Extracts
3.1.1. UV-Vis
3.1.2. LC–MS
3.1.3. GC–MS
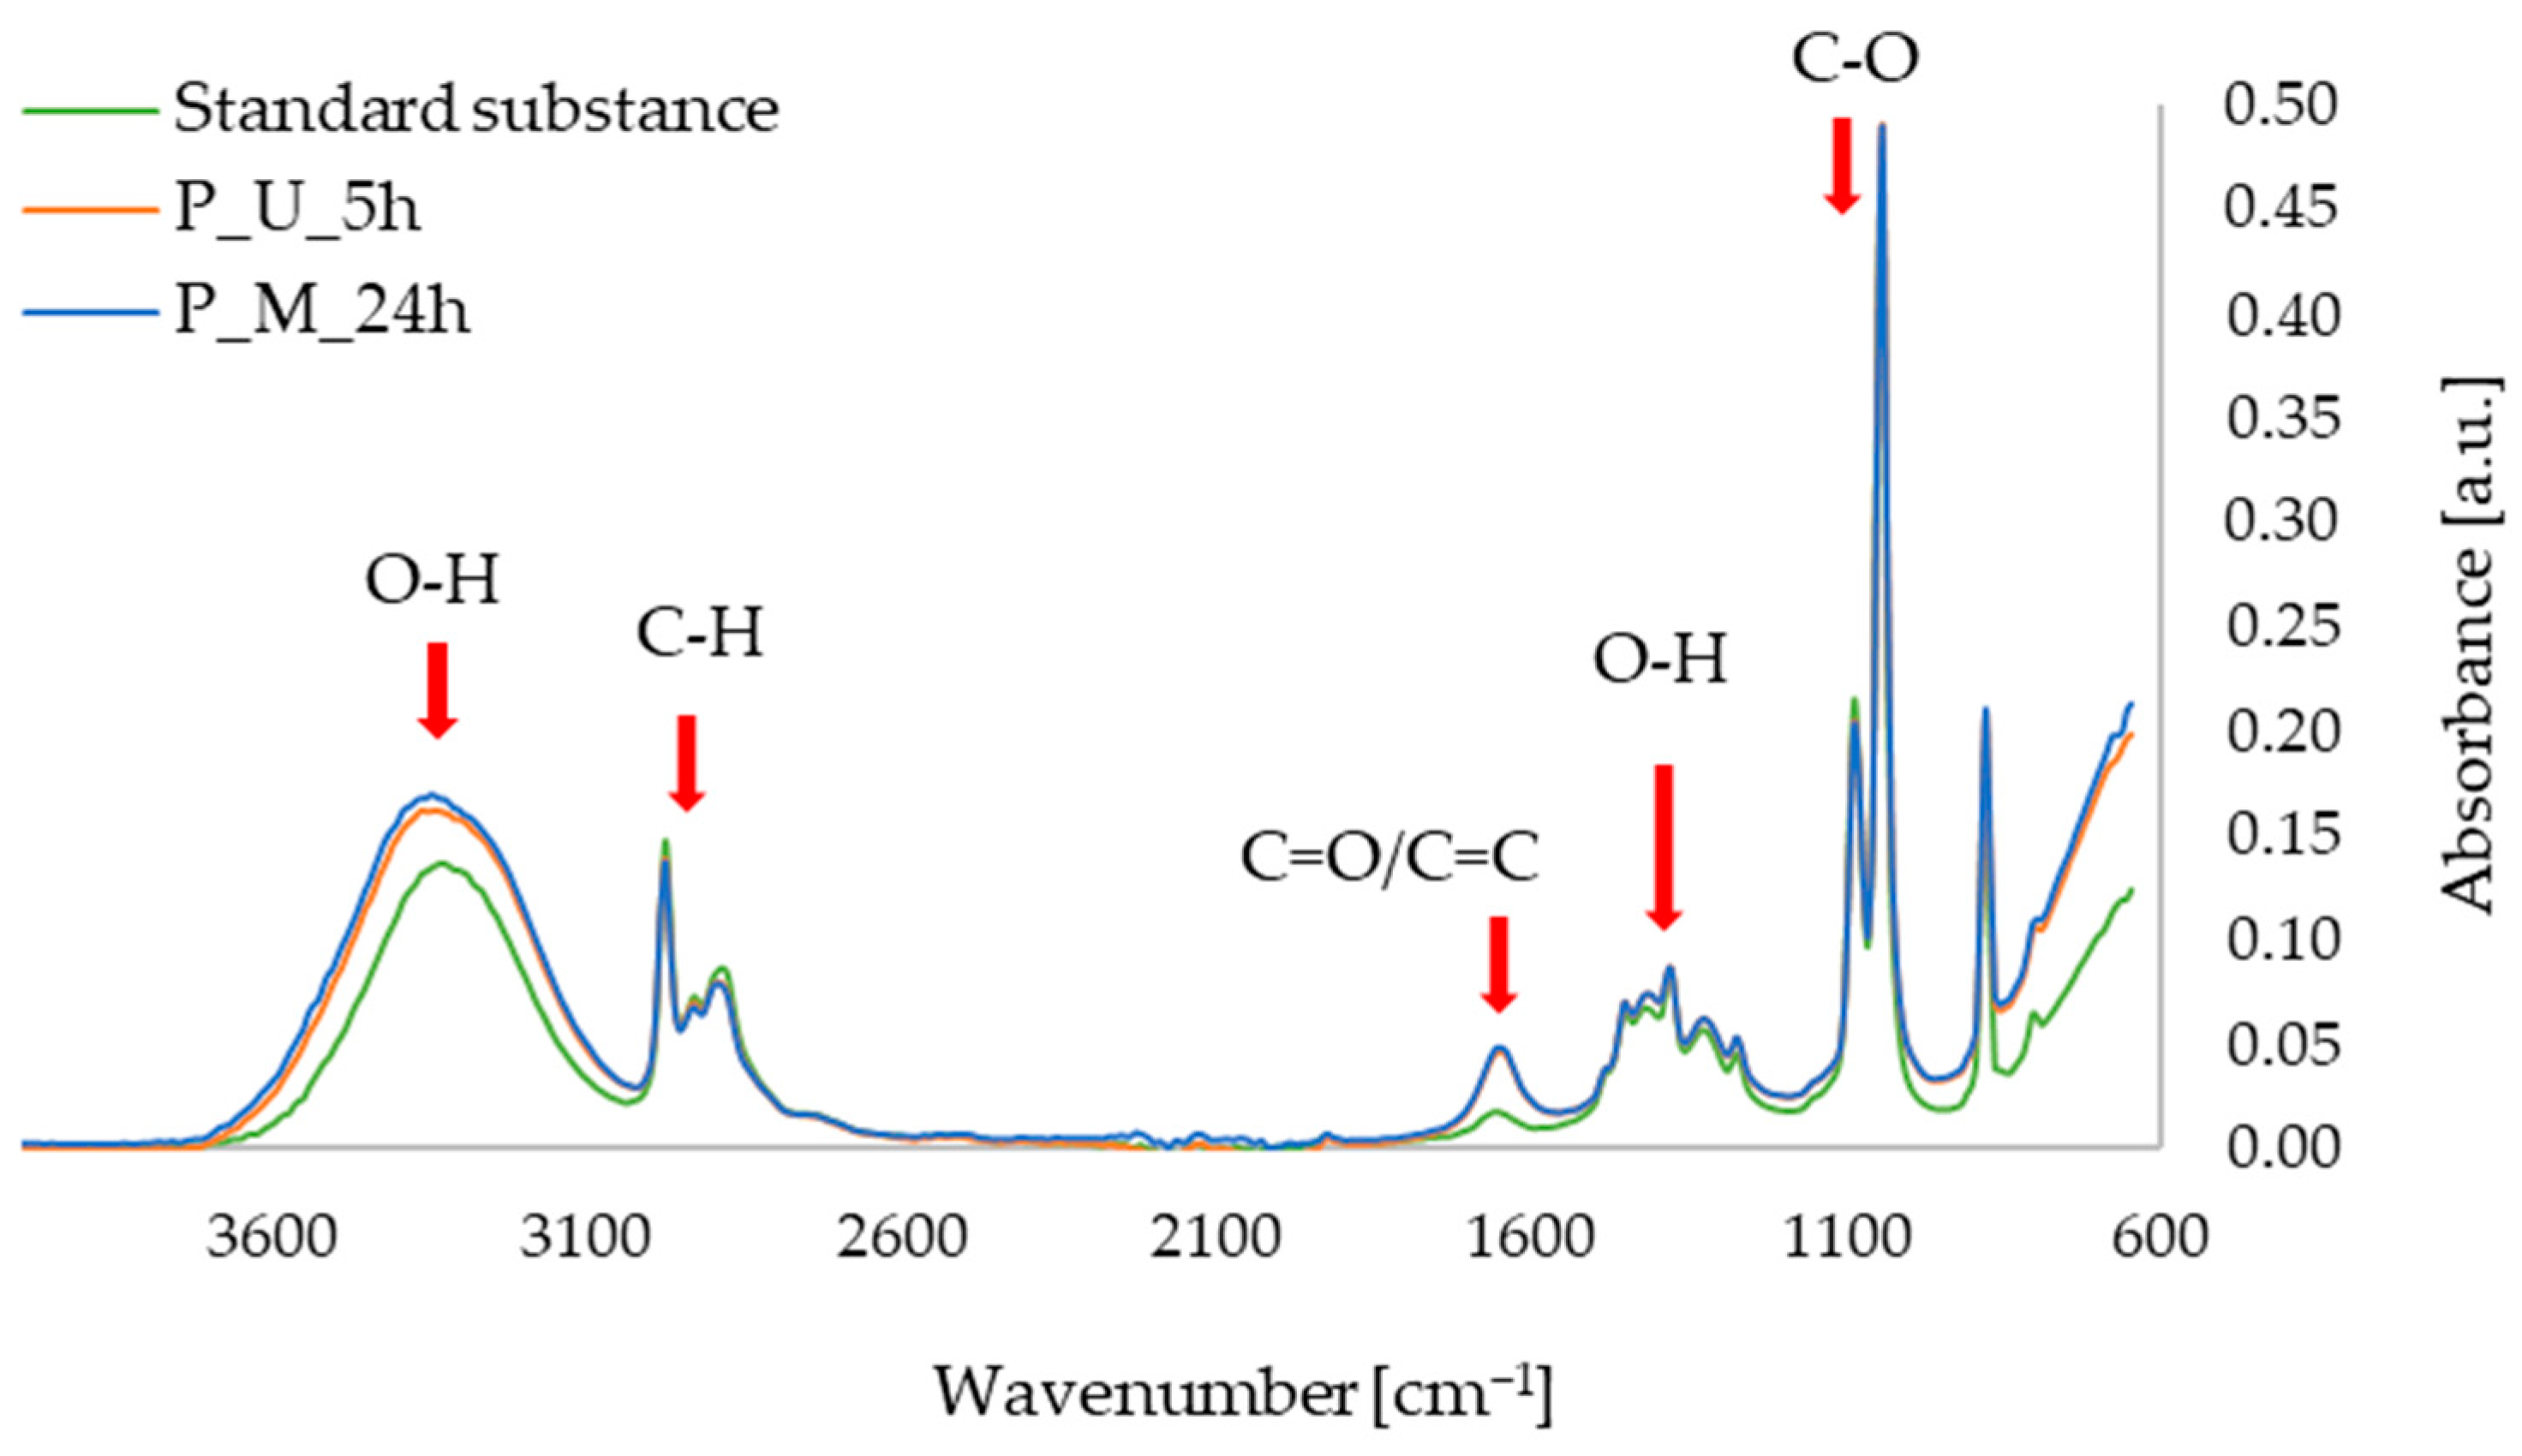
3.1.4. FTIR-ATR
3.1.5. Antioxidant Activity Test
3.2. Microneedles
3.2.1. Microneedles Patches
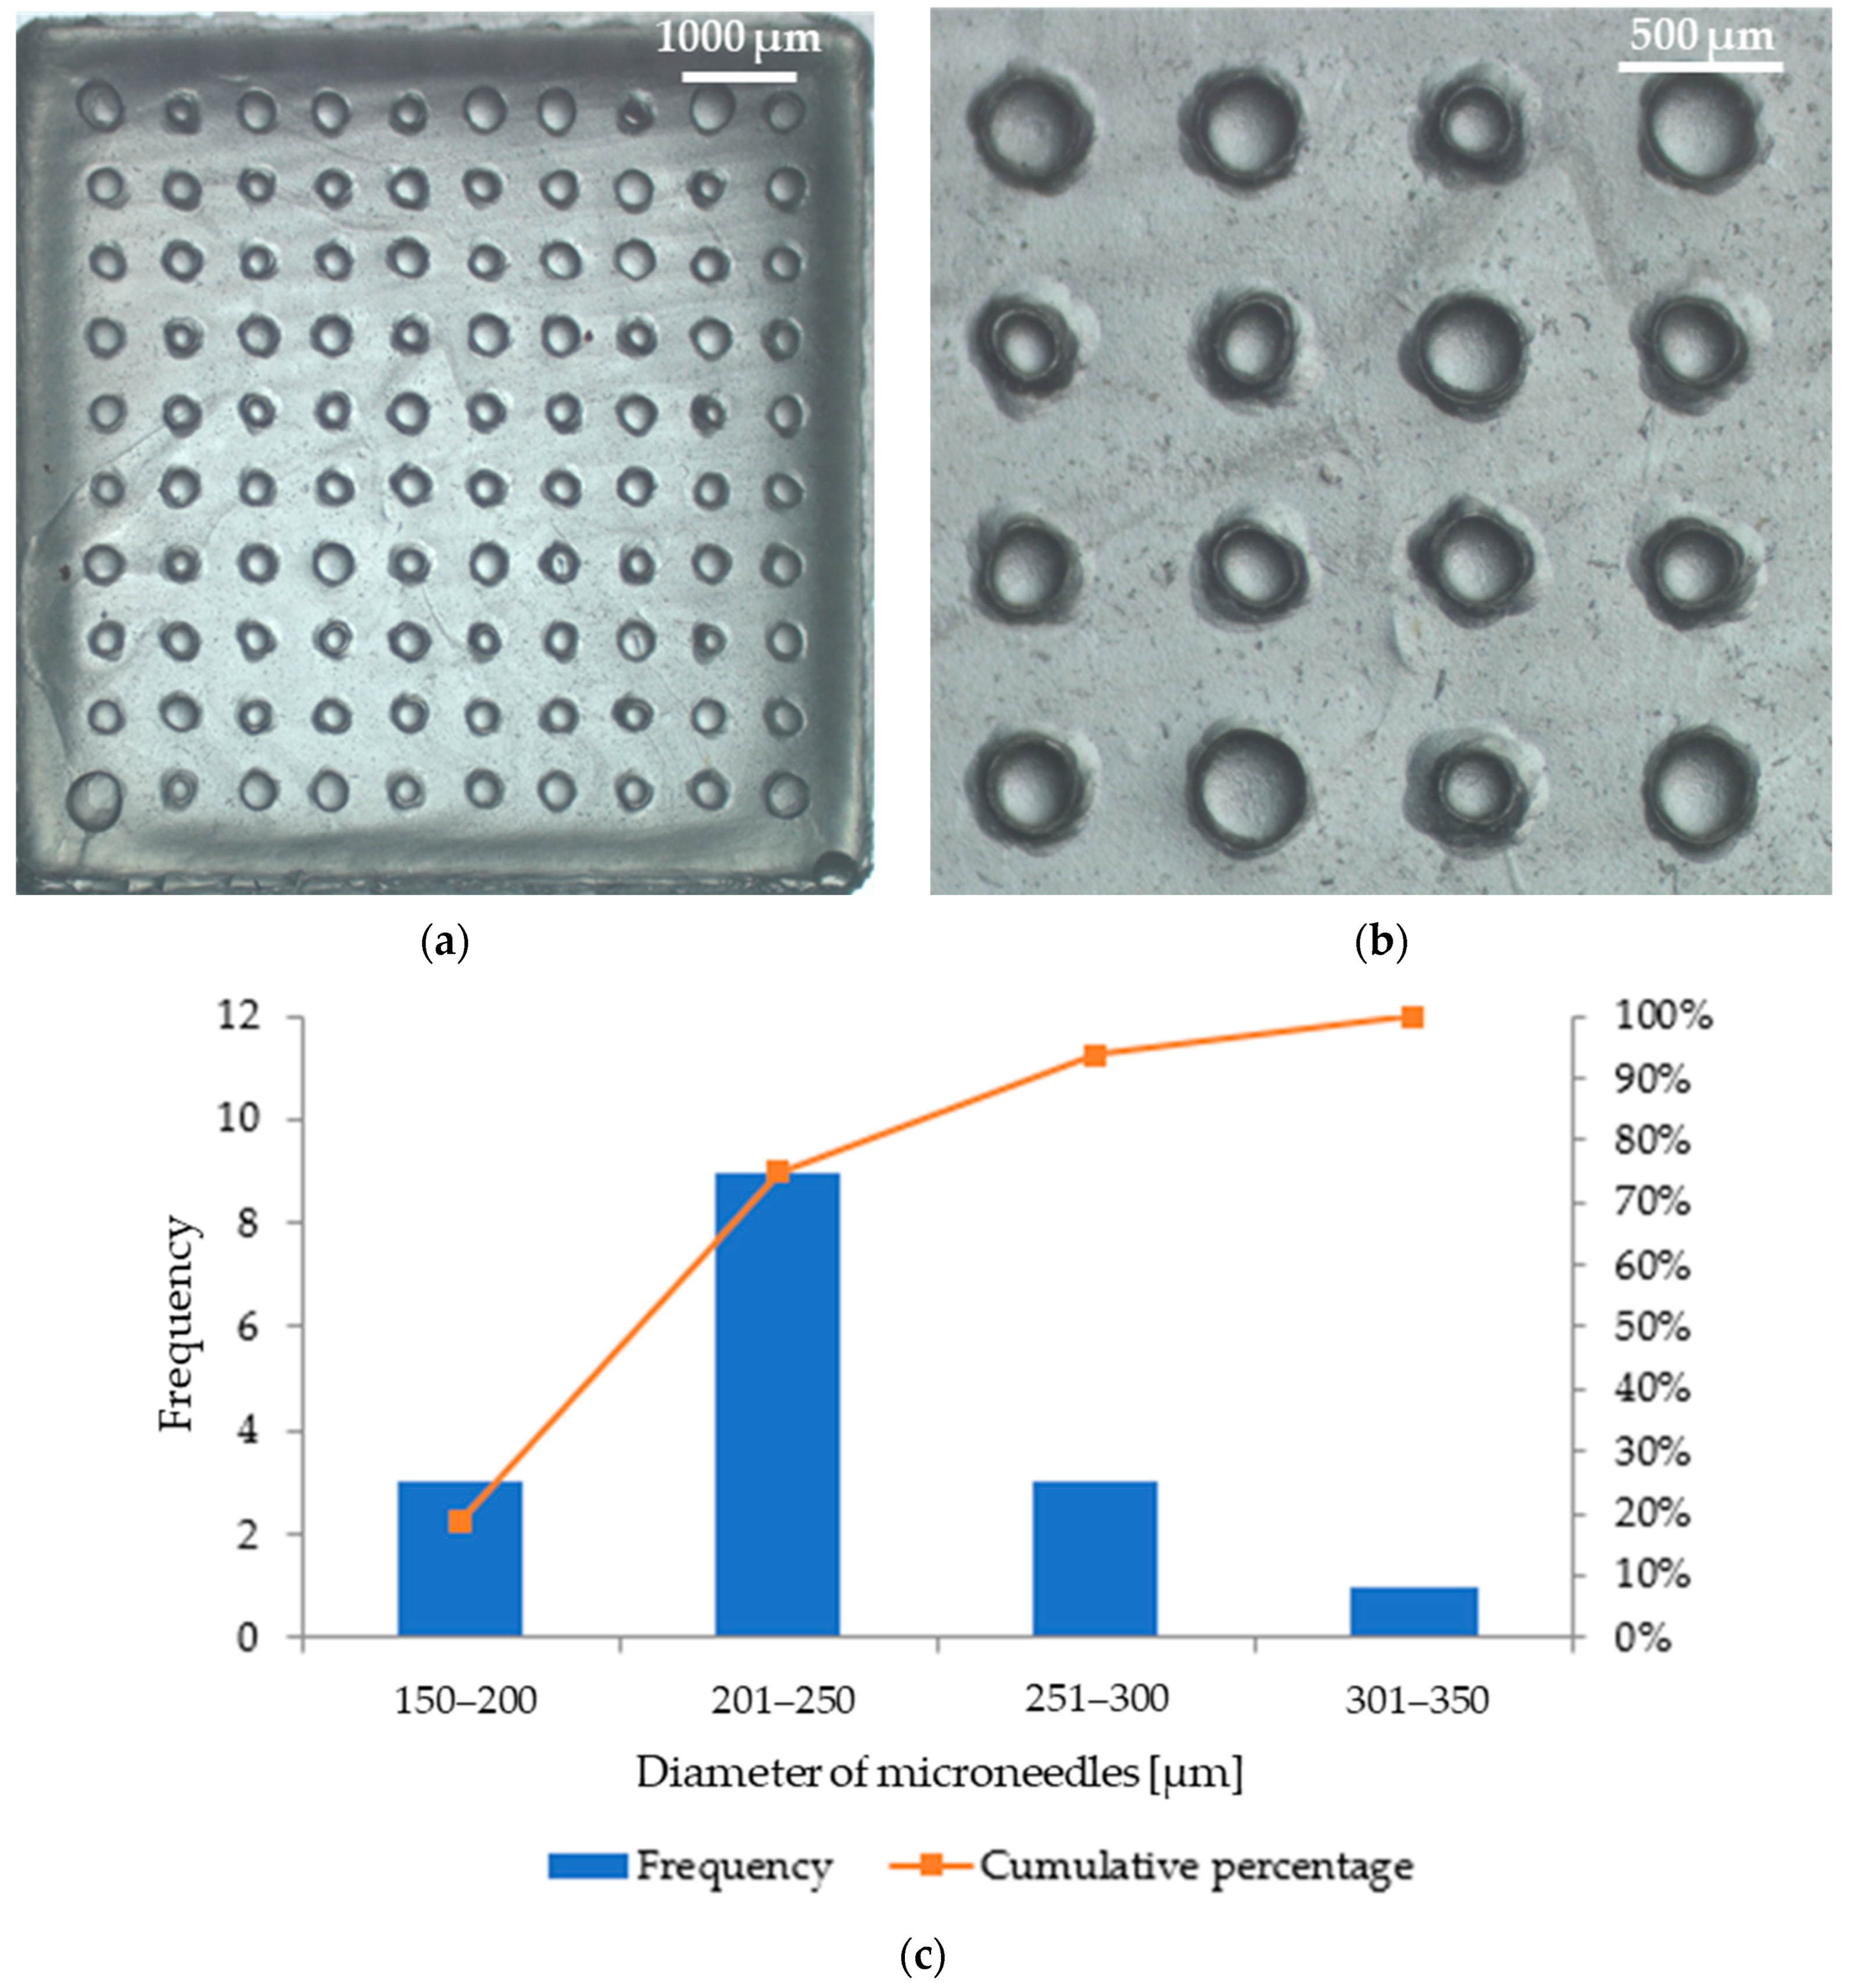
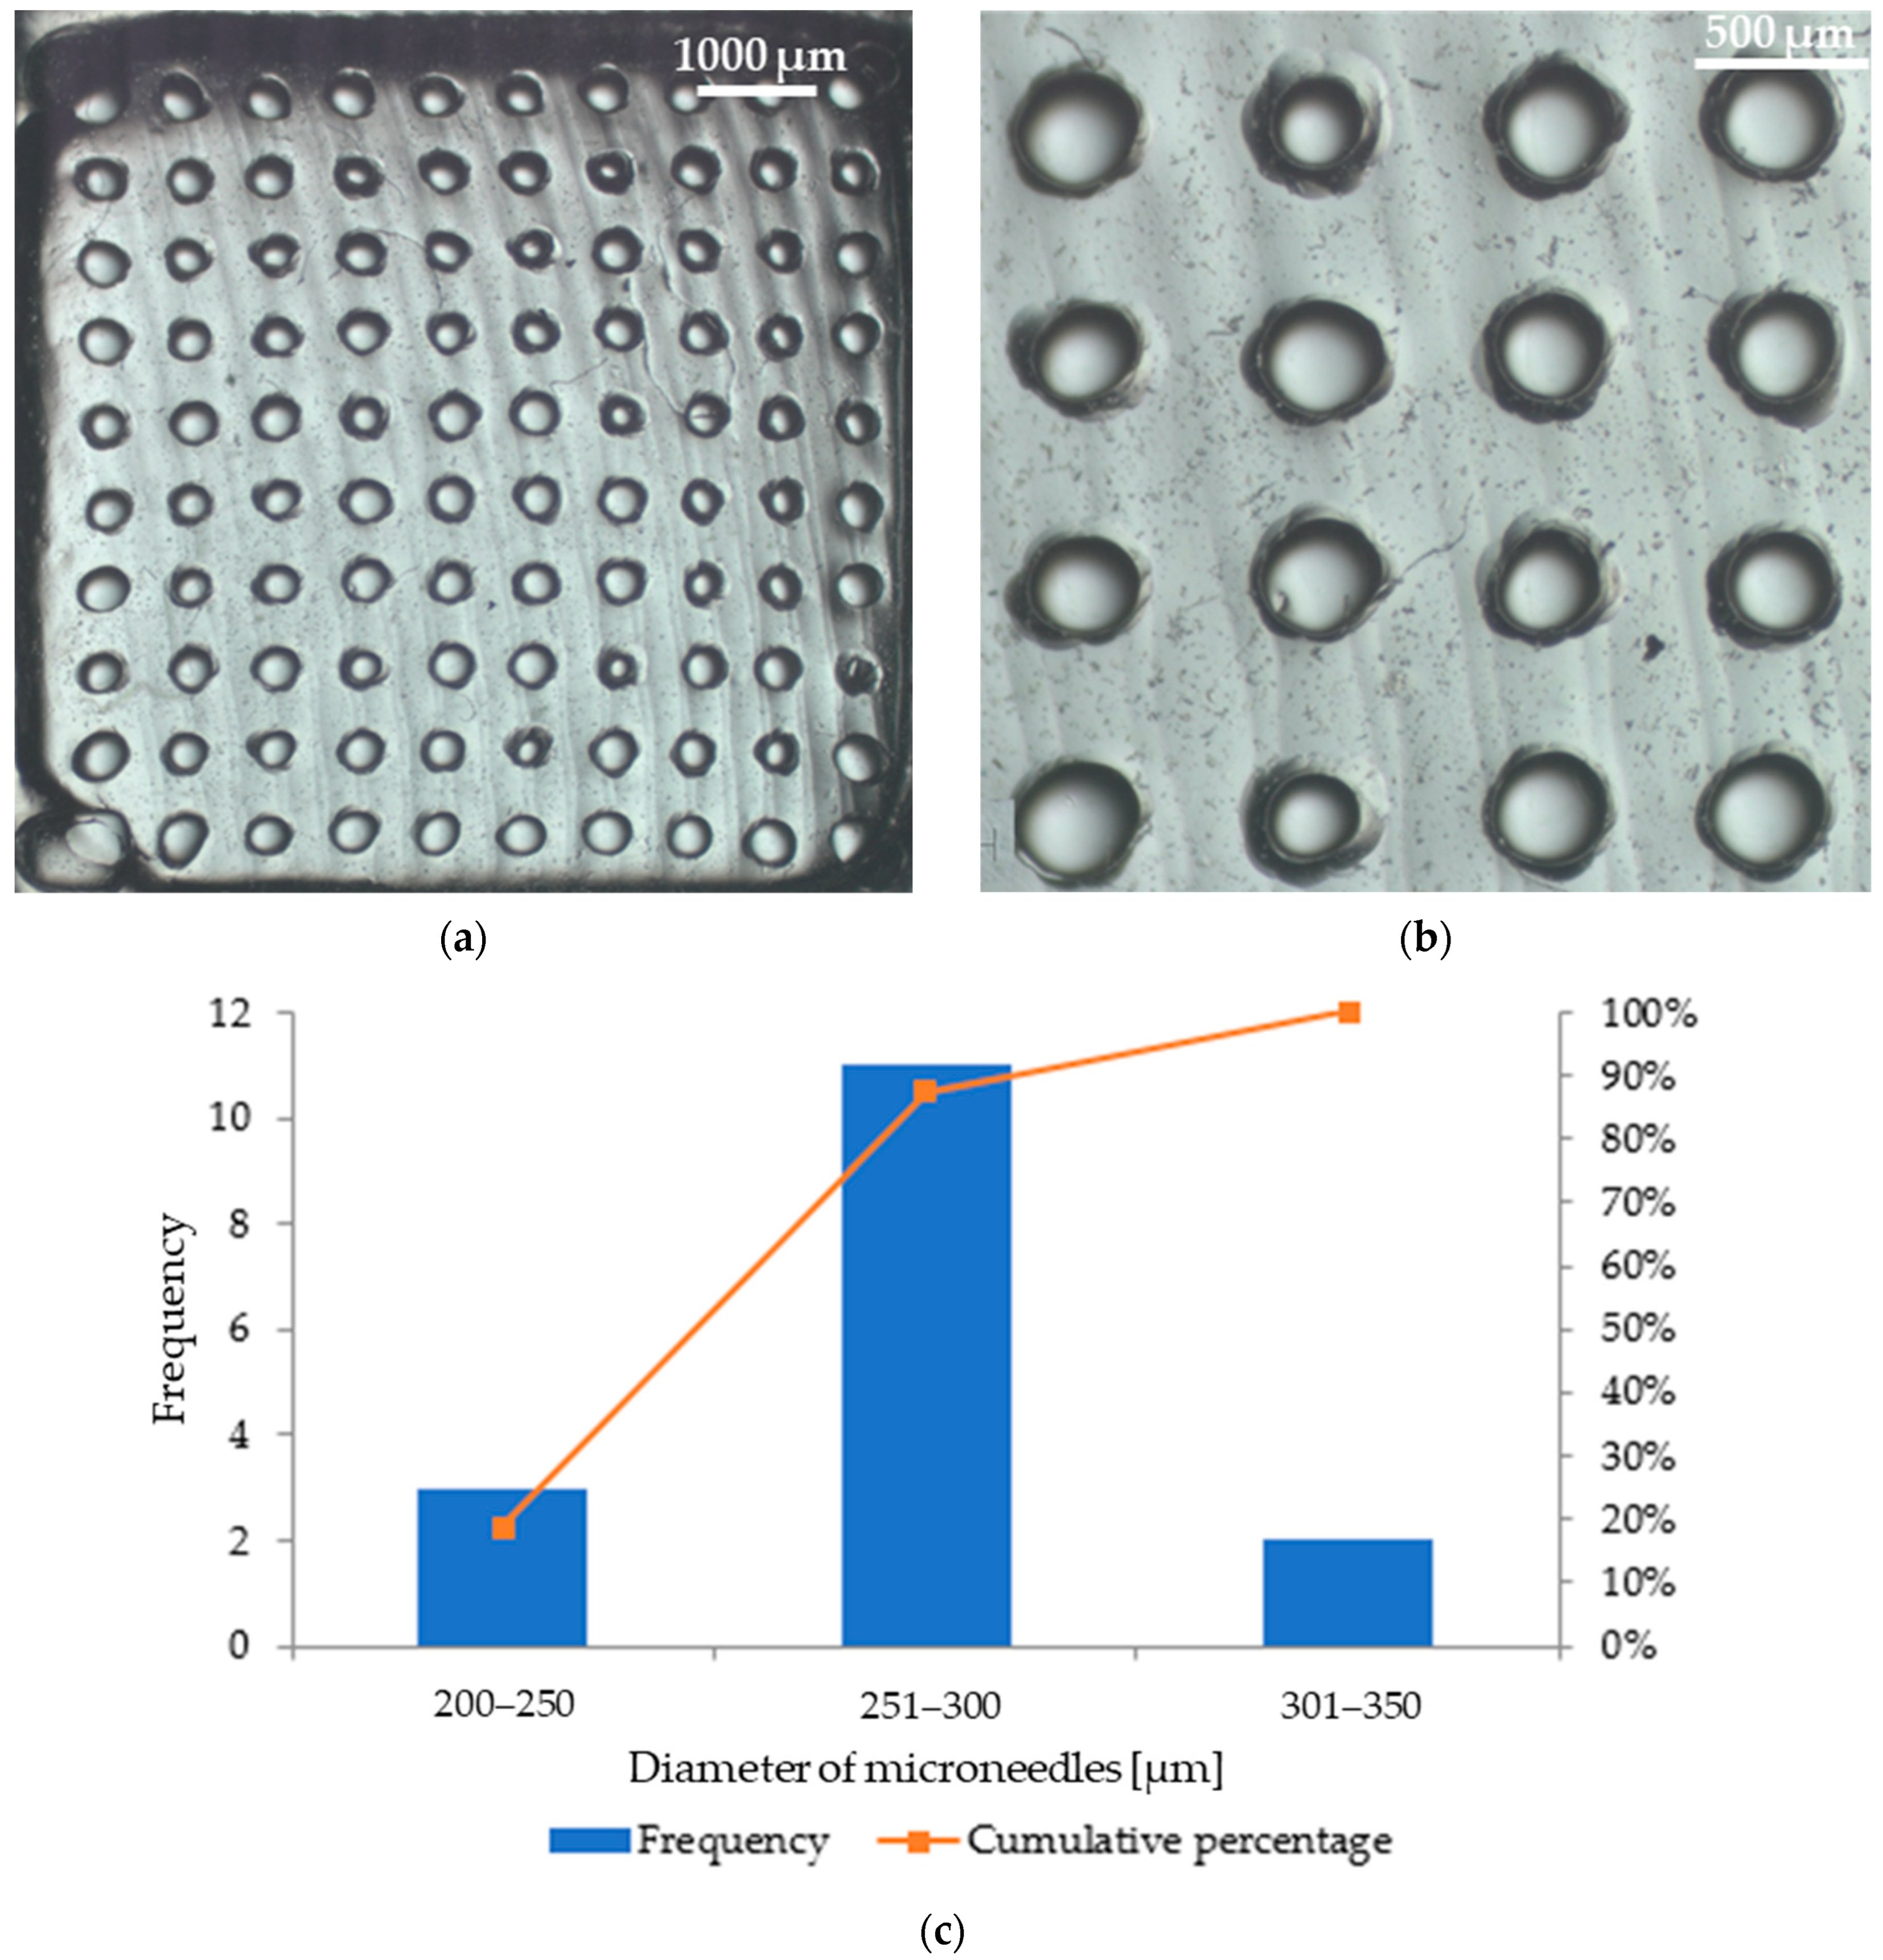
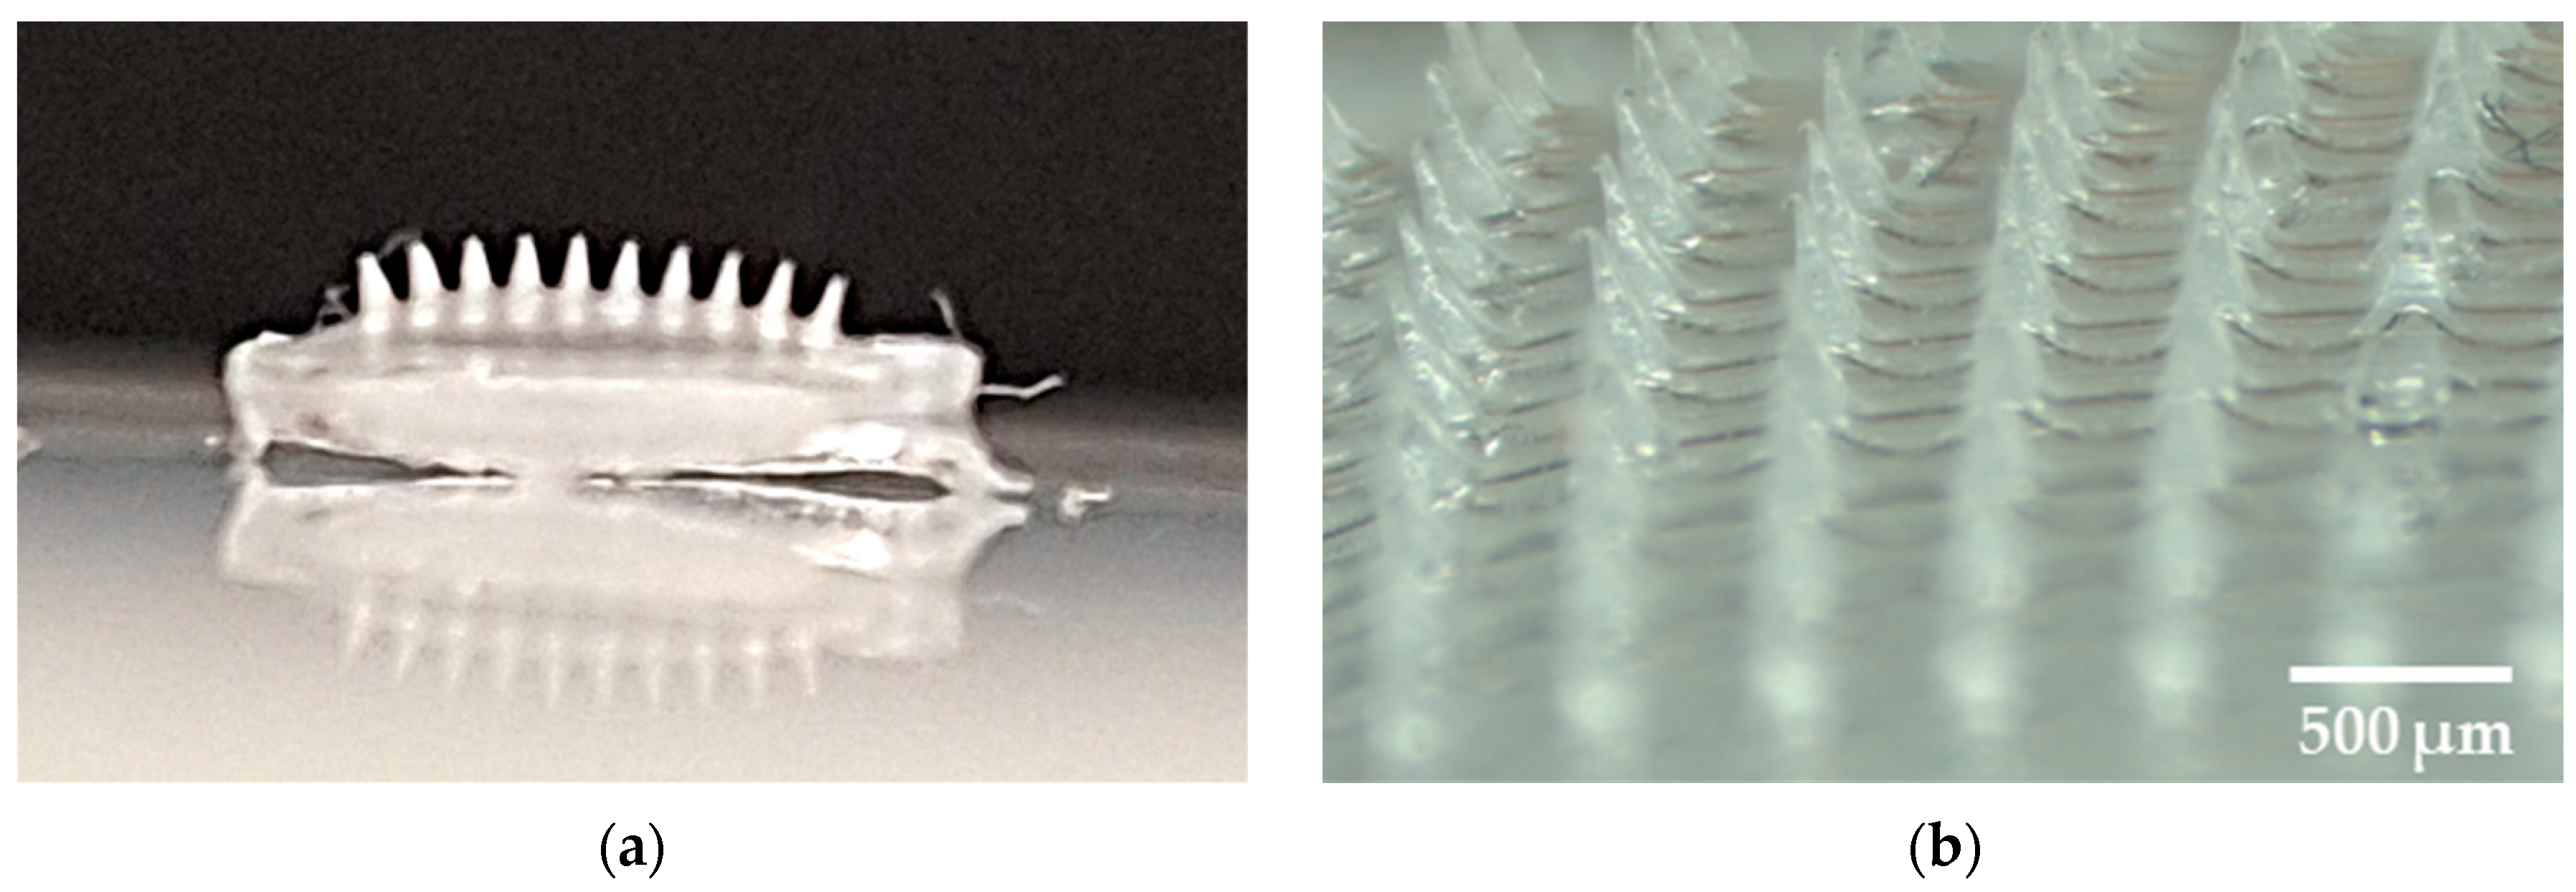
3.2.2. Stereoscopic Microscope
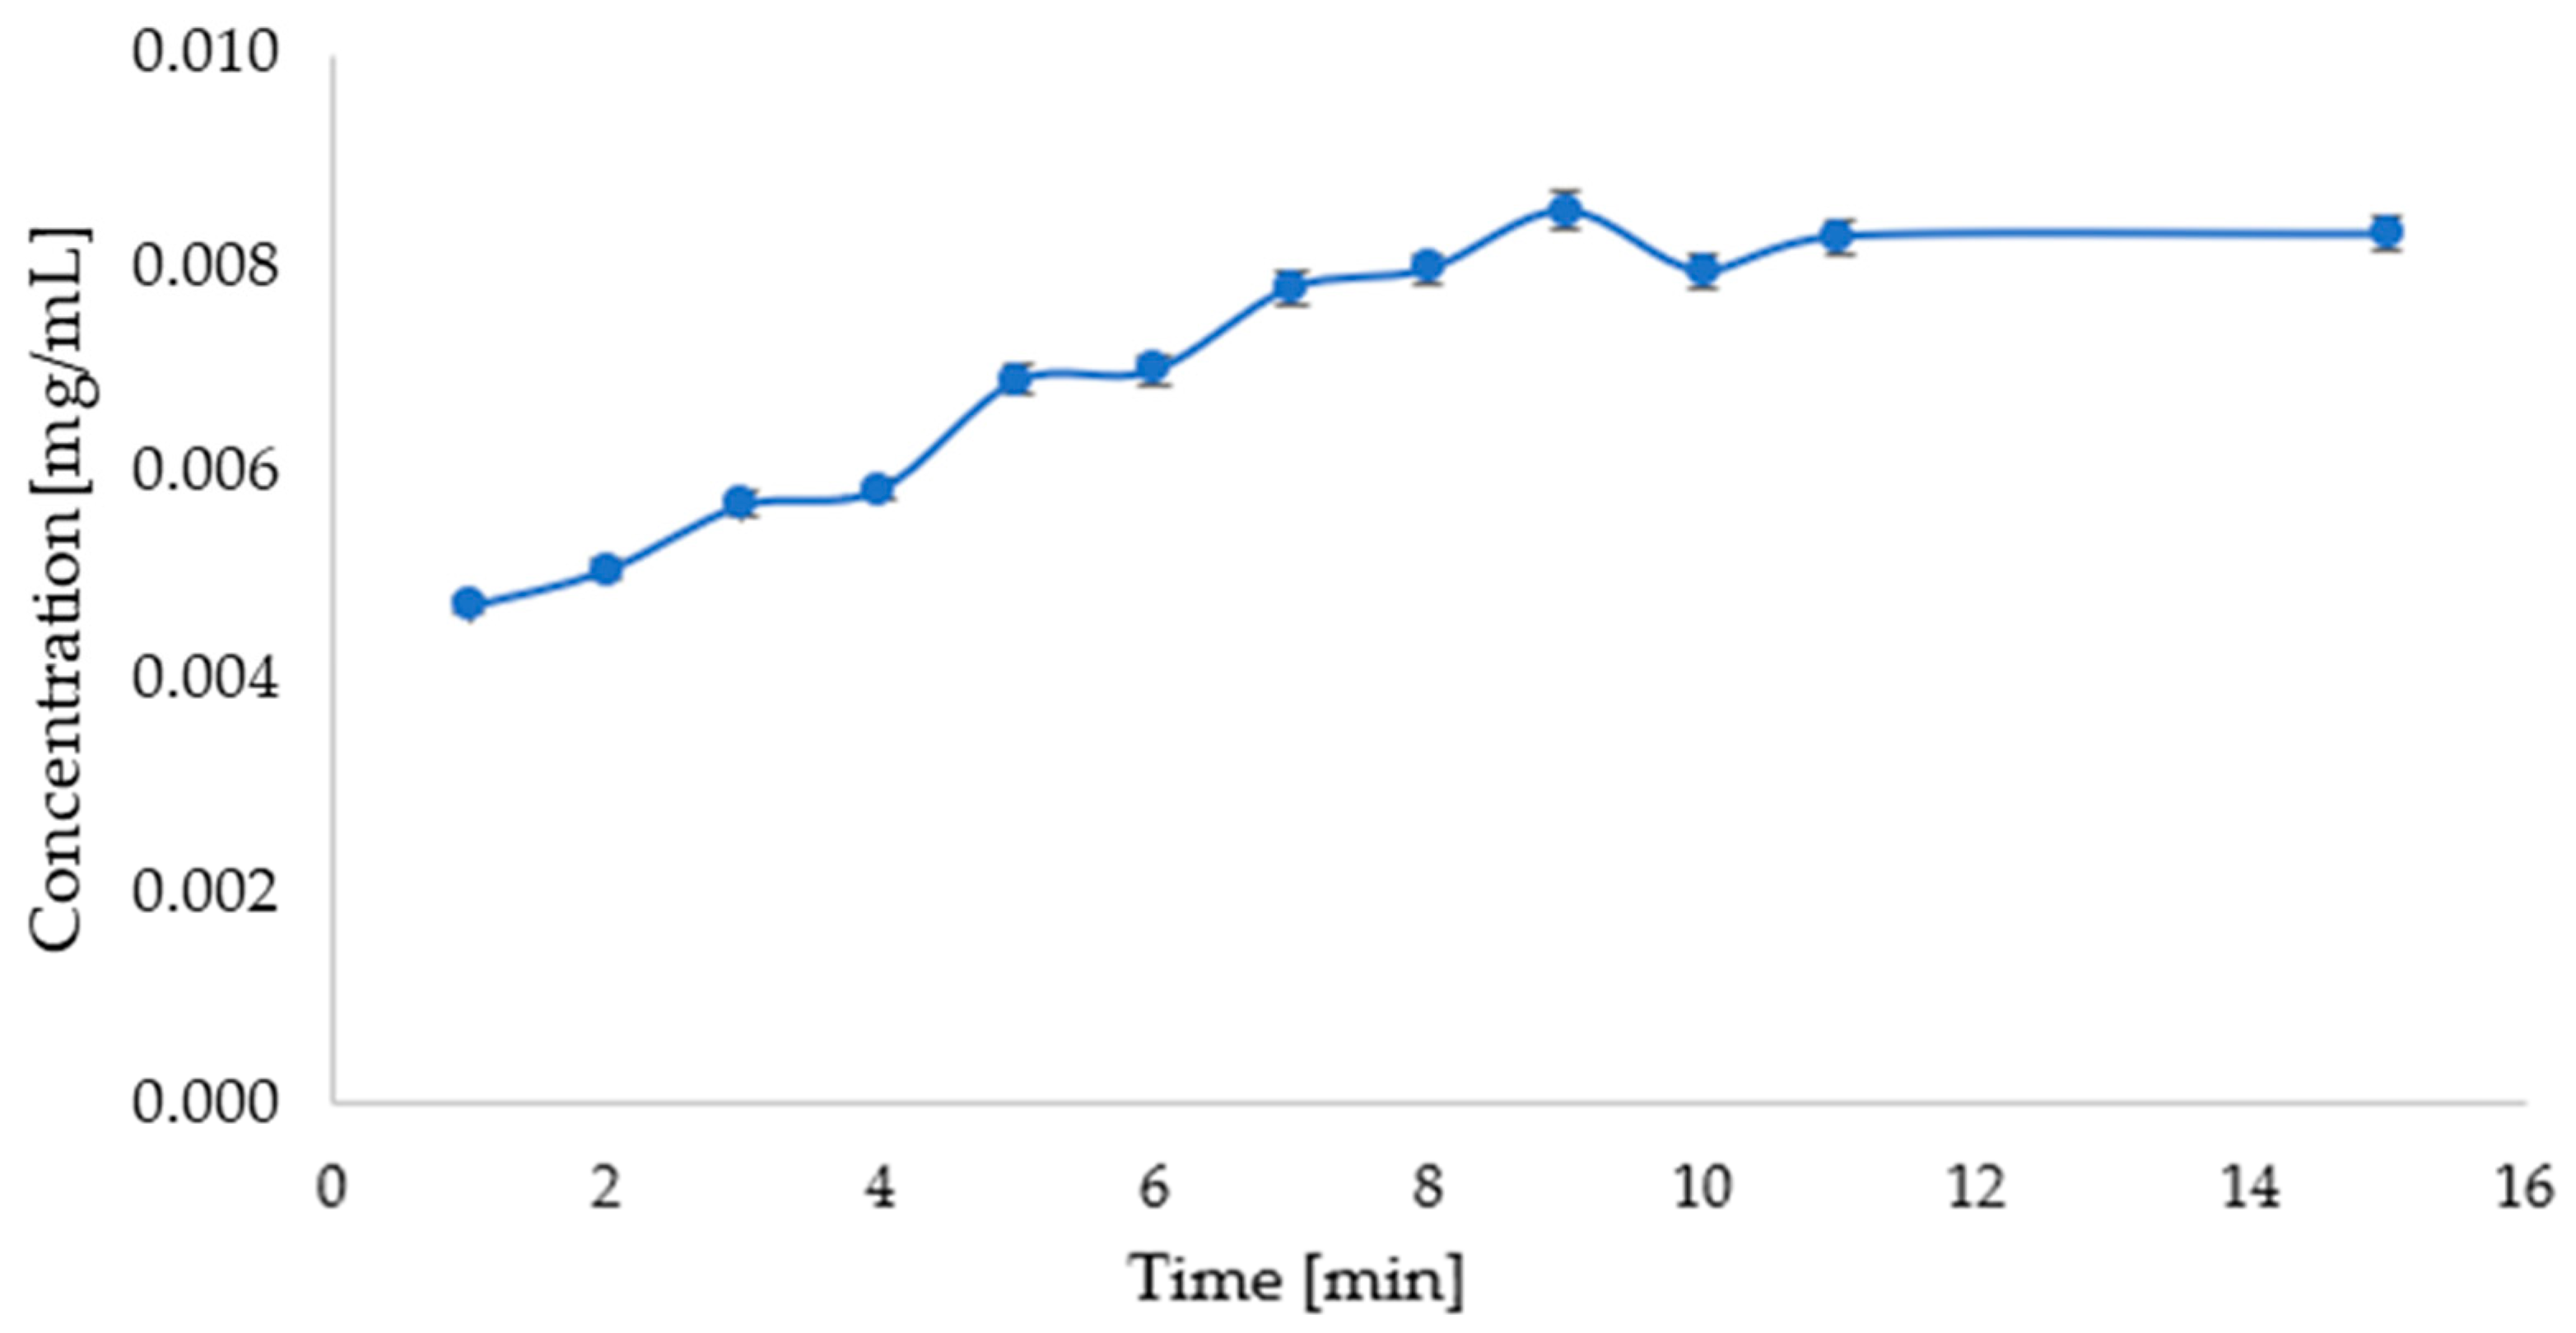
3.2.3. Release of the Active Substance from the Microneedle Patches
4. Discussion
4.1. Extracts
4.1.1. Red Beet
4.1.2. Parsley Leaves
4.2. Microneedles
5. Conclusions
Supplementary Materials
Author Contributions
Funding
Data Availability Statement
Conflicts of Interest
References
- Aldawood, F.K.; Andar, A.; Desai, S. A Comprehensive Review of Microneedles: Types, Materials, Processes, Characterizations and Applications. Polymers 2021, 13, 2815. [Google Scholar] [CrossRef] [PubMed]
- Tucak, A.; Sirbubalo, M.; Hindija, L.; Rahić, O.; Hadžiabdić, J.; Muhamedagić, K.; Čekić, A.; Vranić, E. Microneedles: Characteristics, Materials, Production Methods and Commercial Development. Micromachines 2020, 11, 961. [Google Scholar] [CrossRef] [PubMed]
- Singh, P.; Carrier, A.; Chen, Y.; Lin, S.; Wang, J.; Cui, S.; Zhang, X. Polymeric Microneedles for Controlled Transdermal Drug Delivery. J. Control. Release 2019, 315, 97–113. [Google Scholar] [CrossRef]
- Sartawi, Z.; Blackshields, C.; Faisal, W. Dissolving Microneedles: Applications and Growing Therapeutic Potential. J. Control. Release 2022, 348, 186–205. [Google Scholar] [CrossRef] [PubMed]
- Damiri, F.; Kommineni, N.; Ebhodaghe, S.O.; Bulusu, R.; Jyothi, V.G.S.S.; Sayed, A.A.; Awaji, A.A.; Germoush, M.O.; Al-Malky, H.S.; Nasrullah, M.Z.; et al. Microneedle-Based Natural Polysaccharide for Drug Delivery Systems (DDS): Progress and Challenges. Pharmaceuticals 2022, 15, 190. [Google Scholar] [CrossRef]
- Azmana, M.; Mahmood, S.; Hilles, A.R.; Mandal, U.K.; Saeed Al-Japairai, K.A.; Raman, S. Transdermal Drug Delivery System through Polymeric Microneedle: A Recent Update. J. Drug Deliv. Sci. Technol. 2020, 60, 101877. [Google Scholar] [CrossRef]
- Zhao, Z.; Chen, Y.; Shi, Y. Microneedles: A Potential Strategy in Transdermal Delivery and Application in the Management of Psoriasis. RSC Adv. 2020, 10, 14040–14049. [Google Scholar] [CrossRef] [PubMed]
- Chen, Z.; He, J.; Qi, J.; Zhu, Q.; Wu, W.; Lu, Y. Long-Acting Microneedles: A Progress Report of the State-of-the-Art Techniques. Drug Discov. Today 2020, 25, 1462–1468. [Google Scholar] [CrossRef]
- Hui, Z.; Wen, H.; Zhu, J.; Deng, H.; Jiang, X.; Ye, X.-Y.; Wang, L.; Xie, T.; Bai, R. Discovery of Plant-Derived Anti-Tumor Natural Products: Potential Leads for Anti-Tumor Drug Discovery. Bioorg Chem. 2024, 142, 106957. [Google Scholar] [CrossRef]
- Dziki, D.; Hassoon, W.H.; Biernacka, B.; Gawlik-Dziki, U. Dried and Powdered Leaves of Parsley as a Functional Additive to Wheat Bread. Appl. Sci. 2022, 12, 7930. [Google Scholar] [CrossRef]
- Czyżowska, A.; Siemianowska, K.; Śniadowska, M.; Nowak, A. Bioactive Compounds and Microbial Quality of Stored Fermented Red Beetroots and Red Beetroot Juice. Pol. J. Food Nutr. Sci. 2020, 70, 35–44. [Google Scholar] [CrossRef]
- Fu, Y.; Shi, J.; Xie, S.-Y.; Zhang, T.-Y.; Soladoye, O.P.; Aluko, R.E. Red Beetroot Betalains: Perspectives on Extraction, Processing, and Potential Health Benefits. J. Agric. Food Chem. 2020, 68, 11595–11611. [Google Scholar] [CrossRef] [PubMed]
- Eyshi, S.; Ghareaghajlou, N.; Afshar Mogaddam, M.R.; Ghasempour, Z. Red Beet Betalains Extraction Process: A Comprehensive Review of Methods, Applications, and Physicochemical Properties. Food Sci. Nutr. 2024, 12, 8540–8558. [Google Scholar] [CrossRef]
- Hadipour, E.; Taleghani, A.; Tayarani-Najaran, N.; Tayarani-Najaran, Z. Biological Effects of Red Beetroot and Betalains: A Review. Phytother. Res. 2020, 34, 1847–1867. [Google Scholar] [CrossRef]
- Lechner, J.F.; Stoner, G.D. Red Beetroot and Betalains as Cancer Chemopreventative Agents. Molecules 2019, 24, 1602. [Google Scholar] [CrossRef]
- Ebrahimi, P.; Bayram, I.; Lante, A.; Decker, E.A. Acid-Hydrolyzed Phenolic Extract of Parsley (Petroselinum crispum L.) Leaves Inhibits Lipid Oxidation in Soybean Oil-in-Water Emulsions. Food Res. Int. 2024, 187, 114452. [Google Scholar] [CrossRef] [PubMed]
- Mara de Menezes Epifanio, N.; Rykiel Iglesias Cavalcanti, L.; Falcão dos Santos, K.; Soares Coutinho Duarte, P.; Kachlicki, P.; Ożarowski, M.; Jorge Riger, C.; Siqueira de Almeida Chaves, D. Chemical Characterization and in Vivo Antioxidant Activity of Parsley (Petroselinum crispum) Aqueous Extract. Food Funct. 2020, 11, 5346–5356. [Google Scholar] [CrossRef]
- Moftah, R.; El-Geddawy, M.-A.; Hamdy, R. Phenolic Compound Profiles and Bioactive Properties of Parsley Leaves Extract and Seeds Oil. J. Food Dairy. Sci. 2024, 15, 7–11. [Google Scholar] [CrossRef]
- Janković, S.; Mitić, M.; Arsić, B.; Stankov-Jovanović, V. The Kinetic and Thermodynamic Studies of Solid-Liquid Extraction of Apigenin-Glycosides from Parsley (Petroselinum crispum). Sep. Sci. Technol. 2021, 56, 2253–2265. [Google Scholar] [CrossRef]
- Poureini, F.; Mohammadi, M.; Najafpour, G.D.; Nikzad, M. Comparative Study on the Extraction of Apigenin from Parsley Leaves (Petroselinum crispum L.) by Ultrasonic and Microwave Methods. Chem. Pap. 2020, 74, 3857–3871. [Google Scholar] [CrossRef]
- Brooks, Z.; Goswami, T.; Neidhard-Doll, A.; Goswami, T. Transdermal Drug Delivery Systems: Analysis of Adhesion Failure. J. Pharm. Biopharm. Res. 2022, 4, 256–270. [Google Scholar] [CrossRef]
- El-ghannam, G.; Moawad, M.; Abo-Elfadl, M.T.; Elfeky, S.A. Beetroot Extract@chitosan Nanocomposite as a Promising Approach towards Cancer Therapy. Int. J. Biol. Macromol. 2024, 261, 129700. [Google Scholar] [CrossRef] [PubMed]
- Silva Nieto, R.; Samaniego López, C.; Moretton, M.A.; Lizarraga, L.; Chiappetta, D.A.; Alaimo, A.; Pérez, O.E. Chitosan-Based Nanogels Designed for Betanin-Rich Beetroot Extract Transport: Physicochemical and Biological Aspects. Polymers 2023, 15, 3875. [Google Scholar] [CrossRef] [PubMed]
- Fadeel, D.A.; Fadel, M.; El-Kholy, A.I.; El-Rashedy, A.A.; Mohsen, E.; Ezzat, M.I.; Issa, M.Y. Nano-Liposomal Beetroot Phyto-Pigment in Photodynamic Therapy as a Prospective Green Approach for Cancer Management: In Vitro Evaluation and Molecular Dynamic Simulation. Pharmaceutics 2024, 16, 1038. [Google Scholar] [CrossRef]
- Amjadi, S.; Hamishehkar, H.; Ghorbani, M. A Novel Smart PEGylated Gelatin Nanoparticle for Co-Delivery of Doxorubicin and Betanin: A Strategy for Enhancing the Therapeutic Efficacy of Chemotherapy. Mater. Sci. Eng. C 2019, 97, 833–841. [Google Scholar] [CrossRef] [PubMed]
- El-Borady, O.M.; Ayat, M.S.; Shabrawy, M.A.; Millet, P. Green Synthesis of Gold Nanoparticles Using Parsley Leaves Extract and Their Applications as an Alternative Catalytic, Antioxidant, Anticancer, and Antibacterial Agents. Adv. Powder Technol. 2020, 31, 4390–4400. [Google Scholar] [CrossRef]
- Shetti, P.; Jalalpure, S.S.; Patil, A.S.; Kaur, K. Apigenin-Loaded Stealth Liposomes: Development and Pharmacokinetic Studies for Enhanced Plasma Retention of Drug in Cancer Therapy. Top. Catal. 2024, 67, 46–58. [Google Scholar] [CrossRef]
- Roy, K.; Sarkar, C.K.; Ghosh, C.K. Plant-Mediated Synthesis of Silver Nanoparticles Using Parsley (Petroselinum crispum) Leaf Extract: Spectral Analysis of the Particles and Antibacterial Study. Appl. Nanosci. 2015, 5, 945–951. [Google Scholar] [CrossRef]
- Xu, J.; Lai, H.; You, L.; Zhao, Z. Improvement of the Stability and Anti-AGEs Ability of Betanin through Its Encapsulation by Chitosan-TPP Coated Quaternary Ammonium-Functionalized Mesoporous Silica Nanoparticles. Int. J. Biol. Macromol. 2022, 222, 1388–1399. [Google Scholar] [CrossRef]
- Yang, R.; Hu, J.; Ding, J.; Chen, R.; Meng, D.; Li, K.; Guo, H.; Chen, H.; Zhang, Y. Ultrasound Assisted Fabrication of the Yeast Protein-Chitooligosaccharide-Betanin Composite for Stabilization of Betanin. Ultrason. Sonochem 2024, 104, 106823. [Google Scholar] [CrossRef] [PubMed]
- Mevada, S.; Patel, H.; Shukla, S. Simultaneous Equation Method for the Estimation of Gallic Acid and Apigenin by UV–Visible Spectrophotometry. Accredit. Qual. Assur. 2024, 29, 11–17. [Google Scholar] [CrossRef]
- Fiadorwu, J.; Subedi, K.; Todd, D.; Basti, M.M. Multipronged Approach to Profiling Metabolites in Beta Vulgaris L. Dried Pulp Extracts Using Chromatography, NMR and Other Spectroscopy Methods. Foods 2023, 12, 3510. [Google Scholar] [CrossRef] [PubMed]
- Craft, J.D.; Setzer, W.N. The Volatile Components of Parsley, Petroselinum crispum (Mill.) Fuss. Am. J. Essent. Oils Nat. Prod. 2017, 5, 27–32. [Google Scholar]
- Aztatzi-Rugerio, L.; Granados-Balbuena, S.Y.; Zainos-Cuapio, Y.; Ocaranza-Sánchez, E.; Rojas-López, M. Analysis of the Degradation of Betanin Obtained from Beetroot Using Fourier Transform Infrared Spectroscopy. J. Food Sci. Technol. 2019, 56, 3677–3686. [Google Scholar] [CrossRef]
- Barkociová, M.; Tóth, J.; Sutor, K.; Drobnicka, N.; Wybraniec, S.; Dudík, B.; Bilková, A.; Czigle, S. Betalains in Edible Fruits of Three Cactaceae Taxa—Epiphyllum, Hylocereus, and Opuntia—Their LC-MS/MS and FTIR Identification and Biological Activities Evaluation. Plants 2021, 10, 2669. [Google Scholar] [CrossRef] [PubMed]
- Mocanu, G.-D.; Chirilă, A.C.; Vasile, A.M.; Andronoiu, D.G.; Nistor, O.-V.; Barbu, V.; Stănciuc, N. Tailoring the Functional Potential of Red Beet Purées by Inoculation with Lactic Acid Bacteria and Drying. Foods 2020, 9, 1611. [Google Scholar] [CrossRef] [PubMed]
- Amini, S.M.; Mohammadi, E.; Askarian-Amiri, S.; Azizi, Y.; Shakeri-Zadeh, A.; Neshastehriz, A. Investigating the in Vitro Photothermal Effect of Green Synthesized Apigenin-coated Gold Nanoparticle on Colorectal Carcinoma. IET Nanobiotechnol. 2021, 15, 329–337. [Google Scholar] [CrossRef]
- Aldawsari, M.F.; Ahmed, M.M.; Fatima, F.; Anwer, M.K.; Katakam, P.; Khan, A. Development and Characterization of Calcium-Alginate Beads of Apigenin: In Vitro Antitumor, Antibacterial, and Antioxidant Activities. Mar. Drugs 2021, 19, 467. [Google Scholar] [CrossRef]
- Wybraniec, S. Formation of Decarboxylated Betacyanins in Heated Purified Betacyanin Fractions from Red Beet Root (Beta vulgaris L.) Monitored by LC−MS/MS. J. Agric. Food Chem. 2005, 53, 3483–3487. [Google Scholar] [CrossRef]
- Wybraniec, S.; Mizrahi, Y. Generation of Decarboxylated and Dehydrogenated Betacyanins in Thermally Treated Purified Fruit Extract from Purple Pitaya (Hylocereus polyrhizus) Monitored by LC-MS/MS. J. Agric. Food Chem. 2005, 53, 6704–6712. [Google Scholar] [CrossRef] [PubMed]
- da Silva, D.V.T.; Baião, D.d.S.; Ferreira, V.F.; Paschoalin, V.M.F. Betanin as a Multipath Oxidative Stress and Inflammation Modulator: A Beetroot Pigment with Protective Effects on Cardiovascular Disease Pathogenesis. Crit. Rev. Food Sci. Nutr. 2022, 62, 539–554. [Google Scholar] [CrossRef] [PubMed]
- Shen, L.; Pang, S.; Zhong, M.; Sun, Y.; Qayum, A.; Liu, Y.; Rashid, A.; Xu, B.; Liang, Q.; Ma, H.; et al. A Comprehensive Review of Ultrasonic Assisted Extraction (UAE) for Bioactive Components: Principles, Advantages, Equipment, and Combined Technologies. Ultrason. Sonochem 2023, 101, 106646. [Google Scholar] [CrossRef] [PubMed]
- Fernando, G.S.N.; Wood, K.; Papaioannou, E.H.; Marshall, L.J.; Sergeeva, N.N.; Boesch, C. Application of an Ultrasound-Assisted Extraction Method to Recover Betalains and Polyphenols from Red Beetroot Waste. ACS Sustain. Chem. Eng. 2021, 9, 8736–8747. [Google Scholar] [CrossRef]
- Paulauskienė, A.; Šileikienė, D.; Karklelienė, R.; Tarasevičienė, Ž.; Česonienė, L. Quality Research of the Beetroots (Beta vulgaris L., ssp. vulgaris var. conditiva Alef.) Grown in Different Farming Systems Applying Chemical and Holistic Research Methods. Sustainability 2023, 15, 7102. [Google Scholar] [CrossRef]
- Staropoli, A.; Vassetti, A.; Salvatore, M.M.; Andolfi, A.; Prigigallo, M.I.; Bubici, G.; Scagliola, M.; Salerno, P.; Vinale, F. Improvement of Nutraceutical Value of Parsley Leaves (Petroselinum crispum) upon Field Applications of Beneficial Microorganisms. Horticulturae 2021, 7, 281. [Google Scholar] [CrossRef]
- Yılmaz, B.; Çilingir Tütüncü, A.; Saka, A.K.; Demirkaya, S.; Yılmaz, H.; Ozer, H. Effects of Different Nutrient Inputs in Organic Parsley Cultivation. Biol. Agric. Hortic. 2024, 40, 161–172. [Google Scholar] [CrossRef]
- de los Ángeles Proz, M.; da Silva, M.A.S.; Rodrigues, E.; Bender, R.J.; de Oliveira Rios, A. Effects of Indoor, Greenhouse, and Field Cultivation on Bioactive Compounds from Parsley and Basil. J. Sci. Food Agric. 2021, 101, 6320–6330. [Google Scholar] [CrossRef]
- Oprescu, E.-E.; Enascuta, C.-E.; Radu, E.; Ciltea-Udrescu, M.; Lavric, V. Does the Ultrasonic Field Improve the Extraction Productivity Compared to Classical Methods—Maceration and Reflux Distillation? Chem. Eng. Process. Process Intensif. 2022, 179, 109082. [Google Scholar] [CrossRef]


| Compound | Retention Time [min] | M_5H | M_24H | U_5H |
|---|---|---|---|---|
| Pyrimidine | 2.470 | s | + | + |
| DL-Arabinose | 3.421 | + | + | + |
| 1H-Imidazole, 4,5-dihydro-2-methyl | 4.970 | + | + | + |
| DL-Pantolactone | 6.509 | + | + | + |
| Maltol | 6.852 | s | + | + |
| Lysidine | 7.411 | s | + | + |
| Pyranone | 9.030 | + | + | + |
| 5-Hydroxymethylfurfural | 12.450 | − | + | + |
| Butanoic acid | 12.807 | s | + | + |
| Heptanoic acid | 14.430 | s | + | + |
| 2-Methoxy-4-vinylphenol | 15.550 | − | + | + |
| Decanedioic acid | 18.027 | − | + | + |
| Sucrose | 21.734 | + | + | + |
| 7,9-Di-tert-butyl-1-oxaspiro(4,5)deca-6,9-diene-2,8-dione | 47.373 | + | + | + |
| n-Hexadecanoic acid | 50.577 | + | + | + |
| 9-Octadecenamide, (Z) | 52.603 | + | - | + |
| Compound | Retention Time [min] | M_5H | M_24H | U_5H |
|---|---|---|---|---|
| Glyceraldehyde | 2.391 | + | + | s |
| Butanoic acid | 2.856 | + | + | s |
| 1,2,3,4-Butanetetrol, [S-(R,R)] | 3.099 | + | + | s |
| 1,2-Cyclopentanedione | 3.562 | + | + | + |
| α-Pinene | 3.669 | s | s | + |
| Glycerin | 4.235 | + | + | - |
| β-Myrcene | 4.561 | + | + | + |
| β-Phellandrene | 5.635 | + | + | + |
| Maltol | 6.847 | + | + | − |
| p-Cymenene | 7.276 | + | + | + |
| Ethyl hydrogen malonate | 7.465 | + | + | s |
| p-Mentha-1,5,8-triene | 7.977 | + | + | + |
| Pyranone | 9.028 | + | + | s |
| 2-Naphthol, 1,2,3,4,4a,5,6,7-octahydro-4a-methyl | 10.729 | + | + | + |
| 1-Deoxy-d-arabitol | 11.026 | + | + | + |
| 8,9-Dehydrothymol | 11.666 | + | + | + |
| trans-p-mentha-1(7),8-dien-2-ol | 12.645 | − | + | − |
| 1,2,3-Propanetriol, 1-acetate | 12.792 | + | + | s |
| (+)-Diethyl L-tartrate | 12.986 | + | + | s |
| Pentanoic acid | 13.552 | + | + | s |
| Methyl 6-oxoheptanoate | 14.480 | + | + | + |
| Caryophyllene | 18.565 | + | + | + |
| Sucrose | 19.828 | + | + | + |
| 2,4-Di-tert-butylphenol | 21.846 | + | + | + |
| Myristicin | 22.462 | + | + | + |
| 1,2,3,5-Cyclohexanetetrol, (1α,2β,3α,5β) | 28.532 | + | + | + |
| Apiol | 32.598 | + | + | + |
| Neophytadiene | 44.788 | + | + | + |
| Phytol | 44.924 | + | + | + |
| Acetamide, N-(2-phenylethyl) | 46.267 | + | + | + |
| 7,9-Di-tert-butyl-1-oxaspiro(4,5)deca-6,9-diene-2,8-dione | 47.369 | + | + | s |
| Dibutyl phthalate | 49.862 | − | + | − |
| n-Hexadecanoic acid | 50.595 | + | + | + |
| 9-Octadecenamide, (Z) | 53.518 | + | + | s |
Disclaimer/Publisher’s Note: The statements, opinions and data contained in all publications are solely those of the individual author(s) and contributor(s) and not of MDPI and/or the editor(s). MDPI and/or the editor(s) disclaim responsibility for any injury to people or property resulting from any ideas, methods, instructions or products referred to in the content. |
© 2025 by the authors. Licensee MDPI, Basel, Switzerland. This article is an open access article distributed under the terms and conditions of the Creative Commons Attribution (CC BY) license (https://creativecommons.org/licenses/by/4.0/).
Share and Cite
Chudzińska-Skorupinska, J.; Wawrzyńczak, A.; Feliczak-Guzik, A. Microneedles as Modern Carriers of Plant Extracts. Micromachines 2025, 16, 143. https://doi.org/10.3390/mi16020143
Chudzińska-Skorupinska J, Wawrzyńczak A, Feliczak-Guzik A. Microneedles as Modern Carriers of Plant Extracts. Micromachines. 2025; 16(2):143. https://doi.org/10.3390/mi16020143
Chicago/Turabian StyleChudzińska-Skorupinska, Jagoda, Agata Wawrzyńczak, and Agnieszka Feliczak-Guzik. 2025. "Microneedles as Modern Carriers of Plant Extracts" Micromachines 16, no. 2: 143. https://doi.org/10.3390/mi16020143
APA StyleChudzińska-Skorupinska, J., Wawrzyńczak, A., & Feliczak-Guzik, A. (2025). Microneedles as Modern Carriers of Plant Extracts. Micromachines, 16(2), 143. https://doi.org/10.3390/mi16020143