Article

A Two-Stage Unet Framework for Sub-Resolution Assist Feature Prediction

by
Mu Lin
1,
Le Ma
2,3,
Lisong Dong
2,3 and
Xu Ma
1,*
1
Key Laboratory of Photoelectronic Imaging Technology, System of Ministry of Education of China, School of Optics and Photonics, Beijing Institute of Technology, Beijing 100081, China
2
State Key Laboratory of Fabrication Technologies for Integrated Circuits, Beijing 100029, China
3
Institute of Microelectronics of the Chinese Academy of Sciences, Beijing 100029, China
*
Author to whom correspondence should be addressed.
Micromachines 2025, 16(11), 1301; https://doi.org/10.3390/mi16111301
Submission received: 9 October 2025 / Revised: 13 November 2025 / Accepted: 18 November 2025 / Published: 20 November 2025
(This article belongs to the Special Issue Recent Advances in Lithography)

Abstract

Sub-resolution assist feature (SRAF) is a widely used resolution enhancement technology for improving image contrast and the common process window in advanced lithography processes. However, both model-based SRAF and rule-based SRAF methods suffer from challenges of adaptability or high computational cost. The primary learning-based SRAF method adopts an end-to-end mode, treating the entire mask pattern as a pixel map, and it is difficult to obtain precise geometric parameters for the commonly used Manhattan SRAFs. This paper proposes a two-stage Unet framework to effectively predict the centroid coordinates and dimensions of SRAF polygons. Furthermore, an adaptive hybrid attention mechanism is introduced to dynamically integrate global and local features, thus enhancing the prediction accuracy. Additionally, a warm-up cosine annealing learning rate strategy is adopted to improve the training stability and convergence speed. Simulation results demonstrate that the proposed method accurately and rapidly estimates the SRAF parameters. Compared to traditional neural networks, the proposed method can better predict SRAF patterns, with the mean pattern error and edge placement error values showing the most significant reductions. PE decreases from 25,776.44 to 15,203.33 and EPE from 5.8367 to 3.5283, respectively. This significantly improves the image fidelity of the lithography system.

1. Introduction

As lithography technology nodes continue to shrink, the critical dimensions (CDs) of integrated circuits have approached or surpassed the resolution limit of the optical lithography system, thus leading to significant patterning distortion in wafer images due to the optical proximity effect. A major challenge to maintaining lithography image fidelity is that the process window (PW) for isolated patterns is misaligned with that for dense patterns, thereby compromising the common PW across the whole layout. To expand the PW for isolated patterns, sub-resolution assist features (SRAFs) are placed around the main patterns of the mask [1]. This approach changes the environments of isolated patterns to effectively simulate the imaging characteristics of dense patterns, thereby extending their common PWs. Hereafter, the SRAFs refer to the non-printable tiny features inserted surrounding the main patterns on the mask. Those features modulate the local optical interference to improve the imaging contrast, depth of focus, and common PWs, thereby ensuring preferable image fidelity and manufacturability.
SRAF insertion techniques are primarily divided into the rule-based SRAF (RB-SRAF) methods [2,3,4,5,6] and model-based SRAF (MB-SRAF) methods [7,8,9,10,11]. RB-SRAF relies on predefined geometric rules and lookup tables to generate SRAFs. However, its effectiveness is inherently constrained by the completeness of the rule tables. Meanwhile, MB-SRAF employs lithography simulation models or inverse-optimization algorithms to adaptively generate SRAFs. However, as the CD of integrated circuits continues to shrink, the computational complexity of MB-SRAF increases dramatically.
In recent years, the rapid development of machine learning and deep learning has offered a promising alternative for SRAF insertion [12,13,14]. Based on data-driven strategies, researchers reformulated the SRAF insertion as an image-processing problem, using learning-based models or deep neural networks to directly predict the optimal SRAF deployment. For example, Ciou et al. used the cycle generative adversarial network (Cycle-GAN) to enhance the efficiency of SRAF insertion [15]. Wang et al. applied the deep convolutional network combined with continuous transmission masks (CTMs) to implement the rapid full-chip SRAF insertion [16]. Mohamed employed the conditional generative adversarial network (CGAN) to generate SRAFs [17]. Those methods mainly predict SRAFs with freeform shapes or curvilinear patterns, but the increasingly complex and large-scale nature of SRAF patterns poses a significant challenge to manufacturability [18,19]. In order to reduce mask complexity, some methods were proposed to simplify curvilinear SRAFs into rectangular ones to balance manufacturability and image fidelity [20,21]. However, the geometric transformation and reshape processes will undoubtedly introduce additional runtime and image fidelity loss.
In order to overcome these limitations, this paper proposes a two-stage Unet architecture to directly generate preferred SRAFs with rectangular shapes, as illustrated in Figure 1. In the first stage, the sub-network “Unet1” is used to predict the centroid coordinates of SRAFs. Given the input layout with feature size of X × Y and channel count of 1, this network uses an encoder–decoder structure to extract both global features and local details of the layout pattern. With skip connections, the network effectively preserves the high-resolution feature map and outputs the map of centroid coordinates. In the second stage, the sub-network “Unet2” with channel count of 2 predicts the dimension of each SRAF polygon. Under the constraints imposed by the centroid coordinates, it establishes the mapping relationship from key parameters, such as mask pattern shapes, densities, and spacings between main features, to the lateral sizes (height and width) of SRAF polygons. By combining the outputs of Unet1 and Unet2, the rectangular SRAFs can be inserted on the mask.
Additionally, we introduce an adaptive hybrid attention mechanism (AHAM) into the Unet architecture. This mechanism dynamically adjusts the weights between global and local information in the mask feature map to enhance the network’s ability to capture the critical features and improve the prediction accuracy. Moreover, a warm-up cosine annealing (WCA) algorithm is introduced during network training to improve the training stability and the final prediction performance.
The remainder of this paper is organized as follows. Section 2 describes the Unet structure, AHAM, and WCA algorithm. Section 3 presents the two-stage network architecture proposed in this work and details its operational workflow. Section 4 provides the numerical experimental results. Section 5 is the conclusion.

2. Preliminaries

2.1. Unet

In this paper, the SRAF prediction model is constructed based on the Unet framework. As illustrated in Figure 2, Unet has unique encoder–decoder structure and cross-layer feature fusion mechanism [22], which are beneficial to mask parameter prediction directly from the layout pattern. Unet employs a U-shaped symmetric structure. The left-side encoder path performs the down-sampling operations using 3 × 3 convolutional kernels with a stride of 2. Combined with the LeakyReLU activation functions, the encoder hierarchically extracts the high-level features including the geometric and spatial information from the layout pattern. The right-side decoder path gradually reconstructs the resolution of feature maps through the transposed convolutions (ConvTranspose in Figure 2).
A key advantage of Unet lies in its skip connections, which concatenate feature maps from the decoder and encoder paths at the same level. This design effectively integrates high-level abstract features with low-level detailed features. Specifically, the low-resolution feature maps containing high-level semantic information are up-sampled in the decoder and then fused with the high-resolution feature maps with detailed context from the encoder via channel-wise concatenation. This fusion method enables the network to utilize feature information on different scales and enhances the model’s understanding of layout details and global semantics. Finally, the network further processes and integrates the fused feature maps to generate the final output.

2.2. AHAM

In deep learning, attention mechanisms allocate weights to emphasize the crucial information, thereby significantly enhancing the learning capacity of networks. Existing research demonstrates that global attention mechanisms can effectively capture the holistic semantic information by establishing long-range dependency [23], while local attention mechanisms concentrate on the localized map features, exhibiting notable advantages in preserving the detailed information [24]. These two mechanisms are complementary, but the synergy between them in feature extraction is insufficient [25,26,27].
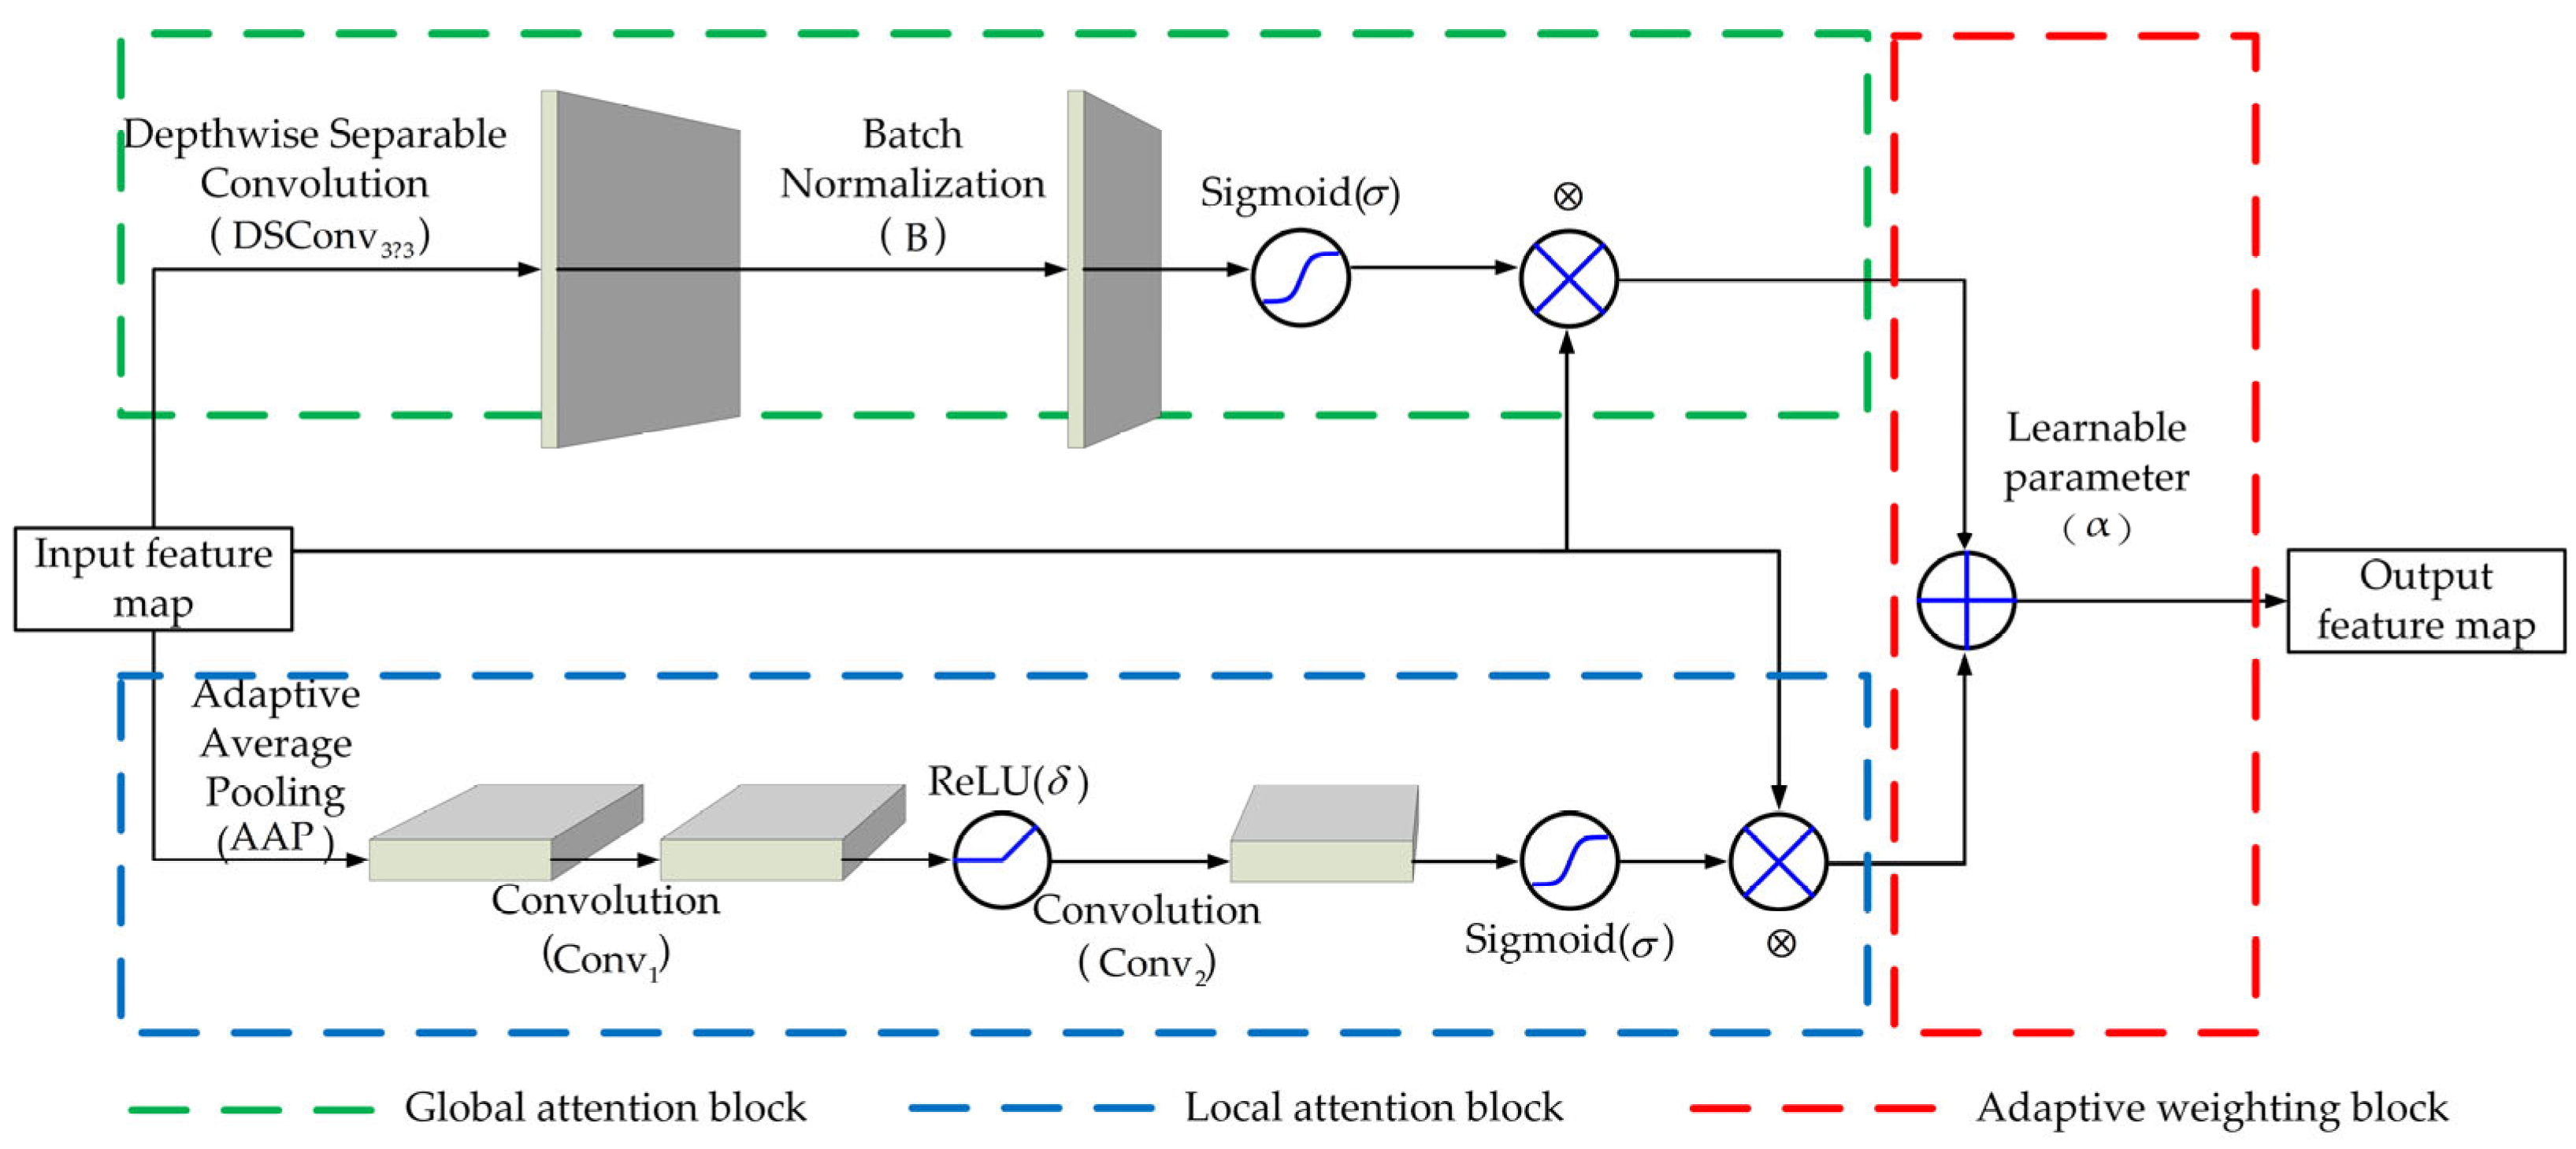
To address this issue, we propose the AHAM module, and its innovation is manifested in two aspects. First, it employs a parallel architecture with dual branches to model the global context and extract local detailed features simultaneously. Second, it introduces learnable weighting parameters to dynamically fuse the global and local attention branches, thereby enhancing the capability to extract the layout features. The structure of AHAM is shown in Figure 3.
The AHAM consists of three components, including a global attention block (green dashed line), a local attention block (blue dashed line), and an adaptive weighting block (red dashed line). The local attention block captures the structural details within the regional receptive fields, which is formulated as follows:
F l o c a l ( x ) = σ { B [ D S C o n v 3 × 3 ( x ) ] } x ,
where x denotes the input feature map, and D S C o n v 3 × 3 denotes a depth-wise separable convolution with a 3 × 3 kernel. This operation decouples the computational flow across channels, effectively reducing the parameter count while maintaining the key local features. The notation B represents the batch normalization layer. The sigmoid activation function σ projects the output value into the range of ( 0 , 1 ) , generating a local attention weight map with the same size as the input feature map. The weight map is then fused with the original input by element-wise multiplication to enhance local feature representation.
The global attention block captures the semantic information of the feature map, and can be formulated as follows:
F g l o b a l ( x ) = σ [ C o n v 2 ( δ { C o n v 1 [ A A P ( x ) ] } ) ] x ,
where A A P denotes the adaptive average pooling operation, which compresses the input feature map into a global feature vector, providing a compact representation of the global context. The C o n v 1 and C o n v 2 represent the convolutional layers, and δ is a nonlinear activation function that enhances the representation capacity. The resulting output is passed through the sigmoid function to generate the global attention map.
Furthermore, a learnable parameter a , whose value is dynamically adjusted by the back-propagation algorithm, is used to balance the contributions of the global and local attention branches and enable the adaptive feature integration. Thus, the final output is given by the following:
y = α F l o c a l + ( 1 α ) F g l o b a l .

2.3. WCA Algorithm

The strategy for updating the learning rate influences the training stability, convergence speed, and generalization capacity. Although constant learning rates and piecewise constant decay strategies are widely used, their limitations have been proven in many studies [28,29]. The former one maintains an unchanged rate, which lacks flexibility for the training process, particularly in large-scale models. The latter sets different learning rates in stages. However, some critical hyperparameters, e.g., the decay step and decay factor, require tuning through numerous training and validation processes, which demands substantial computational resources.
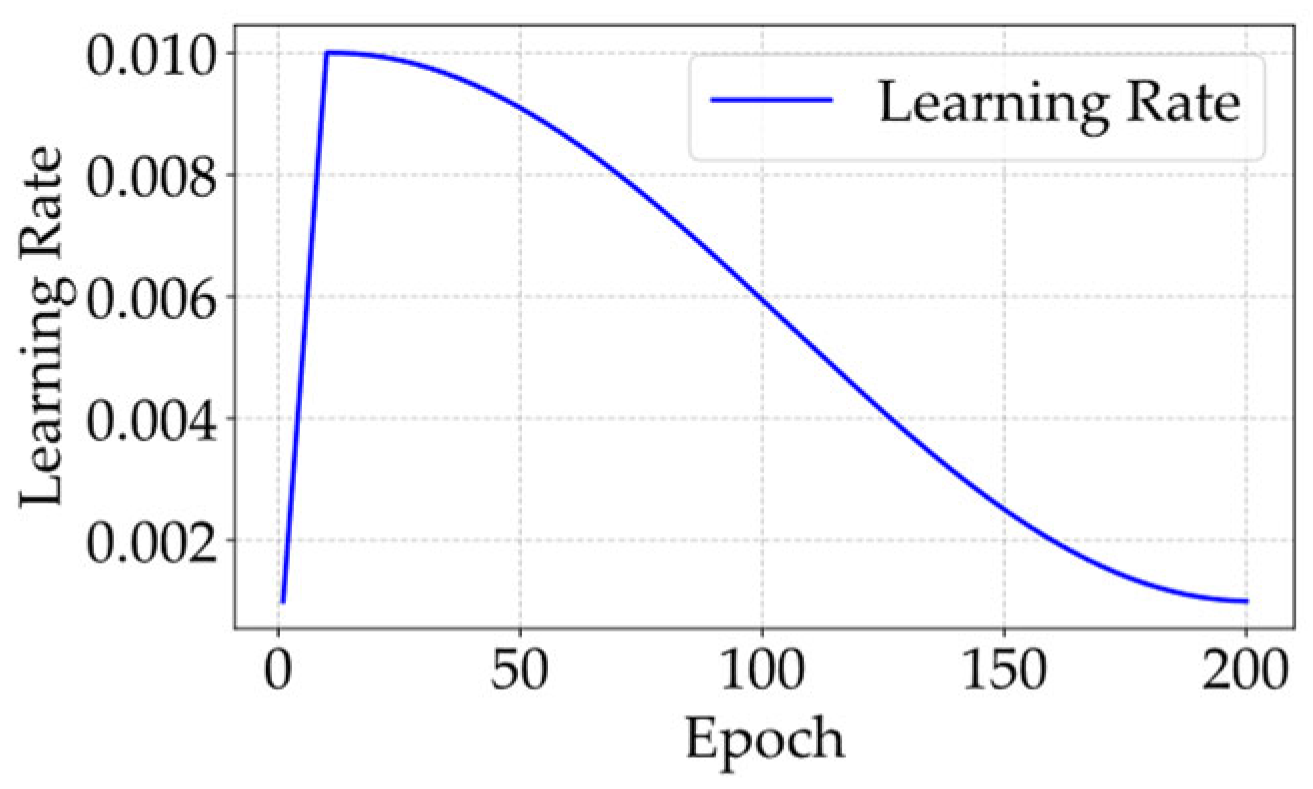
To improve the training stability and convergence, we adopt the WCA algorithm, combining the linear warm-up [30] and cosine annealing [31], to adjust the learning rate. This method starts from the warm-up stage, stabilizes the early training process by gradually increasing the learning rate, and then enters the cosine annealing stage, where the learning rate is smoothly reduced to ensure the final convergence. During the warm-up stage, the learning rate increases linearly from 0 to a preset maximum, allowing the optimizer to initially explore the effective update directions and mitigate early instability due to the gradient anomalies or parameter randomness [30]. The warm-up phase is formulated as follows:
l r = l r 0 × E E w a r m - u p ,
where l r represents the current learning rate, l r 0 denotes the preset maximum rate, E is the current epoch, and E w a r m - u p denotes the total number of warm-up epochs.
After the warm-up, the cosine annealing is used to decay the learning rate from l r 0 to the minimum based on the cosine function, which is formulated as follows:
l r = l r 0 × { m i n _ l r _ r a t i o + ( 1 m i n _ l r _ r a t i o ) × 0.5 × [ 1 + c o s ( π × E E w a r m u p E t o t a l E w a r m - u p ) ] } ,
where E t o t a l denotes the total number of training epochs; m i n _ l r _ r a t i o is the ratio of the minimum learning rate to l r 0 , ensuring that the l r is not lower than the minimum rate. The continuity of the cosine function makes the learning rate decrease gradually and monotonically, avoiding the oscillation of the loss function. Figure 4 illustrates the learning rate variation governed by the WCA algorithm.

3. The Proposed Two-Stage Unet Framework

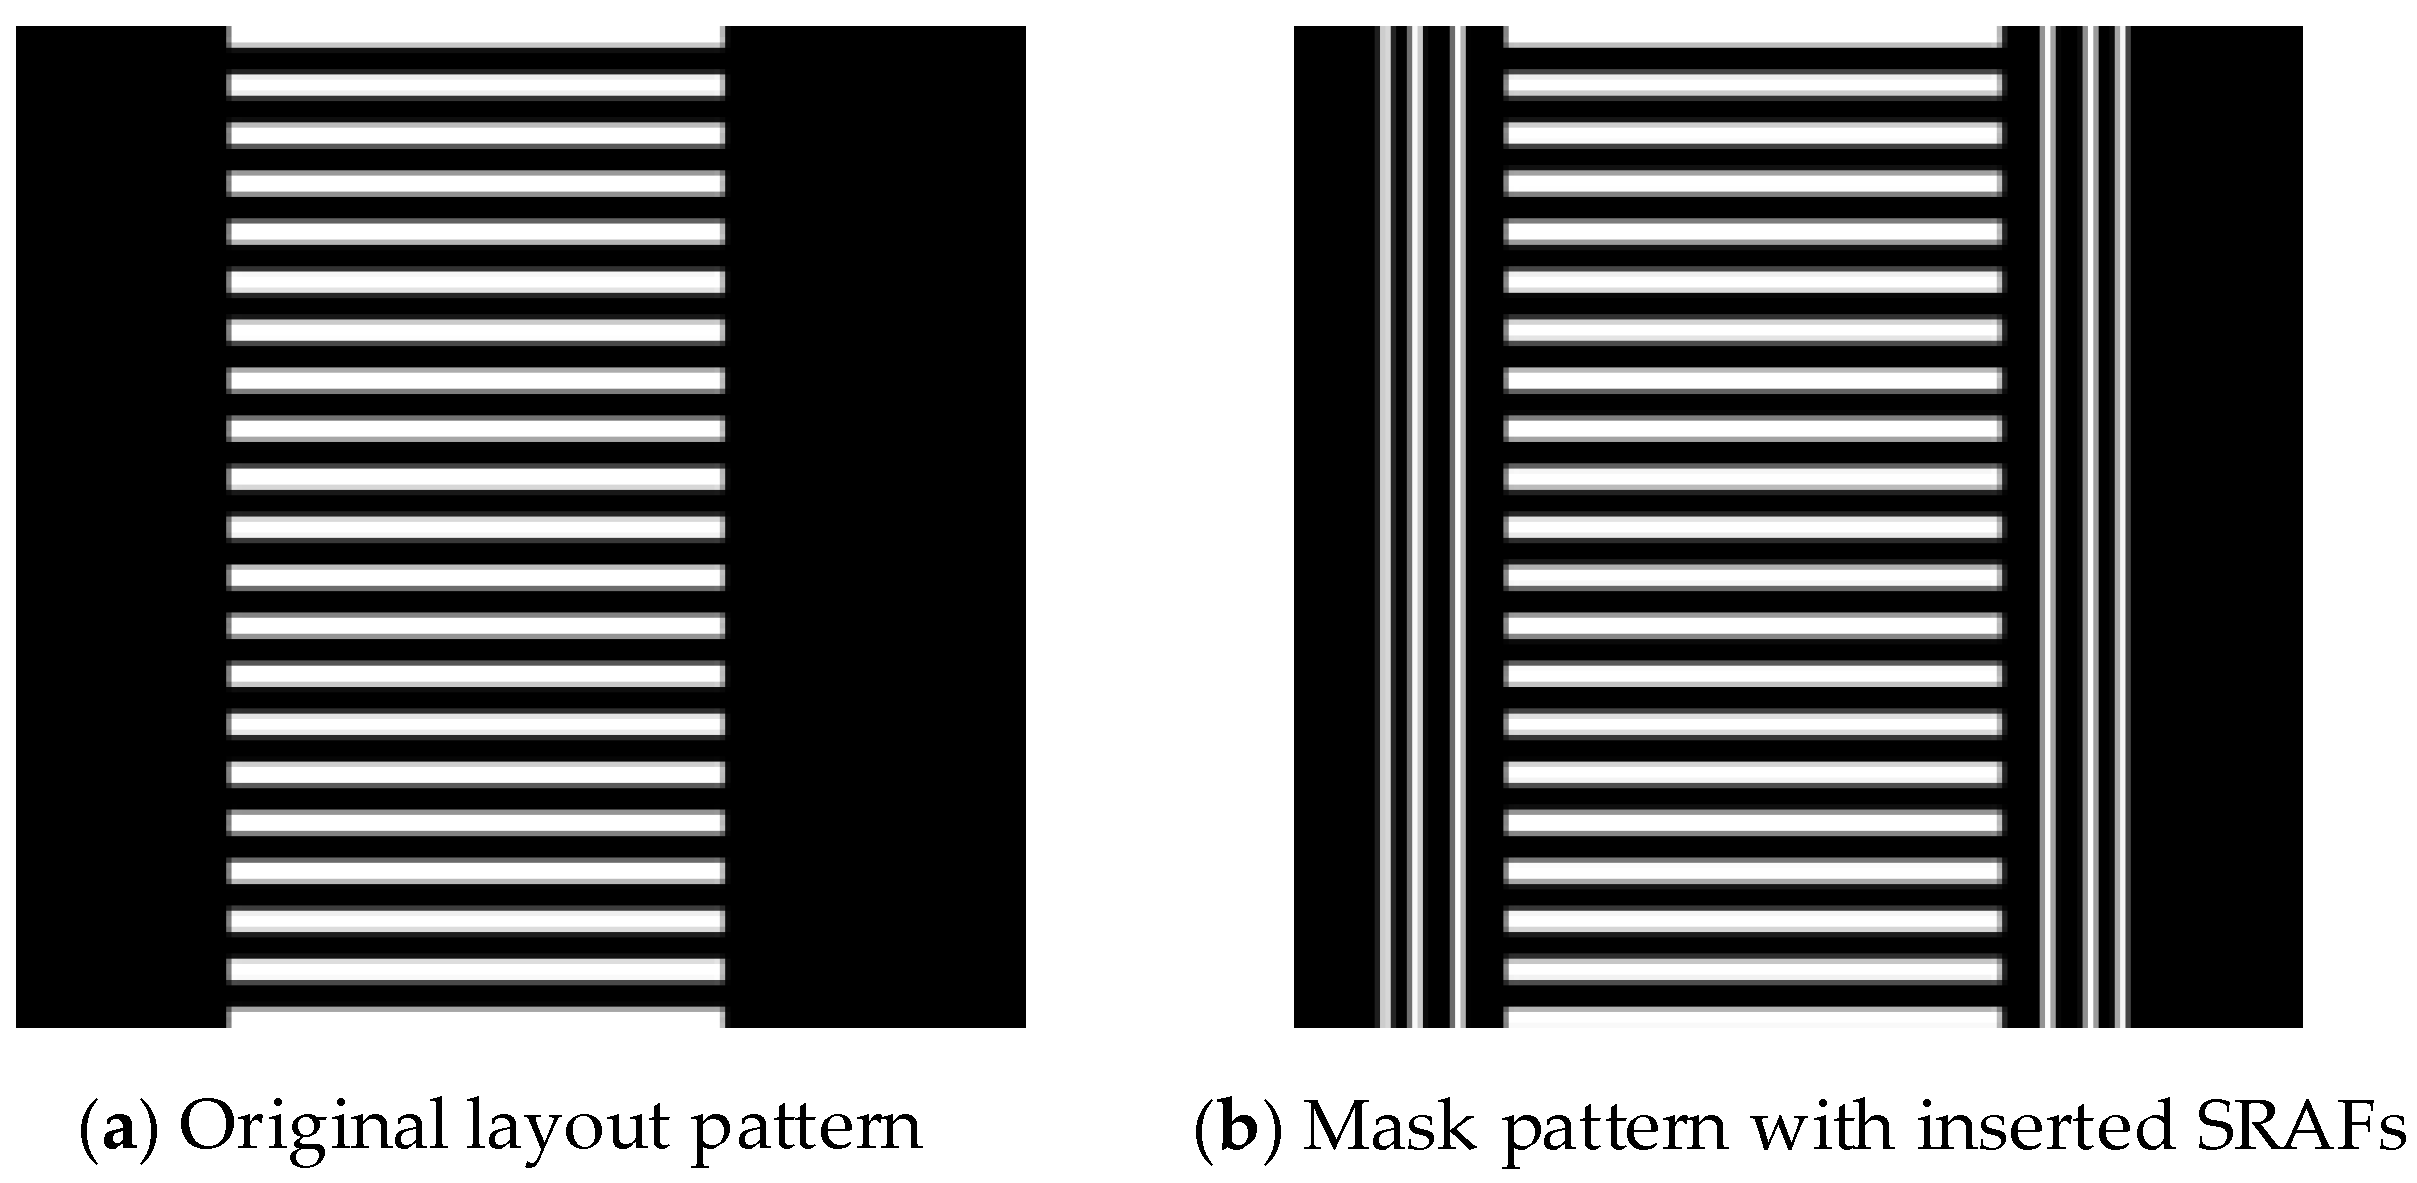
The proposed method requires rapid and accurate prediction of key parameters for inserting SRAFs within a specific layout region. Figure 5a shows the original layout pattern without SRAFs, where the main pattern includes line-space features. Figure 5b displays the mask pattern with six vertical SRAF bars inserted. Next, we will describe the proposed two-stage Unet framework in detail.

3.1. Unet1

The detailed structure of the sub-network “Unet1” is shown in Figure 6, and its hyperparameters are shown in Appendix A. The Unet1 is constructed based on the Unet architecture. An AHAM module is introduced after the Conv-Block of each down-sampling stage. The fused map, which combines the up-sampling result and encoder feature map, is also fed into the AHAM module. Additionally, a convolution layer is added before the output layer to ensure that the output feature map has the same size as the input one.
For training purposes, the centroid coordinates of the training SRAF dataset need to be labeled in advance. These labels adopt the morphological dilation algorithm to expand the single centroid point into a square of a specified side length. The selection of the dilation side length affects the training effectiveness. An excessively small side length may cause the centroid labels to be recognized as noise, while a too large side length may induce overlaps between neighboring labels. To improve training efficiency and strengthen feature learning in the centroid region, the values of SRAFs’ centroid labels are increased (from 1 to 10). This adjustment encourages the network to extract the features in the centroid region, thereby enhancing prediction accuracy for SRAF centroids.
After the network training is complete, the feature map of initial centroid coordinates is obtained. Subsequently, the threshold segmentation algorithm is used to process the feature map [32], which is defined as follows:
f ( x i , y i ) 1 f ( x i , y i ) > t h r e s h o l d 0 f ( x i , y i ) t h r e s h o l d ,
where f ( x i , y i ) represents the value at row x i and column y i in the feature map. Subsequently, the connected component analysis-labeling algorithm [33] is used. It selects the regions exceeding the threshold as candidate regions, then calculates the centroids of the candidate regions. Based on the relationship between SRAFs and main patterns, additional centroid coordinates are added at the symmetric positions. Finally, adjacent centroid coordinates are merged to generate the final centroid coordinate map.

3.2. Unet2

Figure 7 shows the structure of the sub-network “Unet2”, and Appendix B provides its hyperparameters. Similarly to Unet1, the AHAM module and convolution layer are introduced at the same position in Unet2. As shown in Figure 7, we adopt a dual-channel architecture design. At the input end, the first channel is the output map (centroid coordinate map) from “Unet1”, and the second channel is the original layout pattern. The higher weights are assigned to the first channel, thus making Unet2 predict the SRAF dimensional parameters around the regions of centroid coordinates. At the output end, the two channels correspond to the height and width parameters of SRAFs, respectively. After obtaining the outputs from Unet2, the regional maximum detection algorithm [34] is employed to extract the dimension information of SRAFs. Specifically, the algorithm identifies the maximum values in the output feature maps that correspond to the centroid regions, thereby estimating the width and height of SRAFs.
To generate ground-truth labels for SRAF parameters, the width and height values are first normalized to the range from 0 to 1, and subsequently assigned to the corresponding centroid coordinate regions. However, the lower normalized values of widths and heights may lead to issues such as gradient vanishing or neuron activation saturation when updating the network parameters, which may slow down the convergence rate and reduce the generalization performance. To solve this problem, higher weights are applied to the width and height labels, for example, by multiplying them by 1000.
After obtaining the output maps from both Unet1 and Unet2, we can determine the locations and sizes of all SRAF polygons. Subsequently, it is necessary to perform the mask rule check (MRC) for the inserted SRAFs. For the rectangular SRAFs in this work, MRC ensures that the line width meets the manufacturing constraints, avoiding the unexpected SRAF images printed on the wafer, and also eliminating the overlaps between SRAFs themselves or between SRAFs and main features. Finally, the MRC guarantees the manufacturability of the final mask pattern.

4. Simulation Results and Analysis

In the preliminary stage, we collect a total of 69 original layouts with a size of 1024 × 1024 pixels, where 60 of them are randomly selected as the training set and the remaining 9 layouts serve as the test set. The following simulations are conducted on a computer with an Intel (R) Xeon (R) E5-2620 v4 CPU and NVIDIA GeForce RTX 2080 Ti GPU. The proposed network is trained for 200 epochs, using the Adam optimizer. The maximum and minimum learning rates are 0.01 and 0.001, respectively. The warm-up stage of 10 epochs is applied to stabilize the initial training. The loss function based on the sum of squared due to errors (SSEs) is defined as follows:
S S E = x i = 1 m y i = 1 n ( G ( x i , y i ) f ( x i , y i ) ) 2 ,
where G ( x i , y i ) denotes the ground truth at the position ( x i , y i ) on the mask, f ( x i , y i ) represents the corresponding predicted value.

4.1. Results

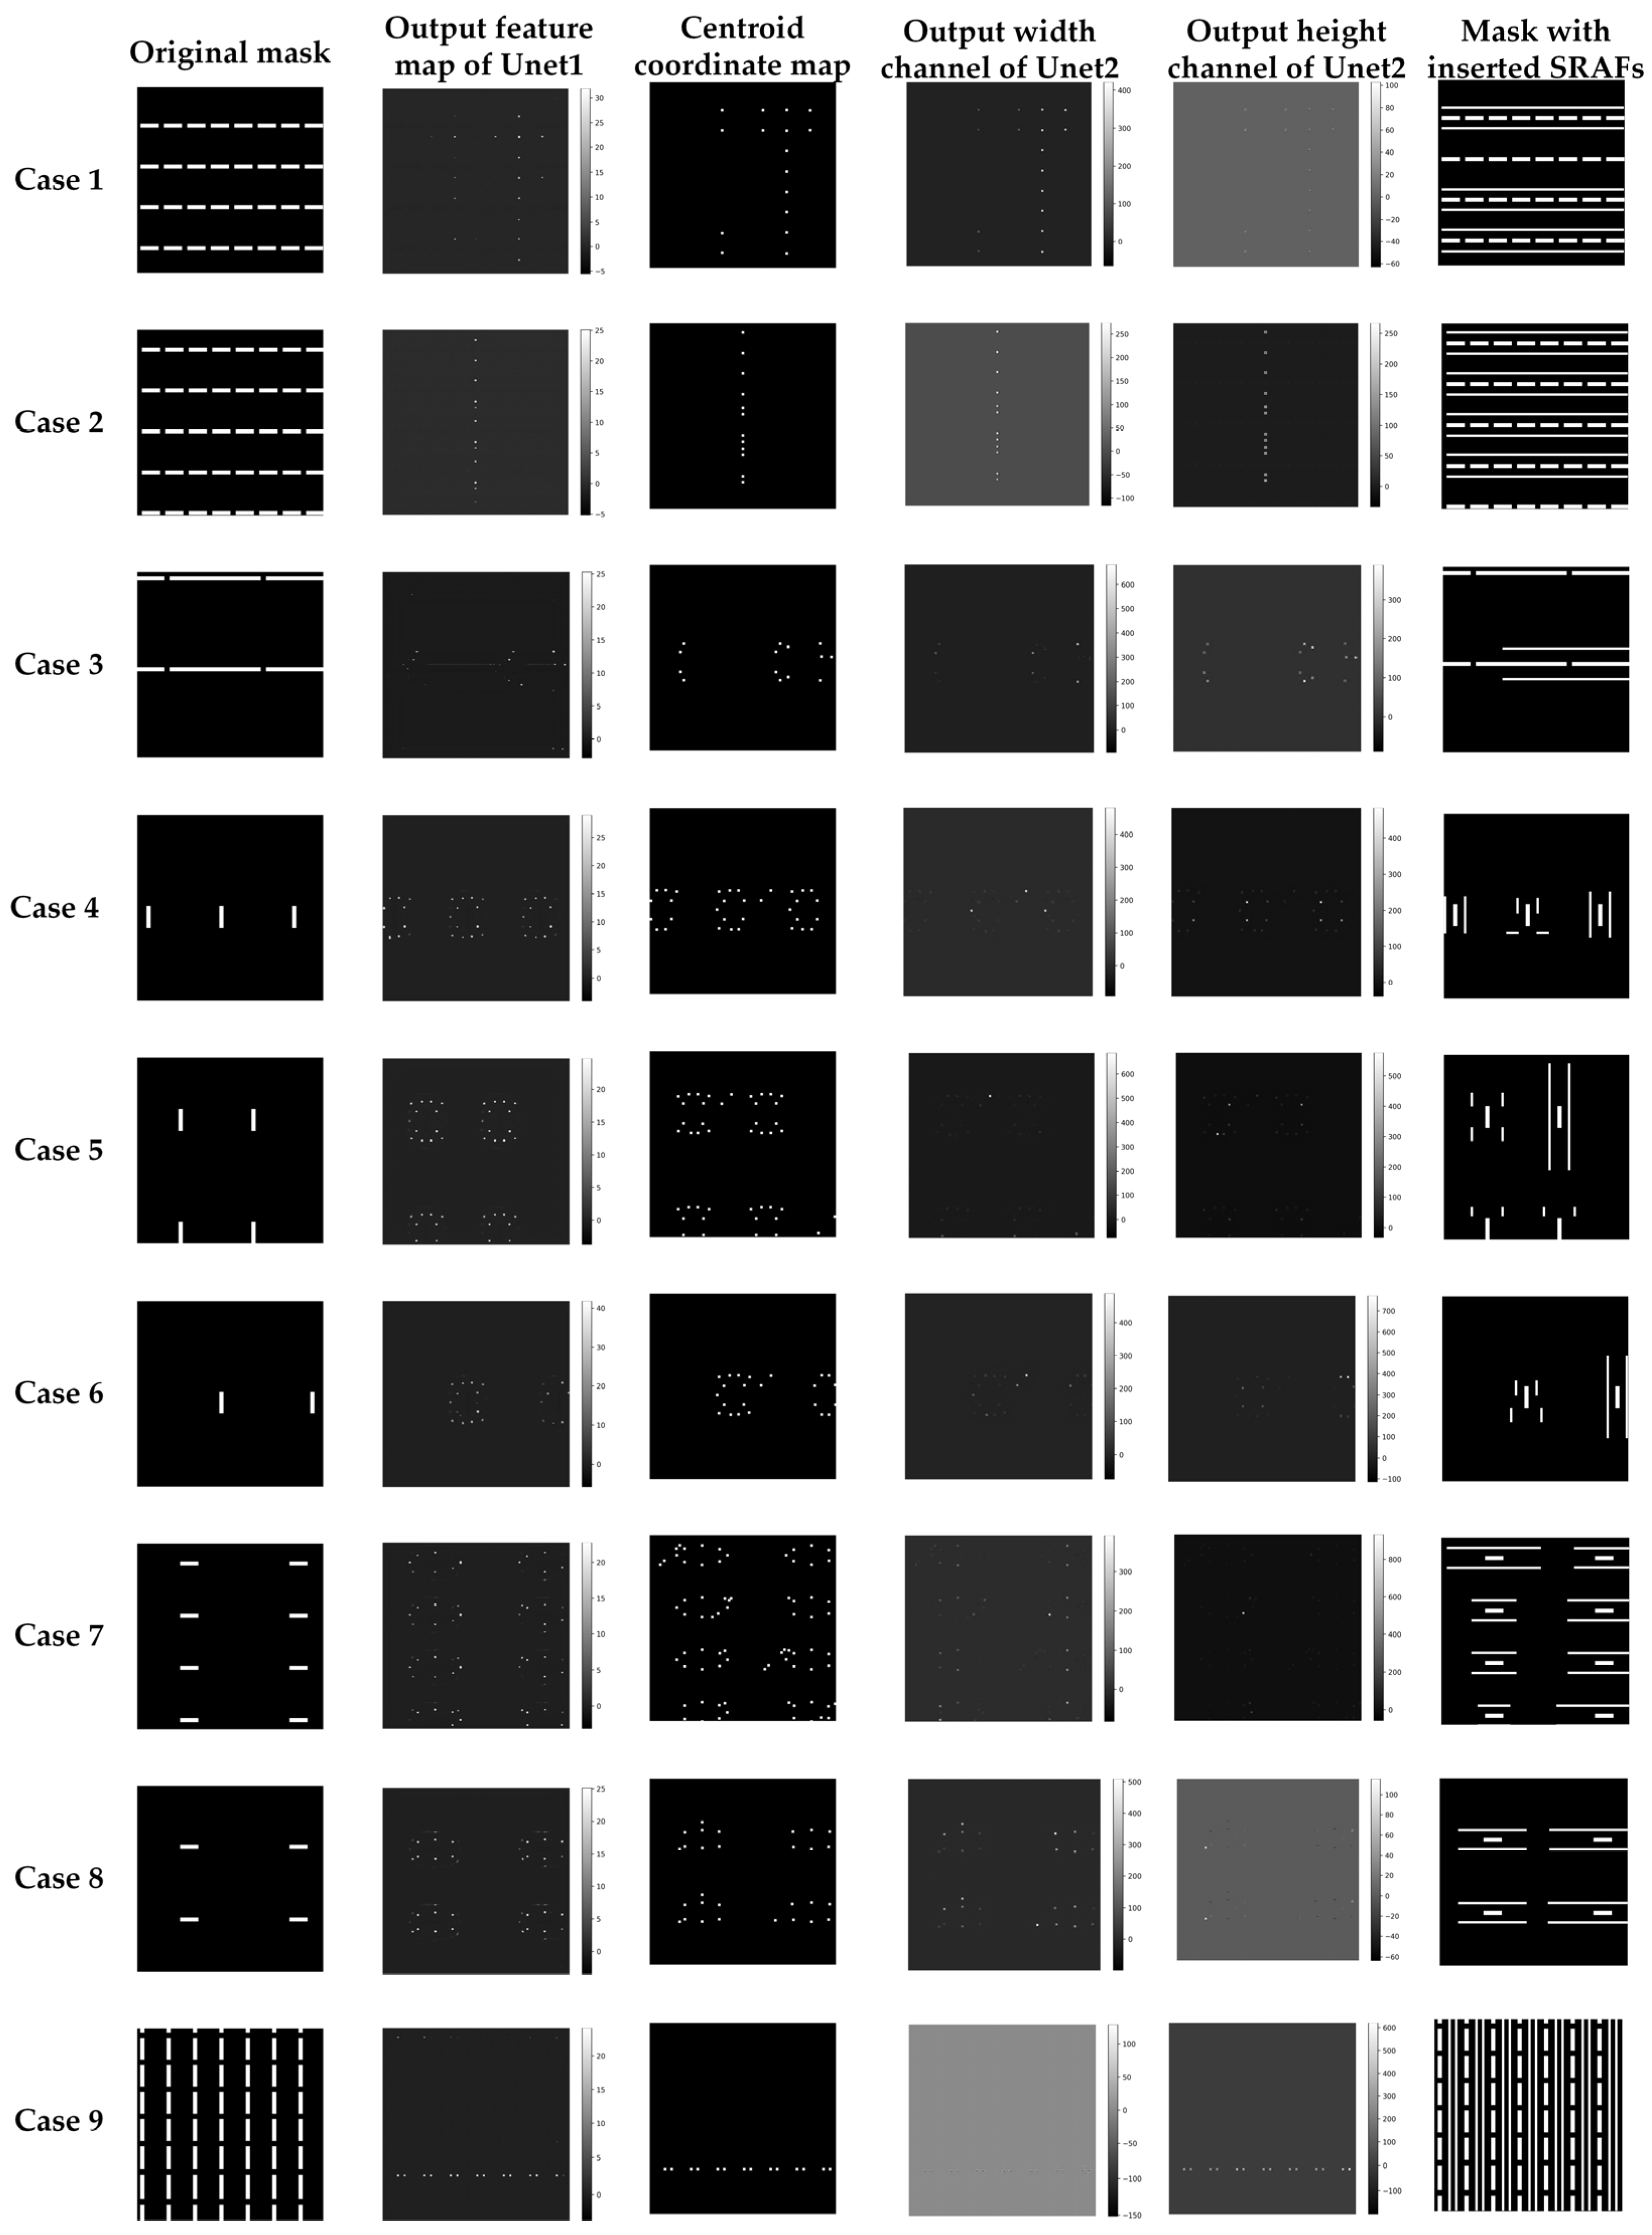
The test set is fed into the well-trained network to evaluate prediction performance, and the simulation results of the test set are illustrated in Figure 8. From top to bottom, it shows 9 cases of simulations with different layout patterns. From left to right, the columns illustrate the original mask pattern, the raw feature map outputted by Unet1, the centroid coordinate map, which is obtained by processing the output feature map of Unet1, the feature map of the width channel output by Unet2, the feature map of height channel outputted by Unet2, and the mask pattern including the predicted SRAFs, respectively.
On closer inspection of Figure 8, column 2 exhibits significant differences in the value of the feature map output by Unet1 to different layouts. For example, the maximum value in the feature map for Case 6 is approximately 40, while that for Case 5 is about 20. Threshold segmentation and connected component analysis-labeling algorithm are applied to balance the output intensities across different cases. Further observation of columns 4 and 5 shows that the output maps of the height and width parameters successfully align with the centroid coordinate map in the post-processed map of Unet1. This demonstrates that the proposed method can accurately extract both the width and height for each SRAF in those regions. By comparing the results in columns 1 and 6, the proposed method can predict the appropriate number and sizes of SRAFs around the main pattern. Furthermore, the results of the 9 cases confirm that the proposed method inserts an adaptive SRAF for different types of mask patterns and that the stability and generalization ability of the proposed network.
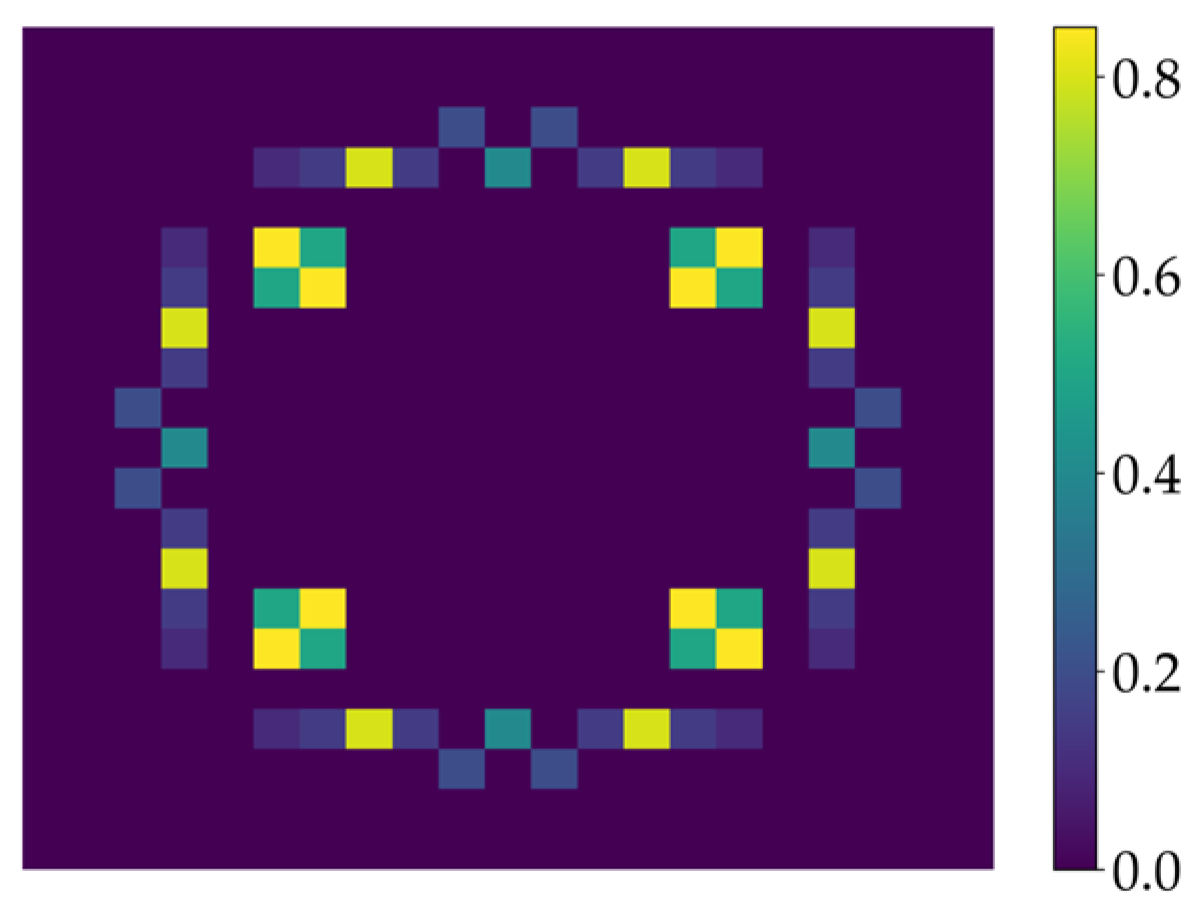
To verify the effectiveness of the proposed method in improving lithography imaging quality, the Abbe’s method is used to simulate the aerial image of the mask patterns [35,36,37]. Then, the constant threshold resist model with a threshold of 0.19 is used as the resist model. In the following simulations, the illumination with 193 nm wavelength and XY polarization is used to calculate lithography images, and a pixelated source pattern is used for the lithography process, as illustrated in Figure 9. The numerical aperture (NA) of the projection optics is set to 1.2 with an immersion medium refractive index of 1.44. The demagnification factor of the projection system is 4.
Hereafter, the pattern error (PE) and edge placement error (EPE) are used to assess the imaging quality of the lithography system. PE is defined as the square of the Euclidean distance between the resist image and the target, while EPE represents the offset of the relative position between the resist imaging contour and the target pattern contour. In this paper, EPE is defined as the mean value of EPE at all pixel points along the target contour. PE and EPE are defined as follows:
P E = x i = 1 N y i = 1 N Z T ( x i , y i ) Z ( x i , y i ) 2 ,
E P E = 1 L c c E P E d c ,
where Z T ( x i , y i ) denotes the target pattern at the position ( x i , y i ) , and Z ( x i , y i ) represents the simulated resist image at the position ( x i , y i ) . L c indicates the length of the target contour, and c · d c represents the line integral along the contour, and EPE represents the EPE value along the contour. A smaller EPE value corresponds to a higher image fidelity.
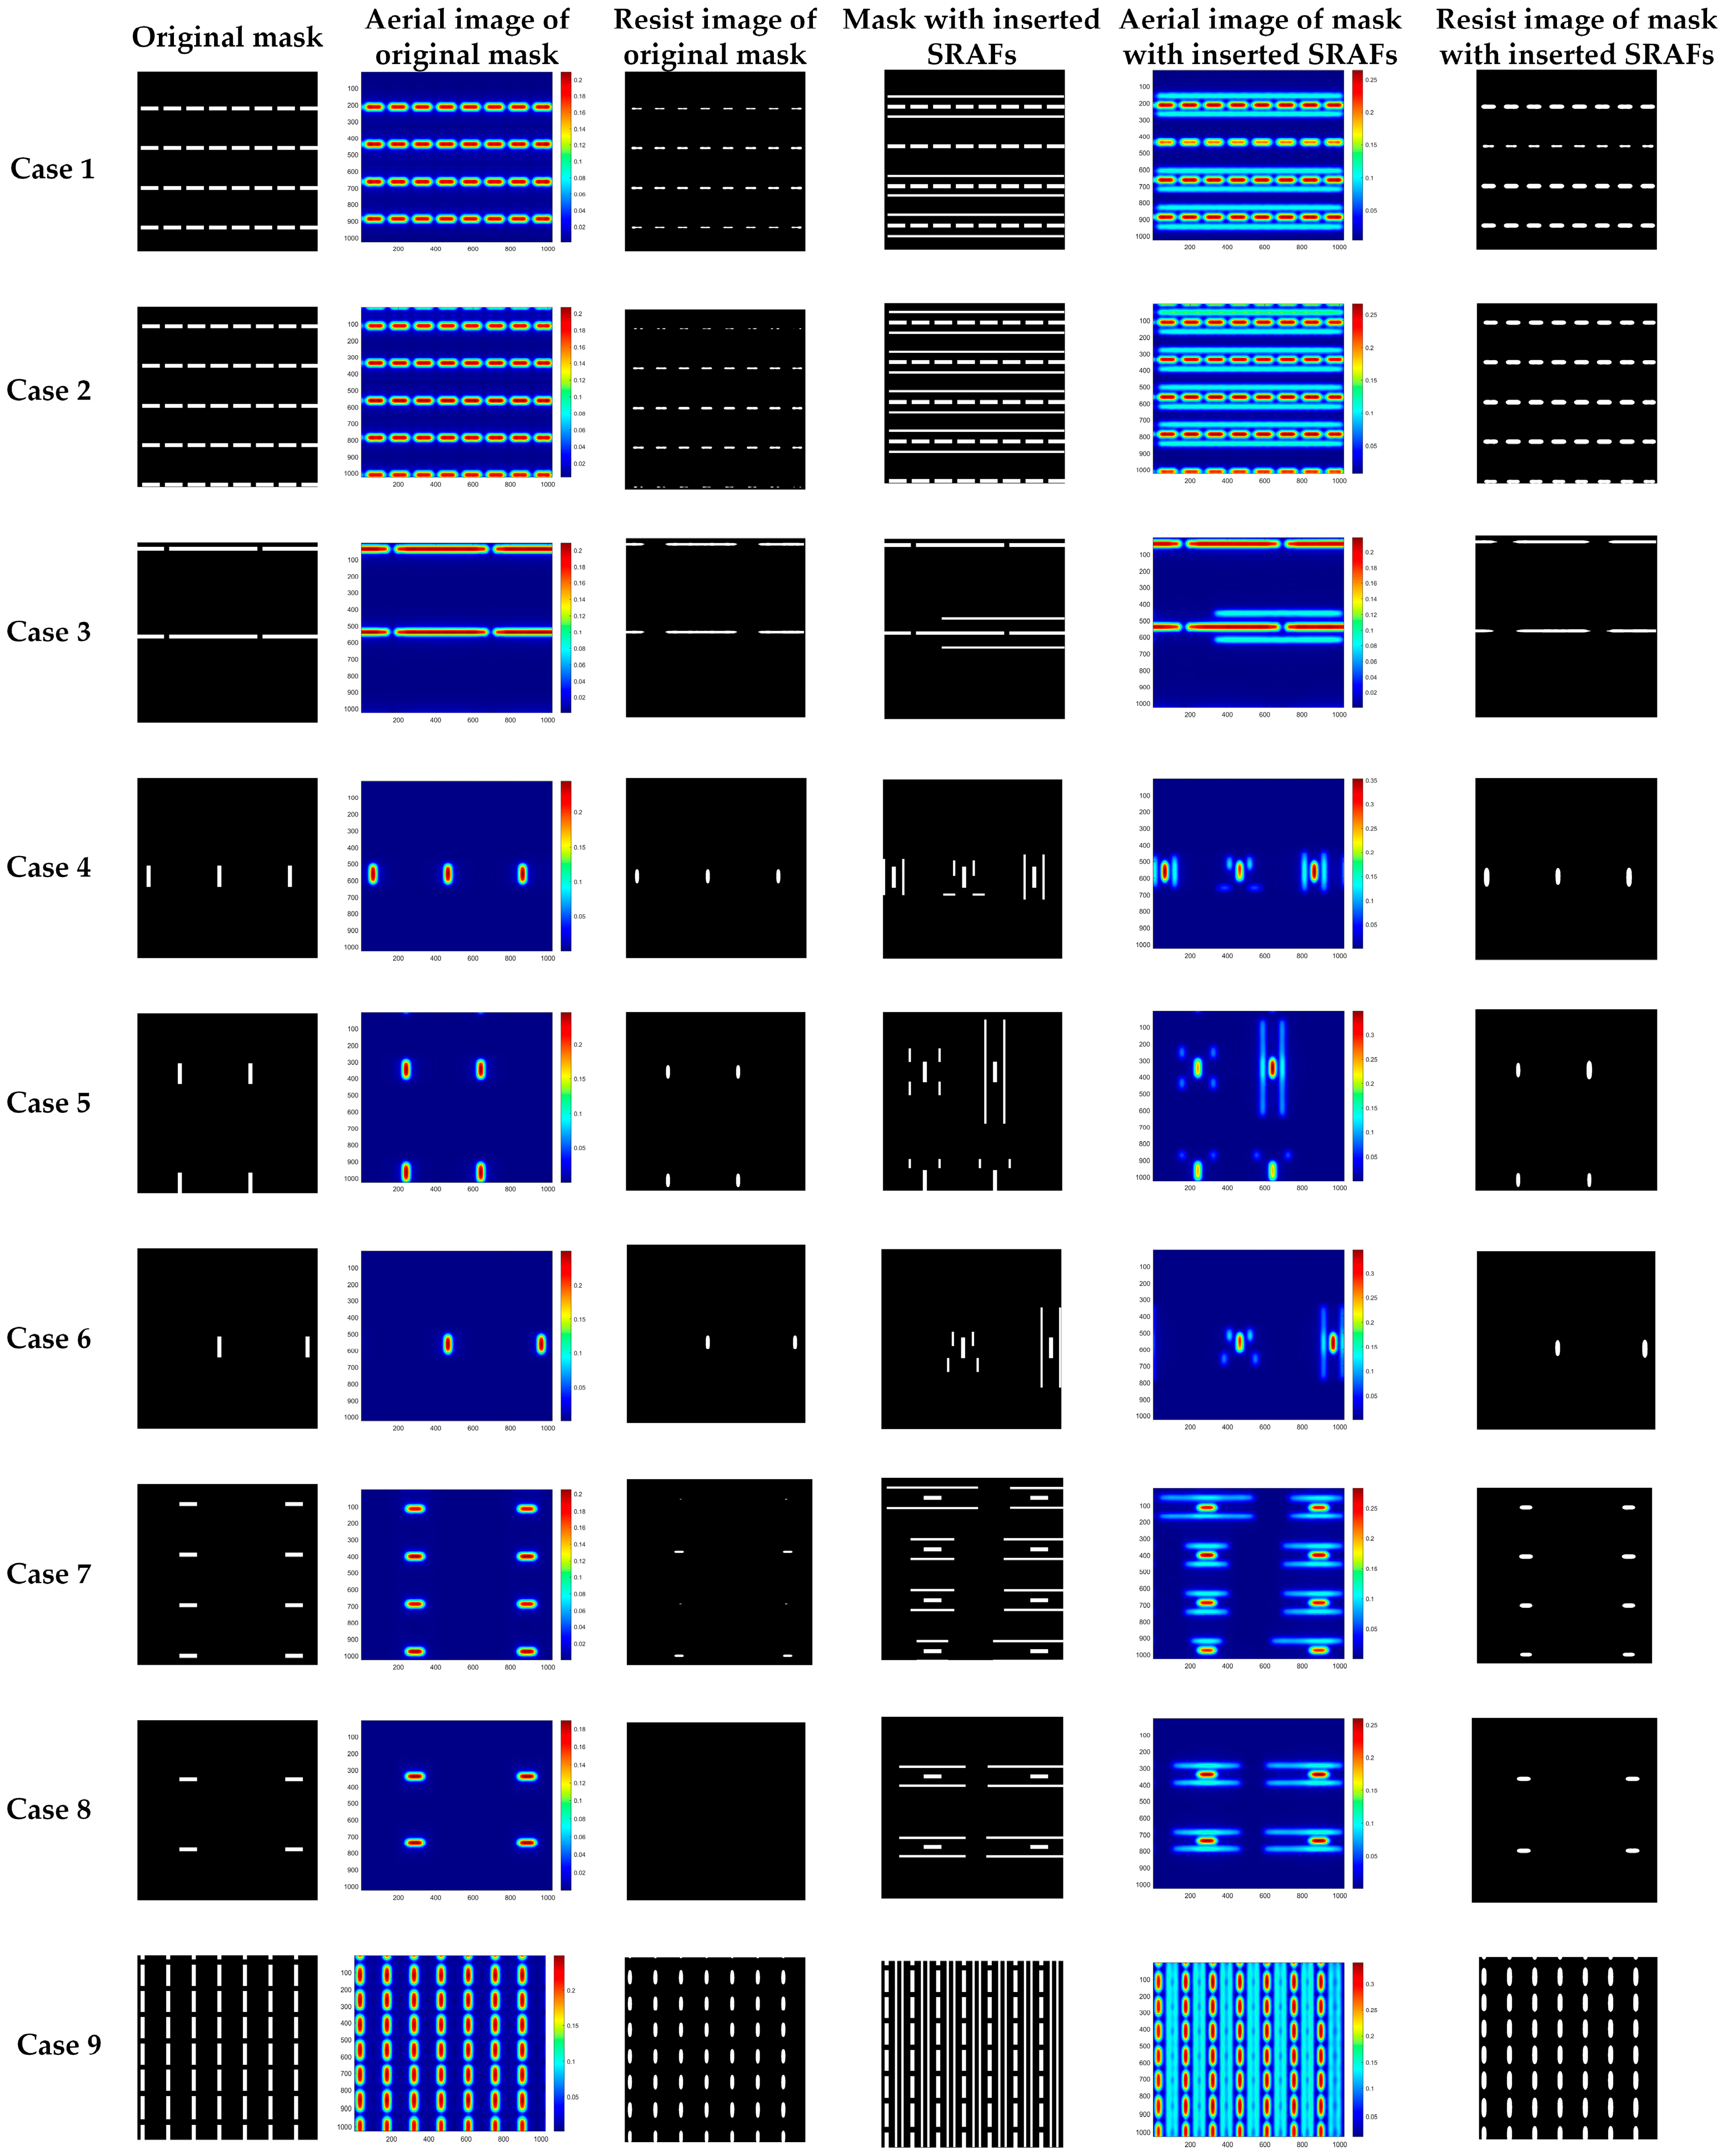
Figure 10 displays the lithography imaging simulation results for the test set. From top to bottom, it shows nine cases of simulations with different layout patterns. The first column shows the initial mask layouts without SRAFs. The second column and the third column show the aerial images and resist images corresponding to the masks in the first column. The fourth column shows the mask patterns with inserted SRAFs obtained by the proposed method. The fifth column and the sixth column show the aerial images and resist images corresponding to the masks in the fourth column. In these nine cases, although the intensities of the SRAFs could be observed, there are no residual images of SRAFs in the resist images after applying a threshold. Furthermore, compared with the resist images of original layouts, the inserted SRAFs will improve the imaging quality.
Table 1 lists the PEs and EPEs for all the resist images in Figure 10. As can be observed from Figure 10 and Table 1, the proposed method not only successfully inserts SRAFs at appropriate locations but also significantly reduces image errors. The PE and EPE values for all testing cases are reduced by different amounts. For PE, Case 2 demonstrates the most notable improvement, with PE reduced from 68,284 to 29,690, and Case 6 also displays a marked reduction in PE from 2296 to 1983. The mean PE across all test cases has decreased from 25,776.44 to 15,203.33. Similarly, the mean EPE value has declined from 5.8367 to 3.5283. Among them, Case 8 shows the largest decrease in EPE, dropping from 9.1667 to 3.2000, and Case 5 has the smallest decrease in EPE, dropping from 4.1903 to 3.5993. These results confirm that the proposed SRAF prediction method can effectively enhance the lithography image quality.

4.2. Ablation Study

In this section, an ablation study is designed to evaluate the contribution of each proposed strategy to the overall model performance. Accordingly, a total of four ablation experiments are conducted. The first one uses the traditional Unet framework to predict the SRAFs (“Unet” for short). The second one introduces the AHAM into the Unet (“Unet + AHAM” for short). The third one integrates the WCA algorithm into the Unet (“Unet + WCA” for short). The last one embeds both the WCA algorithm and AHAM into the Unet (“UNET + AHAM + WCA” for short). By comparing the results of those experiments, the contributions of individual improvement strategies, as well as their synergistic effects among them, can be clearly identified. The results of the ablation study are shown in Table 2, where the PEs and EPEs of lithography images for all cases are presented.
As shown in Table 1 and Table 2, for single improvement strategy, the “Unet + WCA” reduces the PE values by 6675, 4412, 200, 3873, 1497 and 2597 in Cases 1, 3, 4, 6, 7 and 8, respectively, while decreases the EPE values by 0.8691, 1.0750, 0.2364, 2.0088, 1.5594, 0.1876 in same cases, respectively. With the same number of training epochs, it outperforms “Unet” in SRAF insertion, indicating that the WCA algorithm accelerates the learning of key parameters and improves the training efficiency. Notably, in Cases 7 and 9, “Unet” fails to achieve effective SRAF insertion while “Unet + WCA” succeeds, demonstrating that the WCA algorithm enables SRAF insertion across diverse masks and enhances its generalization. The “Unet + AHAM” achieves lower PE and EPE values than both traditional “Unet” and “Unet + WCA” in most cases. The gain comes from the fact that the AHAM enhances the extraction ability of key features and the correlation information between main patterns and SRAF parameters.
For the joint improvement strategy, “Unet + AHAM + WCA” obtains the lowest PE and EPE values in Cases 1, 2, 6, 7, 8, and 9 than the other methods. This finding indicates that the synergy effect between the AHAM and the learning rate adjustment can further improve the prediction results. Although the PE and EPE values of “Unet + AHAM + WCA” are higher than the “Unet + AHAM” method in Cases 3, 4, and 5, its overall performance is still superior. Thus, these ablation experiments fully verify the effectiveness of the AHAM and WCA algorithm, as well as the benefit of jointly using both strategies.

4.3. Comparison with Other Methods

To further demonstrate the merits of the proposed method, some comparative experiments are conducted with several popular neural networks, including the fully convolutional network (FCN) [38], generative adversarial network (GAN) [39], conditional generative adversarial network (CGAN) [40], and attention Unet (AUnet) [41]. The results are listed in Table 3.
As shown in Table 3, the proposed method results in slightly higher PE and EPE values than the CGAN method in Cases 3, 4, 5, and 6. However, it achieves the optimal performance in all other scenarios, and the lowest average PE and EPE among all methods. In Cases 1, 2, 7, 8, and 9, the proposed method obtained PE values of 26,994, 29,690, 6699, 3072, and 43,694, respectively. These results demonstrate its superior performance compared to all other methods. These results exhibit the superiority of the predicted SRAFs obtained by the proposed method. In view of this superior performance, we believe the proposed method successfully addresses the inherent limitations of several popular neural networks. FCN lacks a mechanism to balance global and local features, which leads to insufficient SRAF prediction accuracy due to spatial information loss. GANs and CGANs suffer from the challenges of unstable training and mode collapse, which impair the generalization capability of SRAF predictions. Furthermore, AUnet relies on a single attention mechanism and cannot integrate global and local information in mask feature maps.

5. Conclusions

This paper proposed a novel deep-learning framework with a two-stage Unet architecture for rapidly predicting the key parameters of Manhattan SRAFs. The first stage of the proposed network was used to predict the centroid coordinates of SRAFs, while the second stage, with a dual-channel architecture, was designed to predict their dimensional parameters of SRAFs. The AHAM was introduced to dynamically adjust the weighting ratio between the global and local information in mask feature maps, thereby enhancing the network’s ability to capture the critical features and improving prediction accuracy. Additionally, the WCA algorithm was adopted, which significantly improved the stability and convergence rate of the training process. Experimental results demonstrated that the proposed method could accurately predict the SRAFs’ positions and sizes across multiple test cases, and the generated SRAFs can notably improve lithography imaging quality. The mean PE decreased from 25,776.44 to 15,203.33, while the mean EPE reduced from 5.8367 to 3.5283.

Author Contributions

Writing—original draft preparation, methodology, investigation, validation, software, M.L.; validation, investigation, data curation, L.M.; methodology, resources, writing—review and editing, L.D.; conceptualization, methodology, writing—review and editing, project administration, investigation, supervision, X.M. All authors have read and agreed to the published version of the manuscript.

Funding

National Natural Science Foundation of China (62374016, 62274181).

Data Availability Statement

The original contributions presented in the study are included in the article; further inquiries can be directed to the corresponding author.

Conflicts of Interest

The authors declare no conflicts of interest.

Appendix A

Table A1. Hyperparameters of the network structure of Unet1.
ModuleInput Feature Map SizeOutput Feature Map SizeConvolution Parameters (Kernel/Stride/Padding)Padding Mode
1Conv_block1 × 1024 × 102432 × 1024 × 10243 × 3/1/1zeros
2AHAM32 × 1024 × 102432 × 1024 × 1024
3Down-sampling32 × 1024 × 102432 × 512 × 5123 × 3/2/1zeros
4Conv_block32 × 512 × 51264 × 512 × 5123 × 3/1/1zeros
5AHAM64 × 512 × 51264 × 512 × 512
6Down-sampling64 × 512 × 51264 × 256 × 2563 × 3/2/1zeros
7Conv_block64 × 256 × 256128 × 256 × 2563 × 3/1/1zeros
8AHAM128 × 256 × 256128 × 256 × 256
9Down-sampling128 × 256 × 256128 × 128 × 1283 × 3/2/1zeros
10Conv_block128 × 128 × 128256 × 128 × 1283 × 3/1/1zeros
11AHAM256 × 128 × 128256 × 128 × 128
12Down-sampling256 × 128 × 128256 × 64 × 643 × 3/2/1zeros
13Conv_block256 × 64 × 64512 × 64 × 643 × 3/1/1zeros
14AHAM512 × 64 × 64512 × 64 × 64
15Up-samling512 × 64 × 64256 × 128 × 1283 × 3/2/1 (ConvTranspose)zeros
fused with layer 11 512 × 128 × 128
16AHAM512 × 128 × 128512 × 128 × 128
17Conv_block512 × 128 × 128256 × 128 × 1283 × 3/1/1zeros
18Up-samling256 × 128 × 128128 × 256 × 2563 × 3/2/1 (ConvTranspose)zeros
fused with layer 8 256 × 256 × 256
19AHAM256 × 256 × 256256 × 256 × 256
20Conv_block256 × 256 × 256128 × 256 × 2563 × 3/1/1zeros
21Up-samling128 × 256 × 25664 × 512 × 5123 × 3/2/1 (ConvTranspose)zeros
fused with layer 5 128 × 512 × 512
22AHAM128 × 512 × 512128 × 512 × 512
23Conv_block128 × 512 × 51264 × 512 × 5123 × 3/1/1zeros
24Up-samling64 × 512 × 51232 × 1024 × 10243 × 3/2/1 (ConvTranspose)zeros
fused with layer 2 64 × 1024 × 1024
25AHAM64 × 1024 × 102464 × 1024 × 1024
26Conv_block64 × 1024 × 102432 × 1024 × 10243 × 3/1/1zeros
27Conv32 × 1024 × 10241 × 1024 × 10243 × 3/1/1zeros

Appendix B

Table A2. Hyperparameters of the network structure of Unet2.
ModuleInput Feature Map SizeOutput Feature Map SizeConvolution Parameters (Kernel/Stride/Padding)Padding Mode
1Conv_block2 × 1024 × 102432 × 1024 × 10243 × 3/1/1zeros
2AHAM32 × 1024 × 102432 × 1024 × 1024
3Down-sampling32 × 1024 × 102432 × 512 × 5123 × 3/2/1zeros
4Conv_block32 × 512 × 51264 × 512 × 5123 × 3/1/1zeros
5AHAM64 × 512 × 51264 × 512 × 512
6Down-sampling64 × 512 × 51264 × 256 × 2563 × 3/2/1zeros
7Conv_block64 × 256 × 256128 × 256 × 2563 × 3/1/1zeros
8AHAM128 × 256 × 256128 × 256 × 256
9Down-sampling128 × 256 × 256128 × 128 × 1283 × 3/2/1zeros
10Conv_block128 × 128 × 128256 × 128 × 1283 × 3/1/1zeros
11AHAM256 × 128 × 128256 × 128 × 128
12Down-sampling256 × 128 × 128256 × 64 × 643 × 3/2/1zeros
13Conv_block256 × 64 × 64512 × 64 × 643 × 3/1/1zeros
14AHAM512 × 64 × 64512 × 64 × 64
15Up-samling512 × 64 × 64256 × 128 × 1283 × 3/2/1 (ConvTranspose)zeros
fused with layer 11 512 × 128 × 128
16AHAM512 × 128 × 128512 × 128 × 128
17Conv_block512 × 128 × 128256 × 128 × 1283 × 3/1/1zeros
18Up-samling256 × 128 × 128128 × 256 × 2563 × 3/2/1 (ConvTranspose)zeros
fused with layer 8 256 × 256 × 256
19AHAM256 × 256 × 256256 × 256 × 256
20Conv_block256 × 256 × 256128 × 256 × 2563 × 3/1/1zeros
21Up-samling128 × 256 × 25664 × 512 × 5123 × 3/2/1 (ConvTranspose)zeros
fused with layer 5 128 × 512 × 512
22AHAM128 × 512 × 512128 × 512 × 512
23Conv_block128 × 512 × 51264 × 512 × 5123 × 3/1/1zeros
24Up-samling64 × 512 × 51232 × 1024 × 10243 × 3/2/1 (ConvTranspose)zeros
fused with layer 2 64 × 1024 × 1024
25AHAM64 × 1024 × 102464 × 1024 × 1024
26Conv_block64 × 1024 × 102432 × 1024 × 10243 × 3/1/1zeros
27Conv32 × 1024 × 10242 × 1024 × 10243 × 3/1/1zeros

References

  1. Chen, Q.; Mao, Z.; Yu, S.; Wu, W. Sub-resolution-assist-feature placement study to dense patterns in advanced lithography process. In Proceedings of the Semiconductor Technology International Conference, Shanghai, China, 13–14 March 2016; pp. 1–3. [Google Scholar]
  2. Beylier, C.; Martin, N.; Farys, V.; Foussadier, F.; Yesilada, E.; Robert, F.; Baron, S.; Dover, R.; Liu, H.-Y. Demonstration of an effective flexible mask optimization (FMO) flow. In Proceedings of the Optical Microlithography XXV, San Jose, CA, USA, 12–16 February 2012; Volume 8326, p. 832616. [Google Scholar]
  3. Su, X.; Gao, P.; Wei, Y.; Shi, W. SRAF rule extraction and insertion based on inverse lithography technology. In Proceedings of the Optical Microlithography XXXII, San Jose, CA, USA, 24–28 February 2012; Volume 10961, p. 109610P. [Google Scholar]
  4. Ping, Y.; McGowan, S.; Gong, Y.; Foong, Y.M.; Liu, J.; Qiu, J.; Shu, V.; Yan, B.; Ye, J.; Li, P.; et al. Process window enhancement using advanced RET techniques for 20nm contact layer. In Proceedings of the Optical Microlithography XXVII, San Jose, CA, USA, 23–27 February 2014; Volume 9052, p. 90521N. [Google Scholar]
  5. Viswanathan, R.; Azpiroz, J.T.; Selvam, P. Process optimization through model based SRAF printing prediction. In Proceedings of the Optical Microlithography XXV, San Jose, CA, USA, 12–16 February 2012; Volume 8326, p. 83261A. [Google Scholar]
  6. Chen, A.; Hansen, S.; Moers, M.; Shieh, J.; Engelen, A.; van Ingen Schenau, K.; Tseng, S. The contact hole solutions for future logic technology nodes. In Proceedings of the Quantum Optics, Optical Data Storage, and Advanced Microlithography, Beijing, China, 11–15 November 2007; Volume 6827, p. 68271O. [Google Scholar]
  7. Jun, J.; Park, M.; Park, C.; Yang, H.; Yim, D.; Do, M.; Lee, D.; Kim, T.; Choi, J.; Luk-Pat, G. Layout optimization with assist features placement by model based rule tables for 2x node random contact. In Proceedings of the Design-Process-Technology Co-optimization for Manufacturability IX, San Jose, CA, USA, 22–26 February 2015; Volume 9427, p. 94270D. [Google Scholar]
  8. Kodama, C.; Kotani, T.; Nojima, S.; Mimotogi, S. Sub-Resolution Assist Feature Arranging Method and Computer Program Product and Manufacturing Method of Semiconductor Device. U.S. Patent US20110294239A1, 19 August 2014. [Google Scholar]
  9. Yenikaya, B.; Wong, A.K.K.; Singh, V.K.; Sezginer, A. Model-based assist feature generation. In Proceedings of the Design for Manufacturability through Design-Process Integration, San Jose, CA, USA, 25 February–2 March 2007; Volume 6521, p. 73792Z. [Google Scholar]
  10. Capodieci, L.; Cain, J.P.; Song, J.; Choi, J.; Park, C.; Yang, H.; Kang, D.; Oh, M.; Park, M.; Moon, J. The new OPC method for obtaining the stability of MBAF OPC. In Proceedings of the Design-Process-Technology Co-optimization for Manufacturability XI, San Jose, CA, USA, 26 February–2 March 2017; Volume 10148, p. 1014813. [Google Scholar]
  11. Sakajiri, K.; Horiuchi, T.; Tritchkov, A.; Granik, Y. Model-based SRAF insertion through pixel-based mask optimization at 32nm and beyond. In Proceedings of the Photomask and Next-Generation Lithography Mask Technology XV, Yokohama, Japan, 16–18 April 2008; Volume 7028, p. 702811. [Google Scholar]
  12. Xu, X.; Matsunawa, T.; Nojima, S.; Kodama, C.; Kotani, T.; Pan, D.Z. A Machine Learning Based Framework for Sub-Resolution Assist Feature Generation. In Proceedings of the ACM, Santa Rosa, CA, USA, 3–6 April 2016; pp. 161–168. [Google Scholar]
  13. Geng, H.; Yang, H.; Ma, Y.; Mitra, J.; Yu, B. SRAF insertion via supervised dictionary learning. IEEE Trans. Comput.-Aided Des. Integr. Circuits Syst. 2020, 39, 2849–2859. [Google Scholar] [CrossRef]
  14. Liu, G.-T.; Tai, W.-C.; Lin, Y.-T.; Jiang, I.H.-R.; Shiely, J.P.; Cheng, P.-J. Sub-Resolution Assist Feature Generation with Reinforcement Learning and Transfer Learning. In Proceedings of the 2022 IEEE/ACM International Conference On Computer Aided Design (ICCAD), San Diego, CA, USA, 29 October–3 November 2022; pp. 1–9. [Google Scholar]
  15. Ciou, W.; Hu, T.; Tsai, Y.Y.; Hsuan, T.; Yang, E.; Yang, T.H.; Chen, K.C. SRAF placement with generative adversarial network. In Proceedings of the Optical Microlithography XXXIV, Online, 22–27 February 2021; Volume 11613, p. 1161305. [Google Scholar]
  16. Wang, S.; Su, J.; Zhang, Q.; Fong, W.; Sun, D.; Baron, S.; Zhang, C.; Lin, C.; Chen, B.D.; Howell, R.C. Machine learning assisted SRAF placement for full chip. In Proceedings of the Photomask Technology 2017, Monterey, CA, USA, 11–14 September 2017; Volume 10451, p. 104510D. [Google Scholar]
  17. Alawieh, M.B.; Lin, Y.; Zhang, Z.; Li, M.; Pan, D.Z. GAN-SRAF: Sub-Resolution Assist Feature Generation using Generative Adversarial Networks. IEEE Trans. Comput.-Aided Des. Integr. Circuits Syst. 2021, 40, 373–385. [Google Scholar] [CrossRef]
  18. Wei, Y.; Brainard, R.L. Advanced Processes for 193-nm Immersion Lithography; SPIE Press: Bellingham, WA, USA, 2009. [Google Scholar]
  19. Wei, Y.Y. Advanced Lithography: Theory and Application of Very Large Scale Integrated Circuit; Science Press: Beijing, China, 2016. [Google Scholar]
  20. Li, F.; Mu, Y.; Fan, J.; Yu, C.; Liu, R.; Sun, S.; Wang, C.; Shi, J.; Cao, Q. Balancing mask manufacturability and image quality with inverse lithography: A study on variable fracture sizes. In Proceedings of the Optical and EUV Nanolithography XXXVII, Bellingham, WA, USA, 25 February–1 March 2024; Volume 12953, p. 1295310. [Google Scholar]
  21. Ai, F.; Su, X.; Dong, L.; Fan, T.; Wang, J.; Wei, Y. Rect-SRAF method in inverse lithography technology. Opt. Express 2025, 33, 30060–30072. [Google Scholar] [CrossRef] [PubMed]
  22. Ronneberger, O.; Fischer, P.; Brox, T. U-Net: Convolutional Networks for Biomedical Image Segmentation. In Proceedings of the Medical Image Computing and Computer-Assisted Intervention, Munich, Germany, 5–9 October 2015; Volume 9351, pp. 234–241. [Google Scholar]
  23. Vaswani, A.; Shazeer, N.; Parmar, N.; Uszkoreit, J.; Jones, L.; Gomez, A.N.; Kaiser, Ł.; Polosukhin, I. Attention Is All You Need. arXiv 2023, arXiv:1706.03762. [Google Scholar] [PubMed]
  24. Huang, W.; Chen, J.; Cai, Y.; Hu, X. Hierarchical Hybrid Neural Networks with Multi-Head Attention for Document Classification. Int. J. Data Warehous. Min. 2022, 18, 268–283. [Google Scholar] [CrossRef]
  25. Liu, Z.; Lin, Y.; Cao, Y.; Hu, H.; Wei, Y.; Zhang, Z.; Lin, S.; Guo, B. Swin Transformer: Hierarchical Vision Transformer using Shifted Windows. arXiv 2021, arXiv:2103.14030. [Google Scholar] [CrossRef]
  26. Luong, M.T.; Pham, H.; Manning, C.D. Effective Approaches to Attention-based Neural Machine Translation. arXiv 2015, arXiv:1508.04025. [Google Scholar] [CrossRef]
  27. Yang, J.; Li, C.; Zhang, P.; Dai, X.; Xiao, B.; Yuan, L.; Gao, J. Focal Self-attention for Local-Global Interactions in Vision Transformers. arXiv 2021, arXiv:2107.00641. [Google Scholar]
  28. Smith, L.N. Cyclical learning rates for training neural networks. In Proceedings of the 2017 IEEE Winter Conference on Applications of Computer Vision (WACV), Santa Rosa, CA, USA, 24–31 March 2017; IEEE: Piscataway, NJ, USA, 2017; pp. 464–472. [Google Scholar]
  29. Ge, R.; Kakade, S.M.; Kidambi, R.; Netrapalli, P. The step decay schedule: A near optimal, geometrically decaying learning rate procedure for least squares. In Proceedings of the 33rd Conference on Neural Information Processing Systems (NeurIPS 2019), Vancouver, BC, Canada, 8–14 December 2019; Volume 32. [Google Scholar]
  30. Kalra, D.S.; Barkeshli, M. Why Warmup the Learning Rate? Underlying Mechanisms and Improvements. arXiv 2024, arXiv:2406.09405. [Google Scholar] [CrossRef]
  31. Loshchilov, I.; Hutter, F. SGDR: Stochastic Gradient Descent with Warm Restarts. arXiv 2017, arXiv:1608.03983. [Google Scholar] [CrossRef]
  32. Niu, Z.; Li, H. Research and analysis of threshold segmentation algorithms in image processing. J. Phys. Conf. Ser. 2019, 1237, 022122. [Google Scholar] [CrossRef]
  33. He, L.; Ren, X.; Gao, Q.; Zhao, X.; Yao, B.; Chao, Y. The connected-component labeling problem: A review of state-of-the-art algorithms. Pattern Recognit. 2017, 70, 25–43. [Google Scholar] [CrossRef]
  34. Soille, P. Morphological Image Analysis: Principles and Applications. Sens. Rev. 1999, 28, 800–801. [Google Scholar]
  35. Ma, X.; Arce, G.R. Computational Lithography; John Wiley & Sons: Hoboken, NJ, USA, 2011. [Google Scholar]
  36. Ma, X.; Li, Y.; Dong, L. Mask optimization approaches in optical lithography based on a vector imaging model. J. Opt. Soc. Am. A 2012, 29, 1300–1312. [Google Scholar] [CrossRef] [PubMed]
  37. Pistor, T.V. Electromagnetic Simulation and Modeling with Applications in Lithography. Ph.D. Thesis, Doctor of Philosophy, University of California, Berkeley, CA, USA, 2001. [Google Scholar]
  38. Long, J.; Shelhamer, E.; Darrell, T. Fully Convolutional Networks for Semantic Segmentation. In Proceedings of the 2015 IEEE Conference on Computer Vision and Pattern Recognition, Boston, MA, USA, 7–12 June 2015; pp. 3431–3440. [Google Scholar]
  39. Goodfellow, I.J.; Pouget-Abadie, J.; Mirza, M.; Xu, B.; Warde-Farley, D.; Ozair, S.; Courville, A.; Bengio, Y. Generative adversarial nets. In Proceedings of the 28th International Conference on Neural Information Processing Systems, Montreal, QC, Canada, 3–8 December 2014; Volume 2, pp. 2672–2680. [Google Scholar]
  40. Mirza, M.; Osindero, S. Conditional Generative Adversarial Nets. arXiv 2014, arXiv:1411.1784. [Google Scholar] [CrossRef]
  41. Oktay, O.; Schlemper, J.; Le Folgoc, L.; Lee, M.; Heinrich, M.; Misawa, K.; Mori, K.; McDonagh, S.; Hammerla, N.Y.; Kainz, B.; et al. Attention U-Net: Learning Where to Look for the Pancreas. arXiv 2018, arXiv:1804.03999. [Google Scholar] [CrossRef]
Figure 1. The structure of the proposed two-stage Unet framework.
Micromachines 16 01301 g001
Figure 2. The structure of the Unet framework.
Micromachines 16 01301 g002
Figure 3. The structure of the AHAM module.
Micromachines 16 01301 g003
Figure 4. The change in learning rate with respect to the epoch number according to the WCA algorithm.
Micromachines 16 01301 g004
Figure 5. Example of the rectangular SRAFs inserted around the main pattern on the mask.
Micromachines 16 01301 g005
Figure 6. The architecture of the sub-network “Unet1”.
Micromachines 16 01301 g006
Figure 7. The architecture of the sub-network “Unet2”.
Micromachines 16 01301 g007
Figure 8. Simulation results for the proposed two-stage Unet method. From top to bottom, it shows 9 simulation cases with different layout patterns. From left to right, the columns illustrate the original mask pattern, the raw feature map output by Unet1, the post-processed feature map of Unet1, the feature map of the width channel output by Unet2, the feature map of the height channel outputted by Unet2, and the mask pattern including the predicted SRAFs, respectively.
Micromachines 16 01301 g008
Figure 9. The pixelated source pattern used for simulating the aerial images of the lithography system.
Micromachines 16 01301 g009
Figure 10. Lithography simulation results for the test set. From top to bottom, they show nine simulation cases with different layout patterns. From left to right, the columns show the original mask pattern, the aerial images of the original mask, the resist image of the original mask, the mask with inserted SRAFs (which were generated using the proposed method), the aerial images of the mask in column 4, and the resist image of the mask in column 4, respectively.
Micromachines 16 01301 g010
Table 1. The comparison of PEs and EPEs before and after inserting SRAFs for all testing layouts.
Case 1Case 2Case 3Case 4Case 5Case 6Case 7Case 8Case 9Mean
Original MaskPE51,91068,28420,38635454664229615,401880056,70225,776.44
EPE6.75917.15764.96734.19034.13484.07097.98809.16674.09525.8367
Mask with inserted SRAFsPE26,99429,69017,2373045441619836699307243,69415,203.33
EPE3.51483.11224.20003.59933.91493.51604.47463.20003.15573.5283
Table 2. The comparison of PEs and EPEs obtained by the four ablation experiments based on all testing layouts.
UnetUnet + WCAUnet + AHAMUnet + AHAM + WCA
PEEPEPEEPEPEEPEPEEPE
Case 151,9106.759145,2355.890036,6124.767226,9943.5148
Case 268,2847.157768,2847.157753,0455.560329,6903.1122
Case 320,3864.967315,9743.892310,2642.501017,2374.2000
Case 432273.814430273.578028723.394830453.5993
Case 542223.742945844.063843273.836044163.9149
Case 621353.785521463.805019893.526619833.5160
Case 715,2347.901511,3615.892683794.346066993.4746
Case 888009.166773037.607344154.599030723.2000
Case 946,4273.353143,8303.165543,7973.163243,6943.1557
Mean24,513.895.627622,416.005.005818,411.113.966015,203.333.5208
Table 3. The comparison of PEs and EPEs obtained by the proposed method and some other comparative methods.
Original
Mask
FCNGANCGANAUnetProposed Method
PEEPEPEEPEPEEPEPEEPEPEEPEPEEPE
Case 151,9106.759142,0395.473851,9106.759131,6894.126229,1763.799026,9943.5148
Case 268,2847.157765,2746.842168,2847.157750,3765.280536,5783.834229,6903.1122
Case 320,3864.967313,9813.406720,3864.967315,5463.788020,3864.967317,2374.2000
Case 435454.190331473.719935454.190327863.293134974.133630453.5993
Case 546644.134843393.846646644.134840823.618846944.161344163.9149
Case 622964.070921403.794322964.070918663.308522914.062119833.5160
Case 715,4017.988114,1497.338715,1217.842811,9936.220414,6287.587166993.4746
Case 888009.166774557.765688009.166752005.416774337.742730723.2000
Case 956,7024.095252,3113.778155,0983.979349,3853.566747,2713.414143,6943.1557
Mean25,776.445.836722,759.445.107325,567.115.087719,213.674.291018,439.334.855715,203.333.5283
Disclaimer/Publisher’s Note: The statements, opinions and data contained in all publications are solely those of the individual author(s) and contributor(s) and not of MDPI and/or the editor(s). MDPI and/or the editor(s) disclaim responsibility for any injury to people or property resulting from any ideas, methods, instructions or products referred to in the content.