
Beam Tilt Aberration Detection of the Seven-Unit Phased Fiber Laser Array


Abstract
1. Introduction
2. Principles
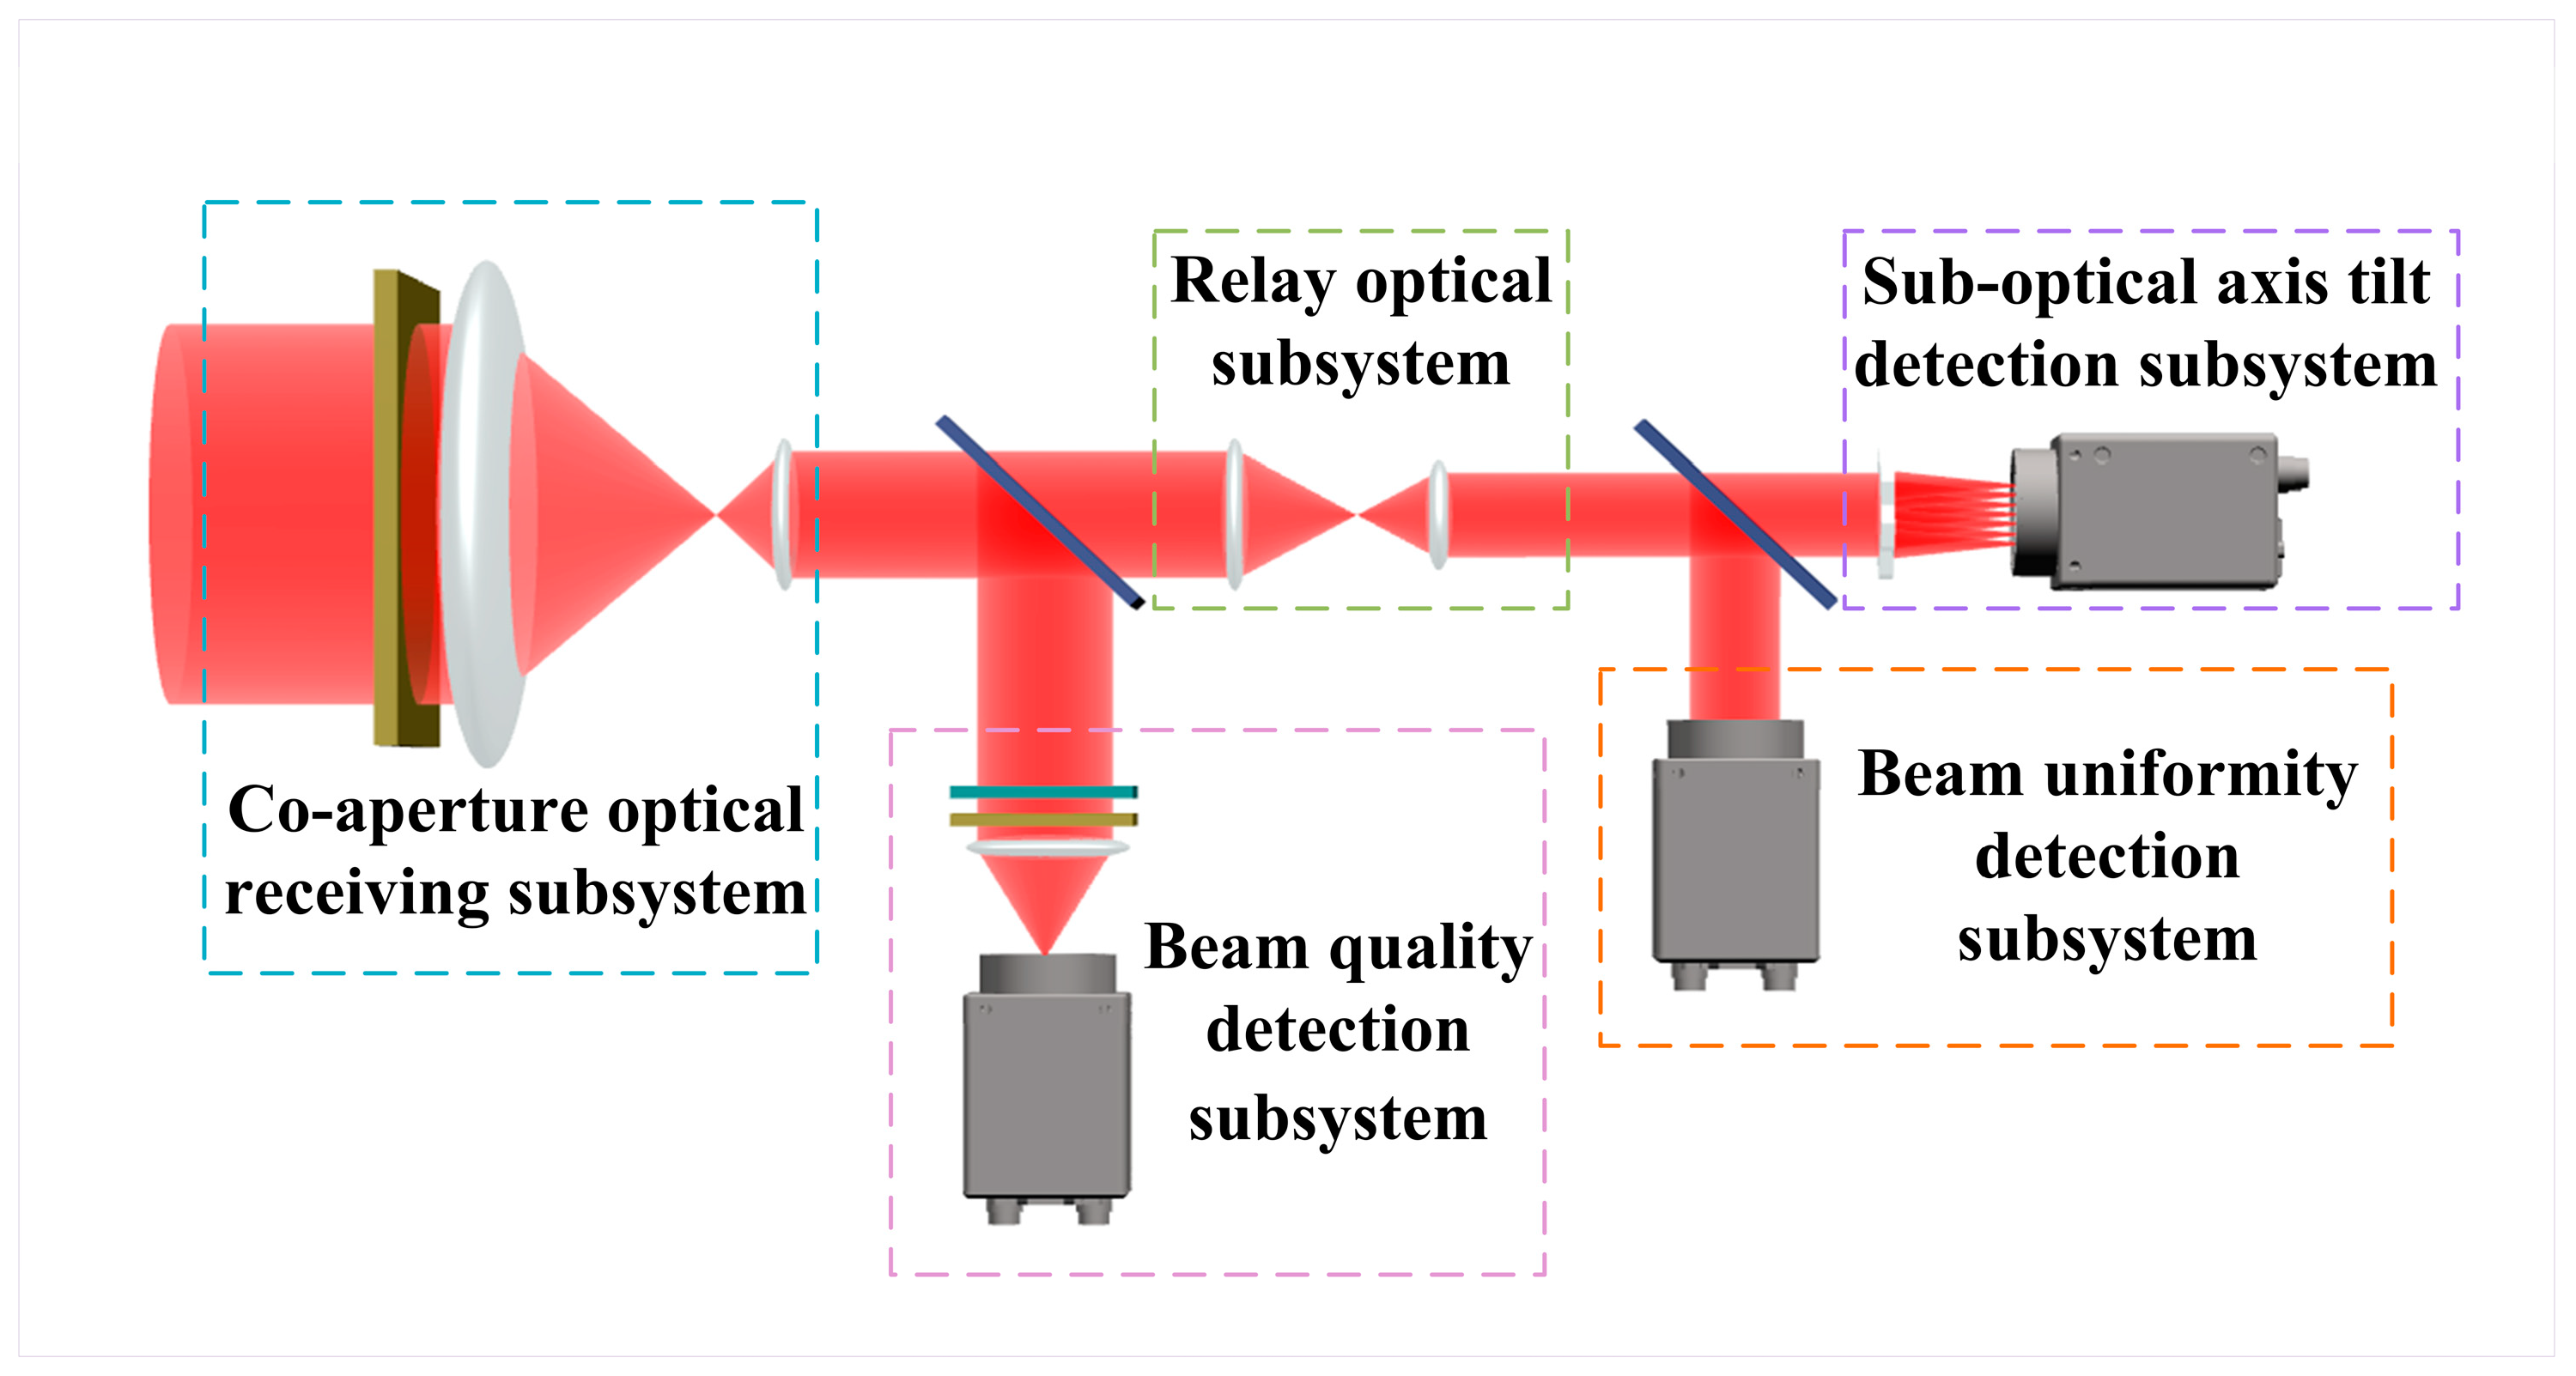
3. Analysis and Design of the Optical System
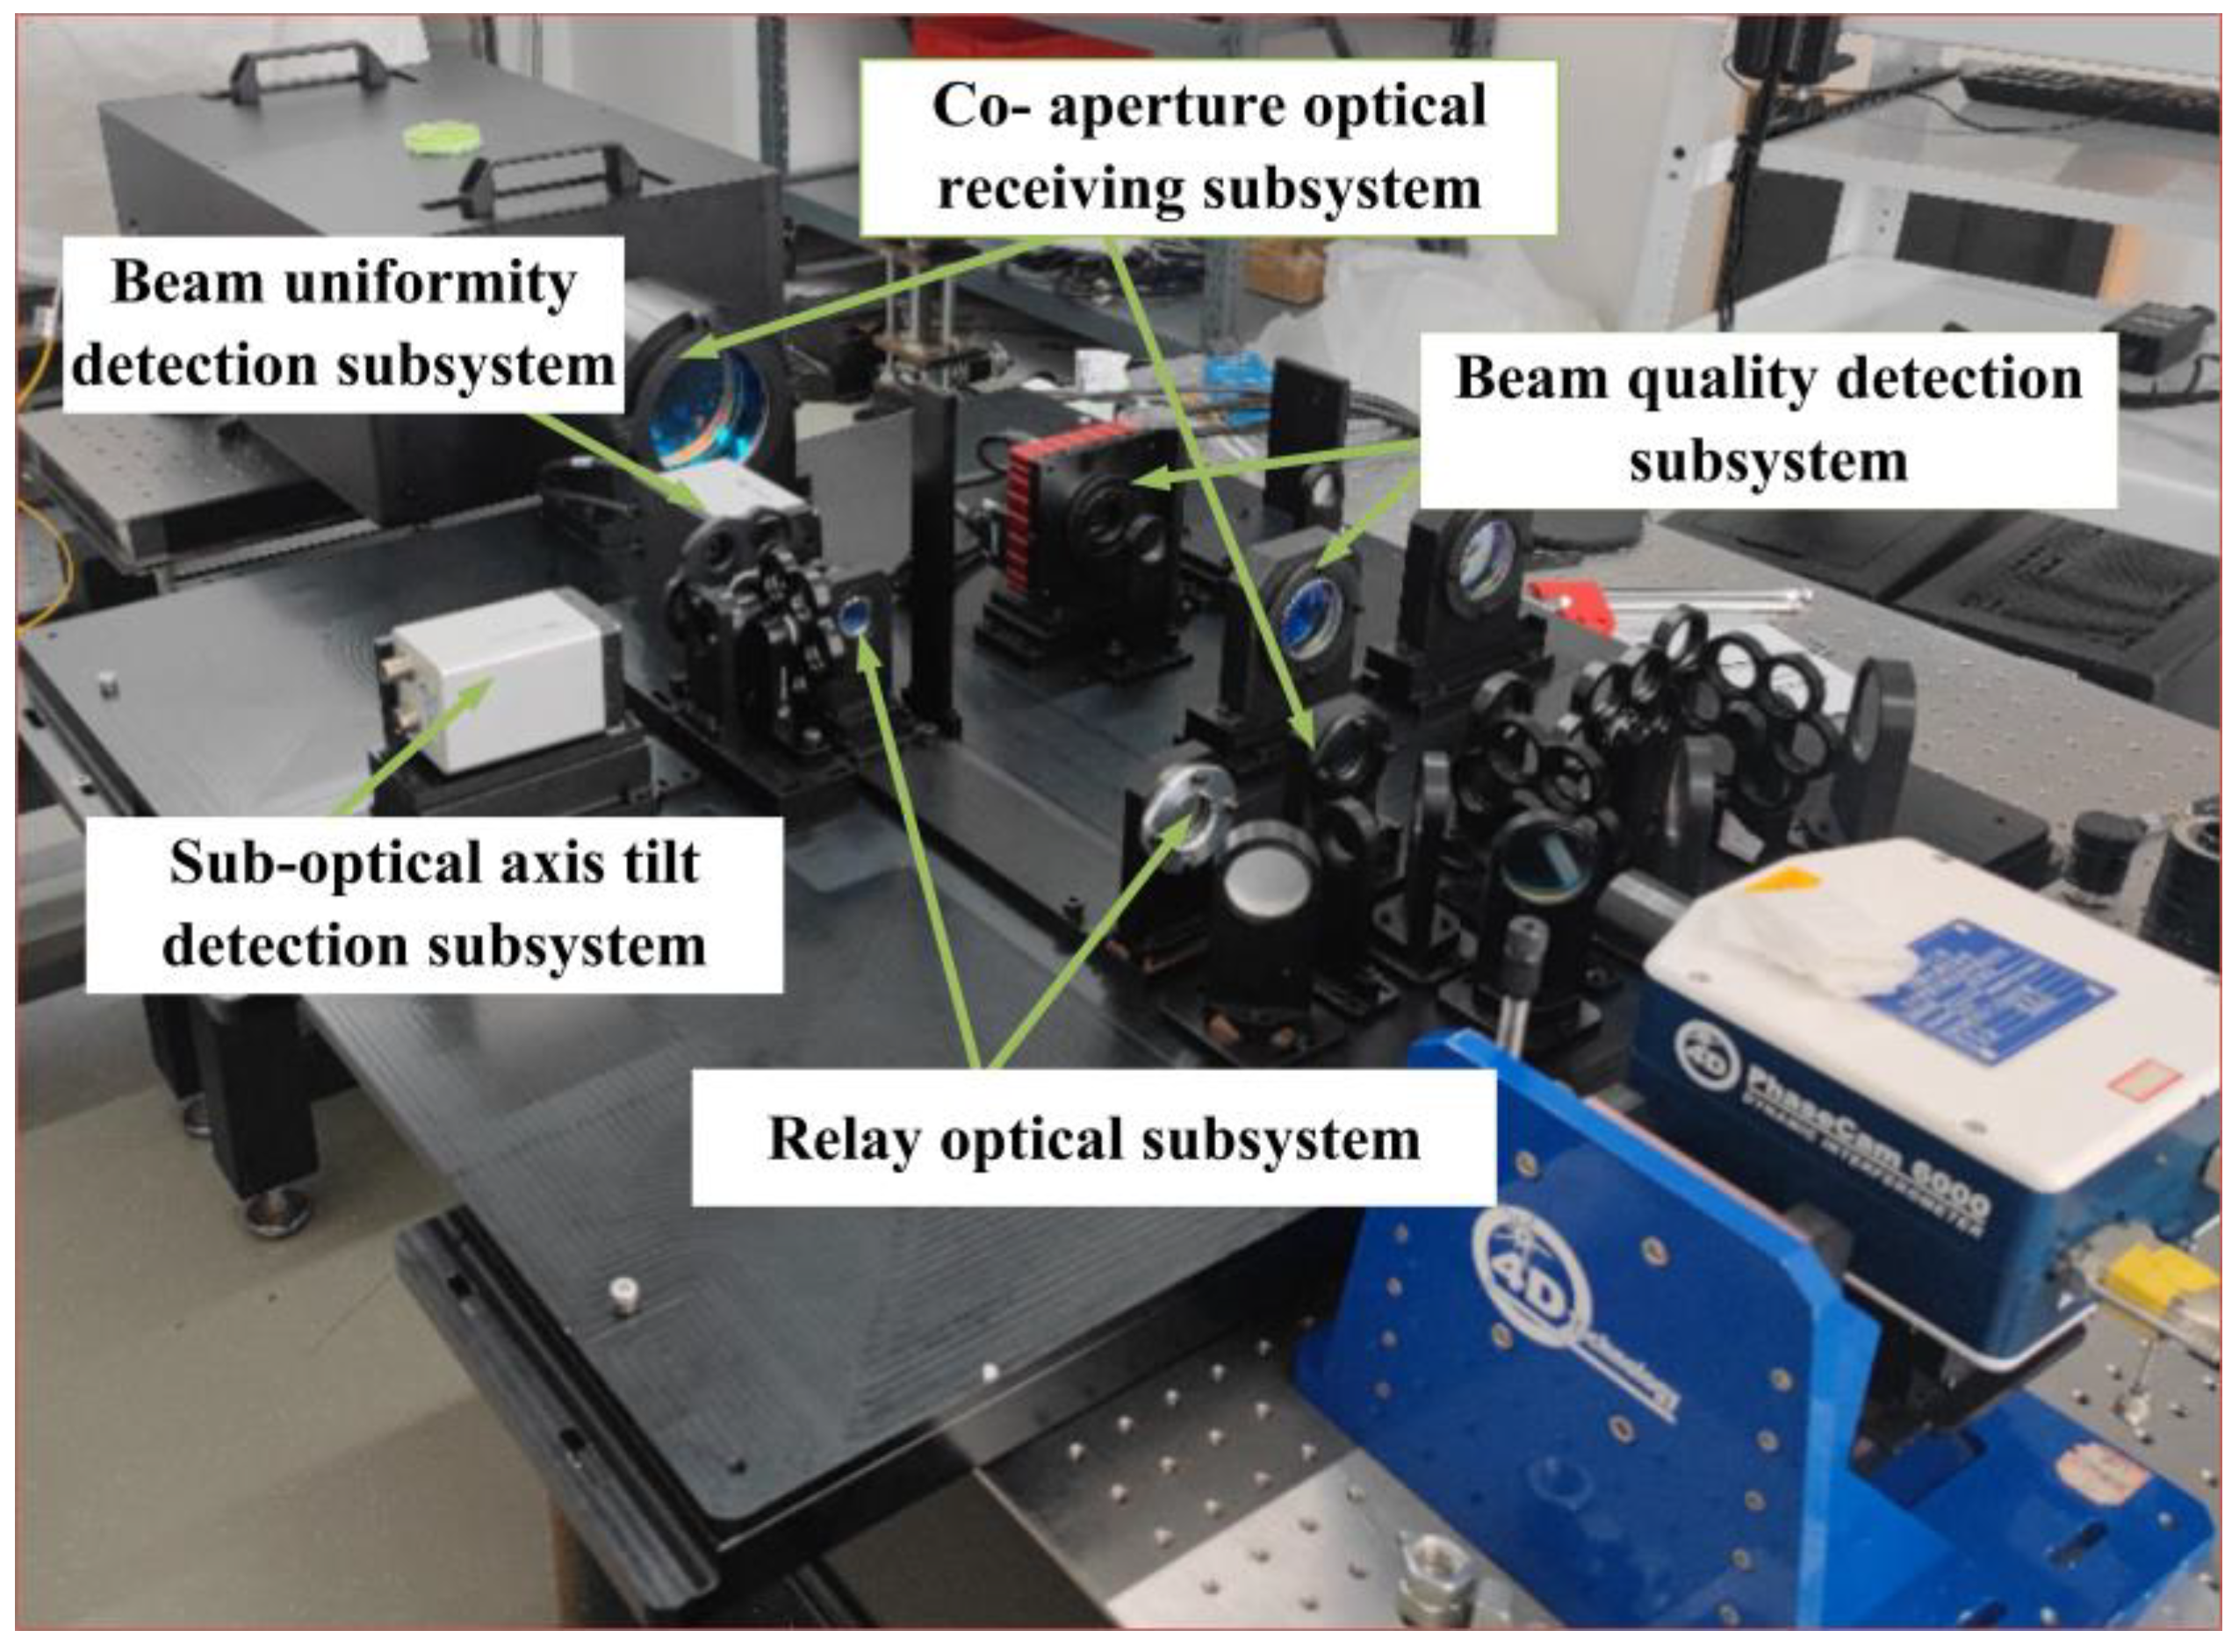
3.1. Co-Aperture Optical Receiving Subsystem Design
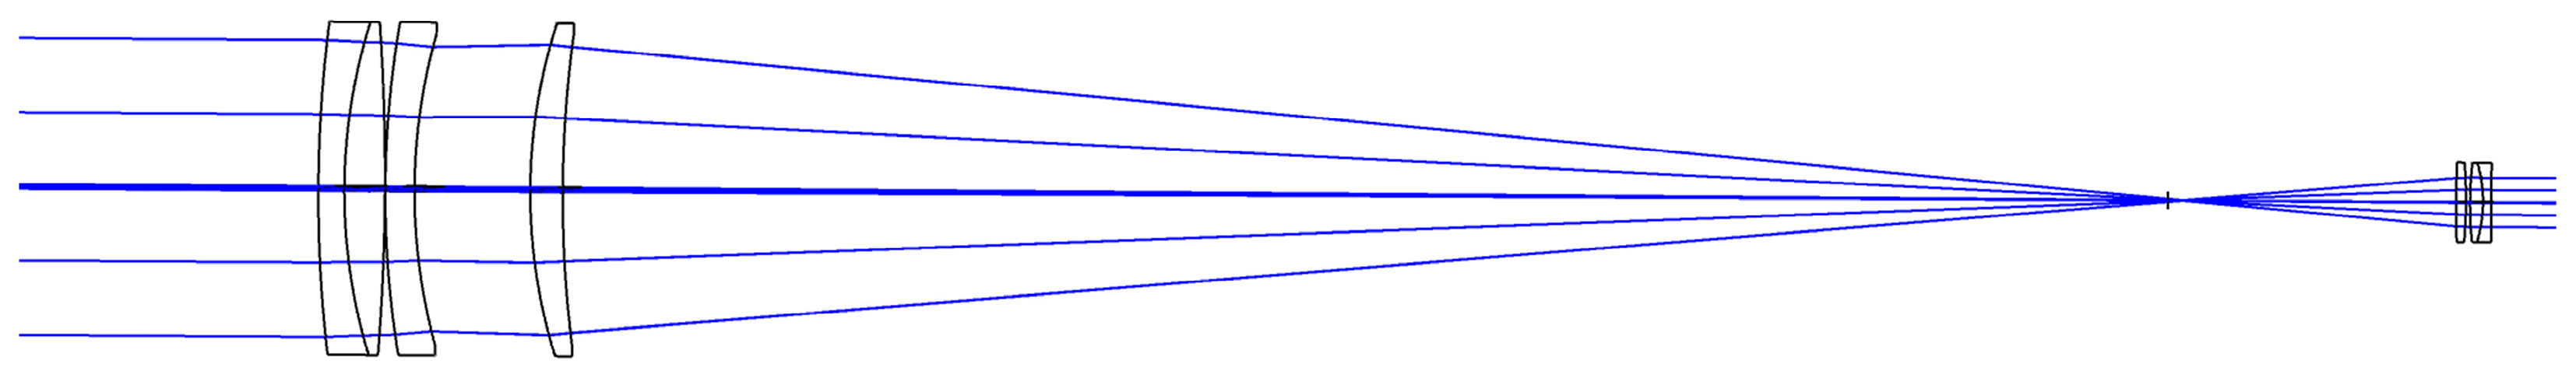
3.1.1. Co-Aperture Optical Receiving Subsystem Design
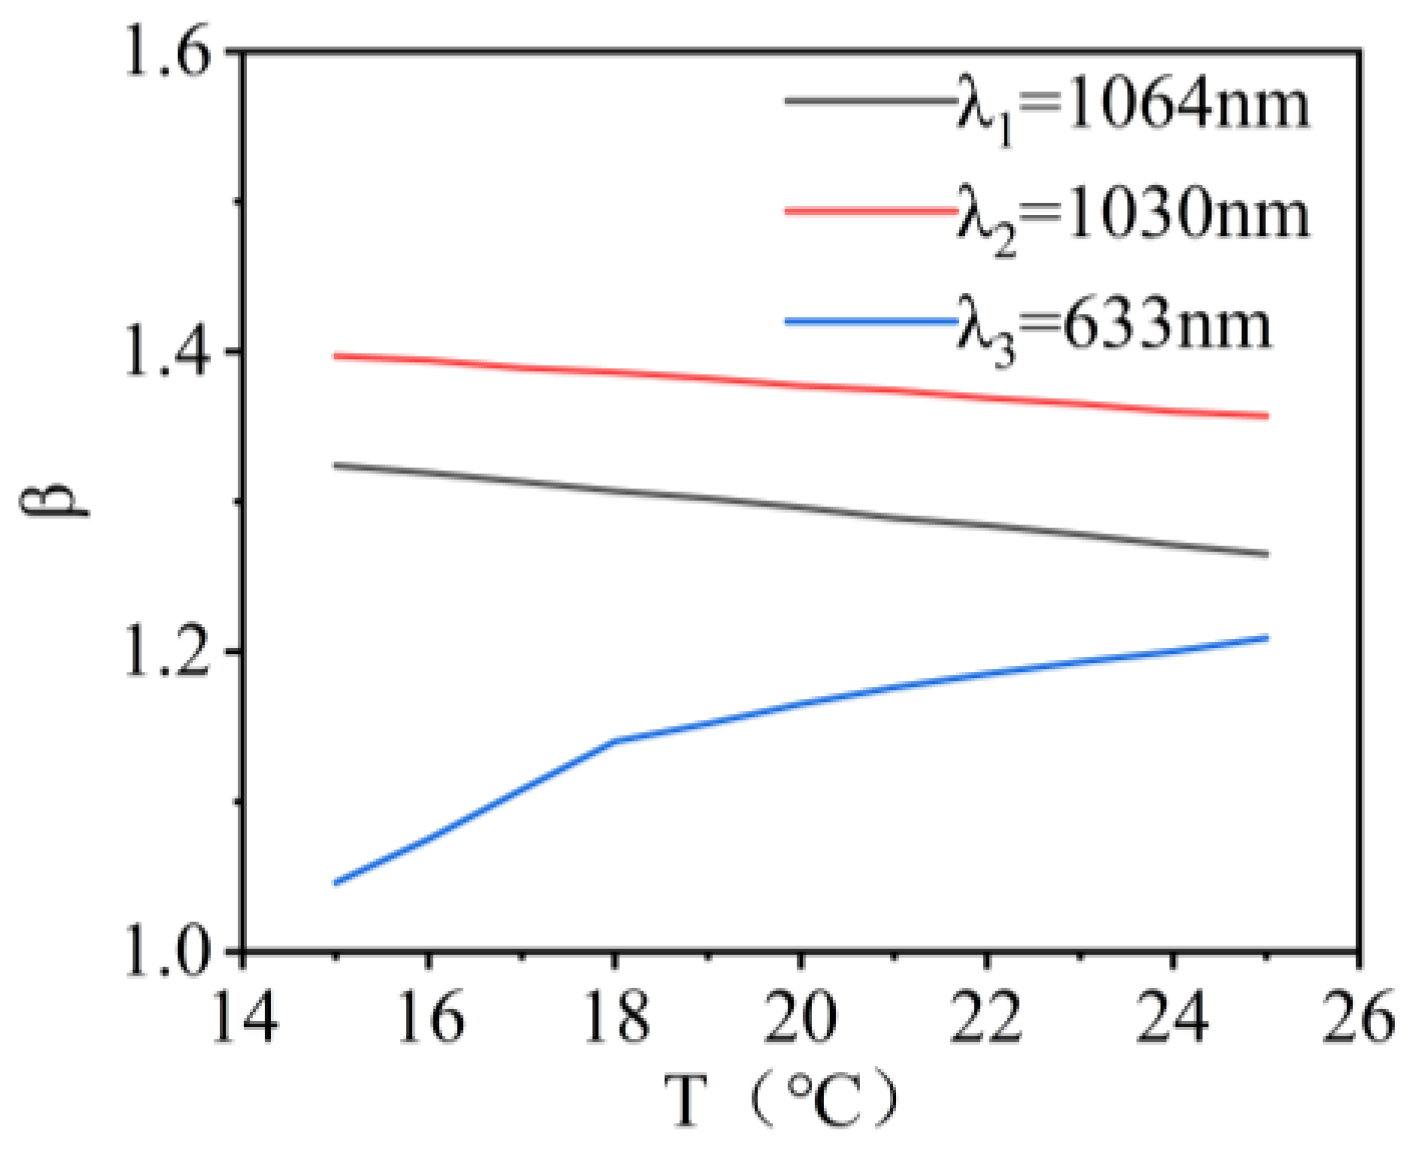
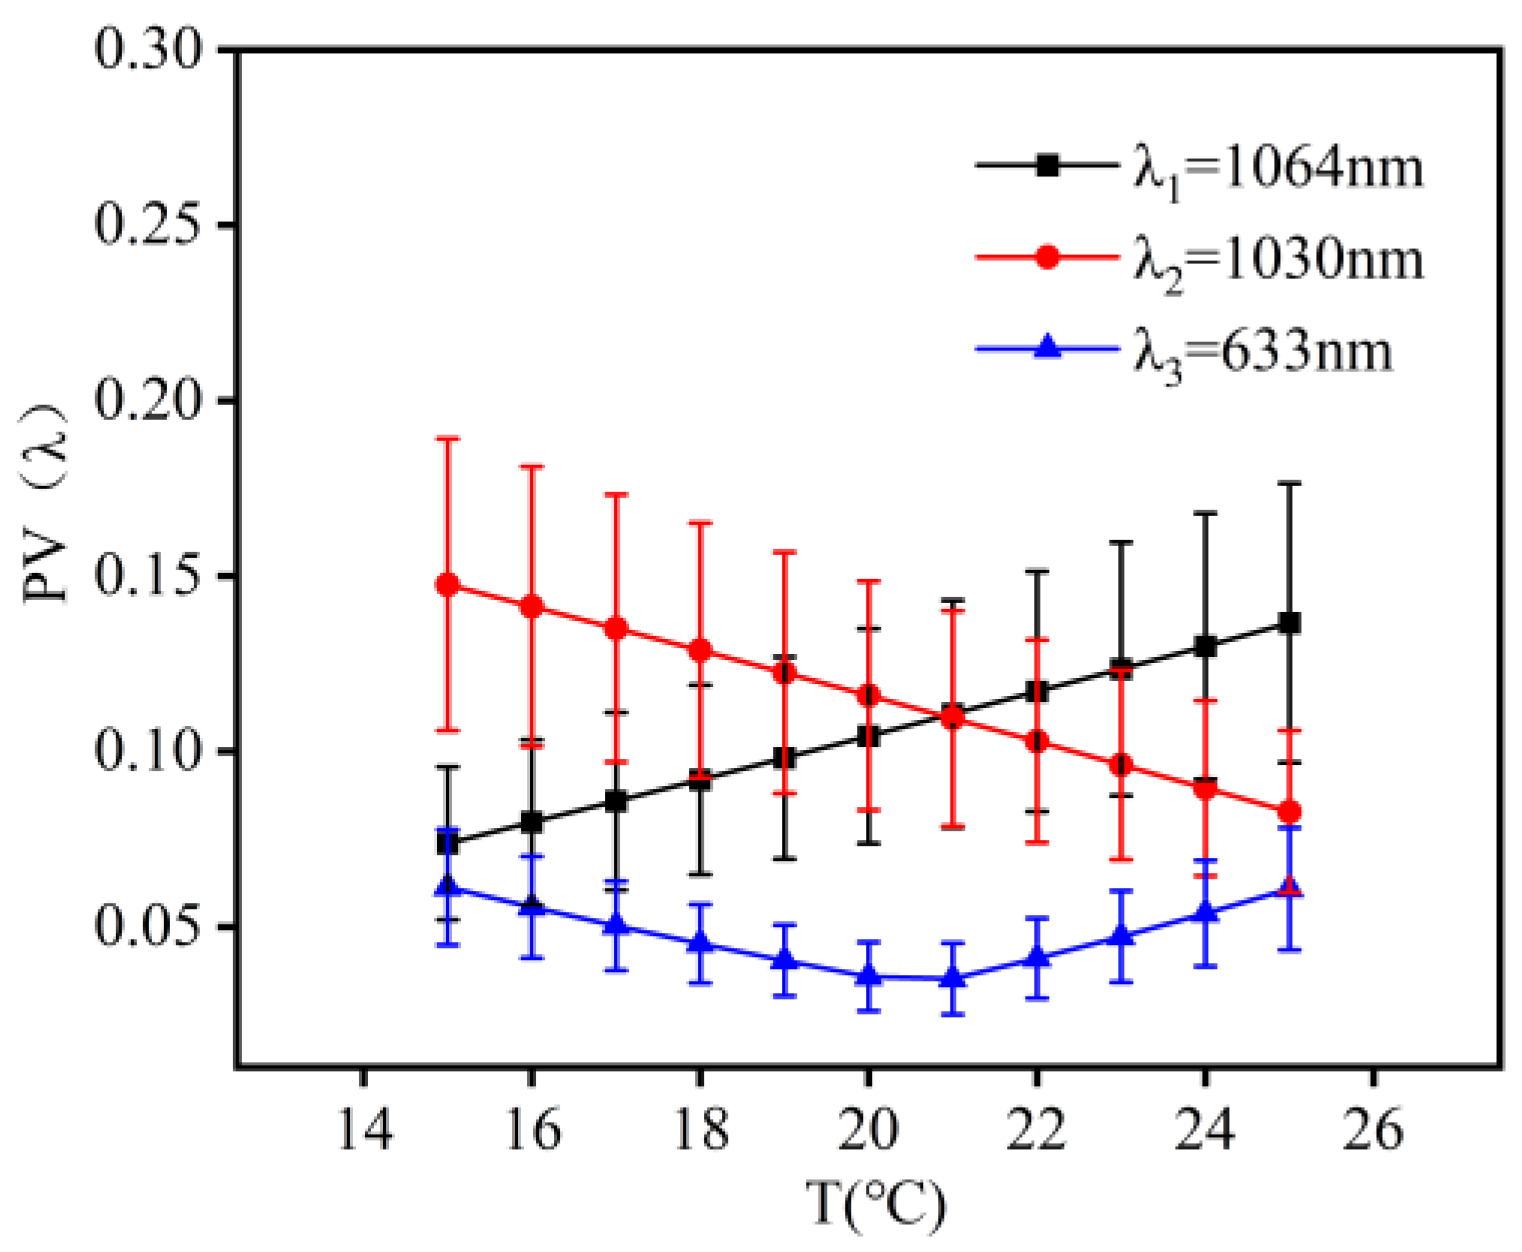
3.1.2. Image Quality Analysis of Co-Aperture Optical Receiving Subsystem
3.2. Relay Optical Subsystem Design
3.2.1. Relay Optical Subsystem Design
3.2.2. Image Quality Analysis of Relay Optical Subsystem
3.3. Suboptical Axis Tilt Detection Subsystem Design
3.4. Beam Uniformity Detection Subsystem Design
3.5. Beam Quality Detection Subsystem Design
4. Experimental Results
4.1. Experimental Principle
4.1.1. Principle of Absolute Calibration for Spherical Wavefront Using SHWFS
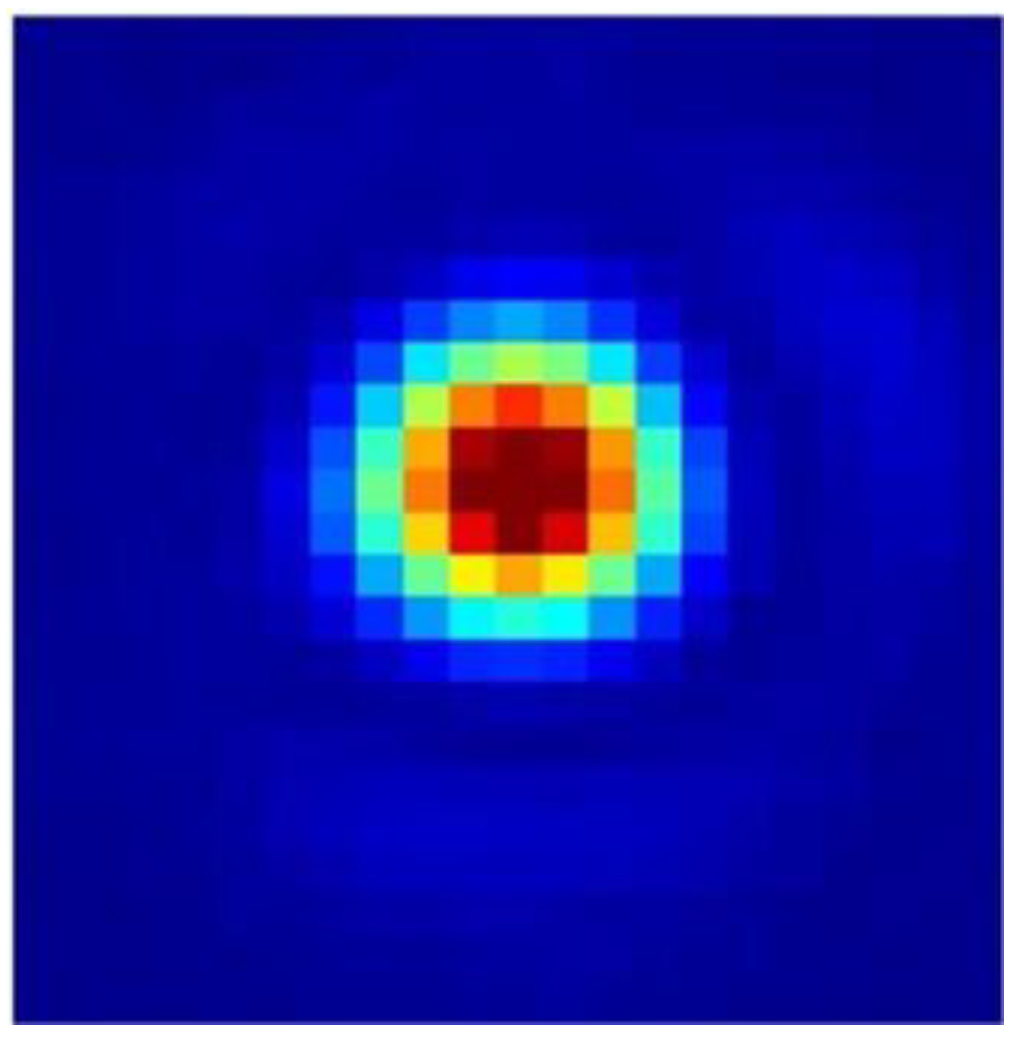
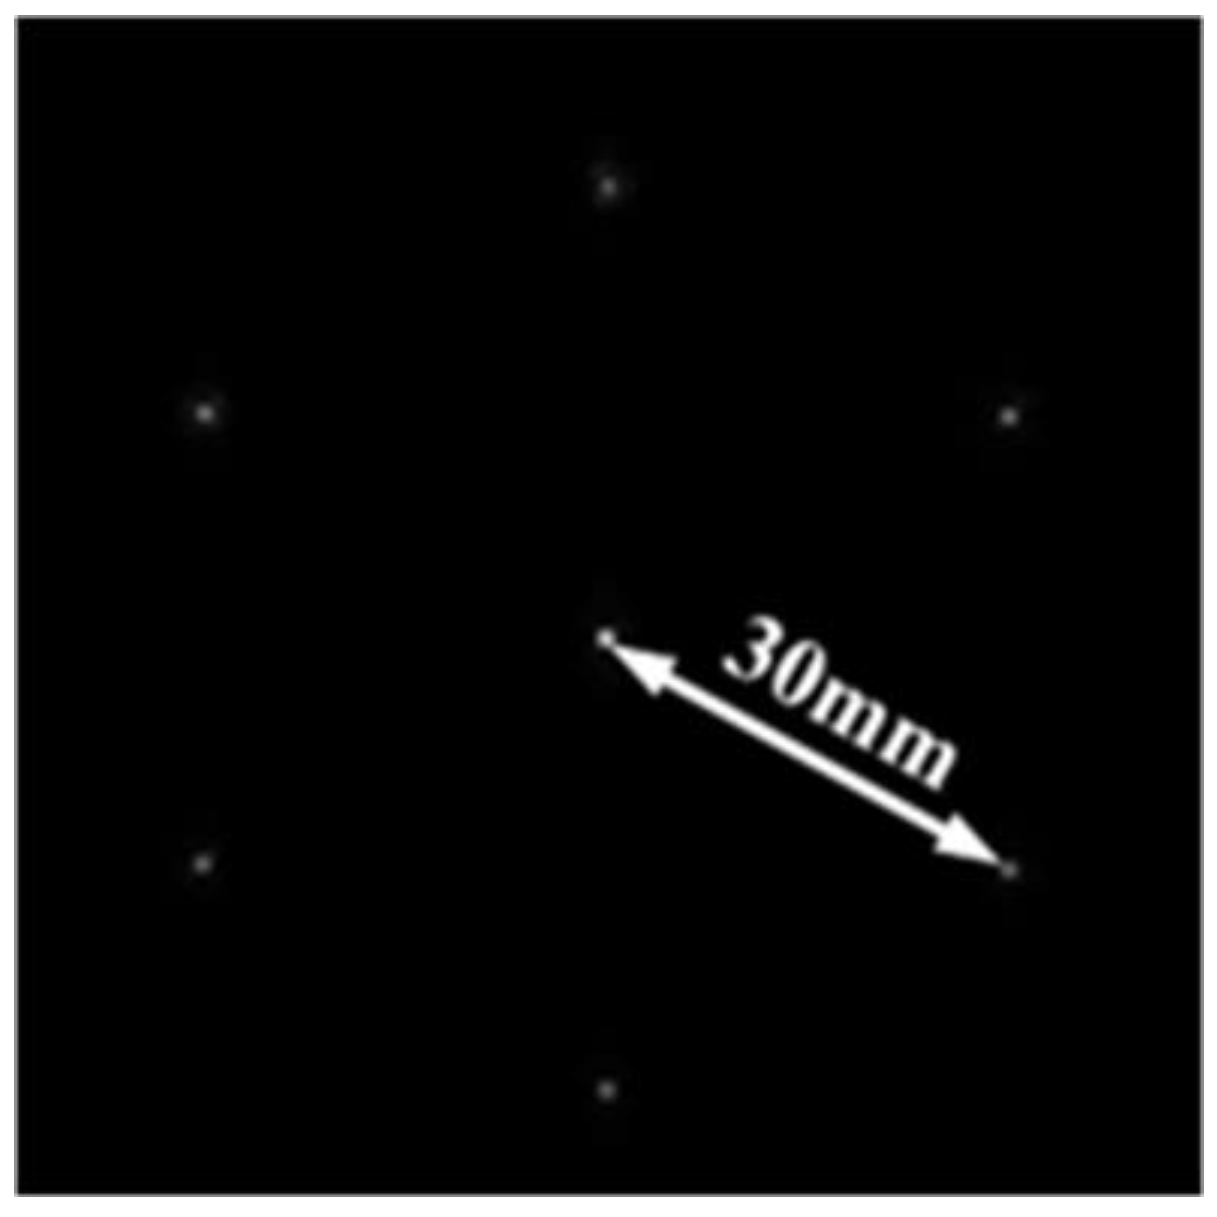
4.1.2. A Beam Direction Detection Method Based on Far-Field Light Spots
4.2. Experiment
5. Conclusions
Author Contributions
Funding
Data Availability Statement
Conflicts of Interest
References
- Zhu, J.; Zhou, P.; Ma, Y.; Xu, X.; Liu, Z. Power Scaling Analysis of Tandem-Pumped Yb-Doped Fiber Lasers and Amplifiers. Opt. Express 2011, 19, 18645. [Google Scholar] [CrossRef]
- Sukharev, M.; Roslyak, O.; Piryatinski, A. Second-Harmonic Generation in Nonlinear Plasmonic Lattices Enhanced by Quantum Emitter Gain Medium. J. Chem. Phys. 2021, 154, 084703. [Google Scholar] [CrossRef] [PubMed]
- Fan, Z.-W.; Qiu, J.-S.; Kang, Z.-J.; Chen, Y.-Z.; Ge, W.-Q.; Tang, X.-X. High Beam Quality 5 J, 200 Hz Nd:YAG Laser System. Light. Sci. Appl. 2017, 6, e17004. [Google Scholar] [CrossRef]
- Yu, C.X.; Augst, S.J.; Redmond, S.M.; Goldizen, K.C.; Murphy, D.V.; Sanchez, A.; Fan, T.Y. Coherent Combining of a 4 kW, Eight-Element Fiber Amplifier Array. Opt. Lett. 2011, 36, 2686. [Google Scholar] [CrossRef]
- Chang, H.; Chang, Q.; Xi, J.; Hou, T.; Su, R.; Ma, P.; Wu, J.; Li, C.; Jiang, M.; Ma, Y.; et al. First Experimental Demonstration of Coherent Beam Combining of More than 100 Beams. Photon. Res. 2020, 8, 1943. [Google Scholar] [CrossRef]
- Kallmann, U.; Lootze, M.; Mescheder, U. Simulative and Experimental Characterization of an Adaptive Astigmatic Membrane Mirror. Micromachines 2021, 12, 156. [Google Scholar] [CrossRef]
- Li, F.; Geng, C.; Li, X.; Qiu, Q. Co-Aperture Transceiving of Two Combined Beams Based on Adaptive Fiber Coupling Control. IEEE Photon. Technol. Lett. 2015, 27, 1787–1790. [Google Scholar] [CrossRef]
- Yu, X.; Dong, L.; Lai, B.; Yang, P.; Liu, Y.; Kong, Q.; Yang, K.; Tang, G.; Xu, B. Automatic low-order aberration correction based on geometrical optics for slab lasers. Appl. Opt. 2017, 56, 1730–1739. [Google Scholar] [CrossRef]
- Wang, D.; Zhang, X.; Dai, W.; Yang, Y.; Deng, X.; Chen, L.; Xie, X.; Hu, D.; Jing, F.; Yang, Z.; et al. 1178 J, 527 Nm near Diffraction Limited Laser Based on a Complete Closed-Loop Adaptive Optics Controlled off-Axis Multi-Pass Amplification Laser System. High Power Laser Sci. Eng. 2021, 9, e22. [Google Scholar] [CrossRef]
- Wang, X.; Wang, X.-L.; Zhou, P.; Su, R.-T.; Geng, C.; Li, X.-Y.; Xu, X.-J.; Shu, B.-H. Coherent Beam Combination of Adaptive Fiber Laser Array with Tilt-Tip and Phase-Locking Control. Chin. Phys. B 2013, 22, 024206. [Google Scholar] [CrossRef]
- Huang, Z.M.; Tang, X.; Liu, C.; Li, J.; Zhang, D.; Wang, X.; Han, M. Analysis of influence of tip/tilt phase error on a large scale coherent beam combination of fiber laser. Chin. J. Lasers 2015, 42, 22–28. [Google Scholar] [CrossRef]
- Chao, G. Influence and simulated correction of tip/tlt phase error on fiber laser coherent beam combination. Acta Phys. Sin. 2011, 60, 284–292. [Google Scholar] [CrossRef]
- Chao, G.; Luo, W.; Tan, Y.; Liu, H.-M.; Mu, J.-B.; Li, X.-Y. Experimental study on coherent beam combination of fiber amplifiers using adaptive power-in-the-bucket cost function. Acta Phys. Sin. 2013, 62, 224202. [Google Scholar] [CrossRef]
- Peng, Y.; Hu, Q.; Duan, J.; Li, D.; Tian, B.; Zhao, X.; Zhang, D. Self-adaptiue tilt control menthod based on second order moment of beam for laser array. High Power Laser Part. Beams 2023, 35, 122–127. [Google Scholar] [CrossRef]
- Vorontsov, M.A.; Weyrauch, T.; Beresnev, L.A.; Carhart, G.W.; Ling, L.; Aschenbach, K. Adaptive Array of Phase-Locked Fiber Collimators: Analysis and Experimental Demonstration. IEEE J. Select. Topics Quantum Electron. 2009, 15, 269–280. [Google Scholar] [CrossRef]
- Wang, C.; Hu, L.; Xu, H.; Wang, Y.; Li, D.; Wang, S.; Mu, Q.; Yang, C.; Cao, Z.; Lu, X.; et al. Wavefront detection method of a single-sensor based adaptive optics system. Opt. Express 2015, 23, 21403–21413. [Google Scholar] [CrossRef] [PubMed]
- Zou, F.; Pan, Z.; Liu, J.; Li, Z.; Pan, L.; Yang, R.; Jiang, J.; Li, F.; Geng, C.; Li, X. Turbulence Compensation for Receiving and Coherent Combining via Phased Fiber Laser Array. IEEE Photonics Technol. Lett. 2023, 35, 733–736. [Google Scholar] [CrossRef]
- Pan, G.; Yu, X.; Wang, W.; Ni, X.; Dong, D.; Bai, S.; Yan, Y. The Multiparameter Measurement Technique in a Large-Aperture Rectangular Laser Beam Aberration Correction System. IEEE Photonics J. 2022, 14, 1–9. [Google Scholar]
- Li, D.; Gai, M.; Chen, H.; Zhu, G.; Zhang, L. Research on Wavefront Correction Algorithm of Adaptive Optics System. In Proceedings of the 2015 4th International Conference on Computer Science and Network Technology (ICCSNT), Harbin, China, 19–20 December 2015. [Google Scholar]
- Zhong, S.; Xiong, J.; Xu, C.; Zhang, F.; Duan, J. Power Enhancement and Spot Homogenization Design for Arrayed Semiconductor Lasers. Micromachines 2024, 15, 744. [Google Scholar] [CrossRef]
- Allik, T.H.; Dixon, R.E.; Proffitt, R.P.; Fung, S.; Ramboyong, L.; Soyka, T.J. Beam Uniformity Analysis of Infrared Laser Illuminators. Opt. Eng. 2015, 54, 026103. [Google Scholar] [CrossRef]
- Chen, Z.-Z.; Xu, Y.-T.; Guo, Y.-D.; Wang, B.-S.; Xu, J.; Xu, J.-L.; Gao, H.-W.; Yuan, L.; Yuan, H.-T.; Lin, Y.-Y.; et al. 8.2 kW High Beam Quality Quasi-Continuous-Wave Face-Pumped Nd:YAG Slab Amplifier. Appl. Opt. 2015, 54, 5011–5015. [Google Scholar] [CrossRef] [PubMed]


| Parameter | Value |
|---|---|
| Clear aperture | 90 mm |
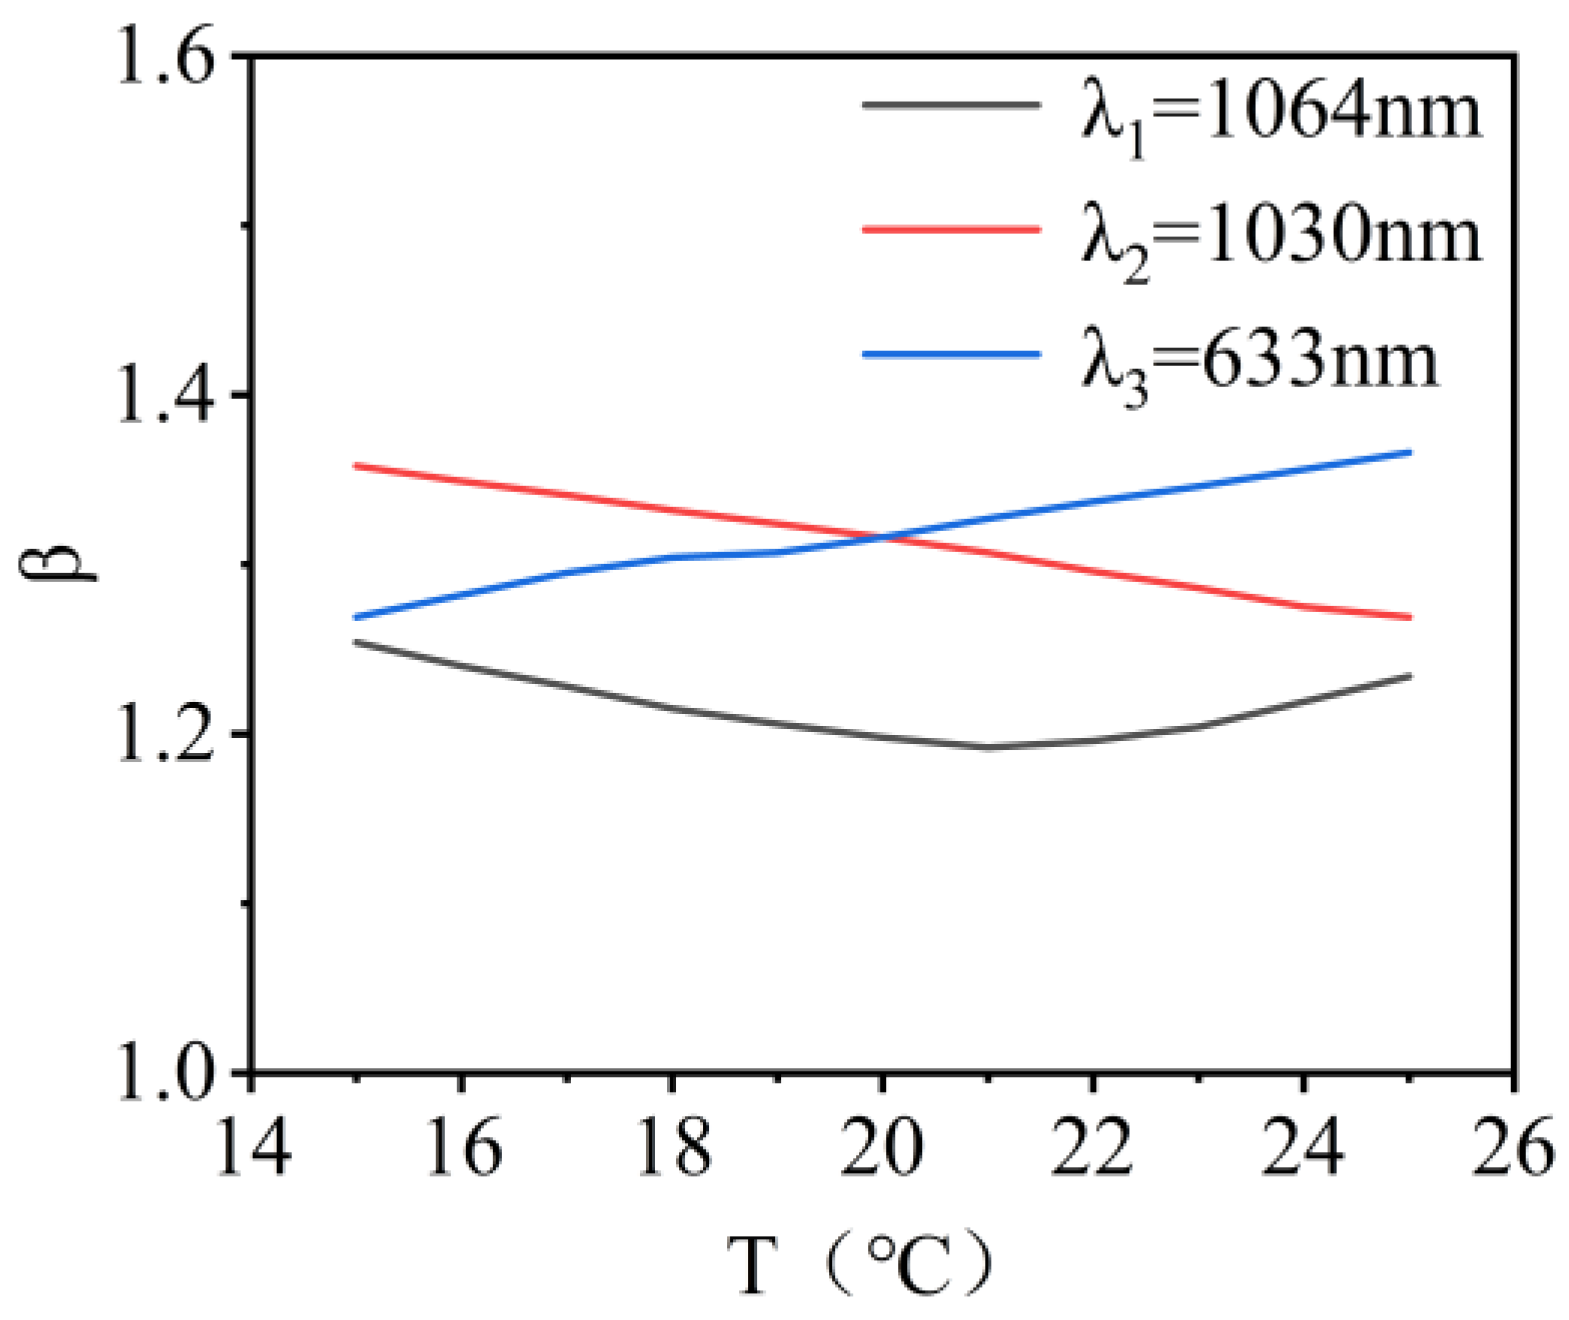
| Wavelength | 1064 ± 0.3 nm, 1030 ± 0.3 nm, 633 ± 0.2 nm |
| Field | ±0.25° |
| The entrance pupil position of co-aperture optical receiving subsystem | 500 mm |
| The exit pupil position of co-aperture optical receiving subsystem | ≥80 mm |
| The multiplier of common aperture receiving subsystem | 6 |
| The combined focal length of beam quality detection system | ≥1000 mm |
| The combined focal length of suboptical axis tilt detection subsystem | ≥1000 mm |
| Distortion of beam uniformity detection subsystem | ≤1% |
| The multiplier of relay optical subsystem | 2.5 |
| The number of pixels covered by beam uniformity detection subsystem | ≥600 |
| The fluctuation range of wavefront PV value and RMS value in the optical system design results. | PV ≤ λ/10, RMS ≤ λ/20 |
| Working temperature | 20 ± 5 °C |
| Radius (mm) | Thickness (mm) | Glass (mm) |
|---|---|---|
| 410.732 | 8.000 | H-LAK7A |
| 168.270 | 12.500 | H-FK61B |
| −680.545 | 0.100 | --- |
| 299.750 | 9.000 | H-ZF5 |
| 172.980 | 35.633 | --- |
| 164.454 | 10.000 | H-LAF3B |
| 357.310 | 494.231 | --- |
| ∞ | 88.677 | --- |
| 363.190 | 3.000 | H-LAF3B |
| −149.806 | 1.263 | --- |
| 111.940 | 4.000 | H-LAK7A |
| −40.550 | 2.500 | H-ZF5 |
| 671.200 | 50.000 | --- |
| Radius (mm) | Thickness (mm) | Glass |
|---|---|---|
| 253.980 | 3.500 | H-ZF5 |
| 50.000 | 1.065 | --- |
| 52.062 | 4.500 | H-LAF3B |
| −263.000 | 151.200 | --- |
| ∞ | 107.700 | --- |
| 32.909 | 3.000 | H-LAF3B |
| −315.355 | 0.456 | --- |
| 78.000 | 2.000 | H-ZF5 |
| 21.720 | 3.580 | --- |
| 36.086 | 3.000 | H-FK61B |
| 249.884 | 20.000 | --- |
| Parameter | Value | |||
|---|---|---|---|---|
| Percentage of Monte Carlo/% | 90 | 80 | 50 | 20 |
| RMS wavefront | 0.1081 | 0.0954 | 0.0616 | 0.0477 |
| Parameter | Value | |||
|---|---|---|---|---|
| Percentage of Monte Carlo/% | 90 | 80 | 50 | 20 |
| RMS wavefront | 0.1015 | 0.0964 | 0.061 | 0.0476 |
Disclaimer/Publisher’s Note: The statements, opinions and data contained in all publications are solely those of the individual author(s) and contributor(s) and not of MDPI and/or the editor(s). MDPI and/or the editor(s) disclaim responsibility for any injury to people or property resulting from any ideas, methods, instructions or products referred to in the content. |
© 2024 by the authors. Licensee MDPI, Basel, Switzerland. This article is an open access article distributed under the terms and conditions of the Creative Commons Attribution (CC BY) license (https://creativecommons.org/licenses/by/4.0/).
Share and Cite
Yu, X.; Wang, X.; Liang, J.; Liu, C.; Ni, X.; Bai, S.; Li, J.; Liu, Z.; Hou, L. Beam Tilt Aberration Detection of the Seven-Unit Phased Fiber Laser Array. Micromachines 2025, 16, 38. https://doi.org/10.3390/mi16010038
Yu X, Wang X, Liang J, Liu C, Ni X, Bai S, Li J, Liu Z, Hou L. Beam Tilt Aberration Detection of the Seven-Unit Phased Fiber Laser Array. Micromachines. 2025; 16(1):38. https://doi.org/10.3390/mi16010038
Chicago/Turabian StyleYu, Xin, Xingyue Wang, Jing Liang, Cai Liu, Xiaolong Ni, Suping Bai, Jiasu Li, Zeping Liu, and Lijie Hou. 2025. "Beam Tilt Aberration Detection of the Seven-Unit Phased Fiber Laser Array" Micromachines 16, no. 1: 38. https://doi.org/10.3390/mi16010038
APA StyleYu, X., Wang, X., Liang, J., Liu, C., Ni, X., Bai, S., Li, J., Liu, Z., & Hou, L. (2025). Beam Tilt Aberration Detection of the Seven-Unit Phased Fiber Laser Array. Micromachines, 16(1), 38. https://doi.org/10.3390/mi16010038