
Accurate Detection and Analysis of Pore Defects in Laser Powder Bed Fusion WE43 Magnesium Alloys

 , ,
, , 
Abstract
1. Introduction
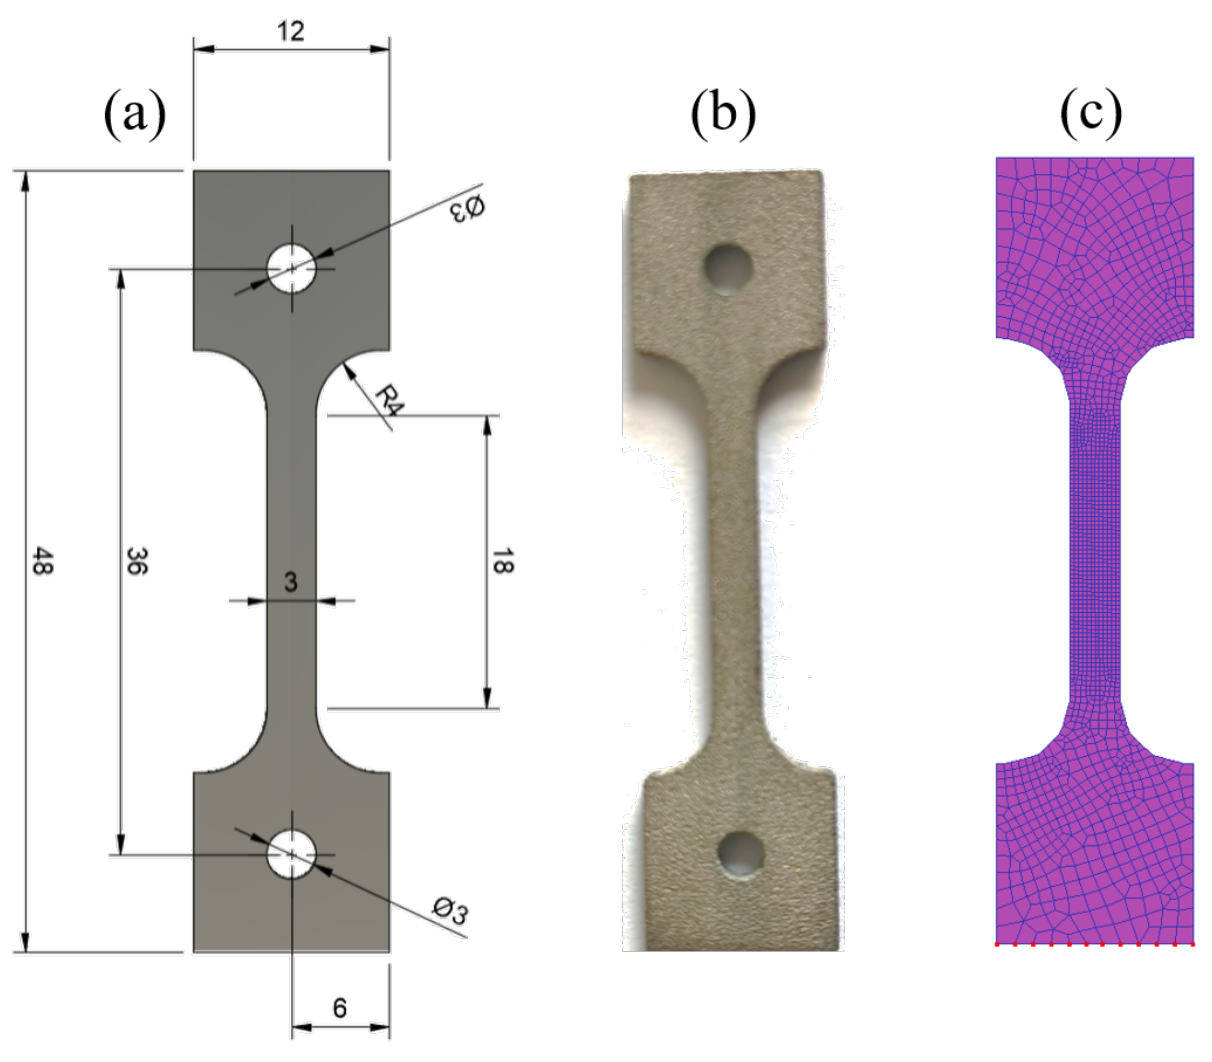
2. Experimental
3. Experimental Results Analysis
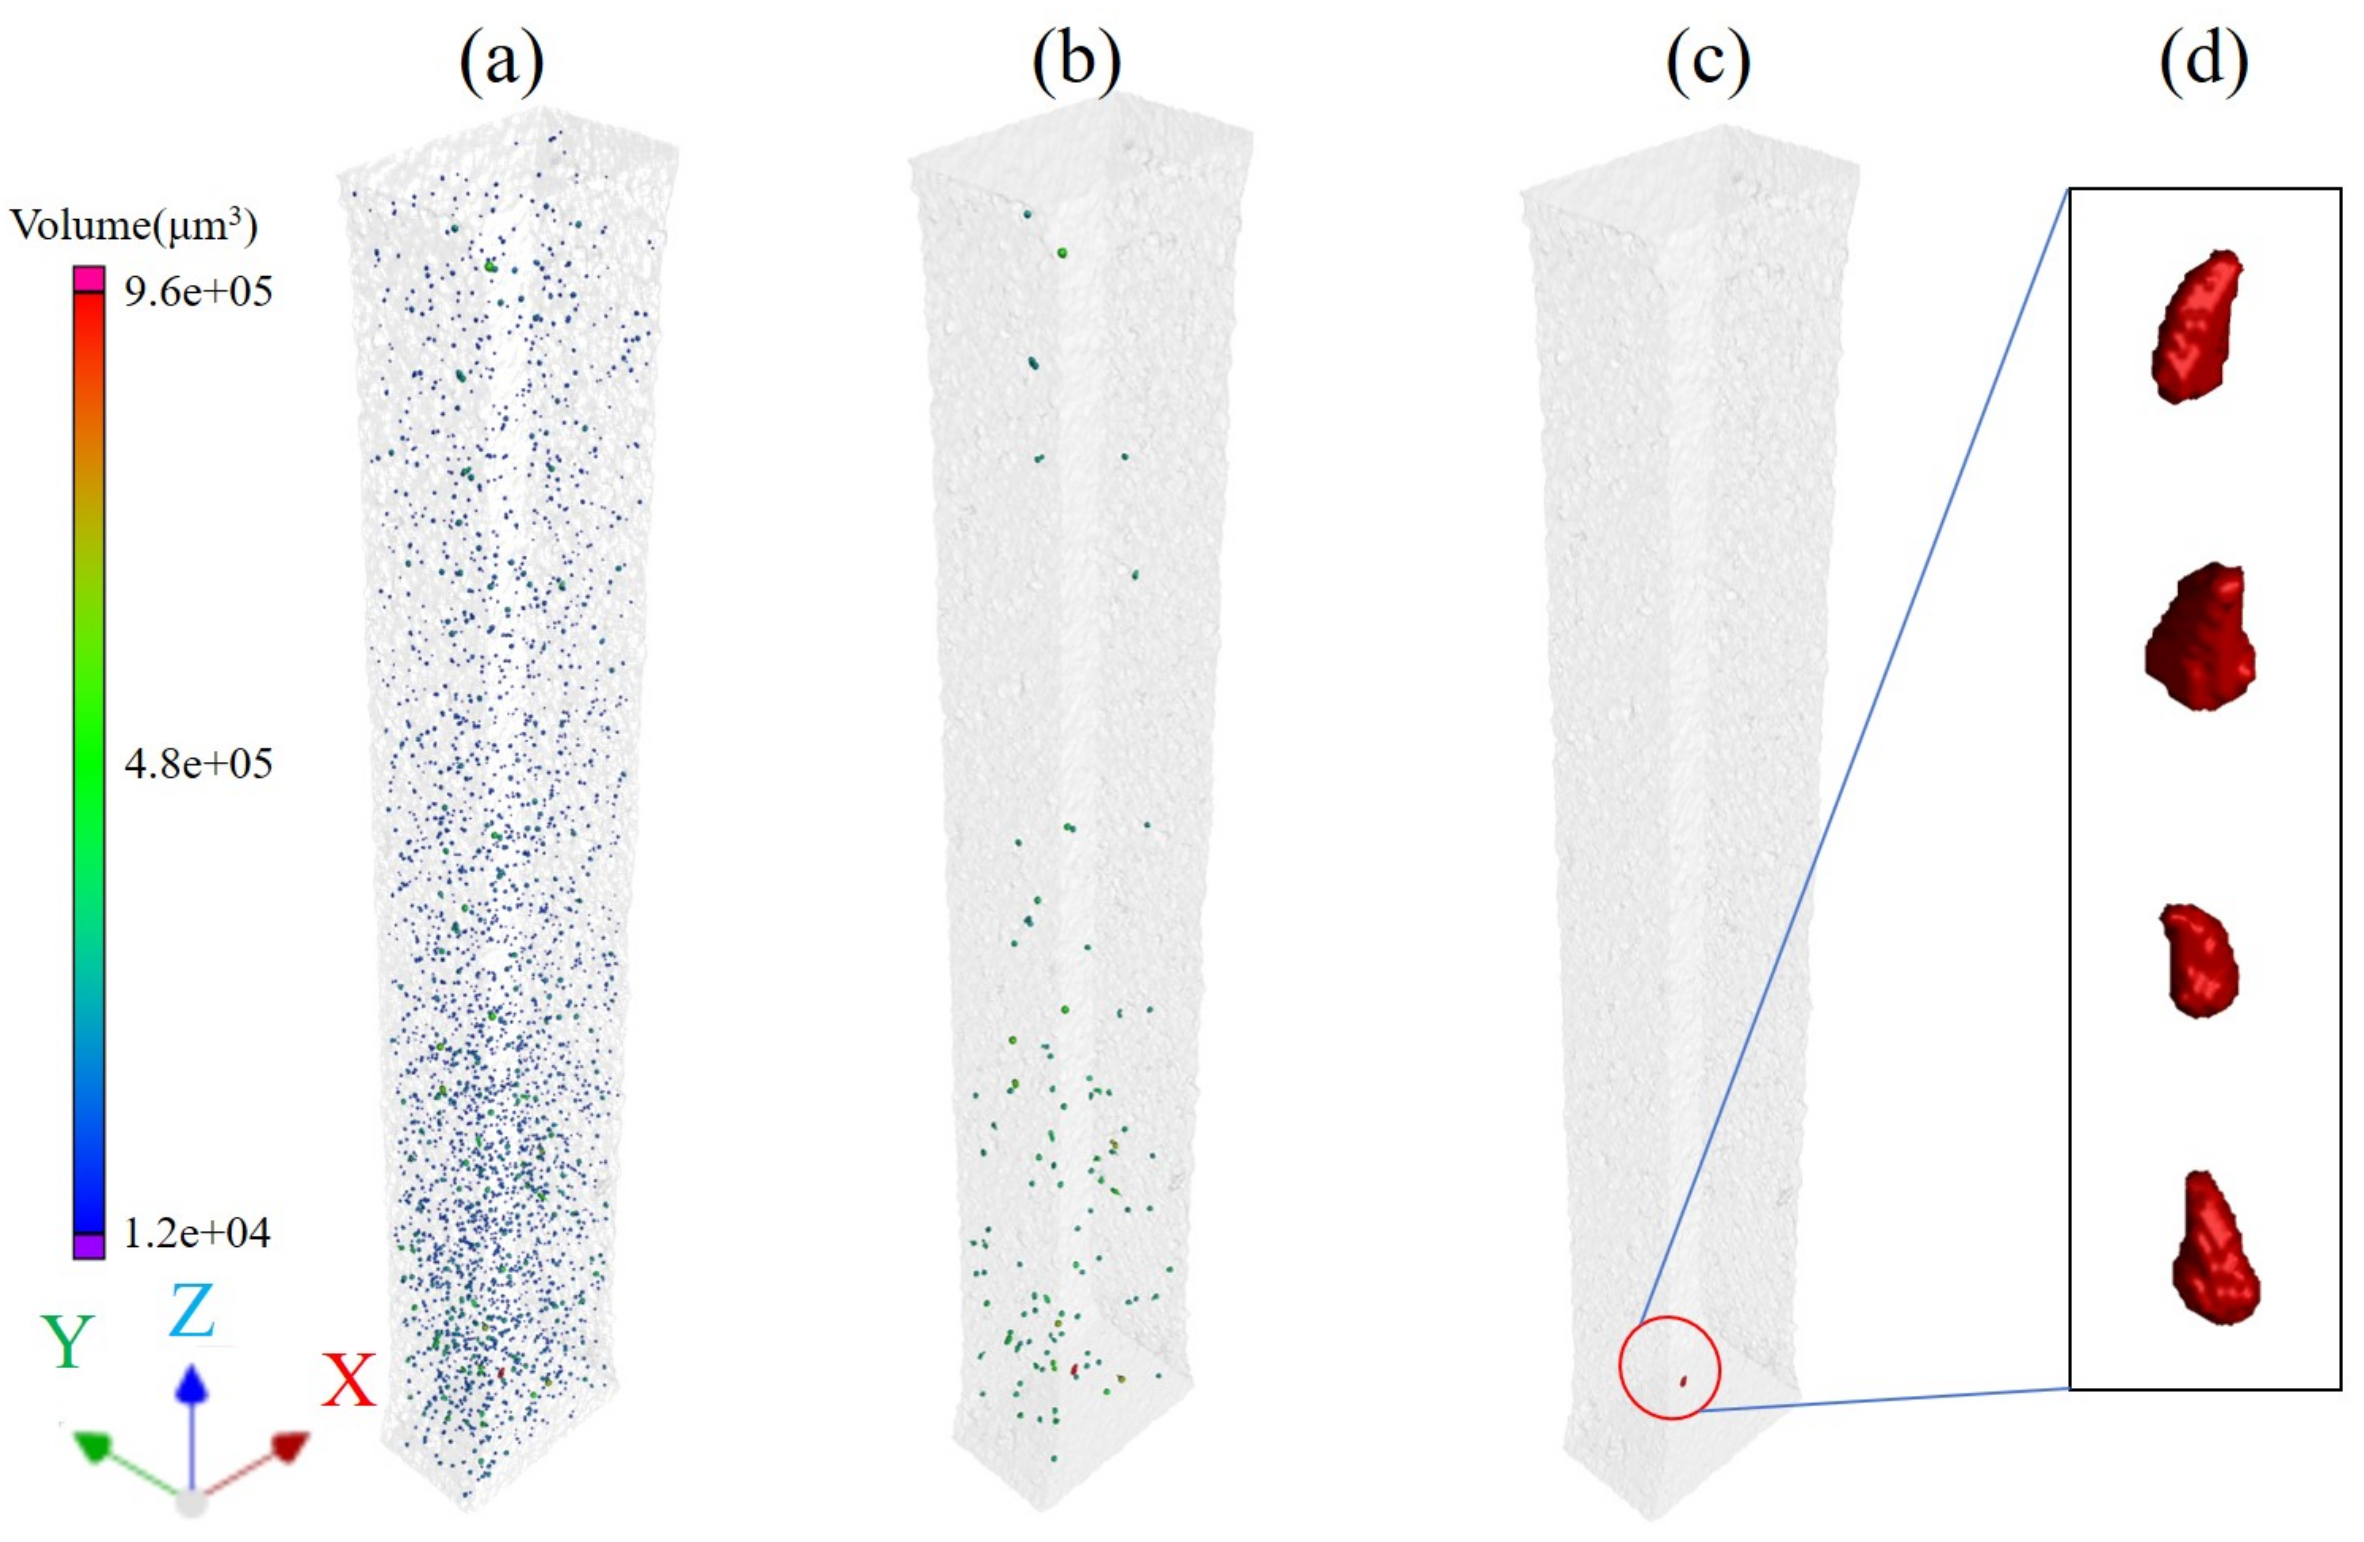
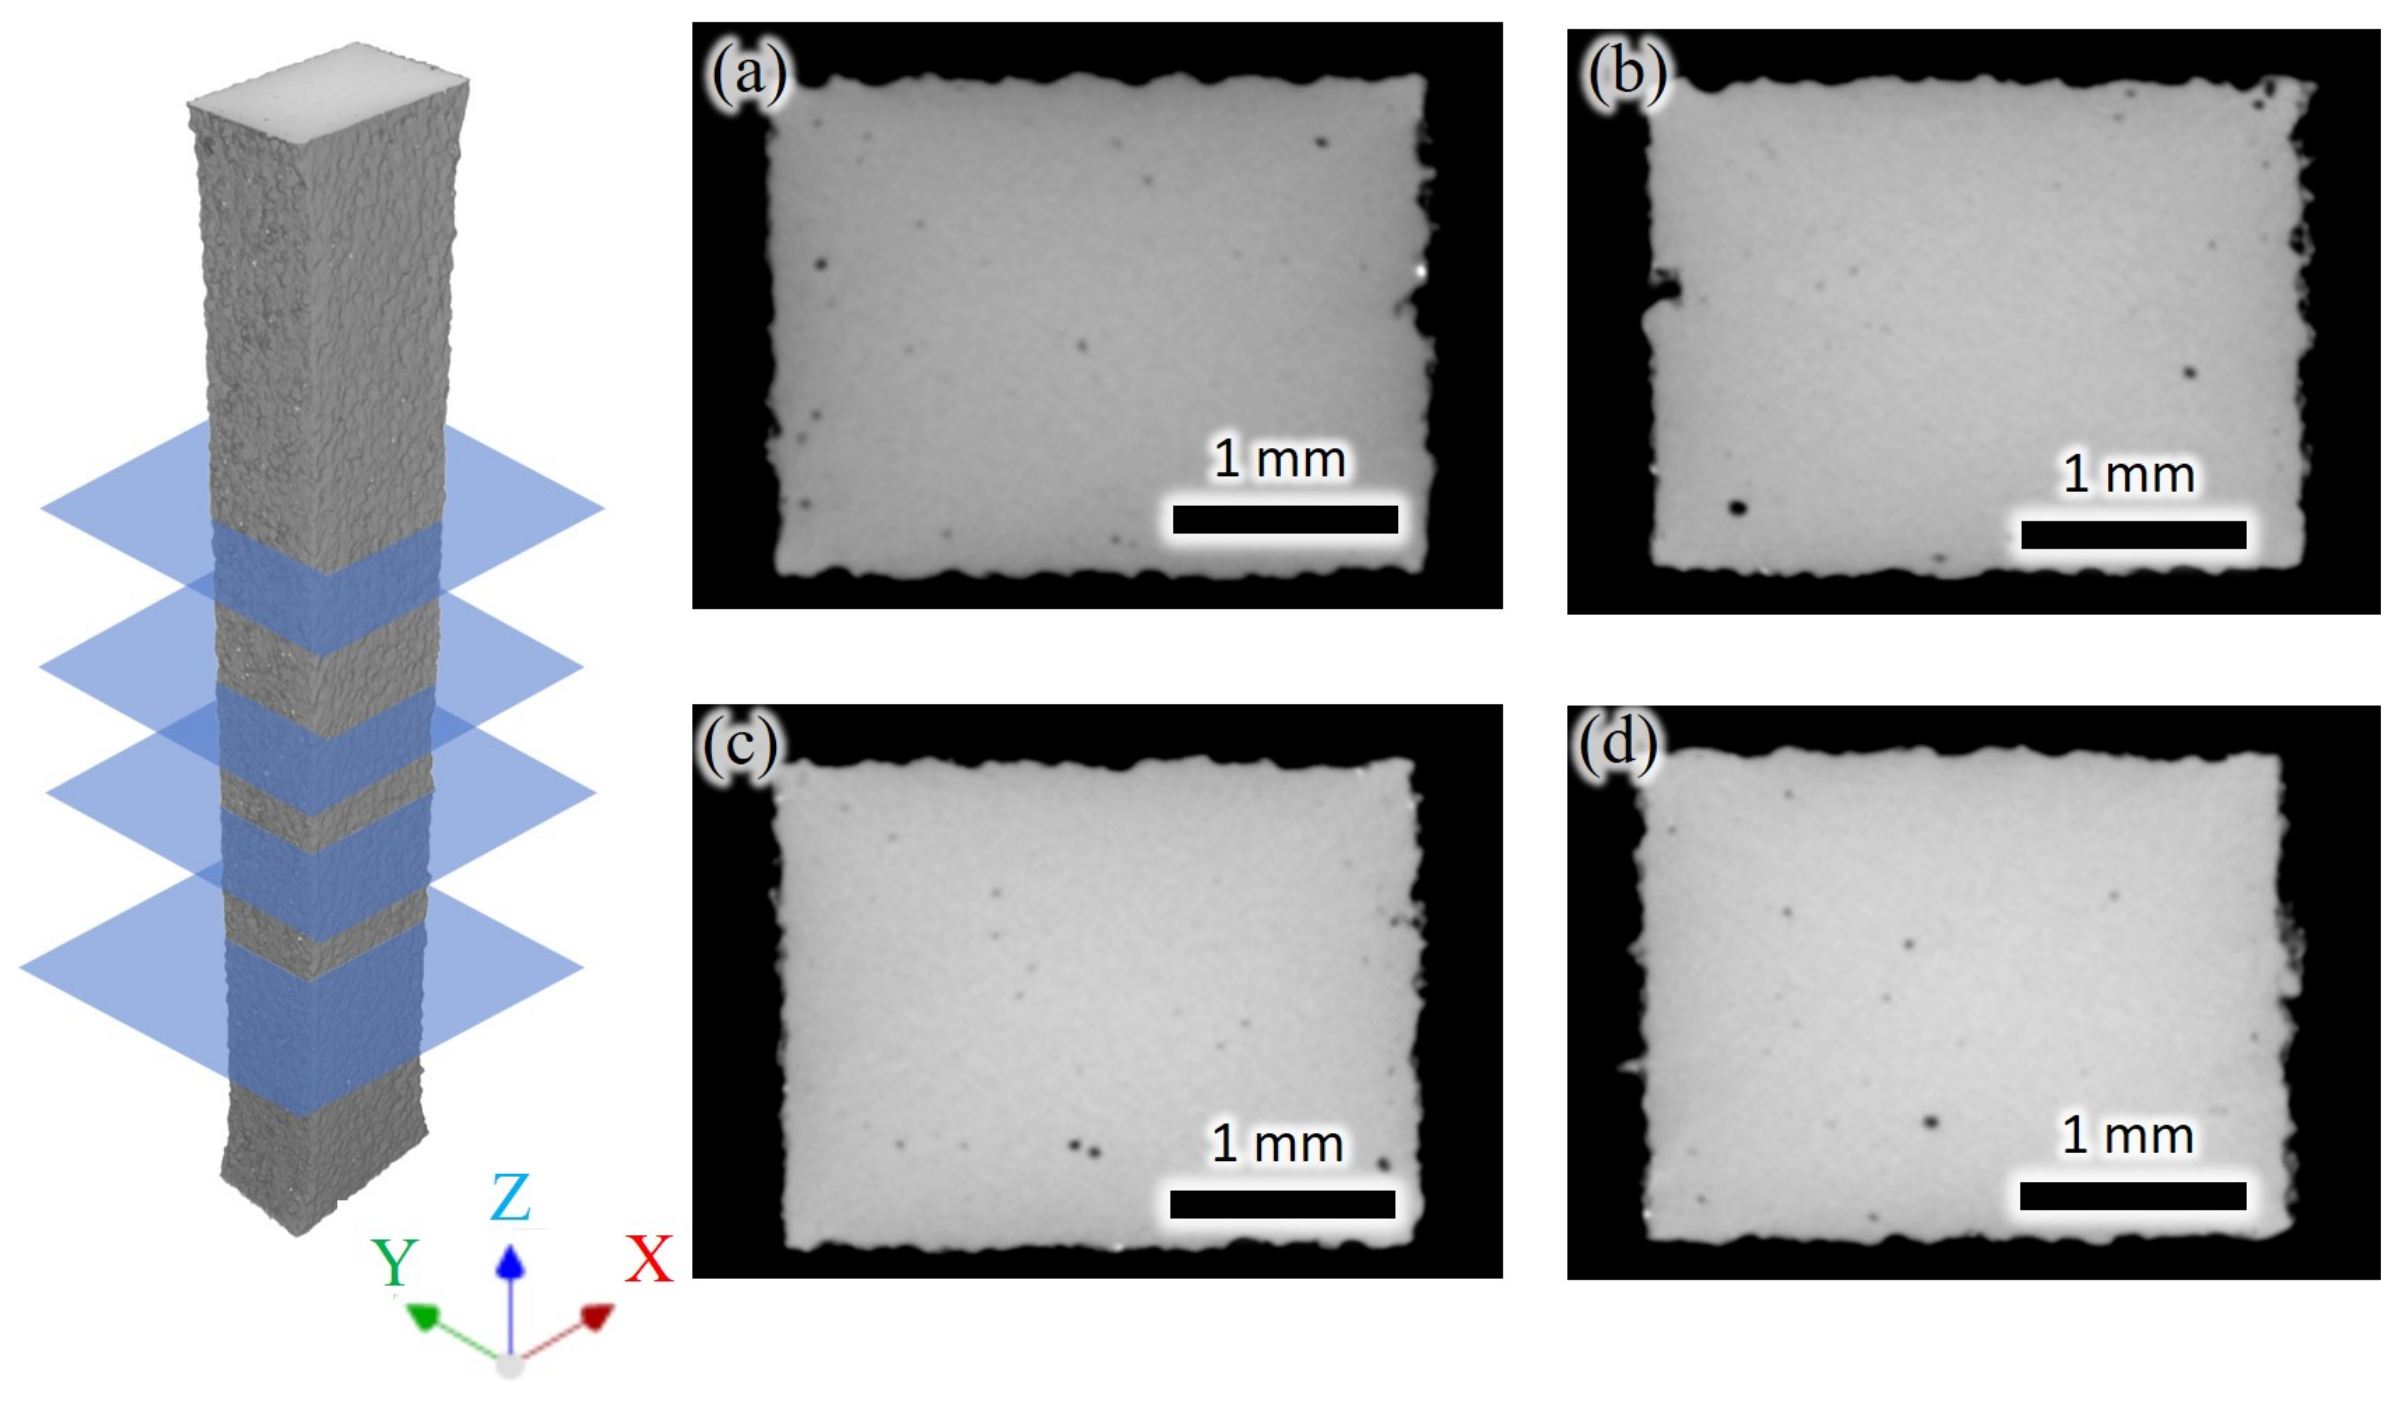
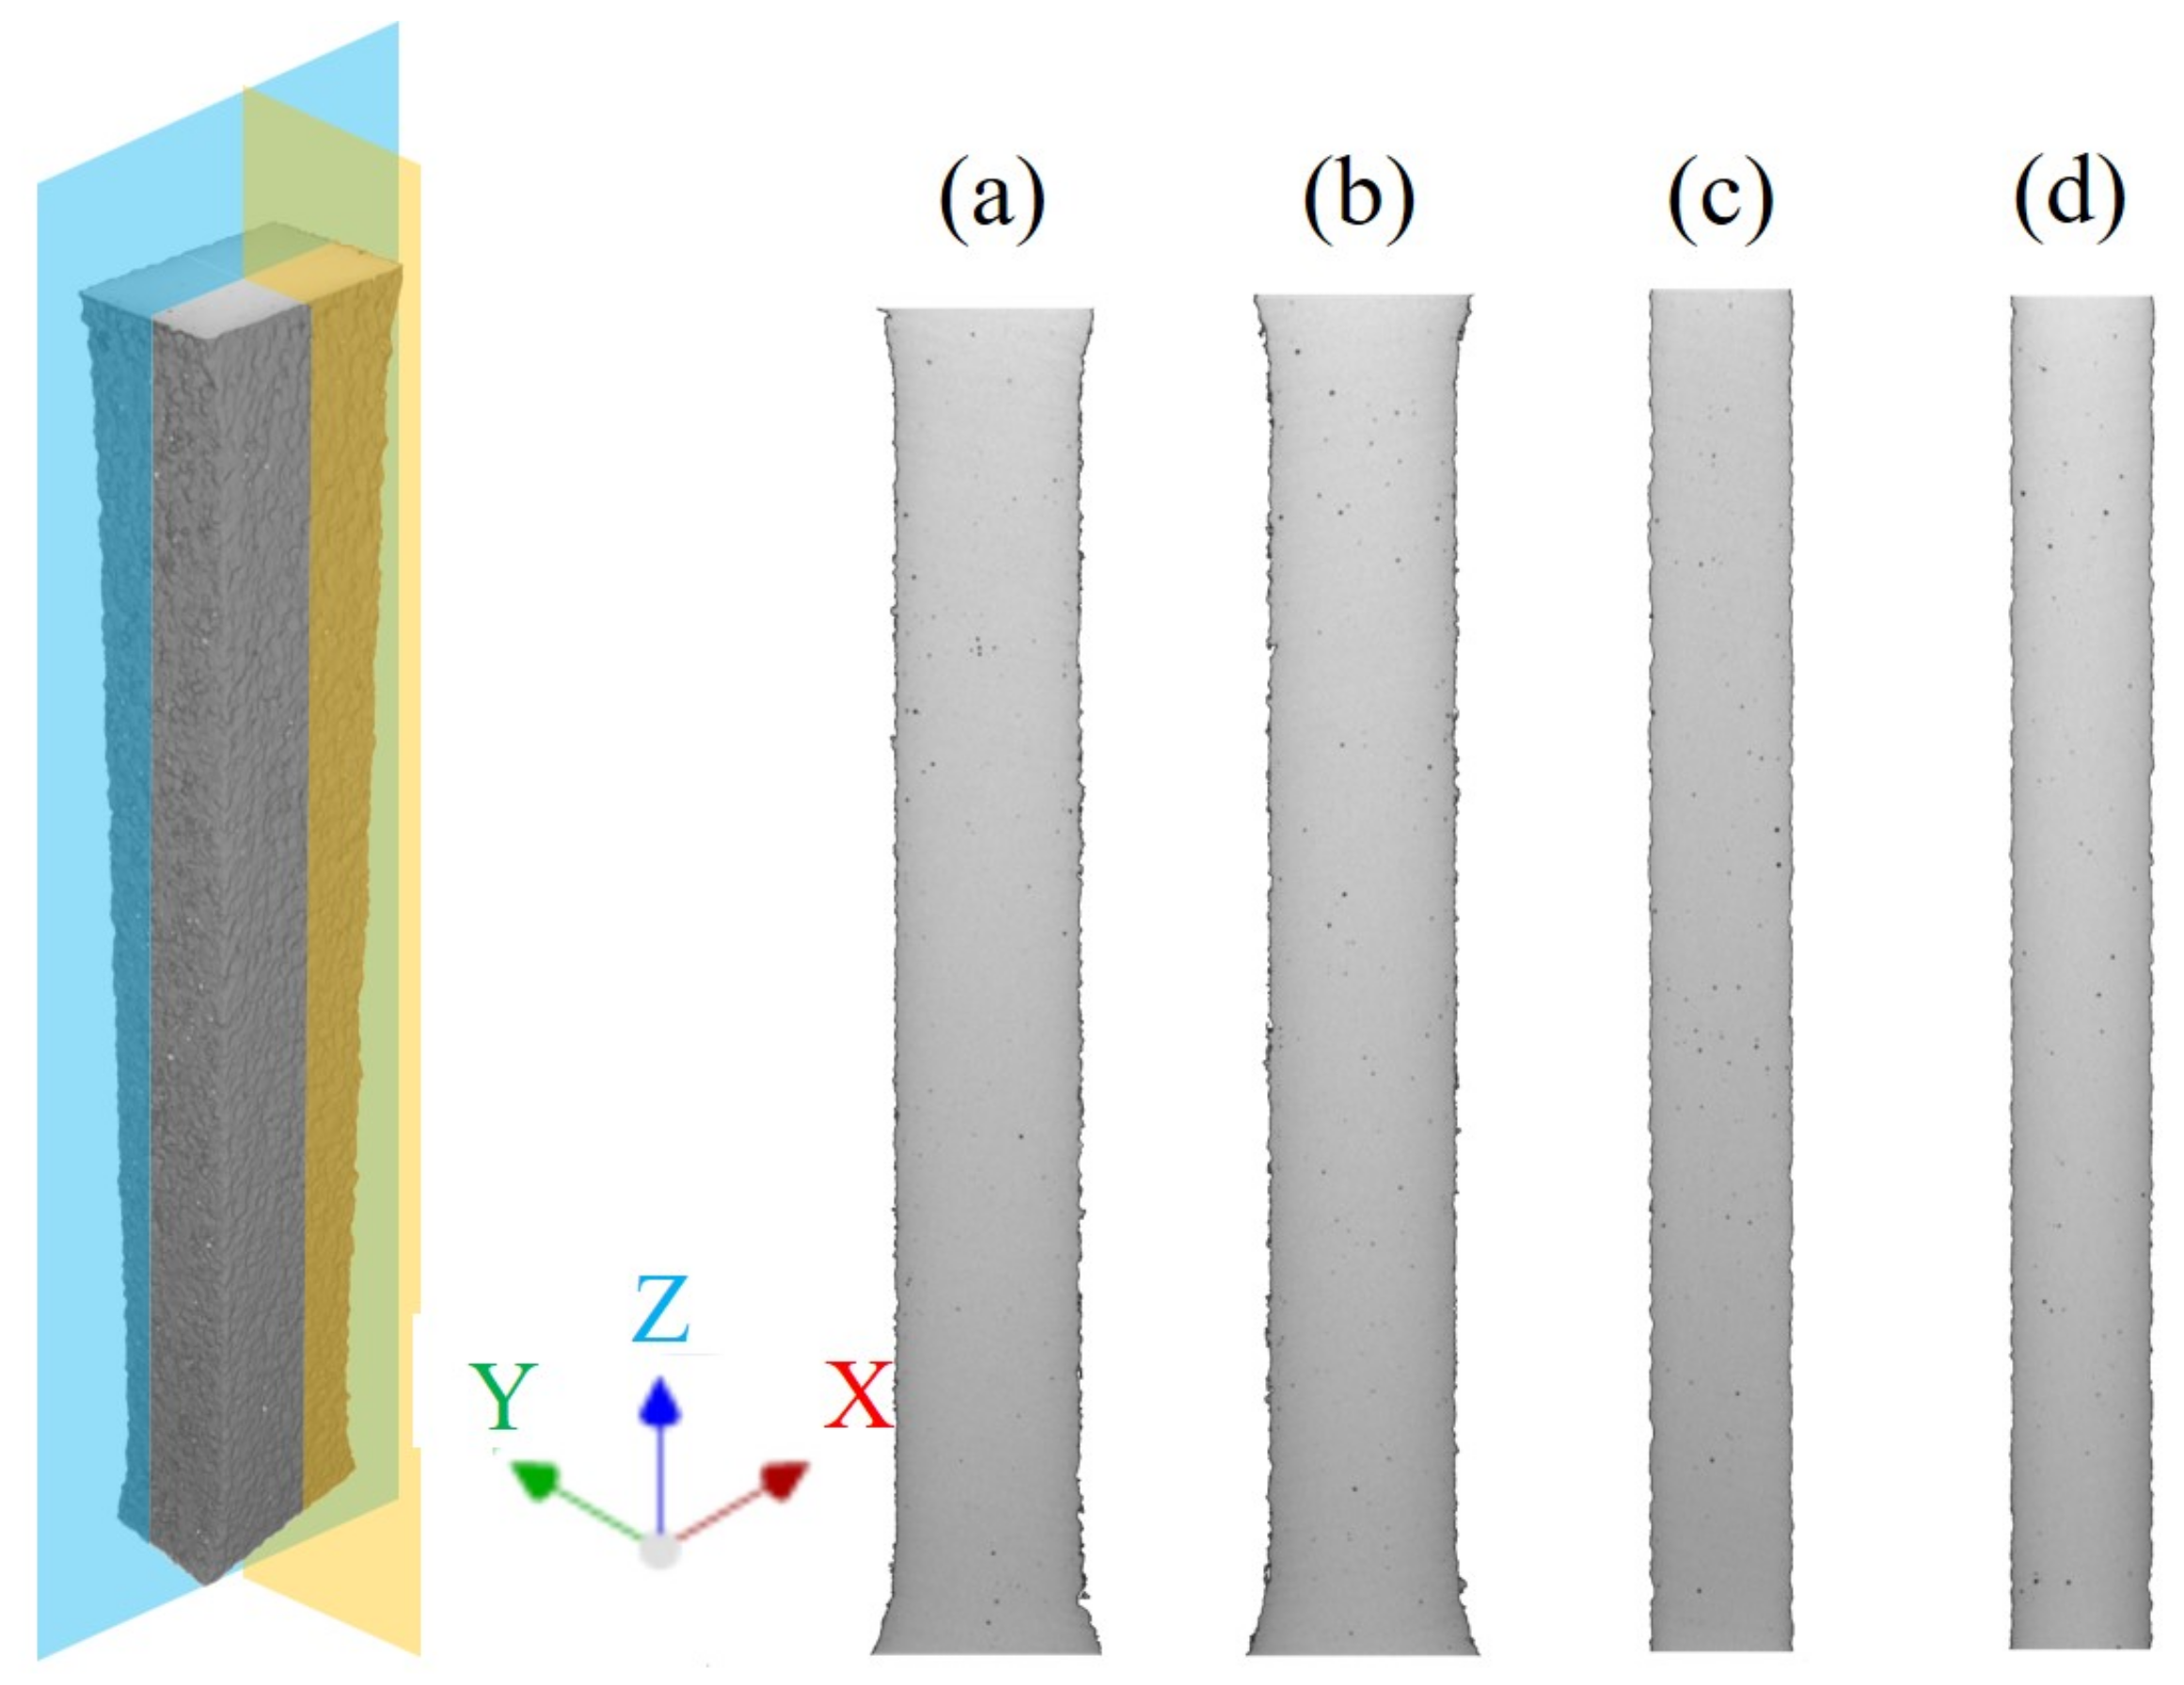
3.1. CT Inspection and Analysis
3.2. Low-Magnification Inspection and Analysis
3.3. High-Magnification Inspection and Analysis
3.4. Tensile Testing and Analysis
4. Discussion
4.1. Porosity Formation Mechanism and Effects
4.2. Impact of the Size and Number of Pores
4.3. Strategies to Reduce Porosity
4.4. Prospect
5. Conclusions
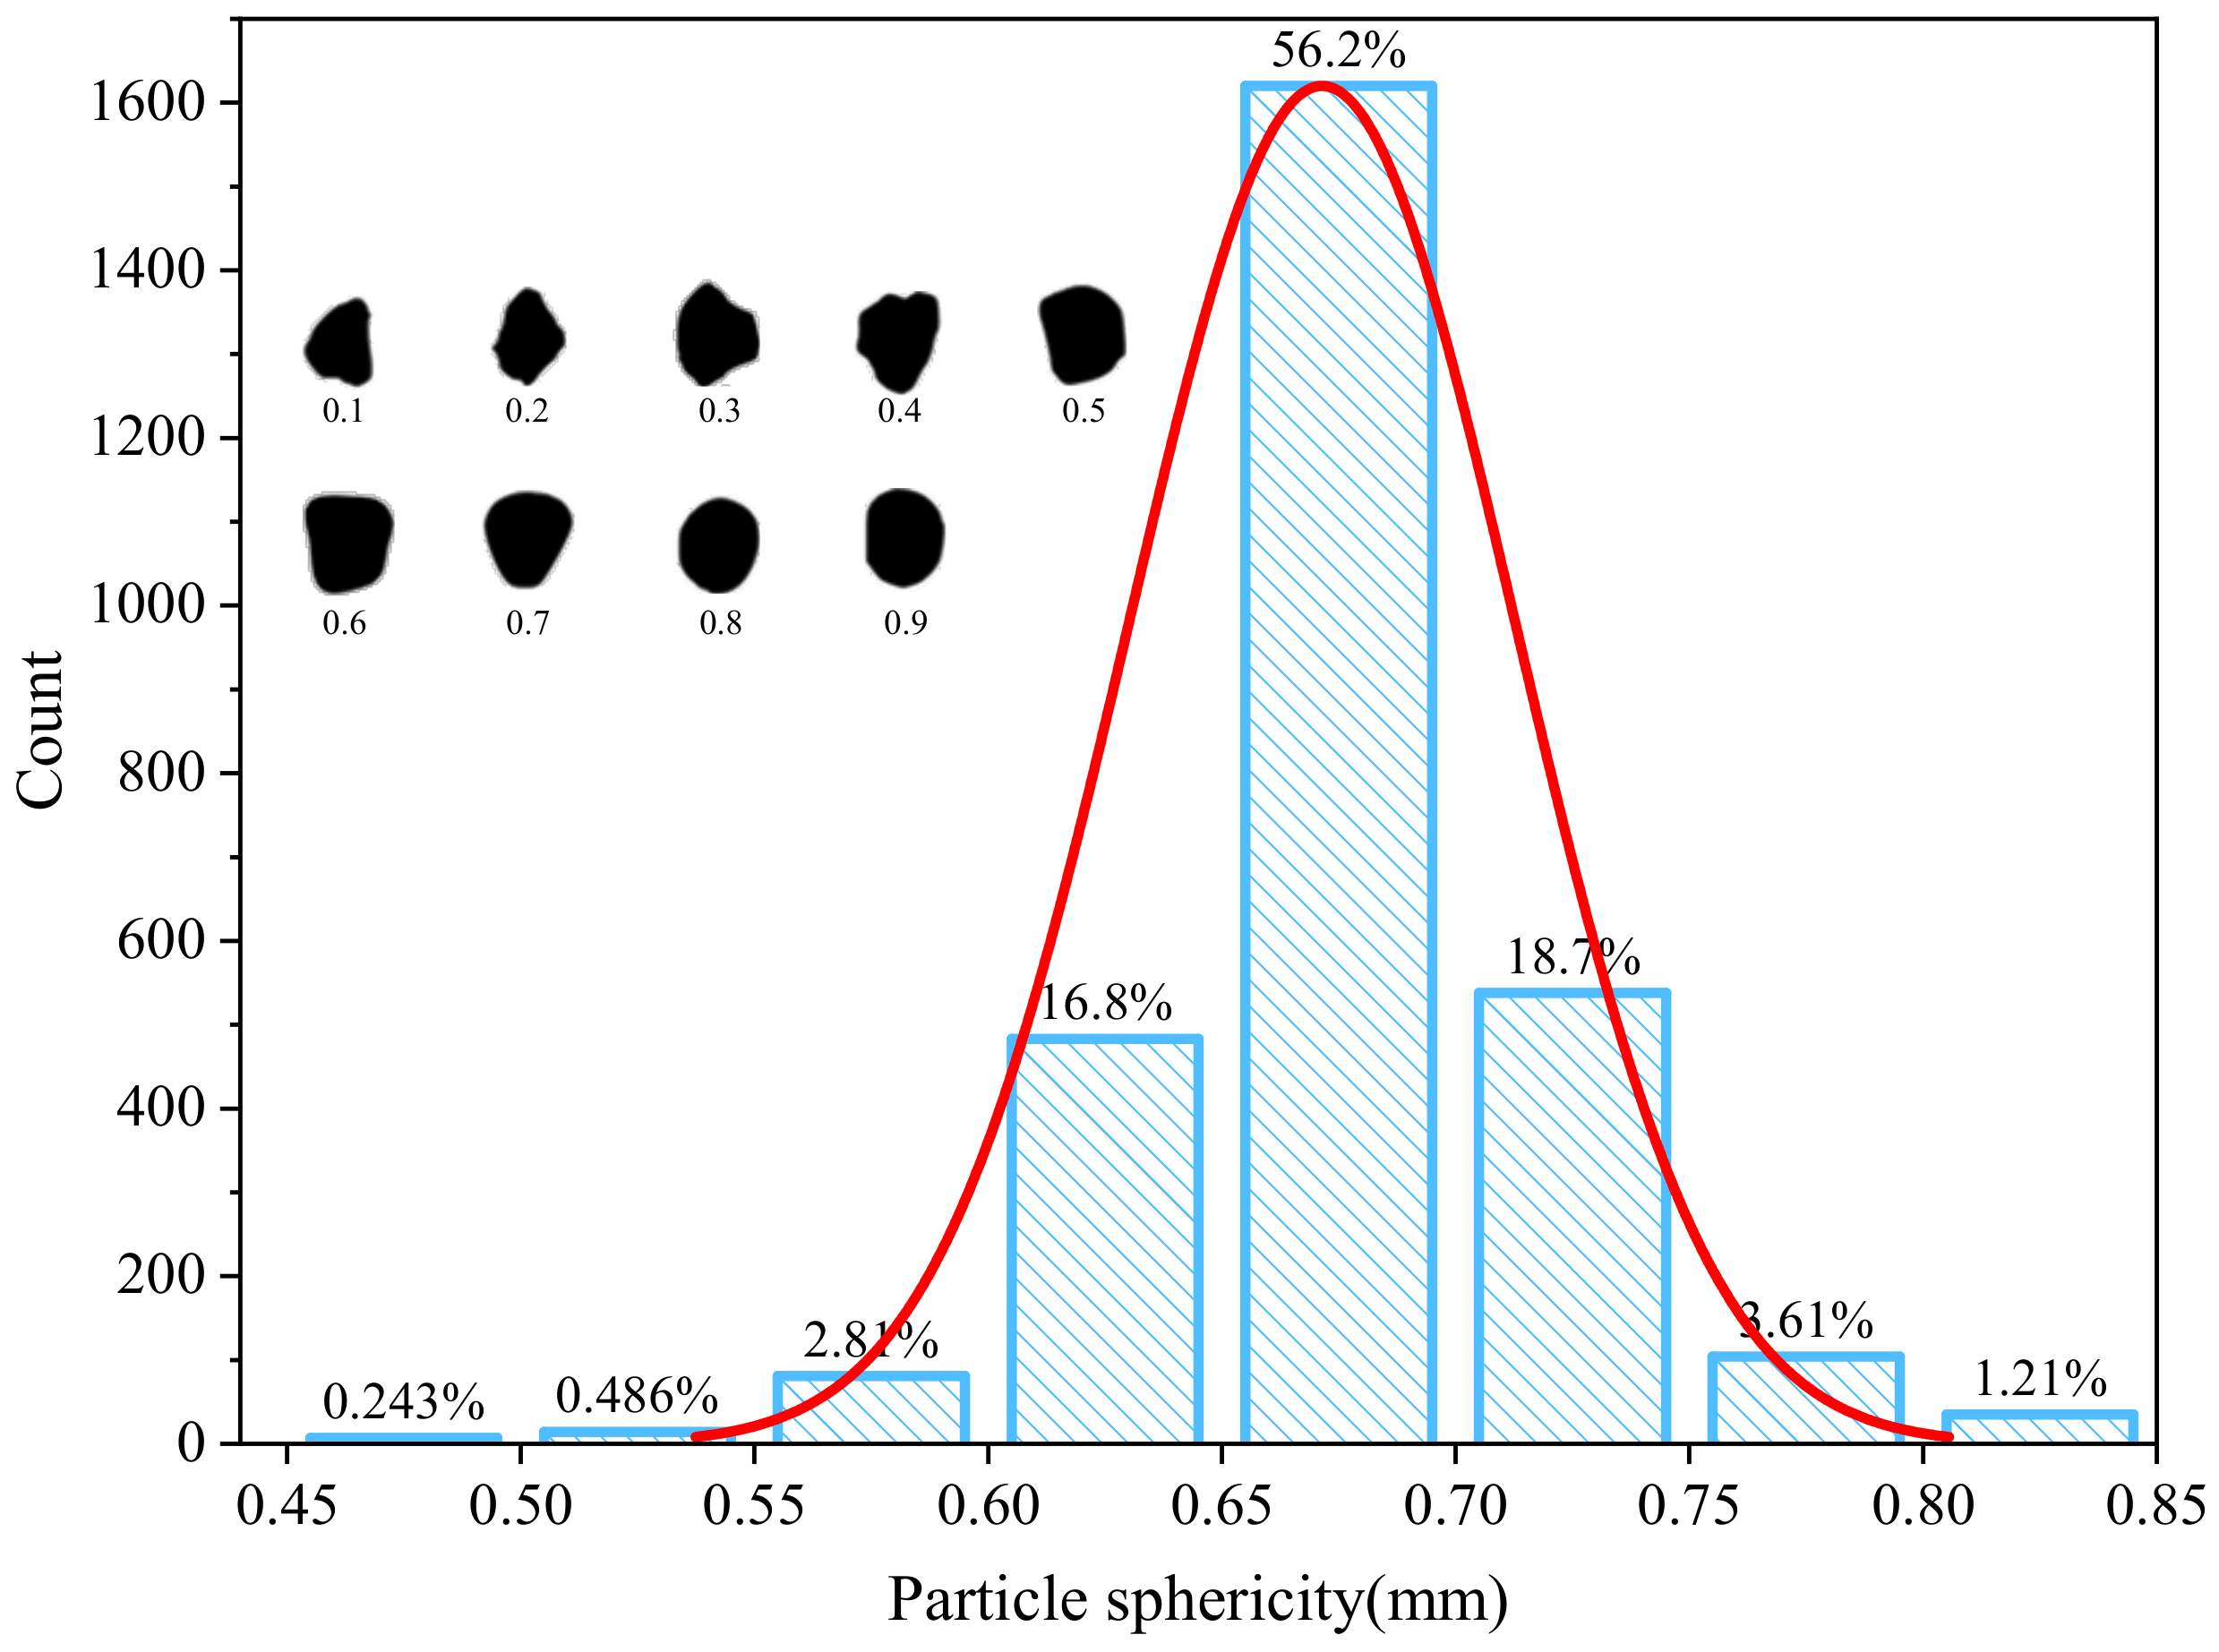
- CT inspection revealed the presence of numerous void defects with equivalent diameters ranging from 10∼122 m in the gauge section of LPBF-formed WE43 magnesium alloy specimens. Approximately 80% of the defects had diameters concentrated in the range of 10∼40 m, with 56.2% of defects having sphericity values between 0.65∼0.7 m.
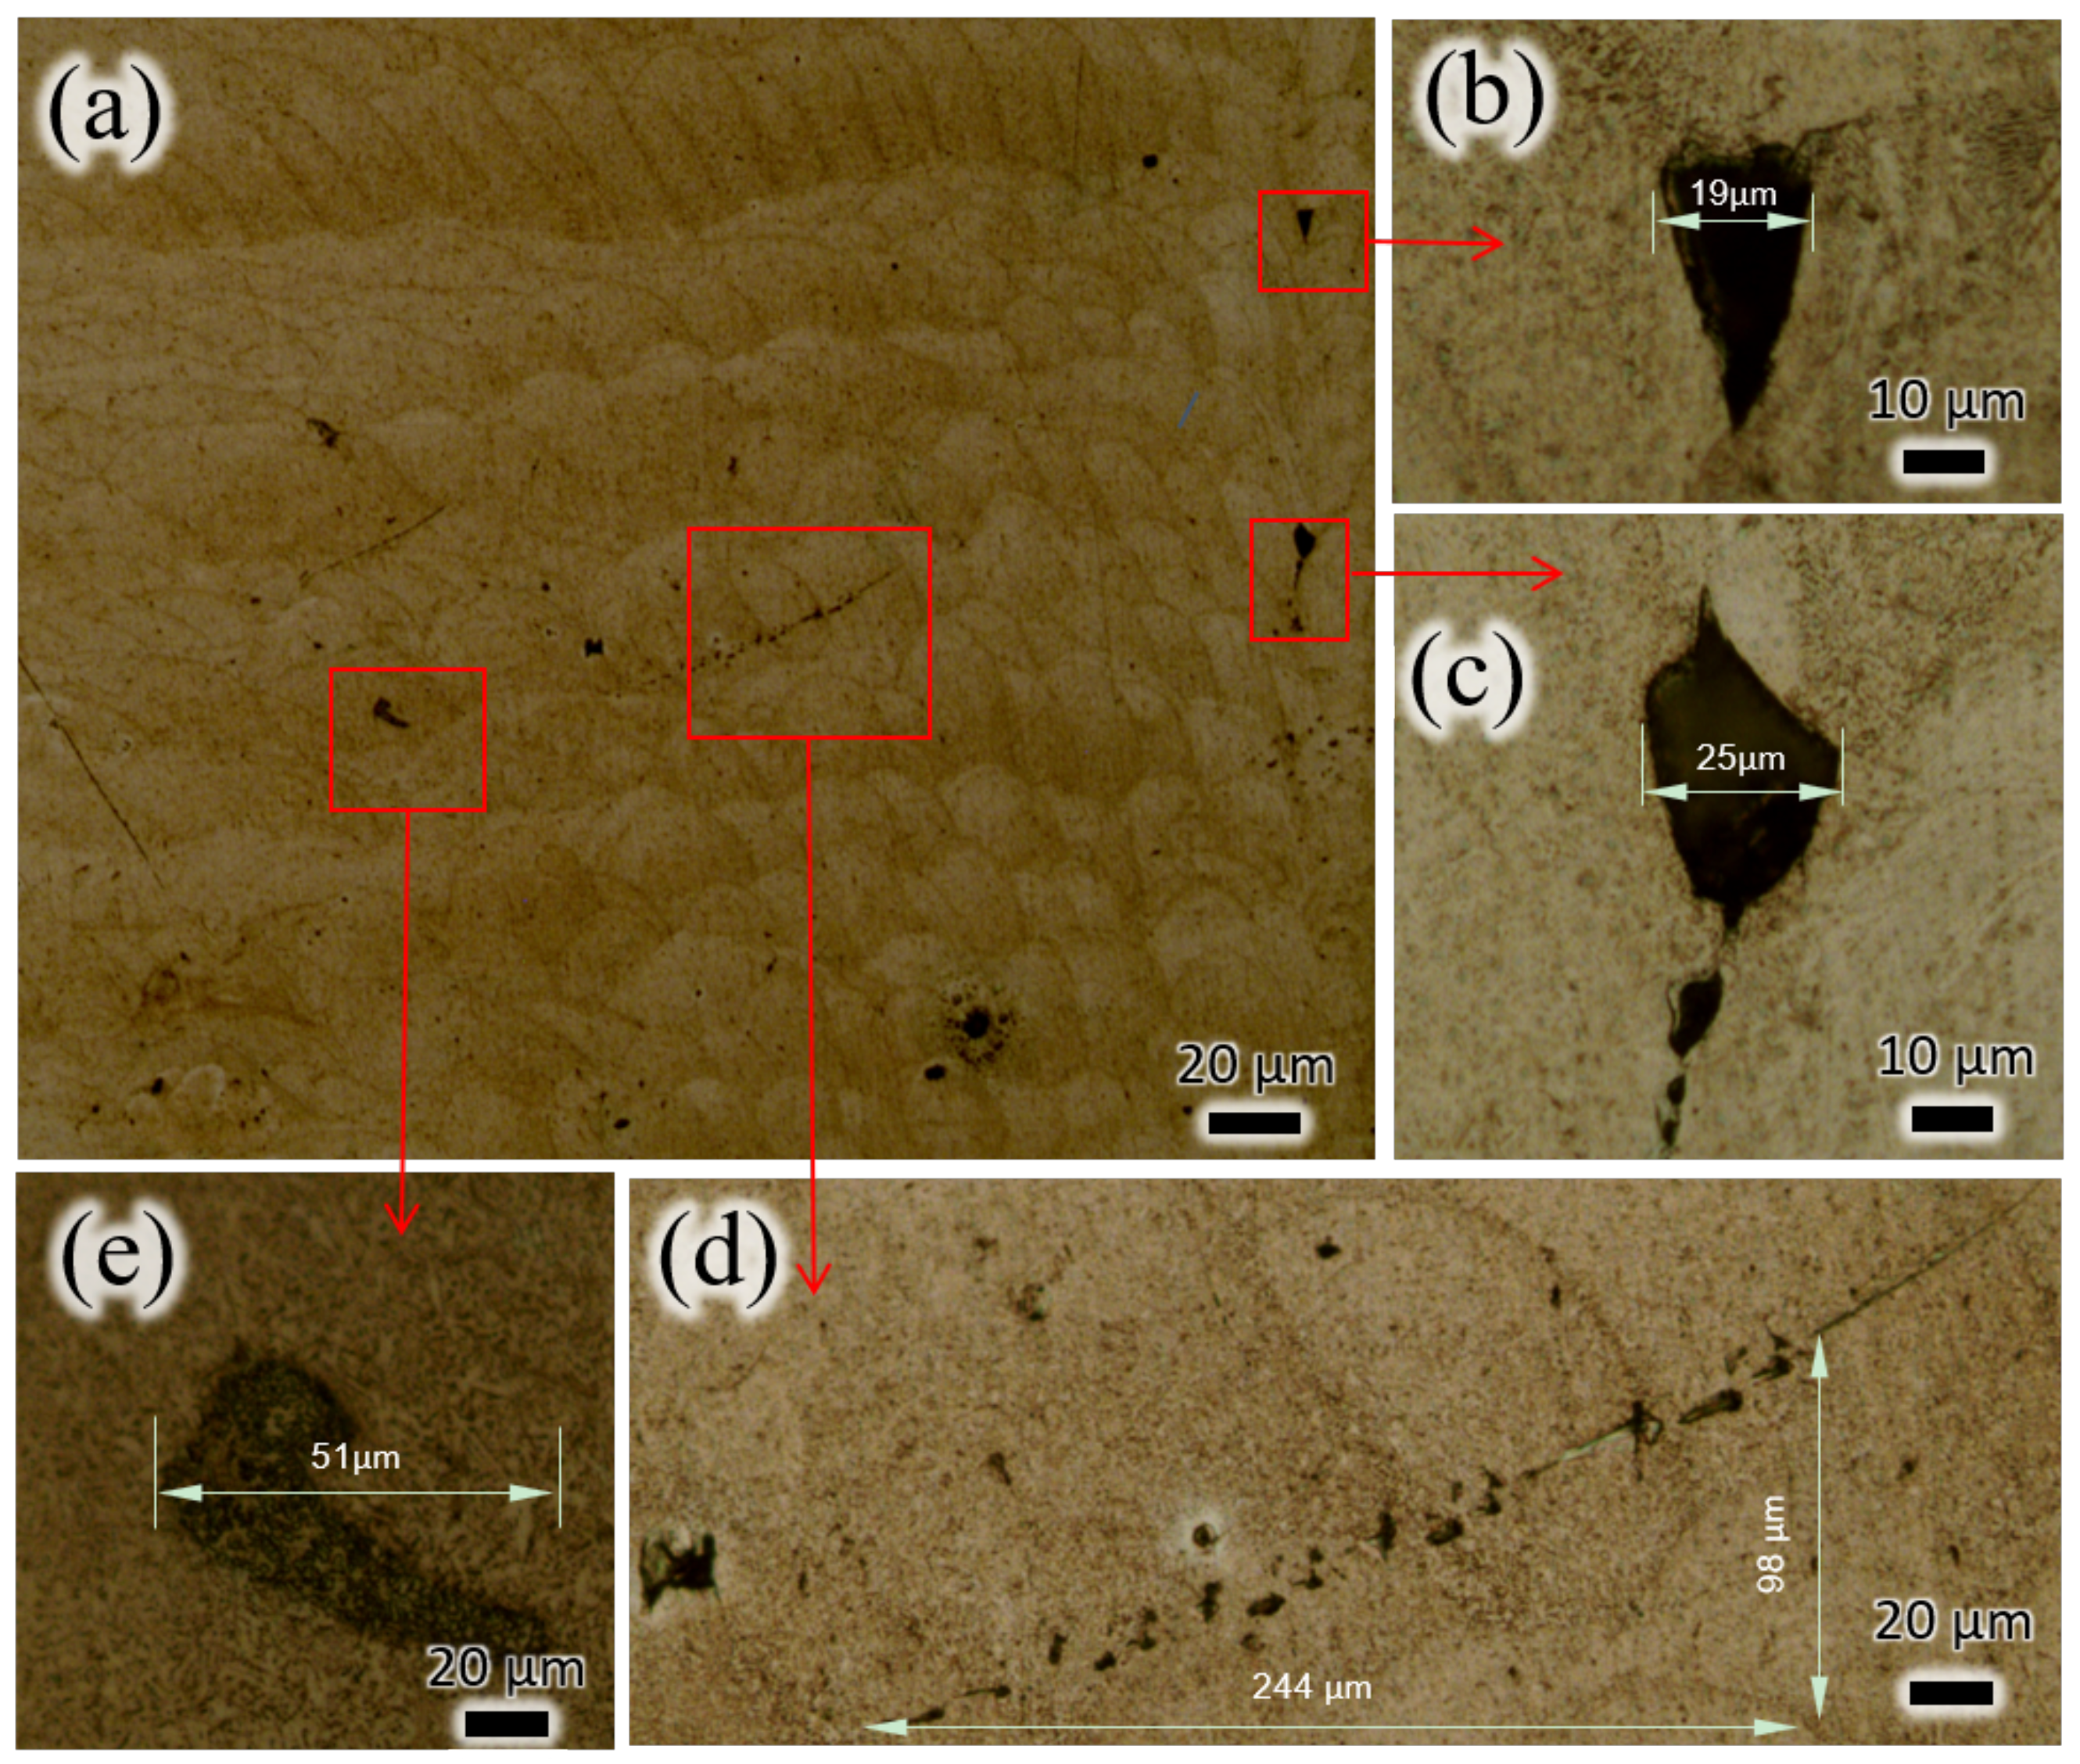
- Low-magnification inspection showed that LPBF-formed WE43 magnesium alloy specimens exhibited various irregularly shaped void defects, with many individual defects below 50 m in size. These defects included a few fully spherical voids around 20 m in diameter and unfusioned WE43 powder particles.
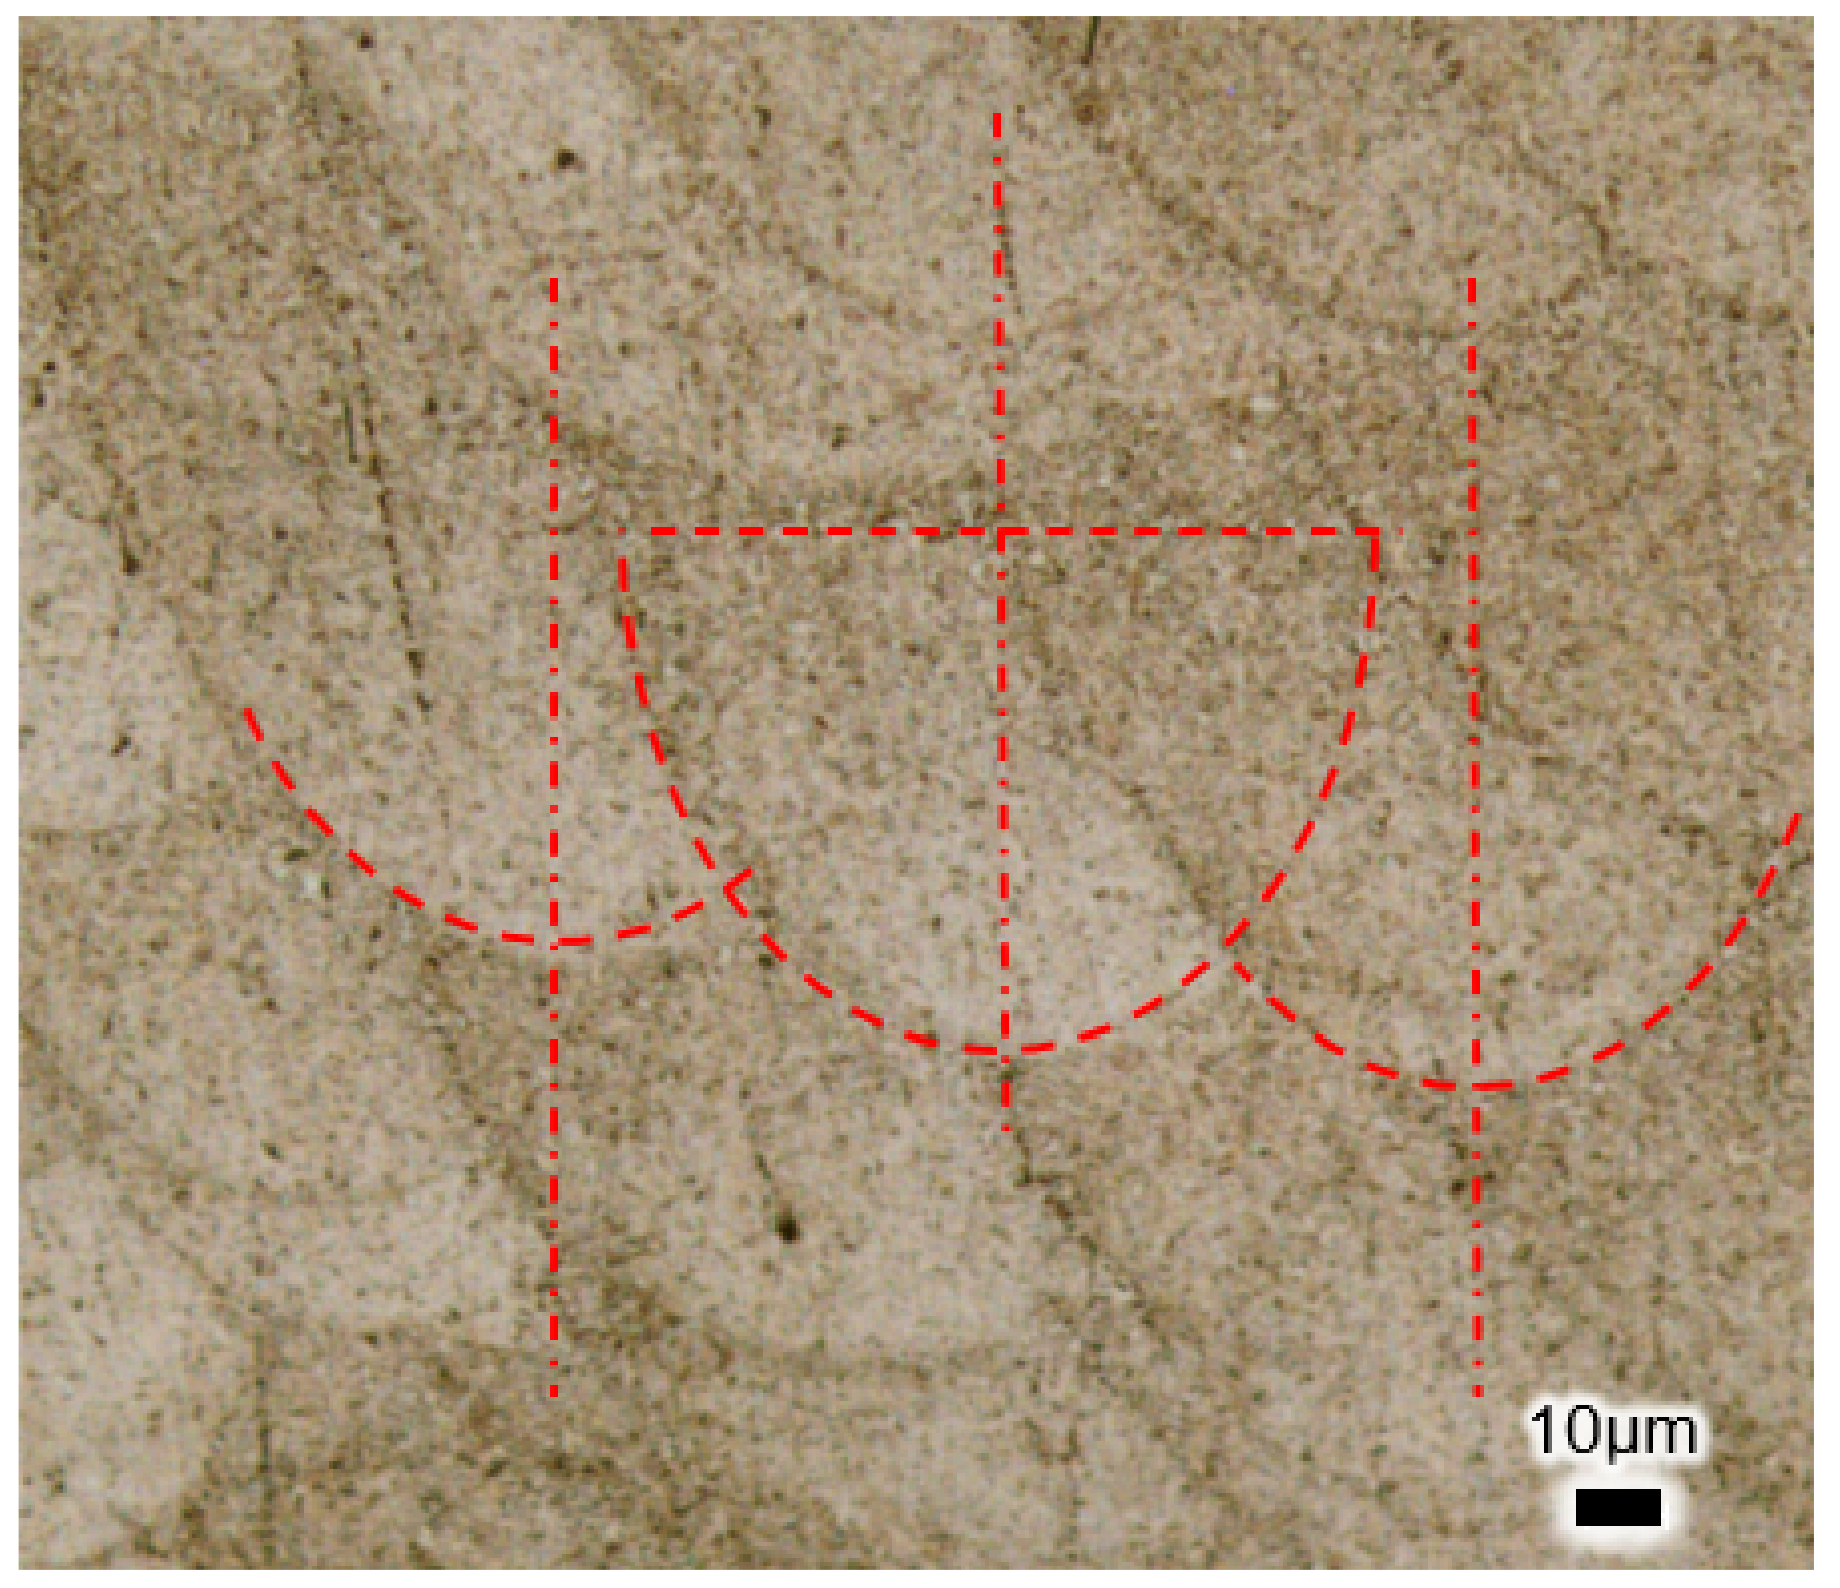
- Fitting analysis of the LPBF-formed WE43 magnesium alloy fusion pool revealed an ellipsoidal shape approximately 132 m long and 96 m wide, closely resembling actual fusion pool dimensions. Analysis indicated that with a powder layer thickness of 20 m, each layer of WE43 magnesium alloy powder underwent at least three refusion processes.
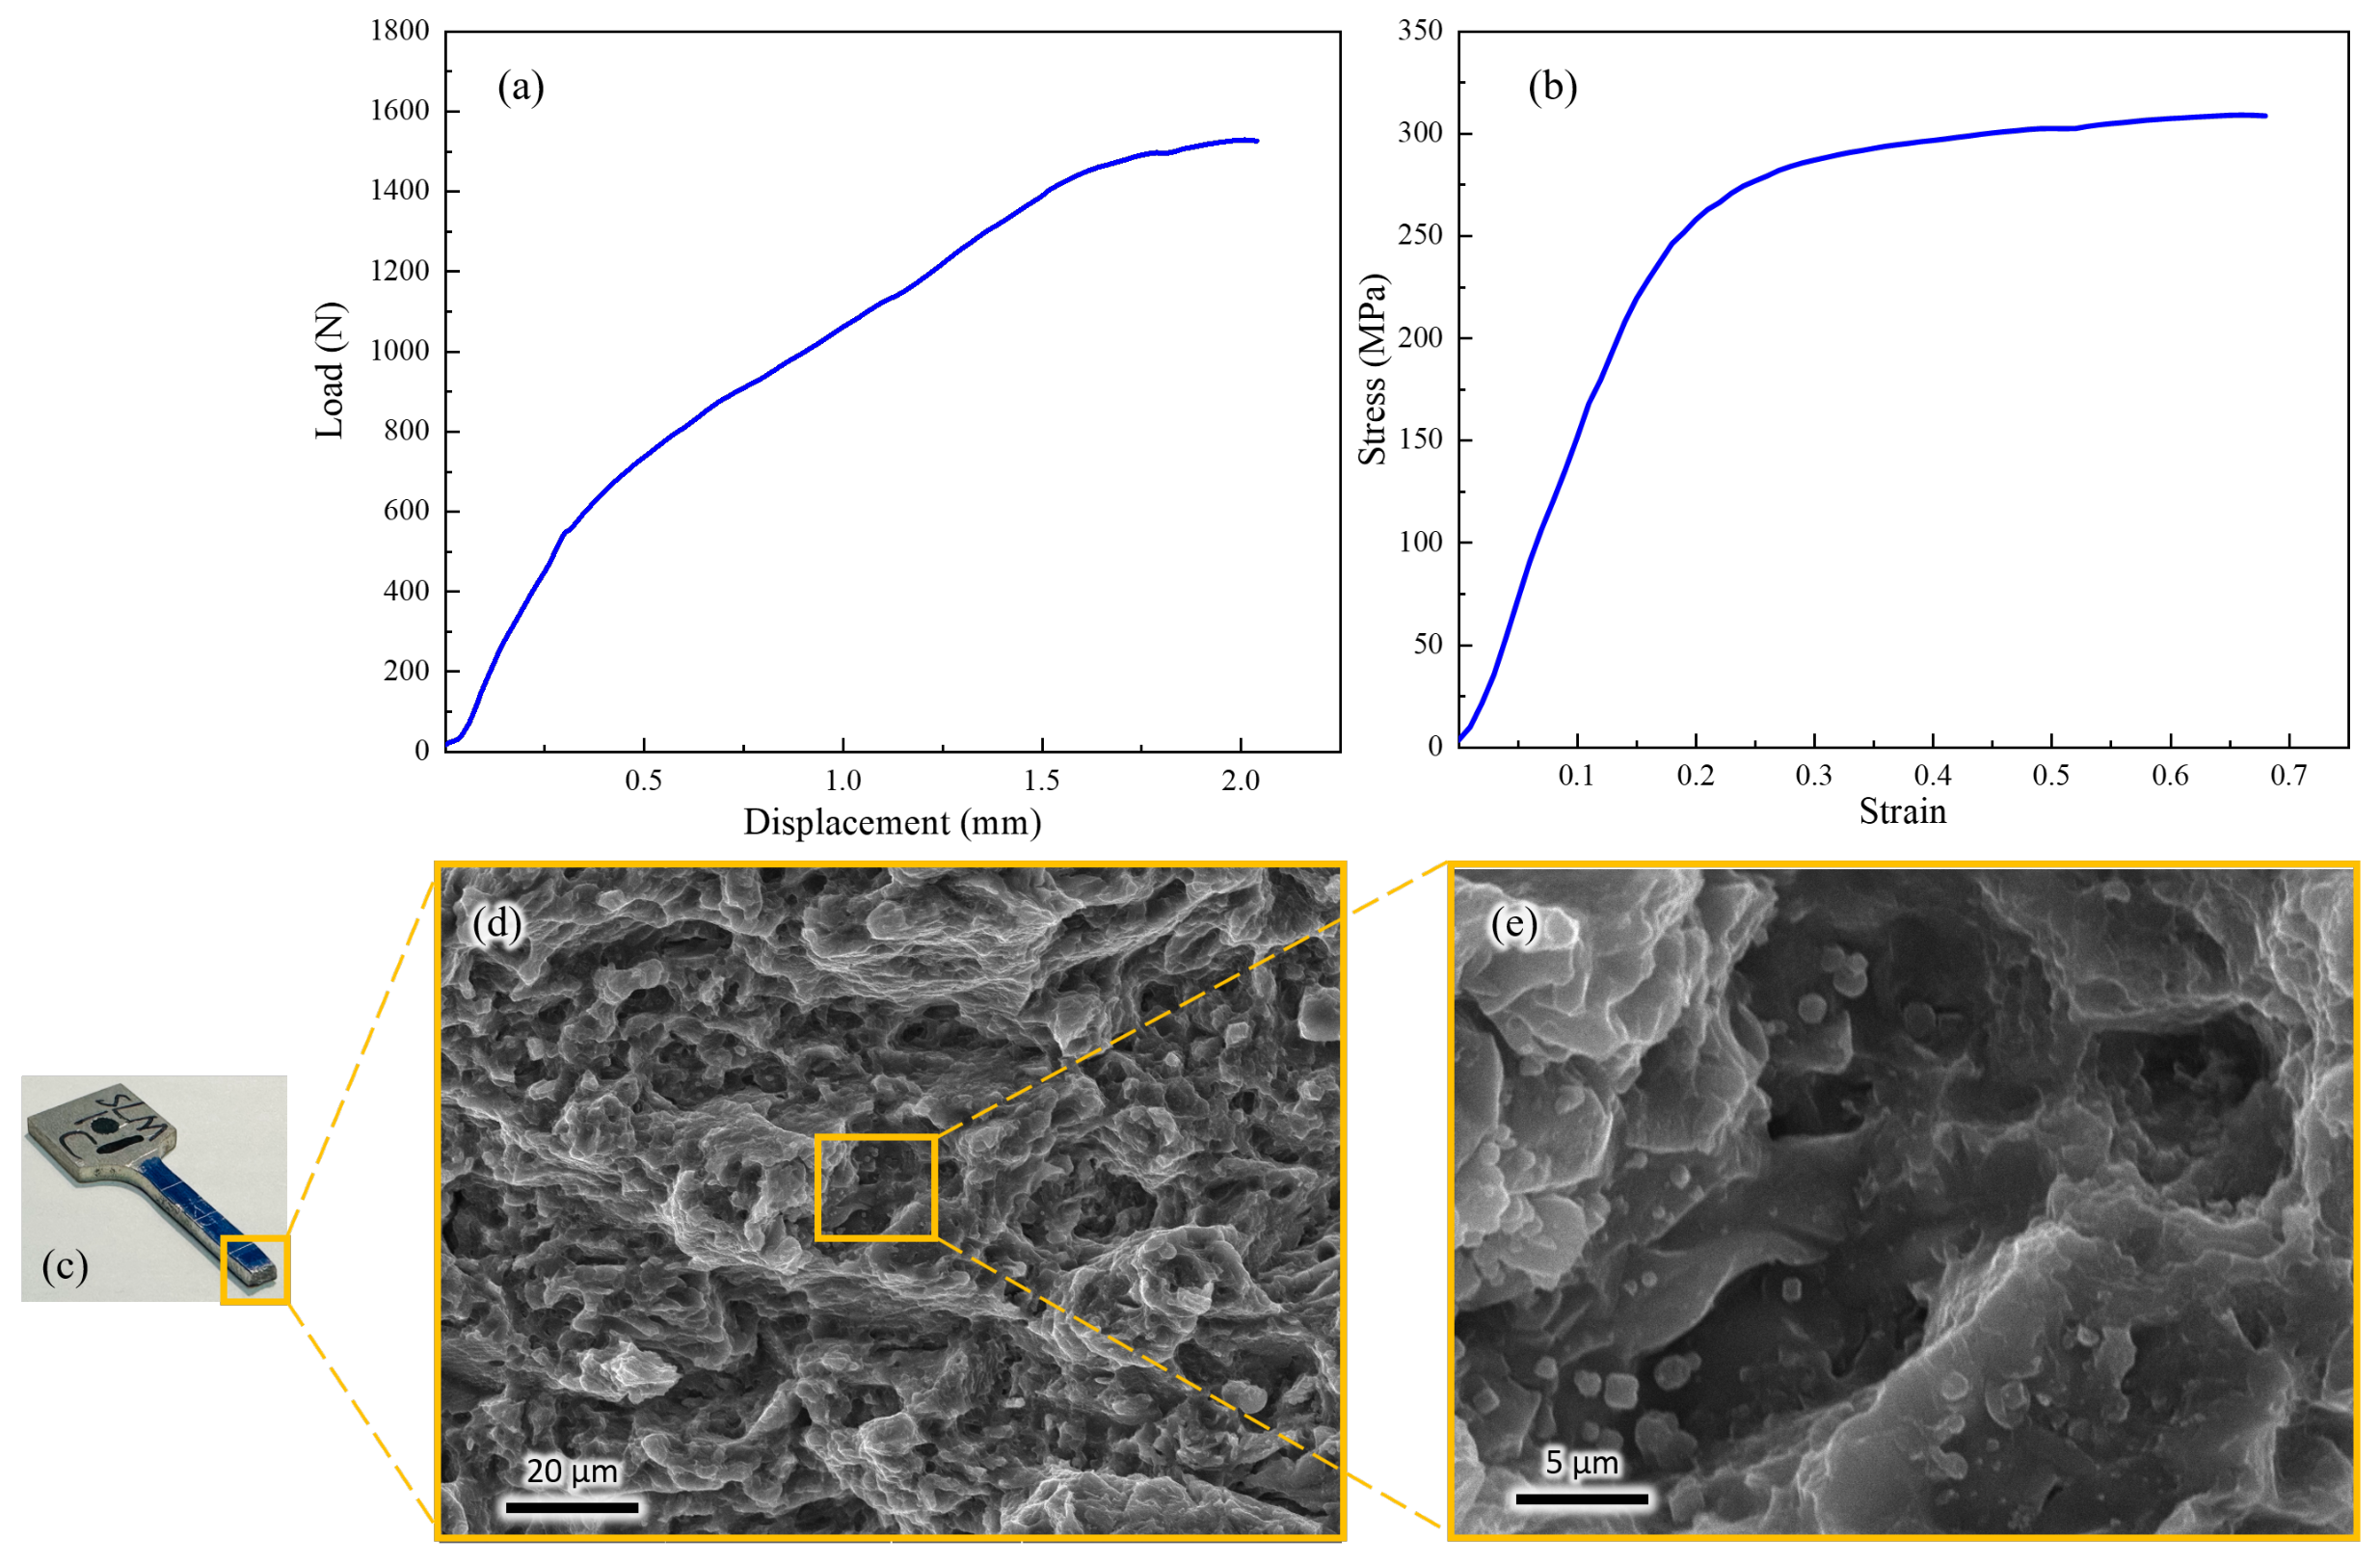
- LPBF-formed WE43 magnesium alloy exhibited an ultimate tensile strength of 313 ± 5 MPa, a yield strength of 236 ± 12 MPa, and an elongation of 7.6 ± 0.5%. The microstructure mainly consisted of fine equiaxed grains and columnar grains distributed in a striped pattern. The presence of “scales” significantly influenced grain size and distribution.
Author Contributions
Funding
Data Availability Statement
Conflicts of Interest
References
- Brune, T.; Kraemer, K.M.; Kontermann, C.; Oechsner, M. Comparison of Cast, Wrought, and LPBF Processed IN718 Concerning Crack Growth Threshold and Fatigue Crack Growth Behavior. J. Eng. Gas Turbines Power 2023, 145, 011016. [Google Scholar] [CrossRef]
- Vilanova, M.; Carmen Taboada, M.; Martinez-Amesti, A.; Niklas, A.; San Sebastian, M.; Guraya, T. Influence of Minor Alloying Element Additions on the Crack Susceptibility of a Nickel Based Superalloy Manufactured by LPBF. Materials 2021, 14, 5702. [Google Scholar] [CrossRef] [PubMed]
- Johnson, Q.C.; Laursen, C.M.; Spear, A.D.; Carroll, J.D.; Noell, P.J. Analysis of the interdependent relationship between porosity, deformation, and crack growth during compression loading of LPBF AlSi10Mg. Mater. Sci. Eng. A 2022, 852, 143640. [Google Scholar] [CrossRef]
- Rees, D.T.; Leung, C.L.A.; Elambasseril, J.; Marussi, S.; Shah, S.; Marathe, S.; Brandt, M.; Easton, M.; Lee, P.D. In situ X-ray imaging of hot cracking and porosity during LPBF of Al-2139 with TiB2 additions and varied process parameters. Mater. Des. 2023, 231, 112031. [Google Scholar] [CrossRef]
- Li, K.; Chen, W.; Yin, B.; Ji, C.; Bai, S.; Liao, R.; Yang, T.; Wen, P.; Jiang, B.; Pan, F. A comparative study on WE43 magnesium alloy fabricated by laser powder bed fusion coupled with deep cryogenic treatment: Evolution in microstructure and mechanical properties. Addit. Manuf. 2023, 77, 103814. [Google Scholar] [CrossRef]
- Agrawal, A.K.; Rankouhi, B.; Thoma, D.J. Predictive process mapping for laser powder bed fusion: A review of existing analytical solutions. Curr. Opin. Solid State Mater. Sci. 2022, 26, 101024. [Google Scholar] [CrossRef]
- Li, K.; Ji, C.; Bai, S.; Jiang, B.; Pan, F. Selective laser melting of magnesium alloys: Necessity, formability, performance, optimization and applications. J. Mater. Sci. Technol. 2023, 154, 65–93. [Google Scholar] [CrossRef]
- Brot, G.; Koutiri, I.; Bonnand, V.; Favier, V.; Dupuy, C.; Ranc, N.; Aimedieu, P.; Lefebvre, F.; Hauteville, R. Microstructure and defect sensitivities in the very high-cycle fatigue response of Laser Powder Bed Fused Ti-6Al-4V. Int. J. Fatigue 2023, 174, 107710. [Google Scholar] [CrossRef]
- Cook, P.S.; Ritchie, D.J. Determining the laser absorptivity of Ti-6Al-4V during laser powder bed fusion by calibrated melt pool simulation. Opt. Laser Technol. 2023, 162, 109247. [Google Scholar] [CrossRef]
- Preussner, J.; Roedler, G.; Fischer, F.G.; Hintz, K.; Friedmann, V.; Weisheit, A. Additive manufacturing of a lightweight Al-Ca alloy by direct energy deposition and laser powder bed fusion. Prakt. Metallogr. Pract. Metallogr. 2023, 60, 704–715. [Google Scholar] [CrossRef]
- Joshi, S.S.; Keller, C.; Hug, E.; Lefebvre, W. Quantifying microstructural contribution to yield stress and strain hardening of Ni20Cr alloy manufactured by laser powder bed fusion with different volumetric energy densities. J. Alloys Compd. 2023, 968, 172241. [Google Scholar] [CrossRef]
- Leonardi, S.; Dupuy, C.; Peyre, P.; Helbert, A.L.; Tarantino, M. Architected metallic cellular materials with random pore features: Computer design, LPBF fabrication and mechanical properties. Procedia Struct. Integr. 2024, 53, 327–337. [Google Scholar] [CrossRef]
- Cummings, C.; Corbin, D.J.; Reutzel, E.W.; Nassar, A.R. Resilience of laser powder bed fusion additive manufacturing to programmatically induced laser power anomalies. J. Laser Appl. 2023, 35, 032005. [Google Scholar] [CrossRef]
- Joshi, K.; Promoppatum, P.; Quek, S.S.; Raghavan, S.; Johan, N.S.; Shukla, S.; Samudrala, S.; van der Veen, S.; Jhon, M.H. Effect of porosity distribution on the strength and strain-to-failure of Laser-Powder Bed Fusion printed Ti–6Al–4V. Addit. Manuf. 2023, 75, 103738. [Google Scholar] [CrossRef]
- Zhou, M.M.; Wang, P.; Xu, L.; Deng, L.; Qi, J.F.; Zhang, L.C. Biomedical Mo particles reinforced titanium alloy fabricated by laser additive manufacturing. J. Alloys Compd. 2023, 960, 170512. [Google Scholar] [CrossRef]
- Calta, N.P.; Wang, J.; Kiss, A.M.; Martin, A.A.; Depond, P.J.; Guss, G.M.; Thampy, V.; Fong, A.Y.; Weker, J.N.; Stone, K.H.; et al. An instrument for in situ time-resolved X-ray imaging and diffraction of laser powder bed fusion additive manufacturing processes. Rev. Sci. Instrum. 2018, 89, 055101. [Google Scholar] [CrossRef] [PubMed]
- Liu, J.; Yin, B.; Song, F.; Liu, B.; Peng, B.; Wen, P.; Tian, Y.; Zheng, Y.; Ma, X.; Wang, C. Improving corrosion resistance of additively manufactured WE43 magnesium alloy by high temperature oxidation for biodegradable applications. J. Magnes. Alloys 2024, 12, 940–953. [Google Scholar] [CrossRef]
- Yin, B.; Liu, J.; Peng, B.; Zhou, M.; Liu, B.; Ma, X.; Wang, C.; Wen, P.; Tian, Y.; Zheng, Y. Influence of layer thickness on formation quality, microstructure, mechanical properties, and corrosion resistance of WE43 magnesium alloy fabricated by laser powder bed fusion. J. Magnes. Alloys 2024, 12, 1367–1385. [Google Scholar] [CrossRef]
- Vukkum, V.B.; Sanborn, T.; Shepherd, J.; Saptarshi, S.; Basu, R.; Horn, T.; Gupta, R.K. Influence of Spatter on Porosity, Microstructure, and Corrosion of Additively Manufactured Stainless Steel Printed Using Different Island Size. Crystals 2024, 14, 328. [Google Scholar] [CrossRef]
- Tigga, A.K.; Kumar, S.A.; Kenchappa, N.B.; Pathania, A. Effects of Graded Powder Dosage Factors on the Densification of LPBF Processed Inconel 718. Trans. Indian Inst. Met. 2023, 76, 3473–3481. [Google Scholar] [CrossRef]
- Hojjatzadeh, S.M.H.; Parab, N.D.; Guo, Q.; Qu, M.; Xiong, L.; Zhao, C.; Escano, L.I.; Fezzaa, K.; Everhart, W.; Sun, T.; et al. Direct observation of pore formation mechanisms during LPBF additive manufacturing process and high energy density laser welding. Int. J. Mach. Tools Manuf. 2020, 153, 103555. [Google Scholar] [CrossRef]
- Caprio, L.; Reynolds, W.; Demir, A.G.; Clare, A.; Previtali, B. Temporal modulation of the laser emission power for microstructural manipulation in powder bed fusion. J. Mater. Process. Technol. 2024, 330, 118448. [Google Scholar] [CrossRef]


| Zn | Zr | Gb | Nd | Y | Mg |
|---|---|---|---|---|---|
| 0.21 | 0.4 | 1.23 | 2.46 | 3.77 | Bal. |
| Parameters | Values |
|---|---|
| Laser Power/W | 80 |
| Laser Scanning Speed/mm·s−1 | 800 |
| Powder Layer Thickness/mm | 0.02 |
| Scan Spacing/mm | 0.07 |
| Scan Vector Angle/° | 67 |
| Scan Strategy | Stripe Scanning |
| Diameter of the focused beam/m | 70 |
Disclaimer/Publisher’s Note: The statements, opinions and data contained in all publications are solely those of the individual author(s) and contributor(s) and not of MDPI and/or the editor(s). MDPI and/or the editor(s) disclaim responsibility for any injury to people or property resulting from any ideas, methods, instructions or products referred to in the content. |
© 2024 by the authors. Licensee MDPI, Basel, Switzerland. This article is an open access article distributed under the terms and conditions of the Creative Commons Attribution (CC BY) license (https://creativecommons.org/licenses/by/4.0/).
Share and Cite
Men, Z.; Wang, L.; Gao, X.; Chen, W.; Ji, C.; Li, Z.; Li, K. Accurate Detection and Analysis of Pore Defects in Laser Powder Bed Fusion WE43 Magnesium Alloys. Micromachines 2024, 15, 909. https://doi.org/10.3390/mi15070909
Men Z, Wang L, Gao X, Chen W, Ji C, Li Z, Li K. Accurate Detection and Analysis of Pore Defects in Laser Powder Bed Fusion WE43 Magnesium Alloys. Micromachines. 2024; 15(7):909. https://doi.org/10.3390/mi15070909
Chicago/Turabian StyleMen, Zhengxing, Liang Wang, Xi Gao, Wen Chen, Chen Ji, Ziche Li, and Kun Li. 2024. "Accurate Detection and Analysis of Pore Defects in Laser Powder Bed Fusion WE43 Magnesium Alloys" Micromachines 15, no. 7: 909. https://doi.org/10.3390/mi15070909
APA StyleMen, Z., Wang, L., Gao, X., Chen, W., Ji, C., Li, Z., & Li, K. (2024). Accurate Detection and Analysis of Pore Defects in Laser Powder Bed Fusion WE43 Magnesium Alloys. Micromachines, 15(7), 909. https://doi.org/10.3390/mi15070909