Article

Ti3AlC2 MAX Phase Modified Screen-Printed Electrode for the Fabrication of Hydrazine Sensor

1
School of Materials Science and Engineering, Yeungnam University, Gyeongsan 38541, Republic of Korea
2
Department of Materials Science and Engineering, WW4-LKO, University of Erlangen-Nuremberg, Martensstrasse 7, 91058 Erlangen, Germany
3
Department of Chemistry, College of Science, King Saud University, Riyadh 11451, Saudi Arabia
*
Author to whom correspondence should be addressed.
Micromachines 2024, 15(5), 633; https://doi.org/10.3390/mi15050633
Submission received: 28 March 2024 / Revised: 4 May 2024 / Accepted: 7 May 2024 / Published: 9 May 2024

Abstract

:
Hydrazine is considered a powerful reducing agent and catalyst, showing diverse applications in agricultural industries, toxic degradation research, and wastewater management. Additionally, hydrazine can trigger some specific reactions when combined with suitable oxidants. Due to its highly polar nature, hydrazine can easily dissolve in alcohol, water, and various other polar solvents. Therefore, it can be extensively utilized in different areas of application and industries such as rocketry and various chemical applications. Despite its beneficial properties, hydrazine is unstable, posing significant risk due to its highly toxic nature. It is extremely hazardous to both human health and the environment. It can cause various illnesses and symptoms such as dizziness, temporary blindness, damage to the central nervous system, and even death when inhaled in sufficient quantities. Therefore, it is highly important to monitor the level of hydrazine to prevent its toxic and hazardous effects on human beings and the environment. In the present study, we discuss the simple fabrication of a disposable cost-effective and eco-friendly hydrazine sensor. We used a screen-printed carbon electrode, i.e., SPCE, as a base for the construction of a hydrazine sensor. The Ti3AlC2 MAX has been used as a suitable and efficient electrode material for the fabrication of disposable hydrazine sensors. We modified the active surface of the SPCE using a drop-casting approach. The resulting Ti3AlC2 MAX modified SPCE (Ti3AlC2@SPCE) has been utilized as an efficient and low-cost hydrazine sensor. Cyclic voltammetry, i.e., CV, and linear sweep voltammetry, viz., LSV, was employed as a sensing technique in this study. The optimization of pH and electrode material loading was conducted. The Ti3AlC2@SPCE exhibited excellent sensing performance toward hydrazine oxidation. A reasonable detection limit (0.01 µM) was achieved for hydrazine sensing. The fabricated sensor also demonstrated a reasonable linear range of 1–50 µM. This work provides the design and fabrication of simple disposable Ti3AlC2@SPCE as a suitable electrode for the determination of hydrazine using LSV technology.

1. Introduction

Hydrazine is known for its highly reducing and powerful antioxidant properties, which makes it an outstanding reactive molecule. Hydrazine plays a crucial role in various industrial products and processes, such as pesticides, emulsifiers, catalysis, polymerization, explosives, and agriculture, due to its versatile nature [1,2]. It plays a key role in various applications, such as corrosion inhibition, plutonium extraction, rocket fuels, insecticides, pharmaceuticals, blowing agents, heat stabilization, photographic development, dyes, and plant growth regulation [3,4,5,6,7]. Although hydrazine has several benefits and applications in various fields, its highly toxic nature makes it hazardous [6,7]. Even a small amount of hydrazine exposure can cause various health problems in humans, such as burning eyes, vomiting, respiratory distress, blood-related disorders, unconsciousness, and skin damage [1,3]. However, prolonged exposure or inhalation of hydrazine may cause severe damage to vital organs like the kidneys and liver and may even increase the risk of cancer [2,6,7]. The related hazardous drawbacks associated with hydrazine have motivated researchers to either improve safety protocols or develop efficient hydrazine detection techniques [8,9,10,11,12]. Therefore, significant efforts have been carried out to develop highly sensitive methods for the accurate detection of hydrazine such as titration, chromatography, amperometry, potentiometry, spectrophotometry, and flow injection analysis [1,10,13,14,15,16,17,18,19]. These various methods and techniques emphasize the ongoing efforts to develop consistent and precise methods for the early and accurate detection of hydrazine. However, some inherent drawbacks associated with these methods, such as their time-consuming nature, high cost, need for sophisticated instruments, and limitations in detecting low levels of hydrazine, still present significant challenges [1,5,10,13]. Among various techniques, electrochemical methods are considered a promising approach to detecting hydrazine due to their high sensitivity, rapid response time, cost-effectiveness, ease of operation, and suitability for real-time detection [20,21,22]. While the electrochemical sensing techniques offer various advantages, they still face some drawbacks, such as insufficient conductivity and limited surface area, which hinder the development of an optimal sensor [7,23]. Additionally, optimizing the efficiency of electron transfer is vital for confirming rapid response times [5,20,22,23,24]. To improve the sensing capability of electrochemical techniques, it is necessary to modify surface properties and conductivity [24,25,26]. Therefore, various nanomaterials, such as copper oxide (CuO), zinc oxide (ZnO), iron oxide (Fe2O3), tin oxide (TiO2), tungsten oxide (WO3), and manganese dioxide (MnO2), and layered materials, have been investigated for the fabrication of electrochemical-based hydrazine chemical sensors and other applications [5,16,27,28,29,30,31,32,33,34,35,36]. Recently, MXene, an innovative two-dimensional material (2D), has gained significant attention across various fields, including electrochemical sensors, biofuel cell design, environmental remediation, bioimaging, biosensors, photothermal therapy, drug delivery, theranostics, antibacterials, and cytocompatibility [18,34,35]. In 2011, Professor Gogotsi and colleagues discovered MXenes, which exhibit remarkable electrical conductivity and a hydrophilic surface [37]. Due to their outstanding properties, such as a large specific surface area, abundant surface functional groups, excellent stretchability, and biocompatibility, MXenes emerge as a leading choice for the development of electrochemical sensors [38,39,40]. MXenes are characterized by the general formula Mn+1AXnTX where n ranges from 1 to 3, M denotes the transition metal, X represents either carbon or nitrogen, and Tx signifies absorbed species like -OH, -O, and -F on the surface [41,42,43,44]. First, MXene was synthesized by selectively etching element A with hydrofluoric acid (HF) solution, leading to the formation of surface functional groups denoted as TX [37]. The composition and properties of these functional groups vary depending on the chosen etching route [45,46]. Titanium carbide (Ti3C2TX) is notably the first reported MXene and has been extensively studied within the MXene family. This makes it a prime candidate for various electrochemical sensor applications, including glucose detection, hydrazine sensing, environmental pesticide monitoring, and pharmaceutical compound sensing [34,37,45]. Significantly, Ti3C2X demonstrates remarkably high metallic conductivities ranging from 6000 to 8000 S/cm, surpassing many other 2D layered materials [45,47,48]. It is a good substrate for developing electrochemical sensing technology for hydrazine because of its remarkable intrinsic electrical conductivity and reactive hydrophilic surface [38,49]. Ti3C2TX is expected to perform better in electrochemical sensing applications than other 2D layered nanostructures [40,43].
In this study, we have developed an electrochemical sensor that exhibits a low limit of detection (LOD) for hydrazine with high sensitivity. Ti3AlC2 MAX phase and a modified screen-printed electrode assembly approach were utilized to fabricate an effective and low-cost hydrazine sensor. Notably, controlled exfoliation of Ti3AlC2 MAX was performed without using any external surface treatment. This approach improves electrochemical and catalytic properties, resulting in increased sensitivity and a lower detection limit for hydrazine. Considering the hazardous nature of toxic hydrazine, a cautious approach was employed for its detection. A working electrode for hydrazine detection was fabricated by depositing a Ti3AlC2 MAX layer onto a screen-printed carbon electrode (SPCE) with Nafion as a binder. The electrochemical sensor reported in this work demonstrates the ability to detect hydrazine with a low detection limit (DL) while also exhibiting good sensitivity, selectivity, reproducibility, stability, and repeatability. So far, no report is available on the fabrication of Ti3AlC2 MAX layer-based hydrazine sensor. This is the first report that used the Ti3AlC2 MAX layer-coated SPCE as a hydrazine sensor.

2. Materials and Methods

2.1. Chemicals and Reagents

Dopamine, uric acid, glucose, cholesterol, hydrogen peroxide, urea, sodium chloride, magnesium chloride, cadmium chloride, mercury chloride, catechol, ammonia, 4-chlorophenol, 4-nitrophenol, methanol, and acetone were obtained from Merck. Phosphate buffer saline (PBS) was purchased from Sigma Aldrich.

2.2. Apparatus

The powder X-ray diffraction (P-XRD) pattern of the Ti3AlC2 MAX was obtained on Rigaku company (Japan), RINT 2500 V X-ray diffractometer with Cu/Kα irradiation (λ = 1.5406 Å). The surface topological results, i.e., scanning electron microscopic (SEM) images of the Ti3AlC2 MAX, were recorded on a field emission scanning electron microscope (FESEM; Supra 55 Zeiss) equipped with energy-dispersive X-ray (EDAX) spectroscopy (Oxford Instrument’ X-max; Aztec). The EDAX spectrum of the Ti3AlC2 MAX was examined using Oxford Instrument’ X-max, an Aztec instrument. The electrochemical sensing studies were carried out on Metrohm Autolab PGSTAT 302N (Nova software has been used to record the data; version 1.10) instrument. The screen-printed carbon electrode, i.e., SPCE, was used as a working electrode, while a silver/silver chloride (Ag/AgCl) electrode was utilized as a reference electrode. The platinum wire-based counter electrode was employed as a counter electrode. The electrochemical measurements were performed in a three-electrode assembly system.

2.3. Fabrication of Sensor

The Ti3AlC2 MAX (3 mg/mL) was sonicated in deionized water (DI) for a few hours to obtain the homogenous dispersion of the Ti3AlC2 MAX. Nafion (binder), 0.5 wt%, was added to the Ti3AlC2 MAX dispersion and sonicated for another 1 h. The bare active surface of the SPCE was modified using Ti3AlC2 MAX as electrode material. Different amounts of Ti3AlC2 MAX dispersion (4 µL, 6 µL, 8 µL, and 10 µL) were drop-cast onto the active surface of the SPCE and let dry for a few hours. 7.5 µL of the glucose oxidase was also coated on the fabricated electrode to improve the catalytic activity. The Ti3AlC2 MAX modified (after drying process) was used as a working electrode for electrochemical sensing application. In the paper, the Ti3AlC2 MAX modified SPCE electrode was denoted as Ti3AlC2@SPCE. The surface modification and operation of the Ti3AlC2@SPCE for hydrazine sensing are illustrated in Scheme 1 below.

3. Results and Discussion

3.1. Materials Characterization

The phase purity and crystalline nature can be determined using the P-XRD technique [50,51]. In this study, the P-XRD pattern of the Ti3AlC2 MAX was obtained in the applied 2theta range of 5–80°. Figure 1 illustrates the P-XRD spectrum of Ti3AlC2 MAX. The P-XRD pattern of the Ti3AlC2 MAX shows three major diffraction peaks observed at 2theta values of 9.17°, 18.98°, and 38.97°, which can be assigned to the (002), (004), and (104) diffraction planes, respectively.
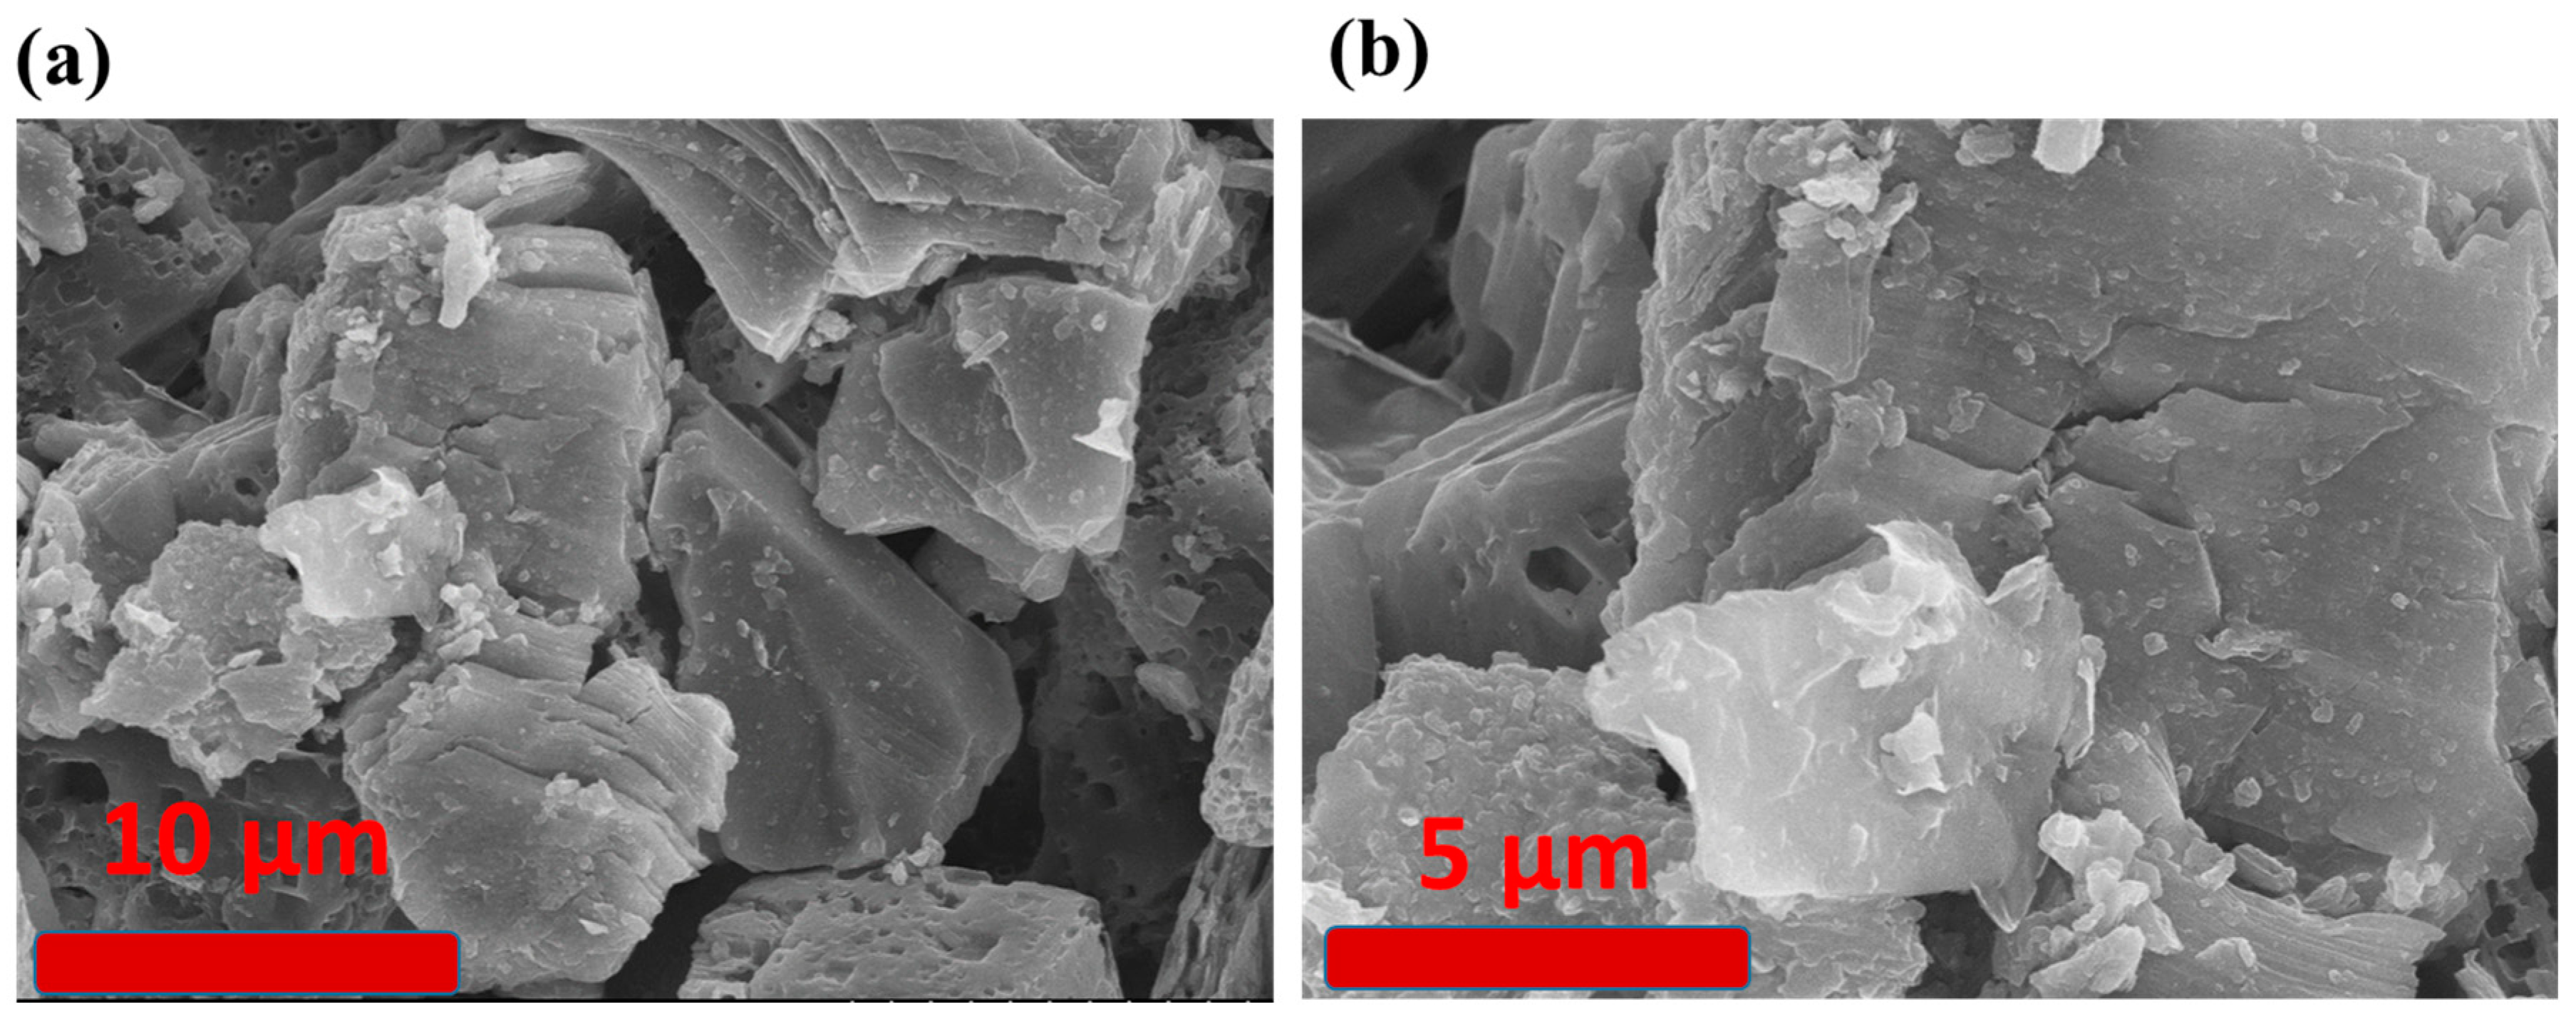
However, other diffraction peaks at 2theta value of 34.15°, 36.83°, 41.96°, 47.61°, 52.67°, 56.88°, 60.71°, 65.97°, 70.93°, and 74.54° correspond to (101), (103), (105), (107), (108), (109), (110), (1011), (1012), and (118) diffraction planes of Ti3AlC2 MAX, respectively. This P-XRD pattern and diffraction planes are in good agreement with the reported JCPDS-number 052-0875. The presence of strong diffraction peaks with high intensity indicates the presence of a good crystalline nature while the absence of any additional diffraction peak related to the impurities suggests a high degree of phase purity. Surface morphological properties also play a key role in determining the electrochemical sensing performance. Therefore, it is important to examine the surface morphological characteristics of the Ti3AlC2 MAX. The obtained SEM images are displayed in Figure 2a,b. The SEM results show that Ti3AlC2 MAX has a flake-like structure that forms the sheets.
The Ti3AlC2 MAX is a two-dimensional (2D) material, and SEM images show that Ti3AlC2 MAX possesses a sheet-like surface structure, which may be beneficial for better electron transport during the redox reactions at the surface of the fabricated electrochemical sensors [52]. It is known that flake-like surface-structured materials possess a high surface area, which may provide a better path for charge transport along the plane of the flakes. This can lead to faster electron transfer compared with bulk materials where charge transport may be hindered by longer pathways or structural defects. It is also expected that flake-like morphology can improve the contact between the material and the analyte in three electrochemical systems. This may benefit the exchange of ions or molecules involved in the redox reactions, leading to improved electron transport. Thus, it is believed that Ti3AlC2 MAX would be beneficial for electrochemical sensing applications.
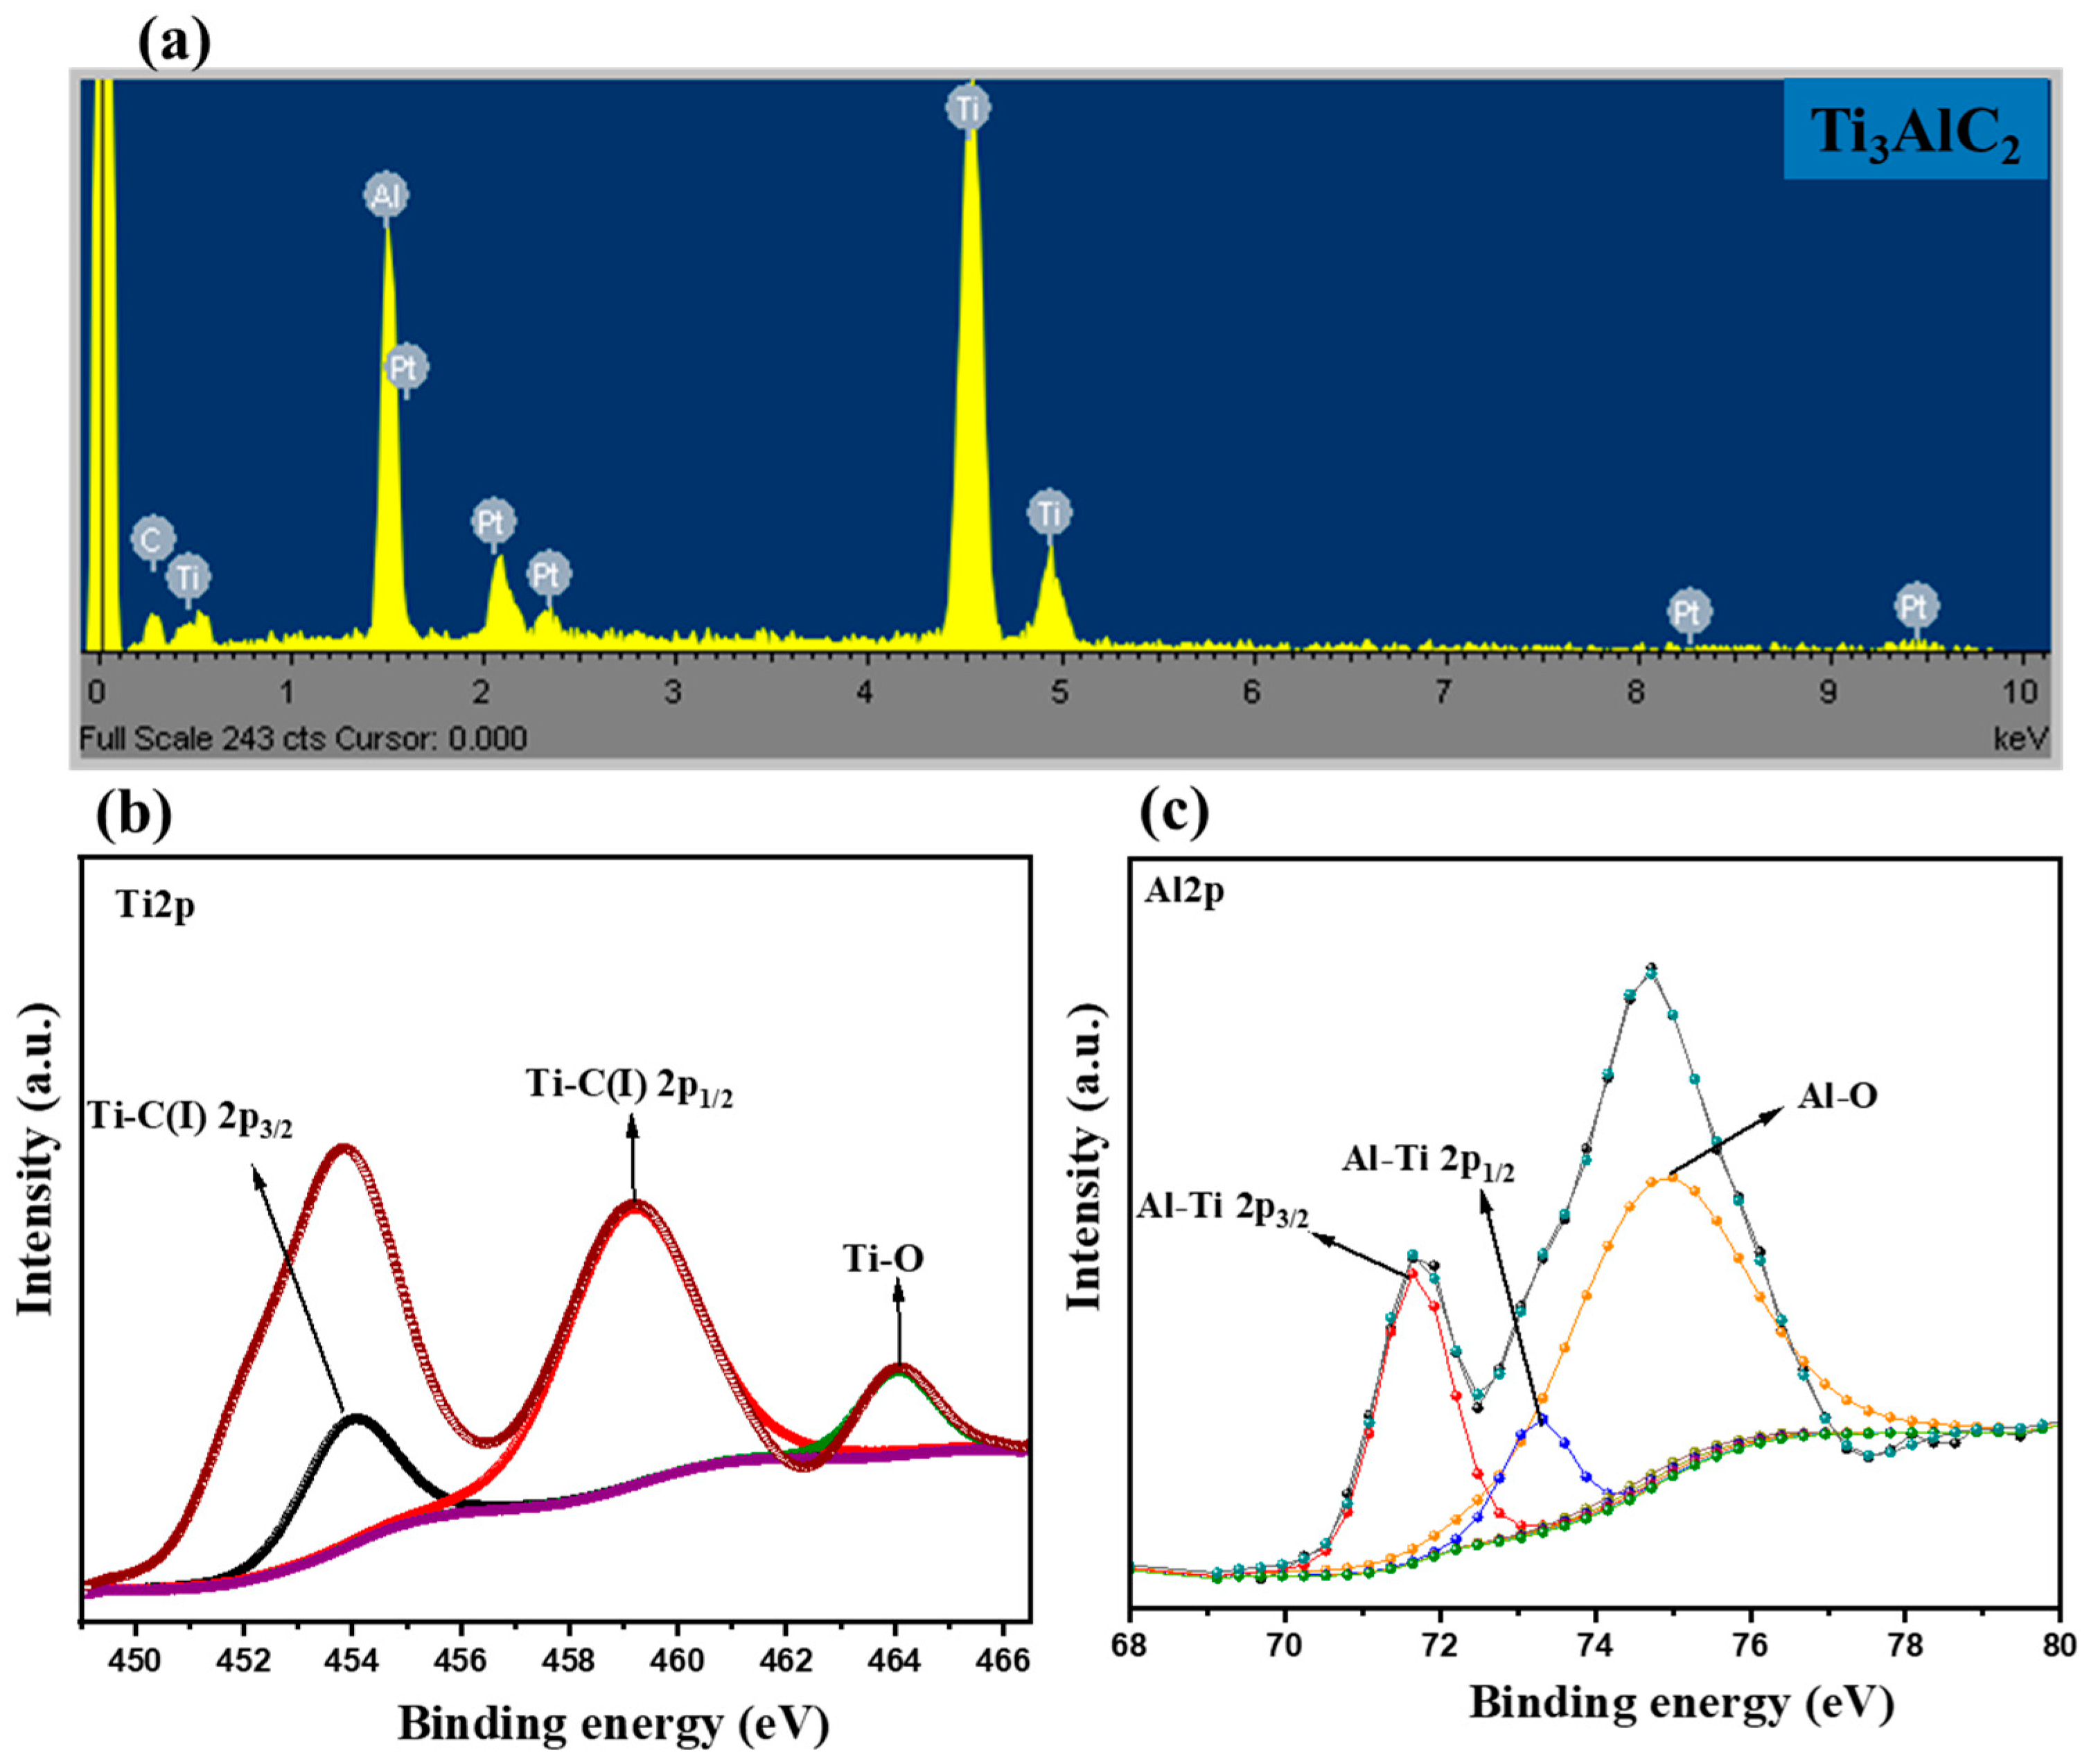
Furthermore, the elemental composition and phase purity of the Ti3AlC2 MAX were studied using the EDAX technique. The EDAX spectrum of the Ti3AlC2 MAX was obtained using an EDAX spectroscope. Figure 3a displays the EDAX spectrum of the Ti3AlC2 MAX. The EDAX spectrum indicates the signals for C, Ti, and Al elements. It can be clearly understood that Ti3AlC2 MAX has good phase purity.
Furthermore, elemental oxidation states of the Ti2p and Al2p of the Ti3AlC2 MAX have been studied using X-ray photoelectron spectroscopy (XPS). The obtained XPS results for the Ti2p and Al2p XPS scans are provided in Figure 3b,c. Figure 3b shows the XPS scan of Ti2p, which exhibits the presence of three major XPS signals at binding energy values of 454.01, 459.23, and 464.2 eV, which can be assigned to the presence of Ti-C(I) 2p3/2, Ti-C(I) 2p1/2 and Ti-O bonds, respectively. Similarly, Figure 3c shows a high-resolution scan of Al2p XPS which reveals the presence of three de-convoluted XPS peaks at binding energy values of 71.67, 73.30, and 74.87 eV, which can be ascribed to the presence of Al-Ti 2p3/2, Al-Ti 2p1/2 and Al-O bonds, respectively [53].

3.2. Electrochemical Performance

After physiochemical characterization of the Ti3AlC2 MAX, a based sensor was fabricated using Ti3AlC2 MAX as a catalyst to facilitate electron transport during the oxidation of hydrazine. The carbon-based bare surface of the SPCE was modified with Ti3AlC2 MAX as an electrocatalyst via drop-casting the dispersion (8 µL) of the Ti3AlC2 MAX. Cyclic voltammetry (CV) is one of the basic electrochemical techniques to study the electrochemical behavior or properties of the modified electrodes in a particular analyte. Thus, it is important to study the electrochemical behavior of the bare SPCE and Ti3AlC2@SPCE for the oxidation of hydrazine (Hz). In this context, the CV approach was utilized for the electrochemical oxidation of Hz. In the first step, the CV of the bare SPCE was recorded for the electrochemical oxidation of 55 µM Hz under the 0.1 M PBS conditions (pH = 8.0) at the applied scan potential rate of 50 mVs−1, as shown in Figure 4 (black color pattern).
The obtained results show a very low response in terms of the current value. The bare SPCE exhibited poor catalytic behavior for the oxidation of Hz using the CV method. Further, we have obtained the CV pattern of the Ti3AlC2@SPCE in the presence of 55 µM Hz under the 0.1 M PBS conditions (pH = 8.0) at the applied scan potential rate of 50 mVs−1. The obtained CV graph is shown in Figure 4. According to the obtained CV results, it can be seen from Figure 4 that Ti3AlC2@SPCE shows good catalytic properties in comparison to the bare SPCE. The Ti3AlC2@SPCE shows an enhanced current response—in comparison to the bare SPCE—to the oxidation of 55 µM Hz under the 0.1 M PBS conditions (pH = 8.0) at the applied scan potential rate of 50 mVs−1. Therefore, it is clear that a significant improvement in the oxidation of Hz is observed, which may be attributed to the presence of conductive properties of the Ti3AlC2 on the surface of the modified SPCE. The aforementioned CV results have been studied for an 8 µL catalyst (Ti3AlC2 MAX). The amount of catalyst can significantly affect the catalytic properties of the developed sensors or electrodes toward the electro-oxidation of Hz. Thus, the loading amount of the Ti3AlC2 MAX was optimized toward the sensing of 55 µM Hz under the 0.1 M PBS conditions (pH = 8.0) at the applied scan potential rate of 50 mVs−1. Figure S1 shows the current responses of the Ti3AlC2@SPCE (loaded with different amounts of 4 µL, 6 µL, 8 µL, and 10 µL) toward the oxidation of 55 µM Hz. It can be seen from Figure S1 that first, the current value increases up to 8 µL, and then, a reduction is observed at 10 8 µL. Among the different loading amounts, 8 µL showed the higher current value for modified Ti3AlC2@SPCE toward the oxidation of 55 µM Hz. Thus, 8 µL modified Ti3AlC2@SPCE was used for all the further electrochemical studies. The pH of the analyte solution may also play a significant role and should be optimized. Hence, we have optimized the pH of the analyte solution. In this context, current responses of the Ti3AlC2@SPCE were also obtained for 55 µM Hz under the 0.1 M PBS conditions (pH = 2.0, 4.0, 6.0, 8.0, and 10.0) at the applied scan potential rate of 50 mVs−1. The current responses are summarized in Figure S2. The observations indicate that Ti3AlC2@SPCE has a good electrocatalytic response for 55 µM Hz in the presence of 0.1 M PBS at pH 8.0. Therefore, it is reasonable to use 0.1 M PBS at pH 8.0 for further investigations. Hence, 0.1 M PBS of pH 8.0 was used as an optimized condition for other electrochemical examinations.
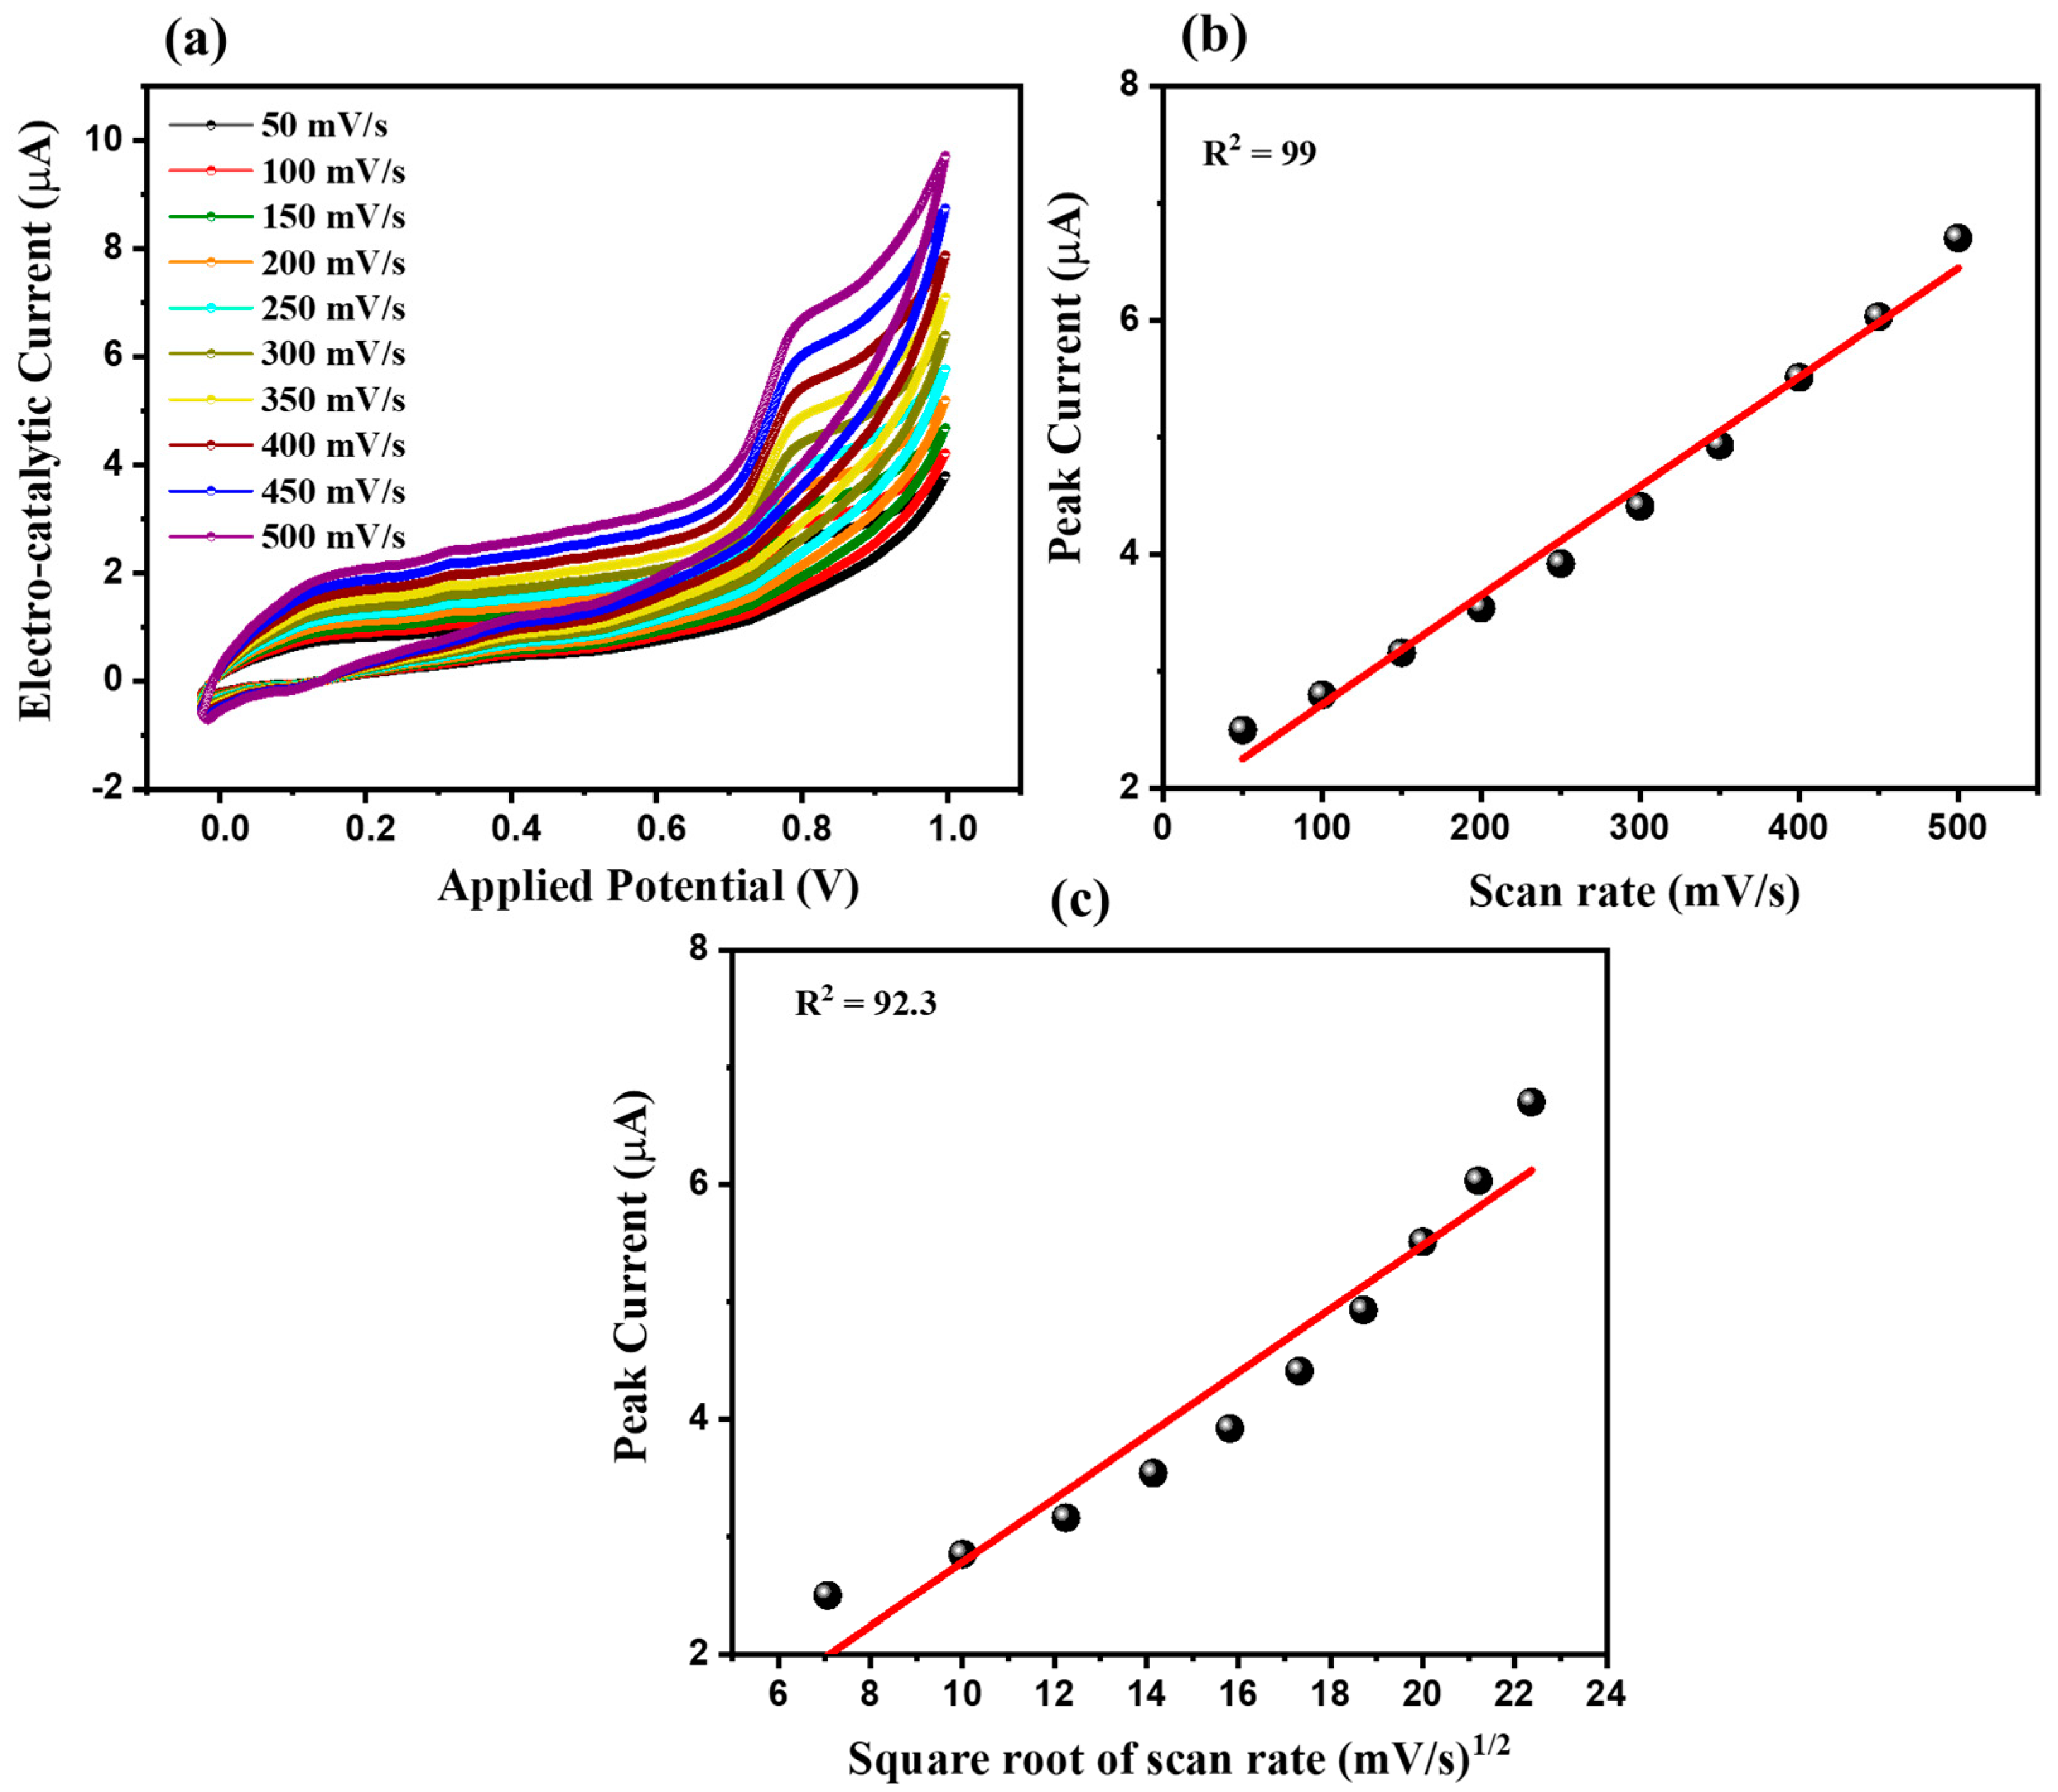
The applied scan rate of the electrochemical setup may affect the current responses of the working electrode toward the diffusion or adsorption of the analyte at a particular potential. The CV response of the Ti3AlC2@SPCE was recorded in the presence of 55 µM Hz under the 0.1 M PBS conditions (pH = 8.0) at different applied scan potential rates (50 mVs−1, 100 mVs−1, 150 mVs−1, 200 mVs−1, 250 mVs−1, 300 mVs−1, 350 mVs−1, 400 mVs−1, 450 mVs−1, and 500 mVs−1). The obtained CV results at different applied scan rates are summarized in Figure 5a, which shows that the current response of the Ti3AlC2@SPCE increases as the applied scan rates.
In order to see the effect of different scan rates, we have plotted the calibration curve between the current response and the applied scan rate as shown in Figure 5b. It can be seen from Figure 5b that the current response of the Ti3AlC2@SPCE for 55 µM Hz linearly increases with scan rates. Furthermore, the regression constant (R2) value of 0.99 is obtained from the calibration curve after fitting the data, which suggests that the electrochemical oxidation of Hz is an adsorption-controlled process rather than a diffusion-controlled process. The calibration plot of the current response of the Ti3AlC2@SPCE with respect to the square root of the applied scan rates is presented in Figure 5c. The R2 value of 92.3 is obtained, which also supports that the electrochemical oxidation of Hz is an adsorption-controlled process. Linear sweep voltammetry, i.e., LSV, method can be a more sensitive approach compared with the CV. Using the simple and sensitive linear sweep voltammetry (LSV) approach as a sensing platform for detecting Hz is worthwhile.
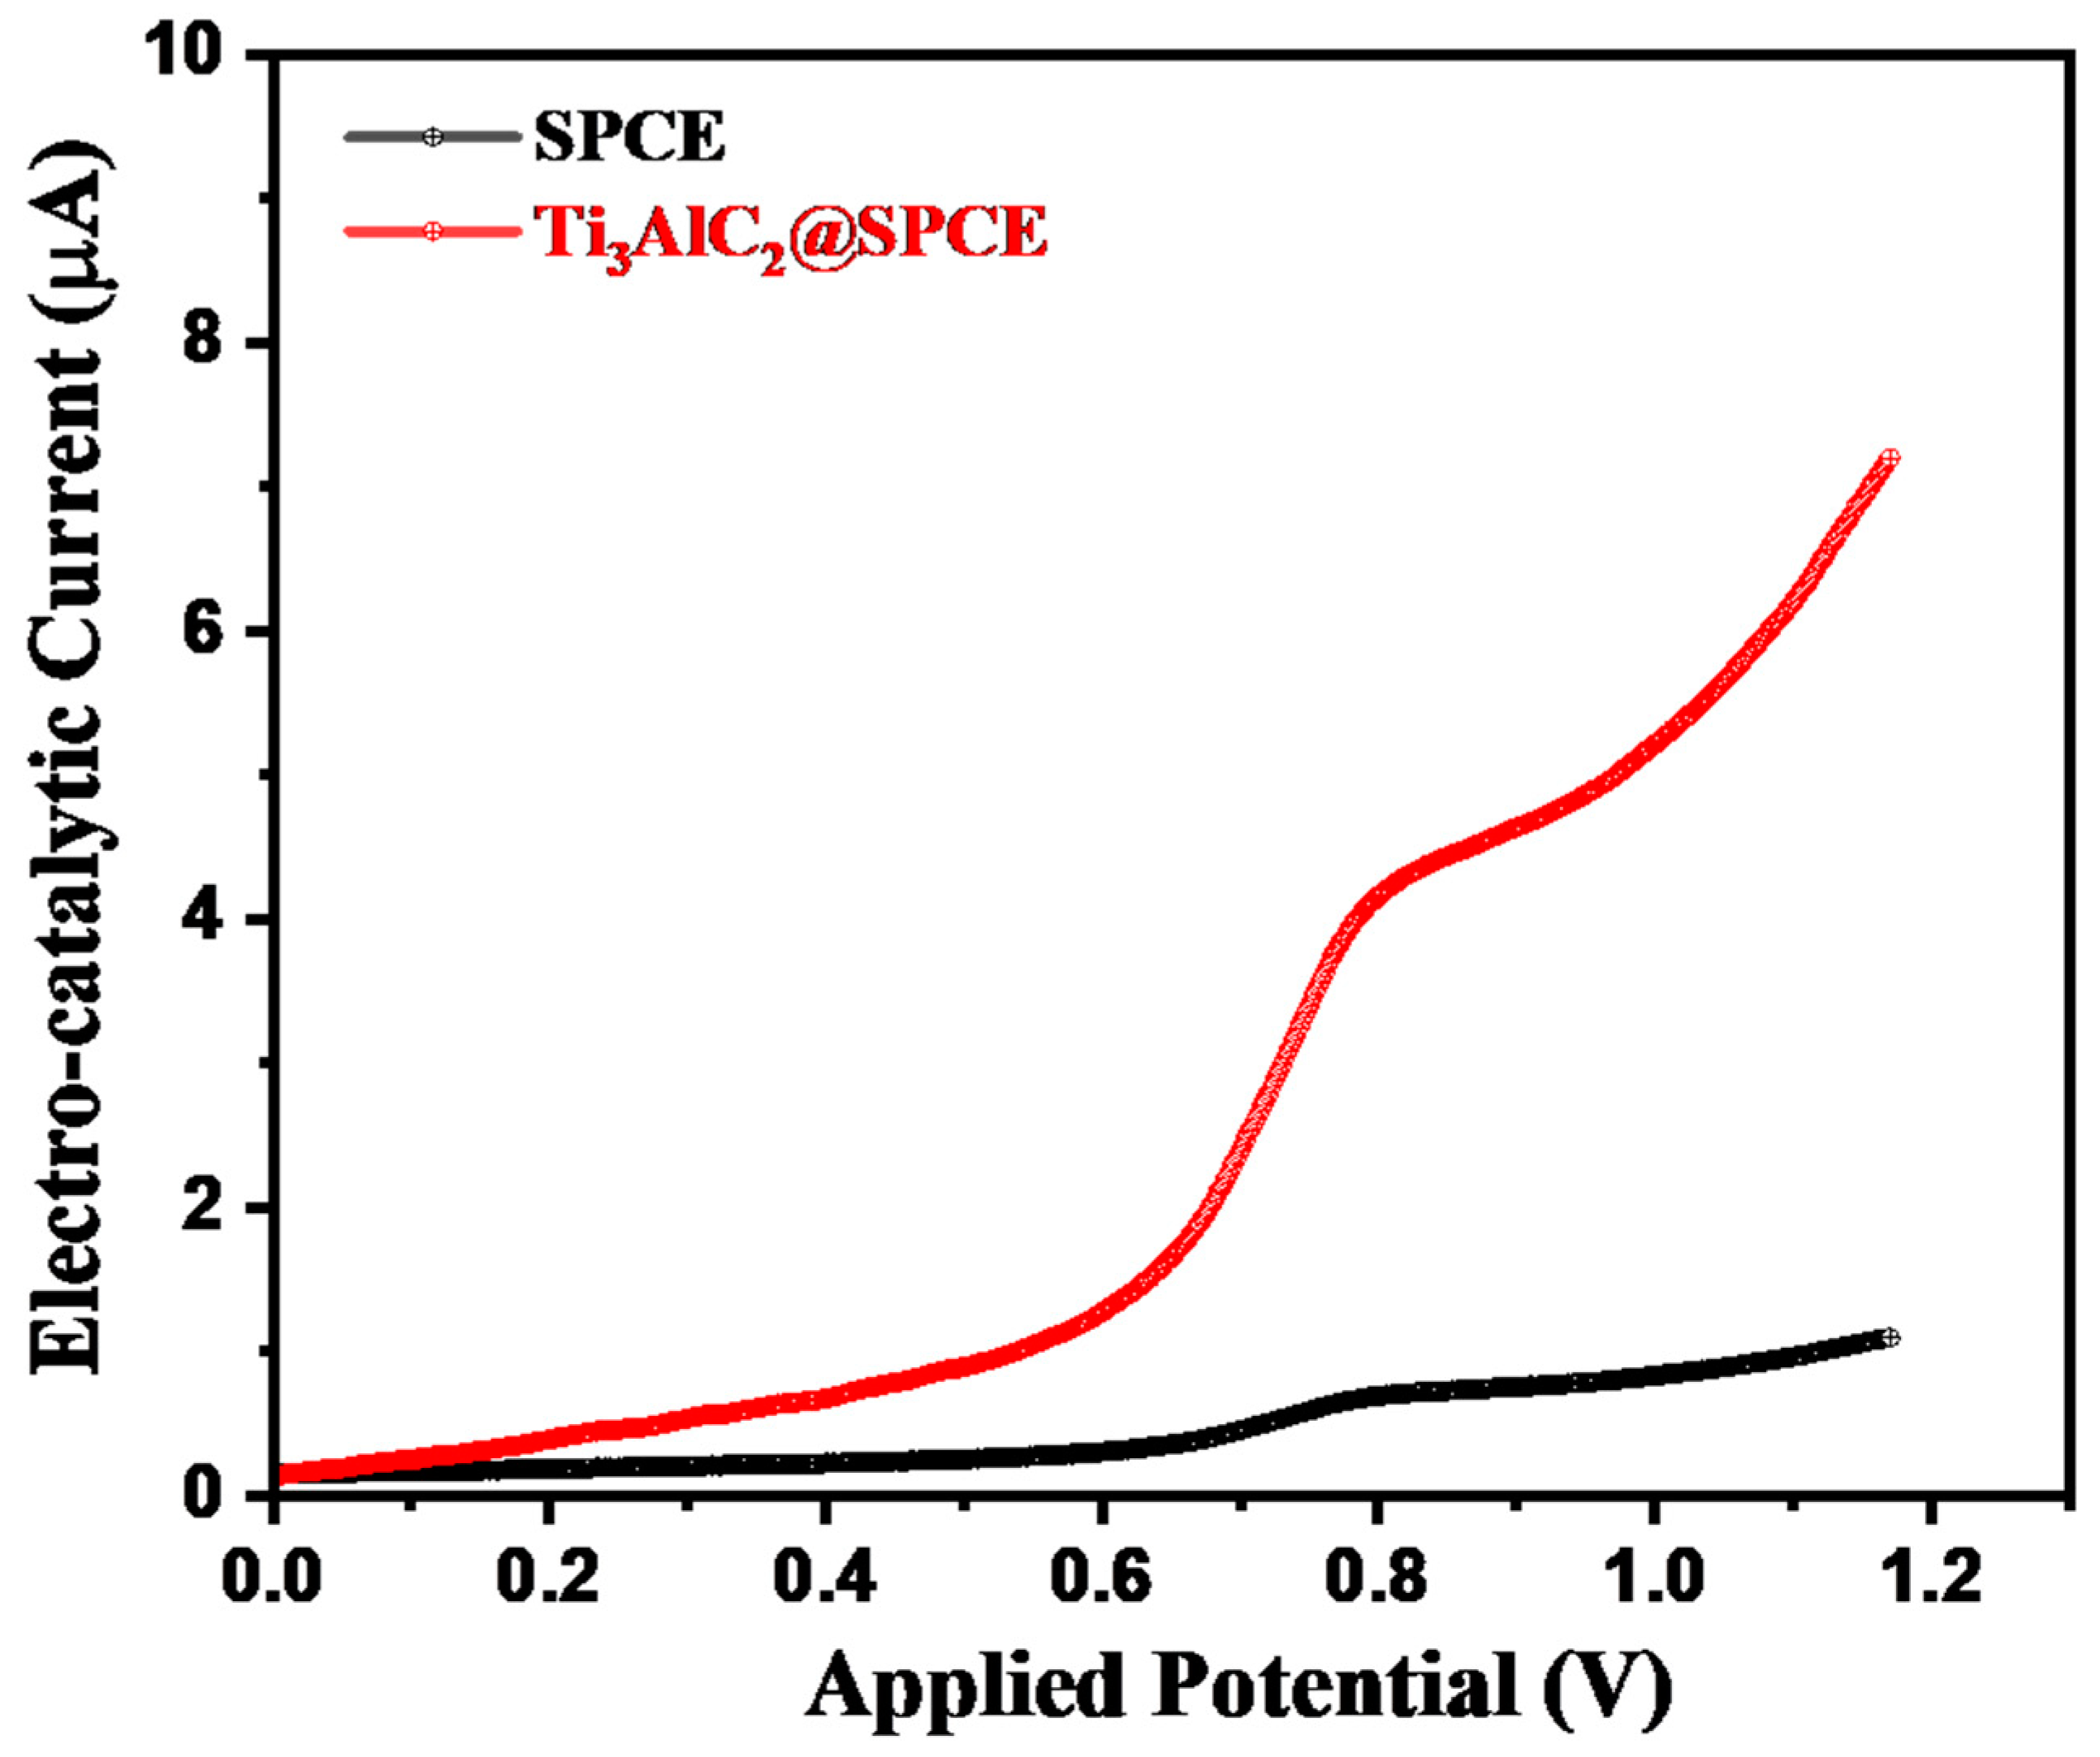
Therefore, we have used the LSV approach to further the sensing platform for the electrochemical oxidation of Hz. The LSV patterns of the bare SPCE and Ti3AlC2@SPCE were collected in the presence of 55 µM Hz under the 0.1 M PBS conditions (pH = 8.0) at the applied scan potential of 50 mVs−1. The obtained LSV results are given in Figure 6. It can be clearly observed that bare SPCE has a poor current response signal for the electrochemical oxidation of Hz. In the case of the electrochemical oxidation of Hz using Ti3AlC2@SPCE, an improved LSV signal is observed, as shown in Figure 6. This indicates that Ti3AlC2@SPCE exhibits higher catalytic features in the electrochemical oxidation of Hz compared with SPCE under similar conditions.
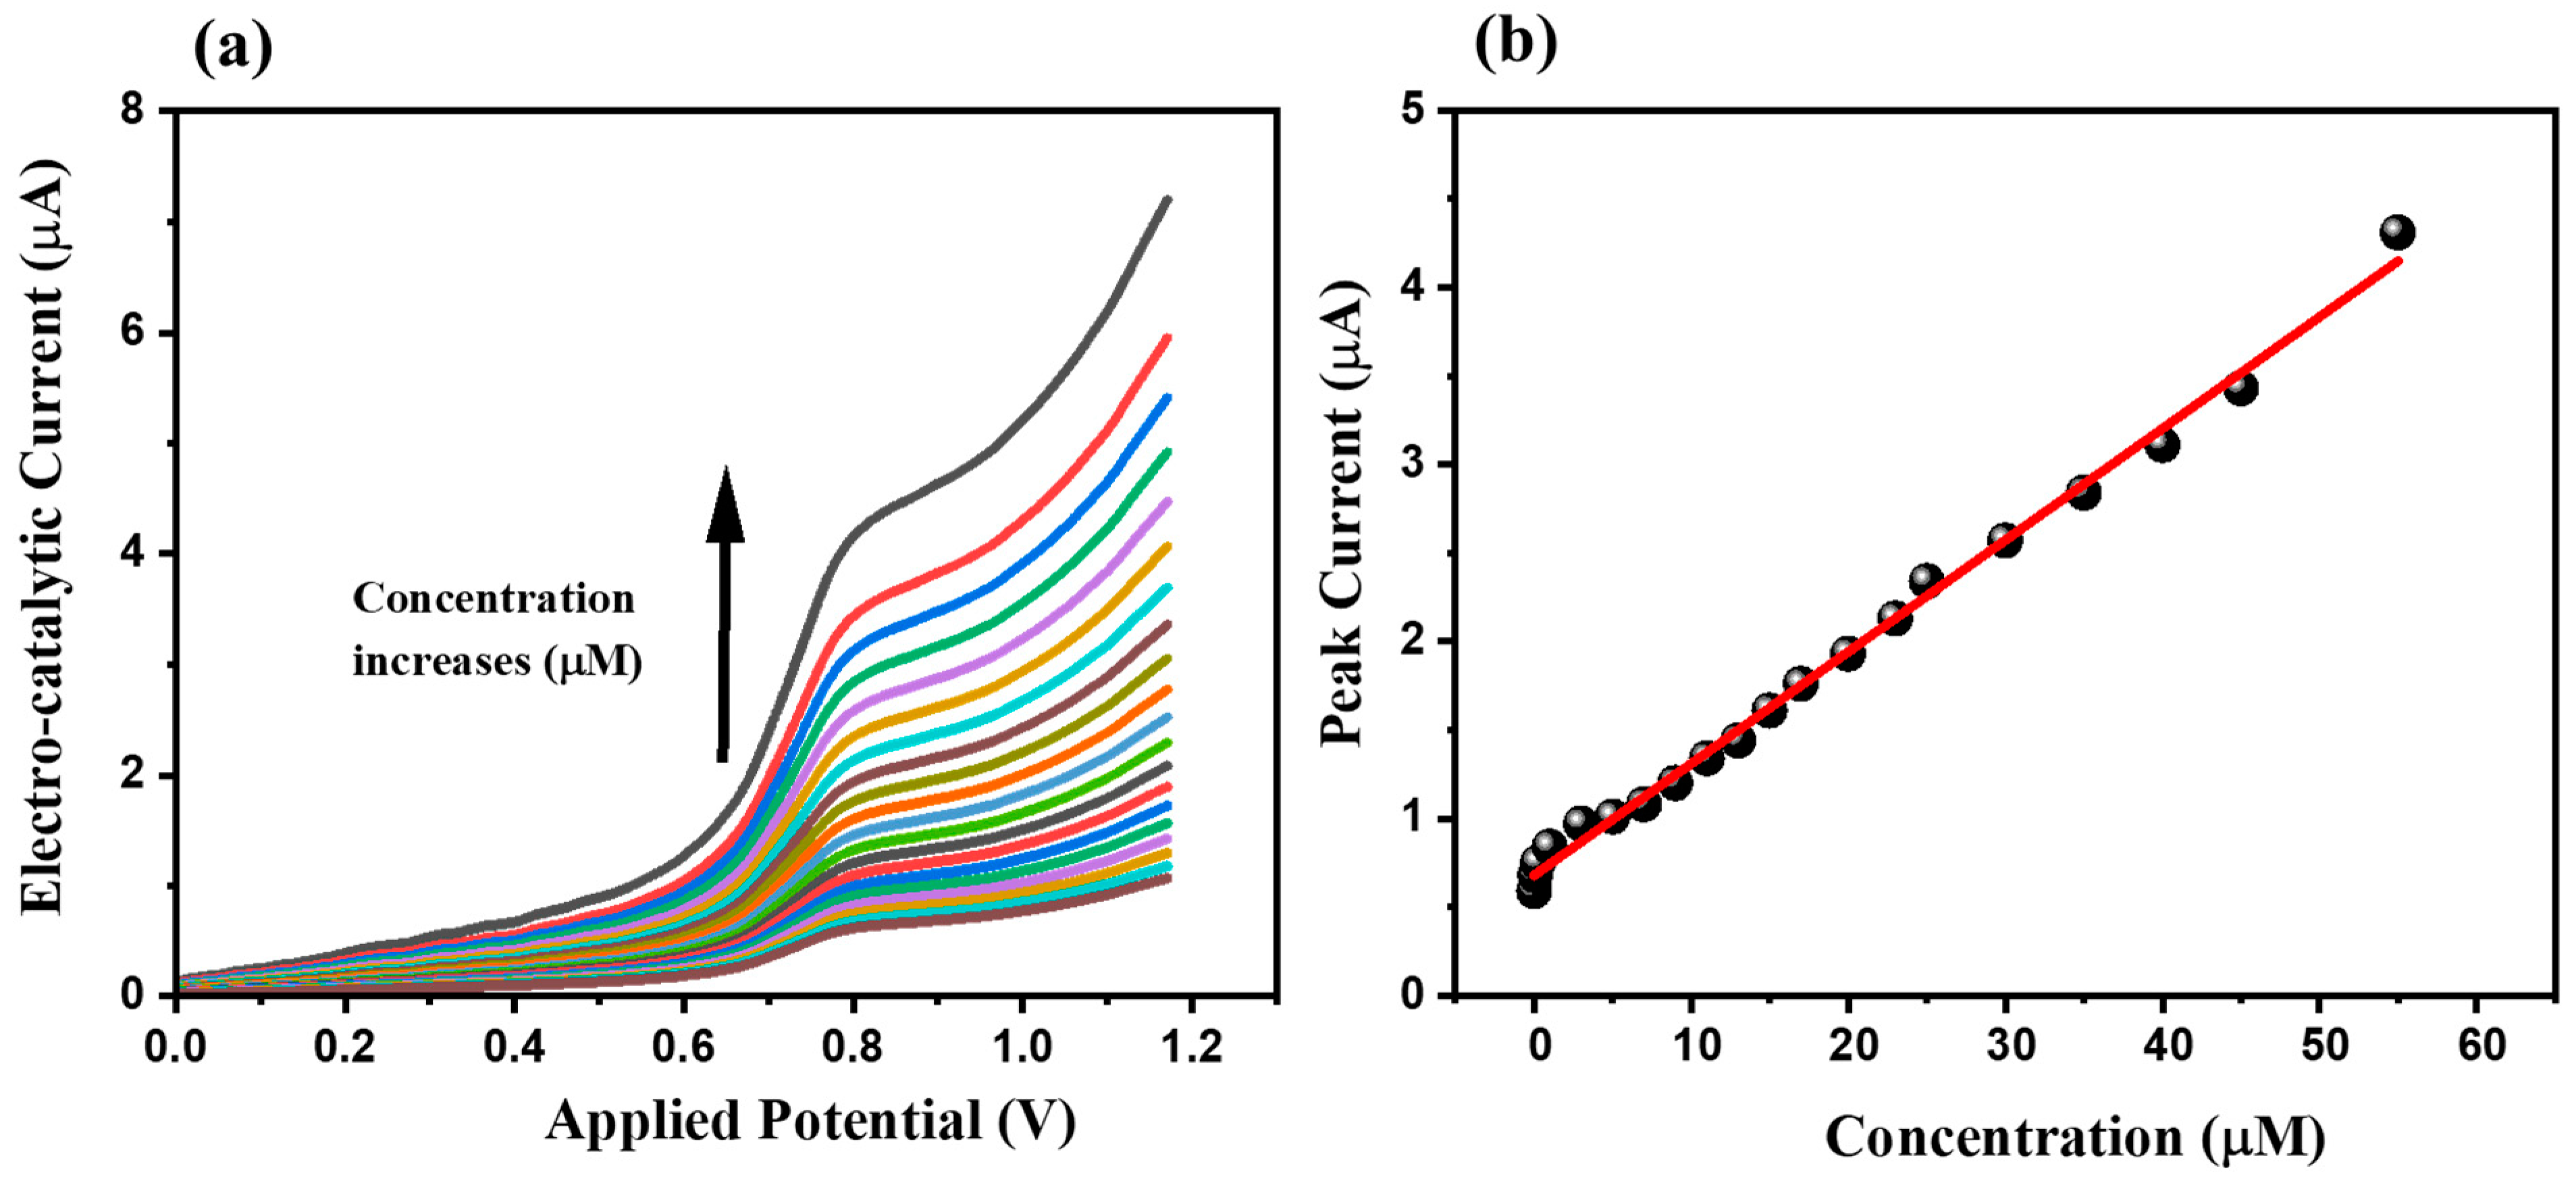
In further experiments, various concentrations of Hz have been utilized to investigate the electrochemical detection of Hz at low-level concentrations. In this regard, LSV patterns of the Ti3AlC2@SPCE were recorded in the presence of different concentrations (0.01 µM, 0.08 µM, 0.25 µM, 1 µM, 3 µM, 5 µM, 7 µM, 9 µM, 11 µM, 13 µM, 15 µM, 17 µM, 20 µM, 23 µM, 25 µM, 30 µM, 35 µM, 40 µM, 45 µM, and 55 µM) of Hz under the 0.1 M PBS conditions (pH = 8.0) at the applied scan potential of 50 mVs−1. The LSV patterns of the Ti3AlC2@SPCE in various concentrations of Hz are summarized in Figure 7a. It can be seen that the current response value of the Ti3AlC2@SPCE toward the electrochemical oxidation of Hz increases with concentration (0.01 µM, 0.08 µM, 0.25 µM, 1 µM, 3 µM, 5 µM, 7 µM, 9 µM, 11 µM, 13 µM, 15 µM, 17 µM, 20 µM, 23 µM, 25 µM, 30 µM, 35 µM, 40 µM, 45 µM, and 55 µM) of the Hz at the fixed applied potential scan rate. The linear calibration plot between the current response values of the Ti3AlC2@SPCE and the concentration of the Hz is shown in Figure 7b. The linear calibration curve shows the R2 value of 0.99, which suggests that the current response to the electrochemical oxidation of Hz linearly increases.
In the present world, various similar electro-active materials and compounds exist, which may affect the accurate detection of Hz. Therefore, a sensor should possess selectivity for a specific analyte. Since a three-electrode assembly operates in a liquid electrolyte system, the presence of other electro-active materials may impact the precise determination of Hz using Ti3AlC2@SPCE. In this context, we investigated the selectivity studies using the LSV method. The standard solutions of the electro-active materials were prepared in four batches (A= dopamine (DA), uric acid (UA), citric acid (CA), glucose, urea); B = (H2O2, ammonia, 4-chlorphenol, 4-nitrophenol, cholesterol), C= (Na+, Cl, Mg2+, Cd2+, Hg2+) and D = (catechol, methanol, acetone)). The LSV responses of the Ti3AlC2@SPCE were obtained in the presence of 0.25 µM Hz, 0.25 µM Hz + 1 µM interference A (DA, UA, CA, glucose, urea), 0.25 µM Hz + 1 µM interference B (H2O2, ammonia, 4-chlorophenol, 4-nitrophenol, cholesterol), 0.25 µM Hz + 1 µM interference C (Na+, Cl, Mg2+, Cd2+, Hg2+), and 0.25 µM Hz + 1 µM interference D (catechol, methanol, acetone) under the 0.1 M PBS conditions (pH = 8.0) at the applied scan potential of 50 mVs−1. Figure 8 shows that the presence of various interfering materials did not significantly affect the performance of the Ti3AlC2@SPCE and suggests its selective properties for the detection of Hz.
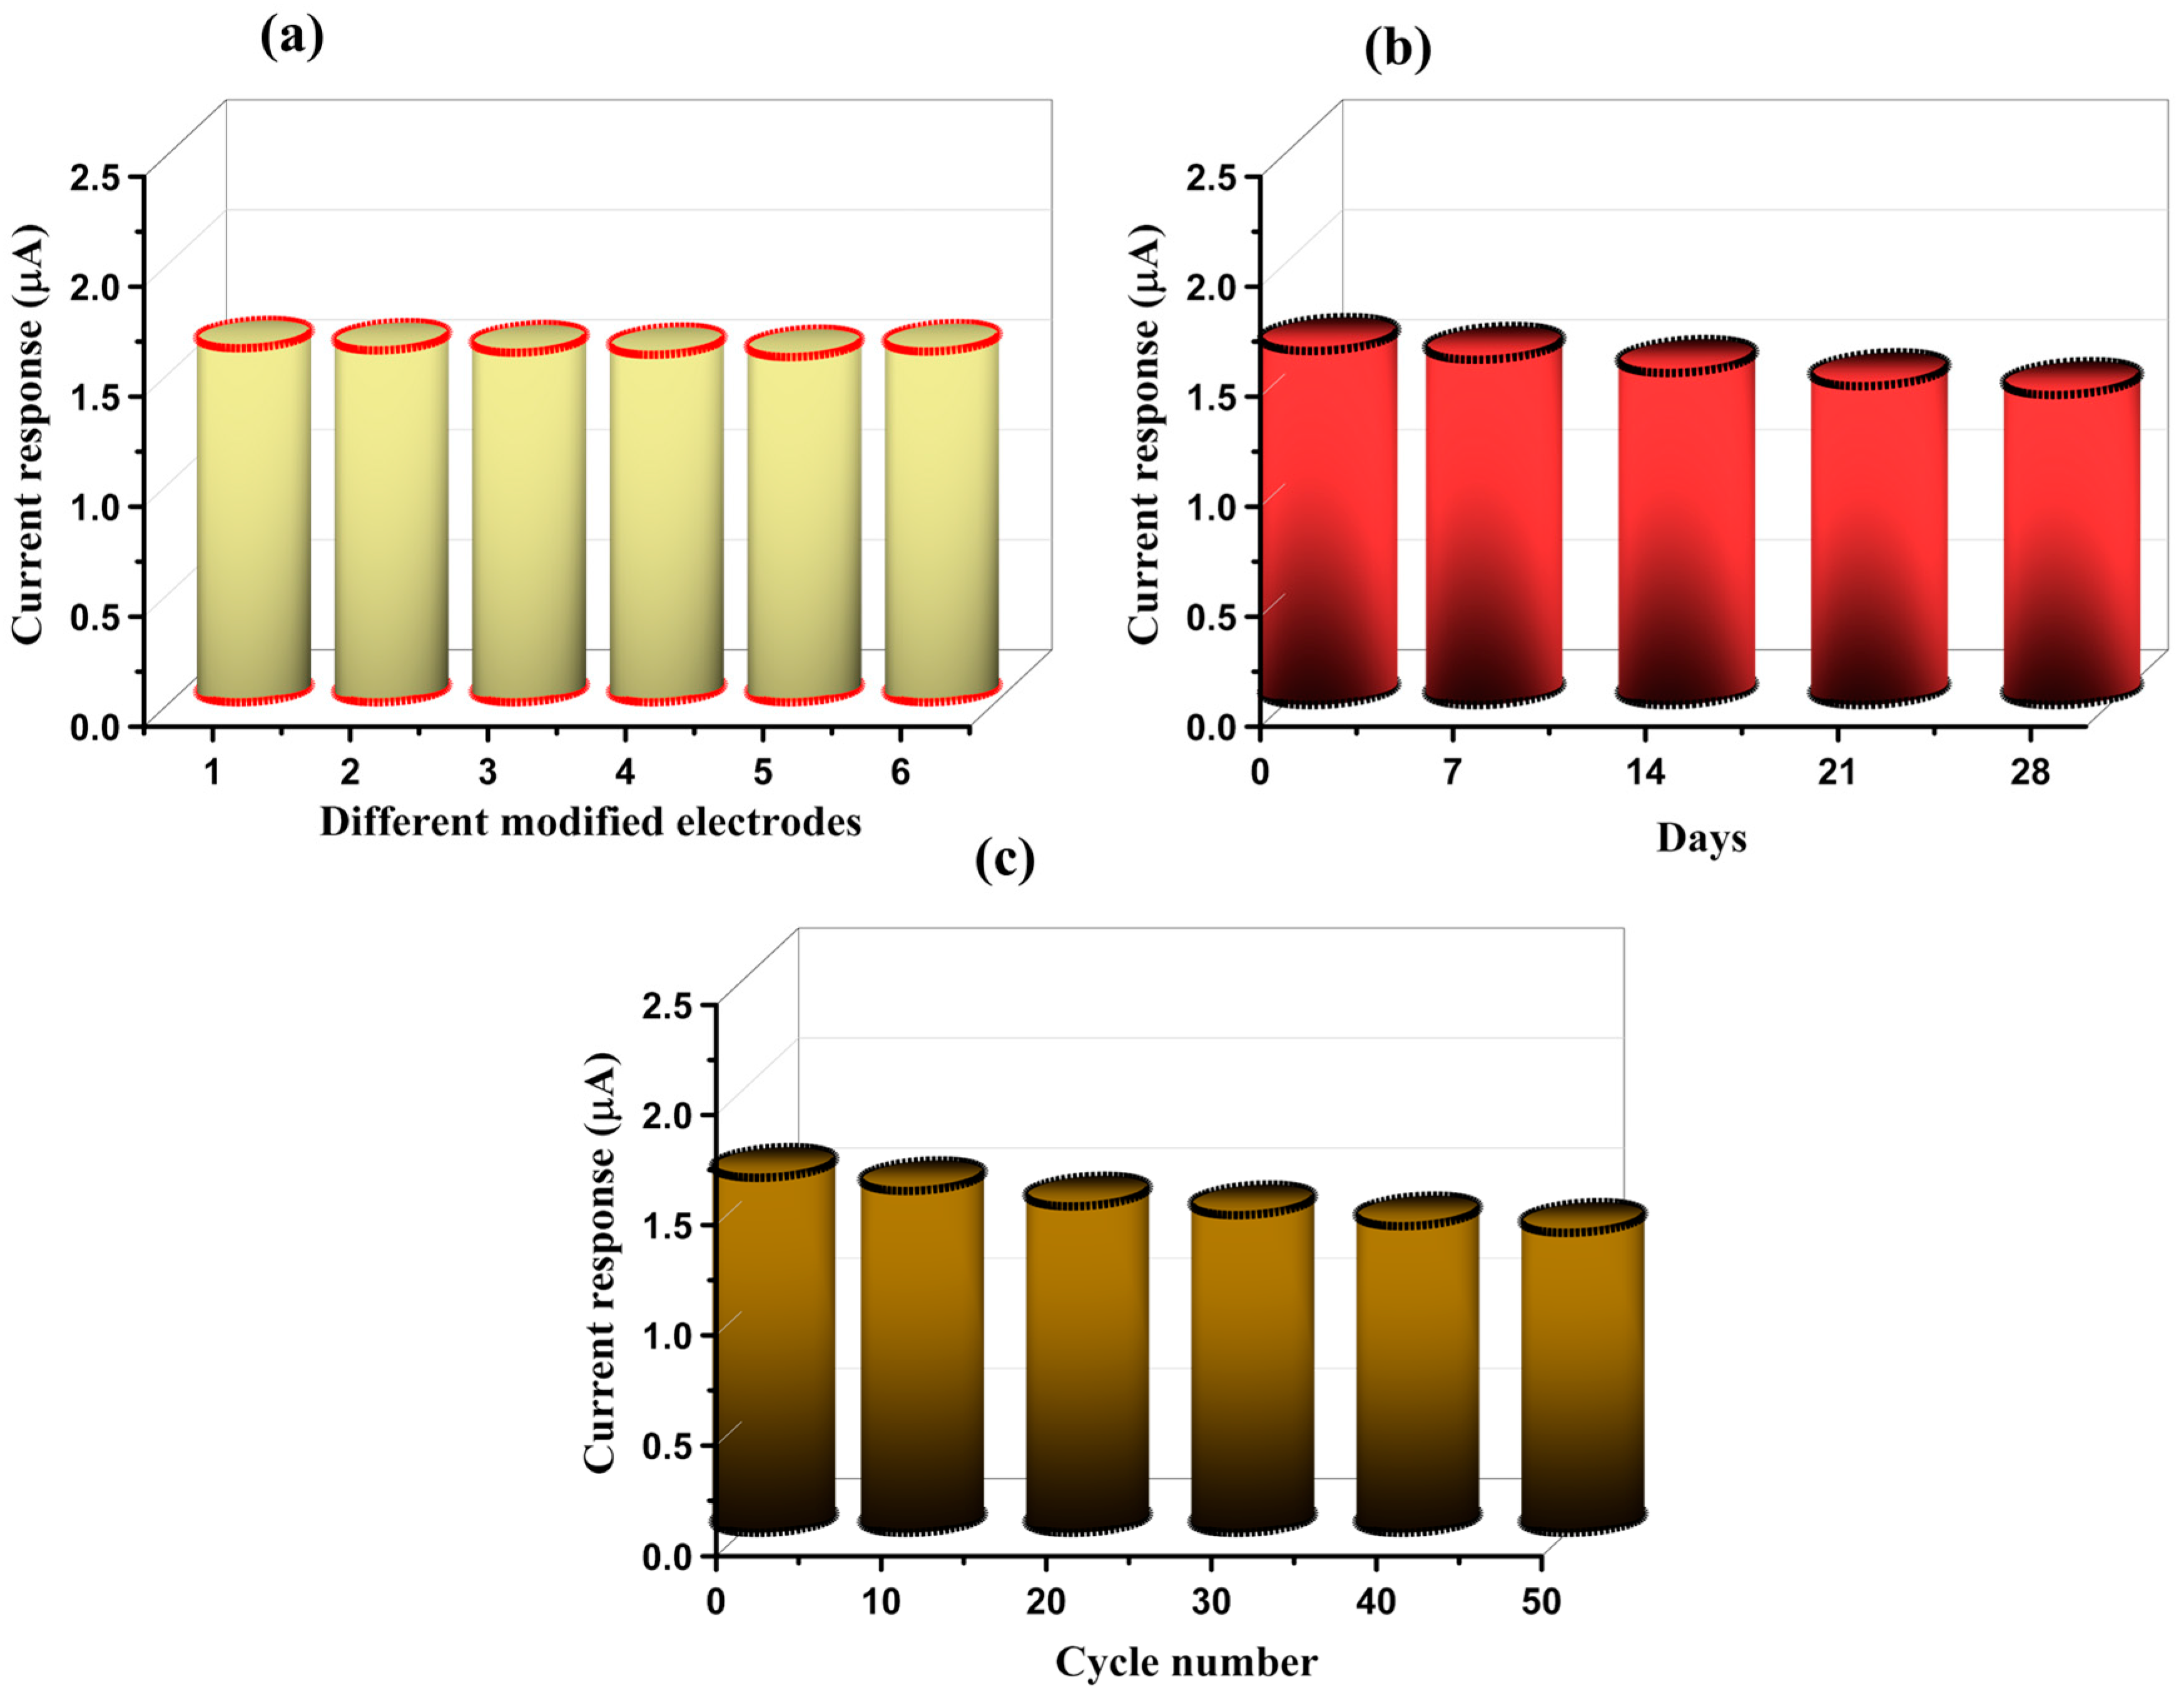
Reproducibility, repeatability, and storage stability are the most desirable features in electrochemical sensors. To evaluate these aspects, six different SPCEs were fabricated under similar environments and optimized conditions. Their performance was investigated for 0.25 µM Hz under the 0.1 M PBS conditions (pH = 8.0) at the applied scan potential rate of 50 mVs−1. It can be seen from Figure 9a that there is hardly a noticeable change observed, which suggests its good reproducibility. The Ti3AlC2@SPCE also showed good storage stability of 28 days as shown in Figure 9b. The repeatability study also investigated 0.25 µM Hz under the 0.1 M PBS conditions (pH = 8.0) at the applied scan potential rate of 50 mVs−1. Figure 9c demonstrates the presence of good repeatability for 50 cycles.
The probable electrochemical sensing mechanism for the oxidation of Hz is illustrated below.
(a) N2H4 + H2O → N2H3 + H3O+ + e (slow rate-determining step)
(b) N2H3 + 3H2O → N2 + 3H3O+ + 3e (fast-rate step)
(c) N2H4 + 4H2O → N2 + 4H3O+ + 4e (overall reaction)
The first step is a slow step, which may generate the N2H3 and H3O+ ions in the oxidation of Hz. The second step, which is the last step, may generate nitrogen. The overall reaction for the oxidation of Hz can be seen in Equation (3).
The detection limit, i.e., DL, of the Ti3AlC2@SPCE is determined by utilizing the formula as listed in Equation (4),
DL = 3.3 × σs/slope
In addition, the sensitivity of the Ti3AlC2@SPCE is calculated by employing the formula as listed in Equation (5),
Sensitivity = Slope value/Area of the e Ti3AlC2@SPCE
The DL of the Ti3AlC2@SPCE for the oxidation of Hz has been compiled in Table 1 with previous reports on the sensing of Hz. Previously, various chemically modified electrodes have been reported for detecting Hz. In this context, the ZrO2 NPs/Au electrode was reported as a Hz sensor by Bansal et al. [42] whereas a WO3-based Hz sensor was reported by Shukla et al. [27]. Cr2CTx MXene was also used as the electrocatalyst for the fabrication of the Hz sensor [44]. Previously, various nanostructured materials were explored as the electrocatalysts for the fabrication of Hz sensors as shown in Table 1. The reported articles in Table 1 demonstrated decent performance, but most of the Hz sensors suffer from poor stability over long-term cycles and poor conductivity of the metal oxides such as WO3. Some of the Hz sensors involve the use of high-cost Au electrodes, which is another challenge for the development of cost-effective Hz sensors. Thus, it is necessary to develop a low-cost and highly sensitive Hz sensor with improved stability and performance. In this study, we reported the construction of a Hz sensor using conductive Ti3AlC2 as a catalyst and disposable SPCE as a working electrode. The obtained results in our present study are reasonably good compared with the recent reports listed in Table 1 [22,27,30,31,36,42,44,52,54,55,56,57,58,59,60].

4. Conclusions

In conclusion, it can be summarized that Ti3AlC2@SPCE was modified using a simple drop-cast method. The phase purity and crystalline nature of the Ti3AlC2 MAX were determined using P-XRD analysis. The P-XRD study indicates the presence of good crystallinity and phase purity of the Ti3AlC2 MAX. Additionally, surface properties such as morphological characteristics of the Ti3AlC2 MAX were investigated using the SEM method. The SEM results suggested the presence of a sheet-like structure of the Ti3AlC2 MAX. Furthermore, elemental composition was confirmed by employing the EDAX technique. Finally, Ti3AlC2@SPCE was developed using Ti3AlC2 MAX as an electrocatalyst for the fabrication of the Hz sensor. The Ti3AlC2@SPCE demonstrated good detection limit, wide dynamic linear range, and sensitivity. The Ti3AlC2@SPCE also exhibited decent selectivity for the determination of Hz in the presence of various interfering molecules or salts. The Ti3AlC2@SPCE also exhibited good storage stability over 28 days. Furthermore, Ti3AlC2@SPCE demonstrated reasonable repeatability stability over 50 cycles. This work reports the simple fabrication of a cost-effective eco-friendly, and disposable Ti3AlC2@SPCE for the determination of Hz using the LSV method.

Supplementary Materials

The following supporting information can be downloaded at: https://www.mdpi.com/article/10.3390/mi15050633/s1.

Author Contributions

Conceptualization, K.A.; Methodology, W.R.; Validation, R.A.K.; Formal analysis, W.R.; Writing—original draft, K.A.; Writing—review & editing, K.A. and R.A.K.; Supervision, R.A.K. All authors have read and agreed to the published version of the manuscript.

Funding

Authors gratefully acknowledged Deputyship for Research and Innovation, ‘Ministry of Education’ in Saudi Arabia for funding this research (IFKSUOR3-465-2).

Data Availability Statement

Data can be available on reasonable request.

Acknowledgments

R.A.K. extend their appreciation to the Deputyship for Research and Innovation, ‘Ministry of Education’ in Saudi Arabia for funding this research (IFKSUOR3-465-2).

Conflicts of Interest

The authors declare no conflict of interest.

References

  1. Azad, U.P.; Ganesan, V. Determination of Hydrazine by PolyNi(II) Complex Modified Electrodes with a Wide Linear Calibration Range. Electrochim. Acta 2011, 56, 5766–5770. [Google Scholar] [CrossRef]
  2. Zelnick, S.D.; Mattie, D.R.; Stepaniak, P.C. Occupational Exposure to Hydrazines: Treatment of Acute Central Nervous System Toxicity. Aviat. Space Environ. Med. 2003, 74, 1285–1291. [Google Scholar]
  3. Casella, I.G.; Guascito, M.R.; Salvi, A.M.; Desimoni, E. Catalytic Oxidation and Flow Detection of Hydrazine Compounds at a Nafion/Ruthenium(III) Chemically Modified Electrode. Anal. Chim. Acta 1997, 354, 333–341. [Google Scholar] [CrossRef]
  4. Yamazaki, S.I.; Ioroi, T.; Tanimoto, K.; Yasuda, K.; Asazawa, K.; Yamaguchi, S.; Tanaka, H. Electrochemical Oxidation of Hydrazine Derivatives by Carbon-Supported Metalloporphyrins. J. Power Sources 2012, 204, 79–84. [Google Scholar] [CrossRef]
  5. Li, Z.; Cao, Z.; Grande, C.; Zhang, W.; Dou, Y.; Li, X.; Fu, J.; Shezad, N.; Akhtar, F.; Kaiser, A. A Phase Conversion Method to Anchor ZIF-8 onto a PAN Nanofiber Surface for CO2 capture. RSC Adv. 2021, 12, 664–670. [Google Scholar] [CrossRef]
  6. Serov, A.; Kwak, C. Direct Hydrazine Fuel Cells: A Review. Appl. Catal. B Environ. 2010, 98, 1–9. [Google Scholar] [CrossRef]
  7. Ismail, A.A.; Harraz, F.A.; Faisal, M.; El-Toni, A.M.; Al-Hajry, A.; Al-Assiri, M.S. A Sensitive and Selective Amperometric Hydrazine Sensor Based on Mesoporous Au/ZnO Nanocomposites. Mater. Des. 2016, 109, 530–538. [Google Scholar] [CrossRef]
  8. Kimball, R.F. The Mutagenicity of Hydrazine and Some of Its Derivatives. Mutat. Res. Genet. Toxicol. 1977, 39, 111–126. [Google Scholar] [CrossRef]
  9. Rahman, M.M.; Balkhoyor, H.B.; Asiri, A.M. Ultrasensitive and Selective Hydrazine Sensor Development Based on Sn/ZnO Nanoparticles. RSC Adv. 2016, 6, 29342–29352. [Google Scholar] [CrossRef]
  10. Ahmad, R.; Tripathy, N.; Ahn, M.S.; Hahn, Y.B. Highly Stable Hydrazine Chemical Sensor Based on Vertically-Aligned ZnO Nanorods Grown on Electrode. J. Colloid Interface Sci. 2017, 494, 153–158. [Google Scholar] [CrossRef]
  11. VERNOT, E. Long-Term Inhalation Toxicity of Hydrazine*1. Fundam. Appl. Toxicol. 1985, 5, 1050–1064. [Google Scholar] [CrossRef] [PubMed]
  12. Rahman, M.M.; Ahmed, J.; Asiri, A.M.; Siddiquey, I.A.; Hasnat, M.A. Development of Highly-Sensitive Hydrazine Sensor Based on Facile CoS2-CNT Nanocomposites. RSC Adv. 2016, 6, 90470–90479. [Google Scholar] [CrossRef]
  13. Zhang, J.; Gao, W.; Dou, M.; Wang, F.; Liu, J.; Li, Z.; Ji, J. Nanorod-Constructed Porous Co3O4 Nanowires: Highly Sensitive Sensors for the Detection of Hydrazine. Analyst 2015, 140, 1686–1692. [Google Scholar] [CrossRef] [PubMed]
  14. Gholivand, M.B.; Azadbakht, A. A Novel Hydrazine Electrochemical Sensor Based on a Zirconium Hexacyanoferrate Film-Bimetallic Au-Pt Inorganic-Organic Hybrid Nanocomposite onto Glassy Carbon-Modified Electrode. Electrochim. Acta 2011, 56, 10044–10054. [Google Scholar] [CrossRef]
  15. Zhao, S.; Wang, L.; Wang, T.; Han, Q.; Xu, S. A High-Performance Hydrazine Electrochemical Sensor Based on Gold Nanoparticles/Single-Walled Carbon Nanohorns Composite Film. Appl. Surf. Sci. 2016, 369, 36–42. [Google Scholar] [CrossRef]
  16. Harraz, F.A.; Ismail, A.A.; Al-Sayari, S.A.; Al-Hajry, A.; Al-Assiri, M.S. Highly Sensitive Amperometric Hydrazine Sensor Based on Novel α-Fe2O3/Crosslinked Polyaniline Nanocomposite Modified Glassy Carbon Electrode. Sens. Actuators B Chem. 2016, 234, 573–582. [Google Scholar] [CrossRef]
  17. Ahmad, K.; Khan, M.Q.; Alsalme, A.; Kim, H. Sulfur-Doped Graphitic-Carbon Nitride (S@g-C3N4) as Bi-Functional Catalysts for Hydrazine Sensing and Hydrogen Production Applications. Synth. Met. 2022, 288, 117100. [Google Scholar] [CrossRef]
  18. Sajid, M. MXenes: Are They Emerging Materials for Analytical Chemistry Applications?—A Review. Anal. Chim. Acta 2021, 1143, 267–280. [Google Scholar] [CrossRef]
  19. Raza, W.; Ahmad, K. Room Temperature Gas Sensor Based on Reduce Graphene Oxide for Environmental Monitoring. In Handbook of Nanomaterials and Nanocomposites for Energy and Environmental Applications; Springer International Publishing: Berlin/Heidelberg, Germany, 2020; pp. 1–19. [Google Scholar]
  20. Mohammad, A.; Khan, M.E.; Cho, M.H. Sulfur-Doped-Graphitic-Carbon Nitride (S-g-C3N4) for Low Cost Electrochemical Sensing of Hydrazine. J. Alloys Compd. 2020, 816, 152522. [Google Scholar] [CrossRef]
  21. Mohammad, A.; Ahmad, K.; Qureshi, A.; Tauqeer, M.; Mobin, S.M. Zinc Oxide-Graphitic Carbon Nitride Nanohybrid as an Efficient Electrochemical Sensor and Photocatalyst. Sens. Actuators B Chem. 2018, 277, 467–476. [Google Scholar] [CrossRef]
  22. Wang, Y.; Yang, X.; Bai, J.; Jiang, X.; Fan, G. High sensitivity hydrogen peroxideand hydrazine sensor based on silver nanocubes with rich {1 0 0} facets as anenhanced electrochemical sensing platform. Biosens. Bioelectron. 2013, 43, 180–185. [Google Scholar] [CrossRef]
  23. Rahman, M.M.; Alam, M.M.; Asiri, A.M. Selective Hydrazine Sensor Fabrication with Facile Low-Dimensional Fe2O3/CeO2 Nanocubes. New J. Chem. 2018, 42, 10263–10270. [Google Scholar] [CrossRef]
  24. Mohammad, A.; Khan, M.E.; Yoon, T.; Hwan Cho, M. Na,O-Co-Doped-Graphitic-Carbon Nitride (Na,O-g-C3N4) for Nonenzymatic Electrochemical Sensing of Hydrogen Peroxide. Appl. Surf. Sci. 2020, 525, 146353. [Google Scholar] [CrossRef]
  25. Mohammad, A.; Khan, M.E.; Karim, M.R.; Cho, M.H.; Yoon, T. Ag-Modified SnO2-Graphitic-Carbon Nitride Nanostructures for Electrochemical Sensor Applications. Ceram. Int. 2021, 47, 23578–23589. [Google Scholar] [CrossRef]
  26. Gowthaman, N.S.K.; Ngee Lim, H.; Balakumar, V.; Shankar, S. Ultrasonic Synthesis of CeO2@organic Dye Nanohybrid: Environmentally Benign Rabid Electrochemical Sensing Platform for Carcinogenic Pollutant in Water Samples. Ultrason. Sonochem. 2020, 61, 104828. [Google Scholar] [CrossRef]
  27. Shukla, S.; Chaudhary, S.; Umar, A.; Chaudhary, G.R.; Mehta, S.K. Tungsten Oxide (WO3) Nanoparticles as Scaffold for the Fabrication of Hydrazine Chemical Sensor. Sens. Actuators B Chem. 2014, 196, 231–237. [Google Scholar] [CrossRef]
  28. Kim, S.P.; Choi, H.C. Reusable Hydrazine Amperometric Sensor Based on Nafion®-Coated TiO2-Carbon Nanotube Modified Electrode. Sens. Actuators B Chem. 2015, 207, 424–429. [Google Scholar] [CrossRef]
  29. Ahmad, R.; Tripathy, N.; Jung, D.U.J.; Hahn, Y.B. Highly Sensitive Hydrazine Chemical Sensor Based on ZnO Nanorods Field-Effect Transistor. Chem. Commun. 2014, 50, 1890–1893. [Google Scholar] [CrossRef]
  30. Alahmadi, N.; Alhasan, H.S.; Gomaa, H.; Abdelwahab, A.A.; Emran, M.Y. Electrochemical sensor design based on CuO nanosheets/ Cellulose derivative nanocomposite for hydrazine monitoring in environmental samples. Microchem. J. 2022, 183, 107909. [Google Scholar] [CrossRef]
  31. Ali, A.M.; Qreshah, O.; Ismail, A.A.; Harraz, F.A.; Algarni, H.; Assiri, M.A.; Faisal, M.; Chiu, W.S. Morphological and Optical Properties of SnO2 Doped ZnO Nanocomposites for Electrochemical Sensing of Hydrazine. Int. J. Electrochem. Sci. 2019, 14, 1461–1478. [Google Scholar] [CrossRef]
  32. Raza, W.; Ahmad, K. A Highly Selective Fe@ZnO Modified Disposable Screen Printed Electrode Based Non-Enzymatic Glucose Sensor (SPE/Fe@ZnO). Mater. Lett. 2018, 212, 231–234. [Google Scholar] [CrossRef]
  33. Ahmad, K.; Raza, W.; Alsulmi, A.; Kim, H. Fabrication of Electrochemical Sensor for Metronidazole Using MoS2/Graphite-like Carbon Nitride Composite Modified Glassy Carbon Electrode. Diam. Relat. Mater. 2023, 138, 110178. [Google Scholar] [CrossRef]
  34. Kalambate, P.K.; Gadhari, N.S.; Li, X.; Rao, Z.; Navale, S.T.; Shen, Y.; Patil, V.R.; Huang, Y. Recent Advances in MXene–Based Electrochemical Sensors and Biosensors. TrAC Trends Anal. Chem. 2019, 120, 115643. [Google Scholar] [CrossRef]
  35. Huang, H.; Jiang, R.; Feng, Y.; Ouyang, H.; Zhou, N.; Zhang, X.; Wei, Y. Recent Development and Prospects of Surface Modification and Biomedical Applications of MXenes. Nanoscale 2020, 12, 1325–1338. [Google Scholar] [CrossRef]
  36. Wang, M.-F.; Li, W.; Hu, P.-J.; He, S.-S.; Yang, H.-M.; Li, X.-Z. A Facile Hydrazine Amperometric Sensor Based on a Glassy Carbon Electrode Modified with Au Nanoparticles-MnO2 Composites. Int. J. Electrochem. Sci. 2016, 11, 1928–1937. [Google Scholar] [CrossRef]
  37. Naguib, M.; Kurtoglu, M.; Presser, V.; Lu, J.; Niu, J.; Heon, M.; Hultman, L.; Gogotsi, Y.; Barsoum, M.W. Two-Dimensional Nanocrystals Produced by Exfoliation of Ti3AlC2. Adv. Mater. 2011, 23, 4248–4253. [Google Scholar] [CrossRef]
  38. Wu, X.; Ma, P.; Sun, Y.; Du, F.; Song, D.; Xu, G. Application of MXene in Electrochemical Sensors: A Review. Electroanalysis 2021, 33, 1827–1851. [Google Scholar] [CrossRef]
  39. Yang, M.; Lu, H.; Liu, S. Recent Advances of MXene-Based Electrochemical Immunosensors. Appl. Sci. 2022, 12, 5630. [Google Scholar] [CrossRef]
  40. Tran, V.A.; Tran, N.T.; Doan, V.D.; Nguyen, T.Q.; Thi, H.H.P.; Vo, G.N.L. Application Prospects of MXenes Materials Modifications for Sensors. Micromachines 2023, 14, 247. [Google Scholar] [CrossRef] [PubMed]
  41. Fan, Y.; Li, L.; Zhang, Y.; Zhang, X.; Geng, D.; Hu, W. Recent Advances in Growth of Transition Metal Carbides and Nitrides (MXenes) Crystals. Adv. Funct. Mater. 2022, 32, 2111357. [Google Scholar] [CrossRef]
  42. Bansal, P.; Bhanjana, G.; Prabhakar, N.; Dhau, J.S.; Chaudhary, G.R. Electrochemical sensor based on ZrO2 NPs/Au electrode sensing layer for monitoring hydrazine and catechol in real water samples. J. Mol. Liq. 2017, 248, 651–657. [Google Scholar] [CrossRef]
  43. Kumar, J.A.; Prakash, P.; Krithiga, T.; Amarnath, D.J.; Premkumar, J.; Rajamohan, N.; Vasseghian, Y.; Saravanan, P.; Rajasimman, M. Methods of Synthesis, Characteristics, and Environmental Applications of MXene: A Comprehensive Review. Chemosphere 2022, 286, 131607. [Google Scholar] [CrossRef] [PubMed]
  44. Soundiraraju, B.; Anthony, A.M.; Pandurangan, P.; Kattikkanal George, B. Electrochemical behavior of chromium carbide MXene modified electrodes: Hydrazine sensing. Mater. Today Commun. 2022, 32, 103982. [Google Scholar] [CrossRef]
  45. Alhabeb, M.; Maleski, K.; Anasori, B.; Lelyukh, P.; Clark, L.; Sin, S.; Gogotsi, Y. Guidelines for Synthesis and Processing of Two-Dimensional Titanium Carbide (Ti3C2Tx MXene. Chem. Mater. 2017, 29, 7633–7644. [Google Scholar] [CrossRef]
  46. Ares, P.; Novoselov, K.S. Recent Advances in Graphene and Other 2D Materials. Nano Mater. Sci. 2022, 4, 3–9. [Google Scholar] [CrossRef]
  47. Eom, W.; Shin, H.; Ambade, R.B.; Lee, S.H.; Lee, K.H.; Kang, D.J.; Han, T.H. Large-Scale Wet-Spinning of Highly Electroconductive MXene Fibers. Nat. Commun. 2020, 11, 1–7. [Google Scholar] [CrossRef] [PubMed]
  48. Lukatskaya, M.R.; Mashtalir, O.; Ren, C.E.; Dall’Agnese, Y.; Rozier, P.; Taberna, P.L.; Naguib, M.; Simon, P.; Barsoum, M.W.; Gogotsi, Y. Cation Intercalation and High Volumetric Capacitance of Two-Dimensional Titanium Carbide. Science 2013, 341, 1502–1505. [Google Scholar] [CrossRef] [PubMed]
  49. Rhouati, A.; Berkani, M.; Vasseghian, Y.; Golzadeh, N. MXene-Based Electrochemical Sensors for Detection of Environmental Pollutants: A Comprehensive Review. Chemosphere 2022, 291, 132921. [Google Scholar] [CrossRef] [PubMed]
  50. Osuagwu, B.; Raza, W.; Tesler, A.B.; Schmuki, P. Facile Approach of Direct Sulfidation of FTO to Form Vertically Aligned SnS2Nanoflake Photoanodes for Efficient Photoelectrochemical Water Splitting. ACS Appl. Energy Mater. 2021, 4, 8395–8400. [Google Scholar] [CrossRef]
  51. Raza, W.; Ahmad, K.; Khan, R.A.; Kim, H. Ag Decorated ZnO for Enhanced Photocatalytic H2 Generation and Pollutant Degradation. Int. J. Hydrogen Energy 2023, 48, 29071–29081. [Google Scholar] [CrossRef]
  52. Ni, Y.; Zhu, J.; Zhang, L.; Hong, J. Hierarchical ZnO micro/nanoarchitectures: Hydrothermal preparation, characterization and application in the detection of hydrazine. CrystEngComm 2010, 12, 2213–2218. [Google Scholar] [CrossRef]
  53. Tian, Z.; Tian, H.; Cao, K.; Bai, S.; Peng, Q.; Wang, Y.; Zhu, Q. Facile preparation of Ti3C2Tx sheets by selectively etching in a H2SO4/H2O2 mixture. Front. Chem. 2022, 10, 19. [Google Scholar] [CrossRef] [PubMed]
  54. Gowthaman, N.S.K.; Mohapatra, D.; Arul, P.; Chang, W.S. Ultrasonic-assisted decoration of AuNPs on carbon nano-onions as robust electrochemical scaffold for sensing of carcinogenic hydrazine in industrial effluents. J. Ind. Eng. Chem. 2023, 117, 227–237. [Google Scholar] [CrossRef]
  55. Gharani, M.; Bahari, A.; Ghasemi, S. Preparation of MoS2-reduced graphene oxide/Au nanohybrid for electrochemical sensing of hydrazine. J. Mater. Sci. Mater. Electron. 2021, 32, 7765–7777. [Google Scholar] [CrossRef]
  56. Tajik, S.; Beitollahi, H.; Hosseinzadeh, R.; Afshar, A.A.; Varma, R.S.; Jang, H.W.; Shokouhimehr, M. Electrochemical Detection of Hydrazine by Carbon Paste Electrode Modified with Ferrocene Derivatives, Ionic Liquid, and CoS2-Carbon Nanotube Nanocomposite. ACS Omega 2021, 6, 4641–4648. [Google Scholar] [CrossRef] [PubMed]
  57. Lotfi, N.; Majidi, M.R.; Asadpour-Zeynali, K. Synthesis of MoS2-QDs@Fe3O4 nanocomposites decorated on reduced-graphene-oxide: Application in sensitive electrocatalytic determination of hydrazine. Synth. Met. 2023, 296, 117361. [Google Scholar] [CrossRef]
  58. Rana, D.S.; Kalia, S.; Thakur, N.; Singh, R.K.; Kumar, R.; Singh, D. Synthesis of reduced graphene oxide-molybdenum disulfide nanocomposite as potential scaffold for fabrication of efficient hydrazine sensor. Mater. Chem. Phys. 2023, 294, 127048. [Google Scholar] [CrossRef]
  59. Ganesha, H.; Veeresh, S.; Nagaraju, Y.S.; Devendrappa, H. A CTAB-assisted PANI-MoS2 nanosheet flower morphology for the highly sensitive electrochemical detection of hydrazine. RSC Adv. 2023, 13, 34891–34903. [Google Scholar]
  60. Saeb, E.; Asadpour-Zeynali, K. Facile synthesis of TiO2@PANI@Au nanocomposite as an electrochemical sensor for determination of hydrazine. Microchem. J. 2021, 160, 105603. [Google Scholar] [CrossRef]
Scheme 1. The schematic representation for the construction of Ti3AlC2@SPCE for hydrazine detection.
Micromachines 15 00633 sch001
Figure 1. P-XRD spectrum of the Ti3AlC2 MAX.
Micromachines 15 00633 g001
Figure 2. (a,b) FE-SEM images of the Ti3AlC2 MAX.
Micromachines 15 00633 g002
Figure 3. (a) EDX spectrum of the Ti3AlC2 MAX. (b) Ti2p and (c) Al2p XPS scan of Ti3AlC2 MAX.
Micromachines 15 00633 g003
Figure 4. CVs of the bare SPCE (black line curve) and Ti3AlC2@SPCE (red line curve) in the presence of 55 µM Hz under the 0.1 M PBS conditions (pH = 8.0) at the applied scan potential rate of 50 mVs−1.
Micromachines 15 00633 g004
Figure 5. (a) CVs of the Ti3AlC2@SPCE in the presence of 55 µM Hz under the 0.1 M PBS conditions (pH = 8.0) at different applied scan potential rates (50 mVs−1, 100 mVs−1, 150 mVs−1, 200 mVs−1, 250 mVs−1, 300 mVs−1, 350 mVs−1, 400 mVs−1, 450 mVs−1, and 500 mVs−1). (b) Calibration curve of the oxidation peak current values against the applied scan rate. (c) The calibration curve between the oxidation peak current values with respect to the square root of the applied scan rate.
Micromachines 15 00633 g005
Figure 6. LSVs of the bare SPCE (black line curve) and Ti3AlC2@SPCE (red line curve) in the presence of 55 µM Hz under the 0.1 M PBS conditions (pH = 8.0) at the applied scan potential of 50 mVs−1.
Micromachines 15 00633 g006
Figure 7. (a) LSV graphs of the Ti3AlC2@SPCE in the presence of different concentrations (0.01 µM, 0.08 µM, 0.25 µM, 1 µM, 3 µM, 5 µM, 7 µM, 9 µM, 11 µM, 13 µM, 15 µM, 17 µM, 20 µM, 23 µM, 25 µM, 30 µM, 35 µM, 40 µM, 45 µM, and 55 µM) of Hz under the 0.1 M PBS conditions (pH = 8.0) at the applied scan potential of 50 mVs−1. (b) The calibration plot shows the linear relation between the oxidation peak current response and the concentration of Hz.
Micromachines 15 00633 g007
Figure 8. LSVs of the Ti3AlC2@SPCE in the presence of 0.25 µM Hz, 0.25 µM Hz + 1 µM interference A (DA, UA, CA, glucose, urea), 0.25 µM Hz + 1 µM interference B (H2O2, ammonia, 4-chlorophenol, 4-nitrophenol, cholesterol), 0.25 µM Hz + 1 µM interference C (Na+, Cl, Mg2+, Cd2+, Hg2+), and 0.25 µM Hz + 1 µM interference D (catechol, methanol, acetone) under the 0.1 M PBS conditions (pH = 8.0) at the applied scan potential of 50 mVs−1.
Micromachines 15 00633 g008
Figure 9. (a) Reproducibility study, (b) storage stability study, and (c) repeatability study for Ti3AlC2@SPCE in the presence of 0.25 µM Hz under the 0.1 M PBS conditions (pH = 8.0) at the applied scan potential rate of 50 mVs−1.
Micromachines 15 00633 g009
Table 1. Comparison of the LOD, linear range, and sensitivity of the Ti3AlC2@SPCE with previous studies.
ElectrodeDL (µM)Linear Range (µM)Sensitivity (µA/µM.cm2)References
Ti3AlC2@SPCE0.011–506.76This study
ZrO2 NPs/Au electrode1.05-8.99[42]
WO3144--[27]
Cr2CTx MXene0.661.99–2001.81[44]
ZnO2.1--[52]
Erbium-doped Nb2CTx67--[44]
PVP-AgNCs/GCE1.1--[22]
CuO nanosheets (CuO NSs)/Cellulose acetate butyrate (CAB)0.15--[30]
SnO2/ZnO0.362.5–251.16[31]
Au NPs/MnO2 Composites1.7--[36]
Au@ carbon nano-onions/GCE0.0120.05–1000-[54]
MoS2/rGO/Au0.52–30-[55]
Ionic liquid/CoS2-CNT/CP0.0150.03–5000.073[56]
MoS2-QDs@Fe3O4/rGO0.120.8–21900.035[57]
rGO-MoS20.132-89.89[58]
PANI-MoS20.4010–1007.23[59]
TiO2@PANI/GCE0.15--[60]
Disclaimer/Publisher’s Note: The statements, opinions and data contained in all publications are solely those of the individual author(s) and contributor(s) and not of MDPI and/or the editor(s). MDPI and/or the editor(s) disclaim responsibility for any injury to people or property resulting from any ideas, methods, instructions or products referred to in the content.